Multiple AGN activity during the BCG assembly of XDCPJ0044.0-2033 at z1.6
Abstract
Undisturbed galaxy clusters are characterized by a massive and large elliptical galaxy at their center, i.e. the Brightest Cluster Galaxy (BCG). How these central galaxies form is still debated. According to most models, a typical epoch for their assembly is z1-2. We have performed a detailed multi-wavelength analysis of the core of XDCP J0044.0-2033 (XDCP0044), one of the most massive and densest galaxy clusters currently known at redshift z1.6, whose central galaxy population shows high star formation compared to lower-z clusters and an X-ray AGN located close to its center. SINFONI J-, H- and KMOS YJ-, H- bands spectroscopic data have been analyzed, together with deep archival HST photometric data in F105W, F140W, and F160W bands, Chandra X-ray, radio JVLA data at 1-2 GHz, and ALMA band-6 observations. In the very central region of the cluster (70 kpc 70 kpc), two systems of interacting galaxies have been identified and studied (Complex A and B), with a total of seven confirmed cluster members. These galaxies show perturbed morphologies and three of them show signs of AGN activity. In particular, two type-1 AGN with typical broad lines have been found at the center of each complex (both of them X-ray obscured and highly accreting with ), while a type-2 AGN has been discovered in Complex A. The AGN at the center of Complex B is also detected in X-ray while the other two are spatially related to radio emission. The three AGN provide one of the closest AGN triple at z1 revealed so far with a minimum (maximum) projected distance of 10 (40) kpc. The observation of high star formation, merger signatures and nuclear activity in the core of XDCP0044 suggests that all these processes are key ingredients in shaping the nascent BCG. According to our data, XDCP0044 could form a typical massive galaxy of , hosting a Black Hole (BH) of , in a time scale of the order of 2.5 Gyrs.
keywords:
galaxies: clusters: individual: XDCP J0044.0-2033 – galaxies: active – galaxies: elliptical and lenticular, cD – galaxies: evolution – galaxies: formation – galaxies: interactions1 Introduction
Brightest cluster galaxies (BCGs) are the most massive () and luminous () galaxies and reside at the center of relaxed, virialized and undisturbed galaxy clusters in the local Universe (Sandage et al. 1976; Lin et al. 2010). BCGs are usually located at the minimum of the cluster potential well, close to the peak of the X-ray emission (Jones & Forman, 1984). At low redshift, they appear like red, quiescent, massive and large (Carter, 1977; Bernardi et al., 2007, up to 100 kpc) elliptical galaxies (Dubinski, 1998) and they often show radio nuclear activity and jet emissions, able to affect the gas in the Intra Cluster Medium (ICM, Best et al., 2007; Hogan et al., 2015; Moravec et al., 2020). On the contrary, most observations of galaxy cluster cores at z>1 do not show the presence of a single BCG but are instead characterized by star-forming galaxies (SFGs) with disturbed morphology (Zhao et al., 2017). Moreover, although in some cases galaxies exhibiting early type morphology are also found in z1.4 cluster cores (Strazzullo et al., 2013; Cooke et al., 2016), evidence is reported by several authors for an increase of the SFGs fraction in these distant environments (Bai et al., 2007, 2009; Krick et al., 2009). Specifically, in high-z systems, a reversal star formation (SF) - density relation has been observed, i.e. while at the number of SFGs increases towards the cluster outskirts, at the SFGs fraction is higher in the cluster cores (Brodwin et al., 2013; Santos et al., 2015). To date, the process responsible for the transition between the unquenched and quenched eras in such environments is still not clear and its understanding is fundamental not only for explaining the formation of local BCGs but also for both cluster and galaxy evolution theory (Lin & Mohr, 2004; Rudick et al., 2011; Contini et al., 2014).
Because the BCGs are located in privileged places in the cluster cores, these are expected to experience SF processes, AGN feedback and multiple mergers. According to many cosmological simulations and semi-analytic models (e.g. Springel et al., 2005; Croton, 2006; De Lucia & Blaizot, 2007; Cooke et al., 2016; Lee-Brown et al., 2017; Ragone-Figueroa et al., 2018; Pillepich et al., 2018) the BCG progenitors form most (50%) of their stars at z2.5. This mass is then assembled at z1-2 through mergers and, later (z<1), through multiple accretion of small galaxies, to form the final BCG (Stott, 2008; Lidman et al., 2013; Laporte et al., 2013). On the other hand, recent IR and sub-mm observations of molecular cold gas in galaxy clusters at 1z2, found a significant SFR (tens and hundreds ) in BCG (Webb et al., 2015; McDonald et al., 2016) and this is mainly attributed to wet major and minor mergers (Webb et al., 2017; Bonaventura et al., 2017). According to these works, z1-2 should be a crucial epoch during which we expect a high rate of merger activity among galaxies (the BCG progenitors) residing in the core of massive galaxy clusters. These mergers will eventually lead to deposit large reservoir of gas in cluster cores and induce dust-obscured starburst events (Cooke et al., 2019).
Most of the studies found indeed an enhancement of the merger activity in high-z galaxy clusters with respect to the low redshift systems and the field ones (Fassbender et al., 2011; Mancone et al., 2012; Lotz et al., 2013; Lidman et al., 2013; Mei et al., 2015). In particular, Alberts et al. (2016) found an excess of SF and merger activity in the cores of massive () galaxy clusters at z>1. Conversely, other works found the merger fraction in galaxy clusters (Andreon, 2013) and/or their cores (Delahaye et al., 2017) comparable to the field one. Interestingly, Alberts et al. (2016) also found an excess of AGN activity in such high-z systems, highlighting the key role of dense environments in triggering nuclear activity at this epoch and pointing towards a co-evolution between SF and Black Hole (BH) accretion (Galametz et al., 2009; Martini et al., 2013). Moreover, the excess of both SF and AGN activity in high-z galaxy clusters relative to the field one, supports a scenario in which (i) the increase in the merging rate at z>1 is responsible for triggering both formation of stars and BH accretion, and (ii) the subsequent possible AGN feedback could be one of the mechanisms able to quench SF in massive galaxies, leading to the formation of red and dead elliptical galaxies, as observed in local galaxy cluster cores (Springel et al., 2005; Hopkins et al., 2008; Narayanan et al., 2010). This would also explain the inversion of the SF-density relation observed in z>1.4 clusters (see Fig. 6 in Brodwin et al., 2013). In fact, while the higher normalisation of the relation at higher redshift is easily explained with the higher number of mergers, the change in the slope implies a mechanism able to stop SF (e.g. AGN feedback) in shorter time scales in galaxies located in the cluster core than in the outer region.
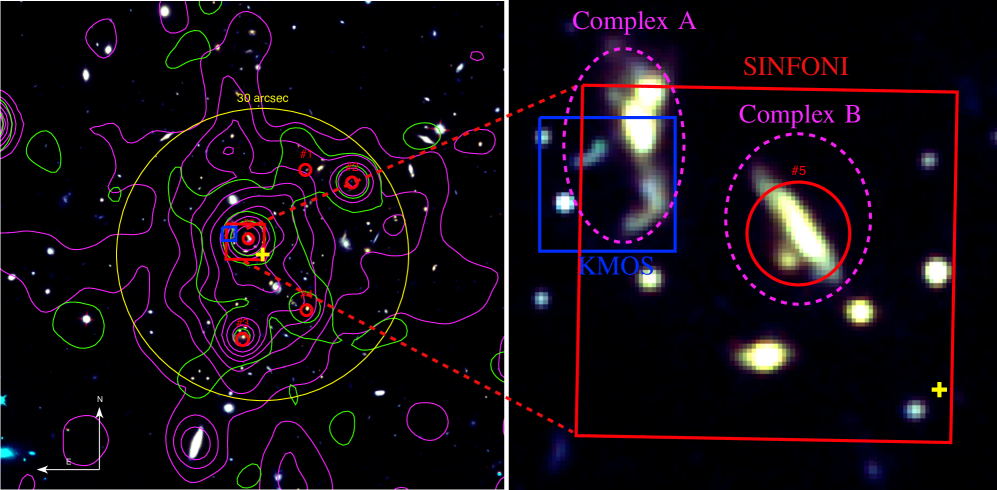
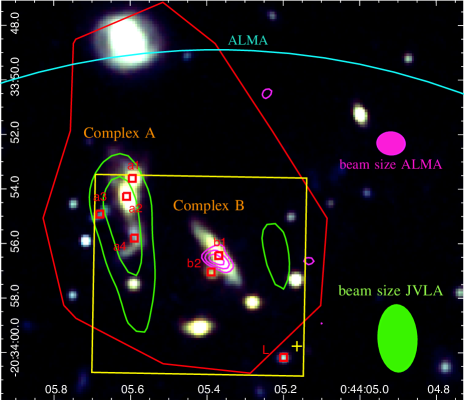
In this paper we studied the core of the X-ray detected galaxy cluster XDCP J0044.0-2033 (hereafter XDCP0044; Santos et al. 2011; Fassbender et al. 2011) at z1.6. XDCP0044 is one of the most massive galaxy clusters discovered at with 111The mass which encloses an over-density of 200 times the critical density of the Universe, computed by Tozzi et al. (2015) by modelling the X-ray data.. It has been detected in low-resolution XMM archival data within the XMM-Newton Distant Cluster Project (XDCP, Fassbender et al. 2011) thanks to its extended X-ray emission (RA=00:44:05.2, Dec = -20:33:59.7), and confirmed by deep Chandra observation to have strong diffuse emission typical of virialized clusters. XDCP0044 is in a quite advanced state of dynamical relaxation, with evidence of ongoing cluster-scale major-merger activity (Fassbender et al., 2014; Tozzi et al., 2015) and of a reversal star formation-density relation (Santos et al., 2015). Fig. 1 (left panel) shows the HST RGB (as a combination of F105W, F140W and F160W filters) image of XDCP0044 with overlaid the X-ray Chandra soft ([0.5-2] keV, magenta) and hard ([2-7] keV, green) bands contours. Red circles indicate the 5 point-like sources (AGN) identified by Tozzi et al. (2015) within 30′′ (250 kpc) from the cluster center. XDCP0044 is a unique laboratory to study the building-up of the BCG and the interplay between galaxies, nuclear activity, and the inter-galactic gas in the core of massive high redshift galaxy clusters. In this work, we have conducted a detailed multi-wavelength study of the very central region (70 kpc70 kpc) of the XDCP0044 core (right panel of Fig. 1).
The paper is organised as follows: Sect. 2 describes the observations and data reduction, while Sect. 3 presents the photometric and spectroscopic analysis of the galaxies in the analyzed region. We then focus on the AGN and SF activity in Sect. 4. Discussion, Summary and Conclusions are presented in Sect. 5 and 6.
Throughout the paper we will assume a cosmology with and (Planck Collaboration et al., 2018), and the errors will be quoted at and upper/lower limits at confidence level, unless otherwise stated.
2 Observations and Data Reduction
In this paper we combine and study the information derived from several photometric and spectroscopic multi-wavelength observations of the inner region of XDCP0044, from X-ray to optical, near-infrared (NIR) and radio bands, that have been obtained in the recent years. A summary of the analysed data is presented in this section.
2.1 Proprietary data
2.1.1 SINFONI observations and data reduction
Integral Field Unit (IFU) SINFONI observations in J- and H-band of the central region of XDCP0044 (program ID 094.A-0713(A); PI A. Bongiorno), have been obtained in 2014. At the redshift of the cluster, J-band corresponds to the rest-frame [OIII] and H emission lines ( 4496 Å - 5230 Å) while H-band samples the H emission line with a resolution of R=2000 and R=3000, respectively.
The data have been taken in seeing limited mode (average seeing ) in a field of view (FOV) which corresponds to 70 kpc 70 kpc. The observed FOV (centered at RA = 00:44:05.420, DEC = 20:33:57.16) is shown in the right panel of Fig. 1 with a red square.
Observations consist of 6 Observing Blocks (OBs) in J-band and 2 OBs in H-band. We performed observations of 300 s per frame both on objects (O) and on sky (S), following the scheme "OOSSOOSSOO", in addition to the observations of the standard and telluric stars. The total on target integration time is 4 h in J-band and 1.5 h in H-band.
SINFONI data reduction was performed using the ESO pipeline ESOREX (Modigliani
et al., 2007), with the improved sky subtraction proposed by Davies (2007). After flat-fielding, dark correction, correction for distortions, cosmic rays removal and wavelength calibration, each frame within a single OB was corrected for the sky emission lines, using the IDL routine skysub.pro (Davies, 2007).
The science frames within each OB were combined considering the offsets of the object in each frame and, finally, flux calibrated according to the standard stars. Moreover, a further flux correction in J-band was applied by rescaling the continuum flux to the HAWK-I J-band photometric point published in Fassbender
et al. (2014).
The flux calibrated exposures of the different OBs were then combined together by measuring and applying the relative offset between the peak emissions of the most luminous sources in the fields. The final result of the data reduction procedure was a 3D flux-calibrated data cube having a PSF FWHM0.7′′ and 0.6′′ in J- and in H-band, respectively.
2.1.2 KMOS observations and data reduction
KMOS IFU observations in JY- and H-bands have been obtained in 2013 (Program ID: 092.A-0114(A); PI R. Fassbender). In this work we focused on the analysis of the KMOS data centered on the BCG candidate identified by Fassbender et al. (2014). At the redshift of the cluster, JY-band samples the [OIII] and H emission lines with a resolving power 3600 while H-band samples the H region with 4000. The data have been taken with an average seeing of in a FOV. The observed FOV, centered at RA = 00:44:05.600, DEC = -20:33:54.716, is shown in Fig. 1 with a blue square. Observations consist of 7 OBs in YJ-band and 2 OBs in H-band. Each OB is made of 5 frames, each of 450 s integration time, for both sky (S) and science observations (O). The total on target integration time is 4.4 h in YJ-band and 1.25 h in H-band.
The data were reduced using the pipeline with the Software Package for Astronomical Reduction with KMOS (SPARK; Davies et al. 2013), which includes dark correction, flat fielding, illumination correction, wavelength calibration and the sky subtraction (Davies et al., 2011). Data were then combined according to the spatial shift of the object in each frame. The final datacubes in JY- and H- bands have a PSF FWHM of 0.8′′ and 0.9′′, respectively.
2.1.3 JVLA observations and data reduction
JVLA data have been taken in 2016 in the L-band (1–2 GHz) in A, B, and C configuration (with of 5 h each) as part of the project 16A-082 (PI F. De Gasperin). The data were reduced using the CASA222https://casa.nrao.edu/ package. The visibilities were Hanning-smoothed, bandpass-calibrated and then flagged using the automatic tool AOflagger (Offringa et al., 2012). We used 3C 147 as flux calibrator and the point source J2357–1125 as phase calibrator. The flux scale has been set to Perley & Butler (2013). Bandpass, scalar delays, cross-hand delays, and polarisation angle corrections were transferred to the target and the phase calibrator. Then, phase and rescaled amplitude from the phase calibrator were transferred to the target field. Finally, a few cycles of phase-only self-calibration was applied on the target field. We obtained final images in A, B and C configurations with resolution of , and and noise of 15, 20 and 25 , respectively. The datasets were finally combined to obtain single image used for the scientific analysis.
We note that all flux density errors for extended emission were computed as , where is the local image rms and is the number of beams covering the source extension.
2.2 Archival data
HST data of the XDCP0044 galaxy cluster have been obtained in 2015 (Program 13677; PI S. Perlmutter) in F105W, F140W, F160W and F814W bands, with the following exposure times: 2 h in F105W and F140W, 1 h in F160W and 47 minutes in F814W. In our analysis we used the images obtained by combining the archival (DRZ) frames, after performing the astrometry and aligning them. Due to the low S/N, the F814W band has not been included in the analysis.
Chandra/ACIS-S X-ray observation of the cluster has been performed in October-December 2013 and carried out in six exposures for an total time of 370 ks (PI P. Tozzi). Details on observations and data reduction can be found in Tozzi et al. (2015). In Sect. 3.4 we present a detailed spectral analysis.
ALMA band 6 data from project 2017.1.01387.S (PI S. Stach), covering the FOV of our SINFONI data, are also included in our study. These observations span the frequency range 221.5-225.3 GHz and 236.3-240.7 GHz for a total bandwidth of 7.5 GHz, and a spectral resolution of . Given the redshift of the cluster, the ALMA coverage corresponds to the rest-frame 600 GHz continuum and CO(5-4) emission line (=576.27 GHz). ALMA data were calibrated with the CASA 5.1.1 version in pipeline mode using the default calibrators provided by the Observatory. The continuum map was created by averaging the visibilities over the whole bandwidth. Specifically, we applied the standard non-interactive cleaning, with clark algorithm and natural weighting. This resulted into a rms sensitivity of 0.024 mJy/beam and an angular resolution of 0.98 0.78 . The resulting sensitivity to the native spectral resolution of the observations (10) is 1.5 mJy/beam and the beam is 0.82 0.63 arcsec2.
3 Analysis
3.1 Optical/NIR source identification
RA DEC a1 00:44:05.595 -20:33:53.61 a2 00:44:05.607 -20:33:54.51 a3 00:44:05.680 -20:33:54.92 a4 00:44:05.590 -20:33:55.80 b1 00:44:05.369 -20:33:56.45 b2 00:44:05.388 -20:33:57.04 C 00:44:05.717 -20:33:55.90 D 00:44:05.594 -20:33:57.46 E 00:44:05.488 -20:33:57.94 F 00:44:05.423 -20:33:59.04 G 00:44:05.282 -20:33:58.14 H 00:44:05.170 -20:33:57.32 I 00:44:05.151 -20:33:56.48 J 00:44:05.179 -20:33:54.97 K 00:44:05.299 -20:34:00.40 L 00:44:05.200 -20:34:00.17
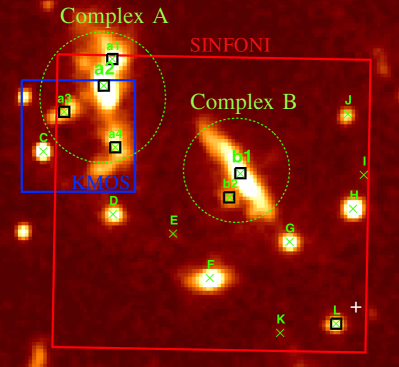
We limited our analysis of HST data to the central region of the cluster, where spectroscopic SINFONI and KMOS observations have been taken (right panel of Fig. 1) and we used SExtractor (Bertin & Arnouts, 1996) to detect and deblend the sources. We chose F105W as detection band, identifying a total of 16 sources (see Fig. 2). Interestingly, two main galaxies complexes have been identified:
-
•
Complex A, in the top-left corner of the XDCP0044 core (Fig. 2), consists of several sources identified in HST data. This complex includes what was identified by Fassbender et al. (2014) in the HAWK-I images as a single source and classified as the BCG, although with several extensions, interpreted as sign of ongoing or recent mergers.
- •
For the 16 sources, aperture photometry was performed in dual-mode on the available bands. We did not PSF-match the images, as the FWHMs in all images are comparable ( 0.130", 0.137",0.145" in F105W, F140W and F160W bands, respectively). We took the isophotal flux333SExtractor FLUX_ISO, namely the summation of the fluxes in all the pixel assigned to each object in the segmentation map. as the best photometric estimate, since the severe blending of sources would make photometric measurements in larger areas unreliable. In particular, we do not attempt to estimate total fluxes using Kron apertures 444Elliptical aperture defined by the second order moments of the object’s light distribution in SExtractor routine. (FLUX_AUTO), as they would be strongly contaminated by light coming from neighbouring sources. AB system magnitudes (listed in Table 1) have been estimated from the isophotal flux using zero points zp=(26.2, 26.4, 25.9) for (F105W, F140W, F160) band, respectively.
3.2 NIR spectroscopy
(H) a1 1.5567 339 28 3.23 0.40 8.2 1.0 24.7 3.1 <0.04 <0.27 -23.1 a2 1.5577 1880 321 b 16.62 4.36 b 6.1 1.1 18.0 3.2 -23.6 a3 1.5831 175 82 3.13 1.53 7.3 3.6 21.7 10.6 -22.1 a4 1.5609 311 108 7.67 4.00 9.3 4.8 27.5 14.3 <0.11 <0.48 -23.2 b1 1.5904 2205 383 b 40.23 10.72 b 4.0 1.4 11.7 4.1 <0.03 <0.38 -24.2 b2 1.5659 100 62 0.39 0.31 <0.70 <1.95 <0.07 <0.44 -20.8 L 1.5848 290 99 5.55 2.80 7.2 3.7 21.2 10.8 <0.15 <0.67 -21.6
Note: FWHM reported in table have been corrected for the instrumental ; b refers to the broad H component.
In this section, we present the spectroscopic analysis of VLT/SINFONI and KMOS IFU data.
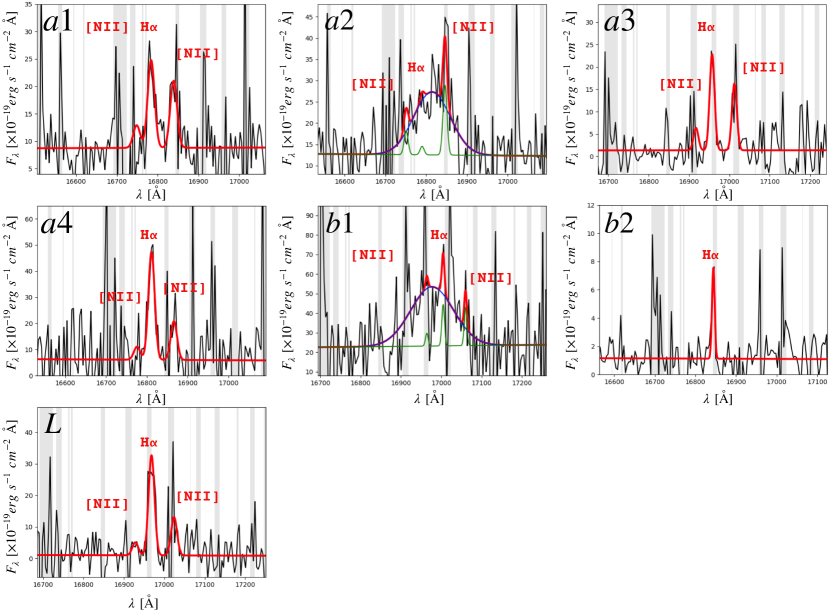
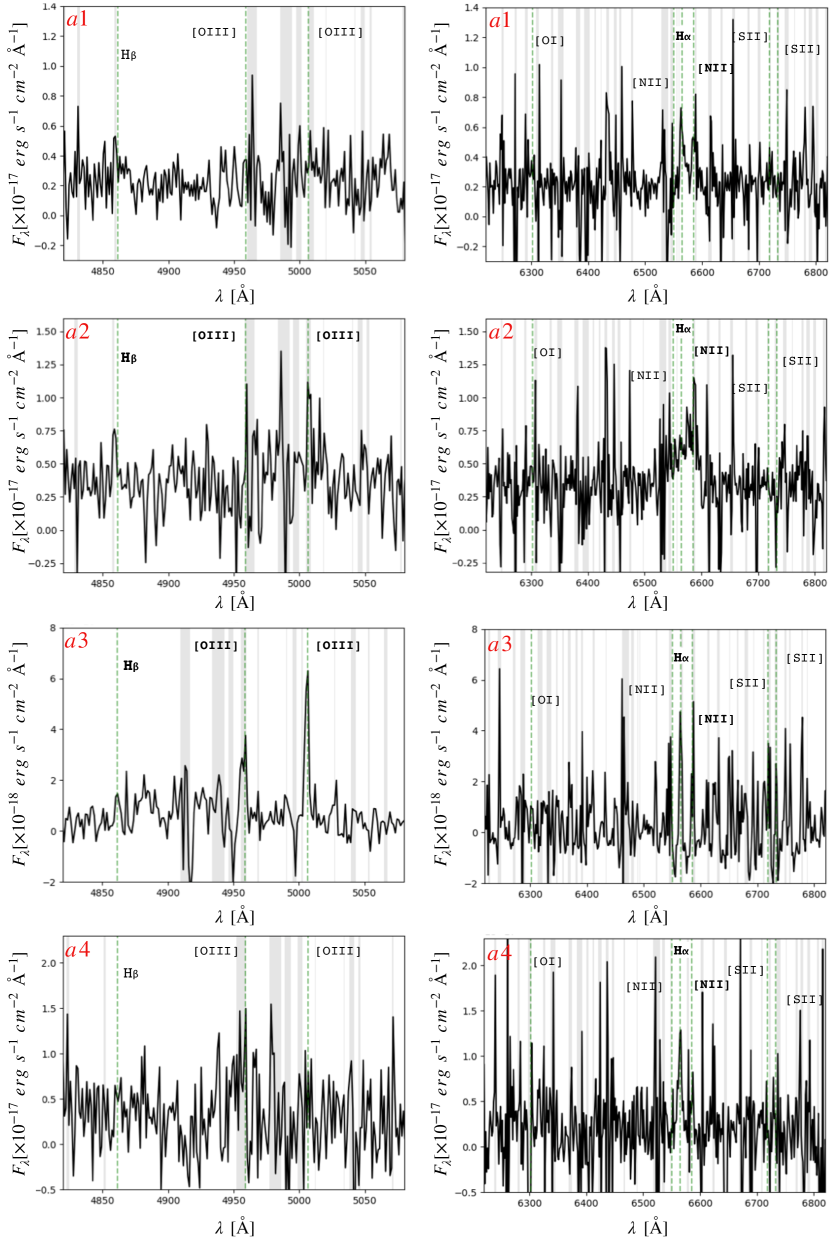
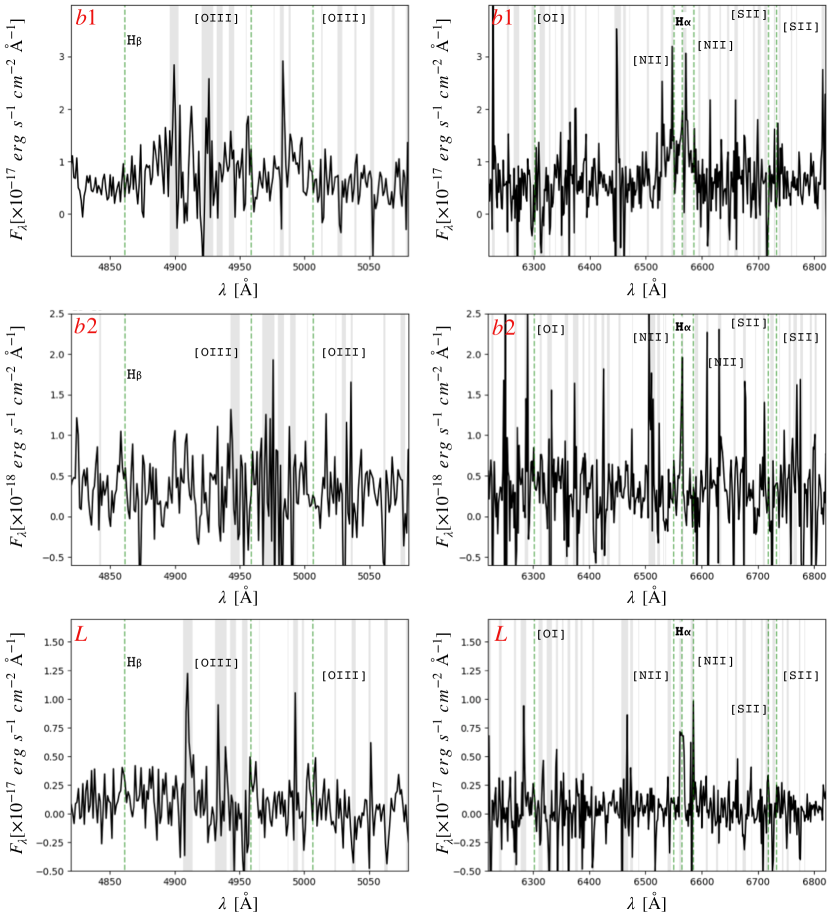
A first extraction of the spectra of the sources identified in HST was performed using a fixed aperture diameter of 7 pixels in SINFONI (0.875′′) and 5 pixels in KMOS (1′′) and each spectrum was normalized using the HST photometry. For 7 out of the 16 galaxies, a clear H line, one of the strongest line expected, has been identified together with few other lines (e.g. [OIII] doublet, H, [OII] and [NII]), which confirmed the redshift. The spectra are shown in Figs. 8 and 9 and their redshifts, listed in table 2, range from z=1.5567 to z=1.5904 (), consistently with the redshift of the cluster. All 7 galaxies (shown with a black square in Fig. 2) are therefore spectroscopically confirmed cluster members. Four of them (a1, a2, a3 and a4) belong to Complex A, other two are instead part of Complex B, and the L is close to the X-ray centroid. The spectroscopic analysis confirms that Complex A and B are indeed interacting galaxies of at least 4 galaxies at a projected distance of 20 kpc in Complex A and 2 galaxies at 5 kpc in Complex B. The two complexes are very close to each other, i.e. kpc. Moreover, as detailed later, in two of the analyzed sources, a2 in Complex A and b1 in Complex B, the H emission line is broad (). These sources have been therefore classified as broad line AGN (BL-AGN).
Given the low quality of the data, for these 7 sources, we built the integrated Signal to Noise Ratio (SNR) map of the H emission lines and we extracted the spectra by using a region centered on the H line SNR peak, with a radius of 0.4′′. Fig. 3 reports a zoom-in of the H spectral region together with the best-fit to the data (red line) consisting of a power law for the continuum, plus up to 4 Gaussian components which model the narrow and broad H line and the doublet [NII] emission lines. In the fit, we constrained the intensity of [NII] to be 2.96 times the [NII] one (Acker et al., 1989) and we set all three narrow lines to have the same dispersion. The results of the best-fit model, i.e FWHM corrected for the instrumental resolution, H and [NII] (if detected) fluxes, are reported in Table 2. Uncertainties were computed following Lenz & Ayres (1992) for noisy emission line spectra.
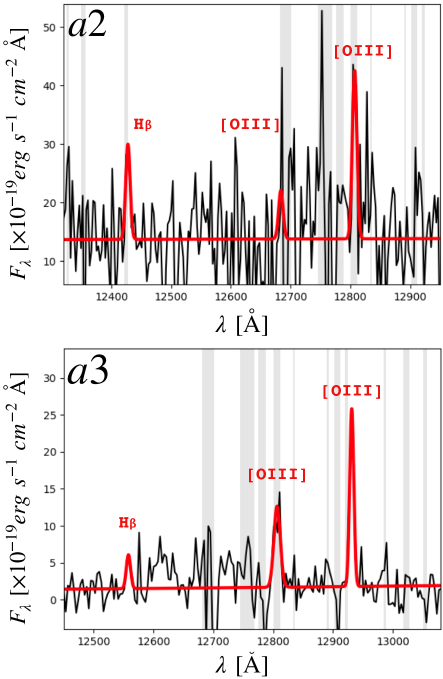
For two sources, i.e. a2 (one of the BLAGN) and a3, we also detect H and the [OIII] emission lines in the J-band SINFONI and KMOS spectrum, respectively, as shown in Fig. 4. This allowed us to confirm their redshifts and reveal the nature of a3 through the BPT diagram (Baldwin et al., 1981). The estimated integrated flux of the emission lines lead to ratios and . According to the separation criterion between AGN and SF galaxies in the BPT diagram by Kauffmann et al. (2003), a3 is therefore classified as a Type-2 AGN.
Finally, for all 7 galaxies for which a redshift has been measured, we estimated the rest-frame luminosity at 5100Å () and the V-band absolute magnitudes from the flux measured by interpolating the HST photometric points (i.e., F105W and F140W). The values, reported in Table 2, indicate that such galaxies have high luminosities, i.e. a2 and b1 are the most powerful sources with and , in agreement with the fact that they host an unobscured AGN. All other sources show slightly lower luminosities, brighter than typical normal galaxies but consistent with what found for galaxies in clusters (i.e. close to the knee of the cluster galaxy luminosity function, Martinet et al. 2015).
3.3 Dynamics of the galaxy cluster
Together with the 7 galaxies belonging to the galaxy cluster discovered in this work, there are additional 6 known cluster members whose redshift has been determined through FORS2 optical slit spectroscopy in Fassbender et al. (2014). Their ID, coordinates and redshifts are reported in Table 3. Altogether, XDCP0044 has therefore 13 confirmed cluster members with redshifts in the range 1.5567 < z < 1.5986. The central redshift of the cluster, defined as the mean redshift of all member galaxies, is (in agreement with the value published in Santos et al. (2011)). For each galaxy member, we estimated the radial component of the peculiar velocity following Harrison (1974):
| (1) |
where accounts for the cosmological correction for the cluster Hubble flow and is the redshift of each galaxy belonging to the galaxy cluster (see Table 3). Fig. 5 reports the velocity-radius diagram (left) and the histogram of the velocity shifts of galaxies (right) binned at 500. We note that, the wide spread of these redshifts , corresponding to a maximum velocity shift of , is due to the presence of few galaxies at the extremes of the distribution. This might be due to the fact that XDCP0044 is not completely virialized as already suggested by Fassbender et al. (2014). However, the large spread in the redshifts does not result in an extremely large velocity dispersion if compared with literature. The cluster velocity dispersion has been estimated in two ways, (1) as the standard deviation and (2) using the statistical gap estimator (Beers et al., 1990), which is more robust for small samples (< 20). The derived values are consistent within the errors ( and , respectively)555for both methods the uncertainties are computed by adopting the bootstrapping, which is a statistical robust estimator when dealing with small samples (¡50). and comparable with the ones derived for other galaxy clusters at z<1.4 (e.g. Ruel et al., 2014; Amodeo et al., 2018). Moreover, the mass of the cluster estimated from its kinematics following Saro et al. (2013) () is higher compared to the one derived through X-ray Chandra data by Tozzi et al. (2015) (). This further suggests that XDCP0044 in still not fully virialized and the possible presence of in-falling structures (Bower et al., 1997; Biviano et al., 2017). Additional cluster members will be crucial to fully characterize the velocity dispersion profile.
ID RA Dec z v SINFONI and KMOS data a1 00:44:05.595 -20:33:53.61 1.5567 -2094 a2 00:44:05.607 -20:33:54.51 1.5577 -1988 a3 00:44:05.680 -20:33:54.92 1.5831 972 a4 00:44:05.590 -20:33:55.80 1.5609 -1609 b1 00:44:05.369 -20:33:56.45 1.5904 1342 b2 00:44:05.388 -20:33:57.04 1.5659 -1026 L 00:44:05.200 -20:34:00.17 1.5848 1173 FORS2 data 2 0:44:04.737 -20:34:09.43 1.5795 556 3a 0:44:05.450 -20:34:16.78 1.5699 -562 3b 0:44:05.531 -20:34:16.78 1.5716 -364 4 0:44:05.325 -20:33:14.28 1.5787 463 5 0:44:05.611 -20:32:58.55 1.5778 358 6 0:44:03.015 -20:32:31.84 1.5986 2780

3.4 Chandra X-ray spectroscopy
Sources a2, a3 and b1 have been spectroscopically identified as AGN, although only b1 has been detected in the Chandra image, as already reported by Tozzi
et al. (2015).
To measure the nuclear properties of b1, we extracted the X-ray spectrum of this source. The source and local background spectral extractions were performed separately in each observation, using circular regions of 1.5 arcsec radius and annular regions with inner and outer radii of 3 and 7.5 arcsec, respectively666From this region we excluded a circular region of 1.5 arcsec radius centered on the HST detected position of the BCG galaxy in order to avoid possible, unresolved, contributions from it..
The spectral extractions and response files production were performed with the CIAO script specextract. The spectra were finally co-added using the FTOOLS777https://heasarc.gsfc.nasa.gov/ftools/ script addascaspec.
The resulting spectrum has been grouped to 1 count per bin, and modeled in XSPEC v. 12.9.0 in the 0.3-8 keV (0.8-20 keV rest-frame) band and using the Cash statistics (C-stat) implementation with direct background subtraction (Cash, 1976; Wachter
et al., 1979).
The X-ray spectrum of b1 consists of 268 (90 c.l.) background-subtracted counts, in the 0.3-8 keV energy band and is shown in Fig. 6. It has been modeled with an intrinsically absorbed power-law (dashed line) with a thermal emission (APEC model in XSPEC, dotted line) at low energies (<0.6 keV) to account for residual excess. The latter component can either parameterize a possible hot thermal corona associated with the quasar host galaxy or may account for the improper background subtraction at these energies due to inhomogeneous distribution of the intracluster-medium in the spectral extraction regions.
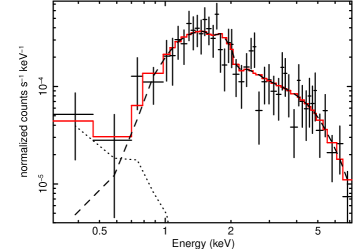
The best-fit model () gives a and with a best-fit keV (assuming Solar abundance). The latter is unconstrained given that the thermal component affects a restricted spectral region at energies keV of low SNR. The resulting unabsorbed 2-10 keV luminosity is . A fit with a canonical requires slightly higher column densities of and results in . b1 is, therefore, a luminous and moderately obscured source.
AGN a2 and a3 have not been detected in Chandra. While this is not at odd for a3, which is classified as a type-2 AGN and its X-ray emission is indeed obscured, a2 shows a broad emission line. We derived a 3 observed luminosity upper limit at the position of these sources (whose distance is less than Chandra resolution) finding , assuming an unabsorbed power-law with typical . If we consider the bolometric luminosity of a2 derived from (i.e. ; see Sec. 4.1 and Table 4), by applying a bolometric correction (Duras et al., 2020) we expect an intrinsic luminosity . This means that, to satisfy the upper limit on , a high level of obscuration () would be required. This is consistent with its optical properties. Indeed, while the source b1 has an H emission line clearly broad (), a2 has a FWHM which is close to the typical value used as threshold to distinguish between Type-1 and Type-2 AGN (). The same calculation cannot be made for the a3 source, since its host galaxy emission is expected to dominate the 5100Å continuum luminosity and therefore, no bolometric correction can be applied. The derived X-ray properties are reported in Table 4.
4 AGN and SF activity in the cluster core
4.1 Bolometric luminosity, BH masses and Eddington ratios
Bolometric luminosities were computed by applying the bolometric correction by Runnoe et al. (2012) to the 5100Å luminosity, which is estimated from the linear interpolation of the F105W and F140W HST magnitudes given in Table 1. In particular,
| (2) |
with Å.
The values obtained for the bolometric luminosity are of the order of (see Table 4).
For the source b1, we could also estimate the bolometric luminosity from the [2-10]keV band by assuming the bolometric correction from Duras
et al. (2020). The derived value is log[L]=45.4, very close to the one computed from the 5100Å luminosity (i.e. log[L]=45.6).
This agreement confirms that the 5100 Å luminosity is AGN dominated and, therefore, can be used in the BH mass computation.
Indeed, from the broad H line, we estimated the BH mass of the two BLAGN (a2 and b1) using the virial formula by Greene &
Ho (2005).
| (3) |
with defined as in Greene & Ho (2005) to be:
| (4) |
We found that both a2 and b1 host relatively massive SMBHs of .
We assign to each BH mass measurement an error given by the sum of the statistical and systematic uncertainties. The systematic uncertainty in the determination has been estimated in 0.3 dex to account for the observed scatter in the virial relation itself, while in the computation of the statistical errors, we take into account the errors in the 5100 Å luminosity and FWHM measurements (in quadrature).
From these values we also derived their Eddington ratios, finding .
Sources a2 and b1 are therefore luminous, massive, highly accreting and obscured AGN.
We caution the reader that the values obtained for the BH masses can be underestimated due to the high , which might extinguish the H emission line and the . Bolometric luminosities, black hole masses and Eddington ratios are reported in Table 4.
a2 1.9 b1 44.1 22.7
⋆ derived from following Runnoe et al. (2012); (∗) the values of reported are intrinsic (unabsorbed). This value has been computed from the X-ray spectrum for b1 while for a2 has been derived from the bolometric luminosity.
4.2 Star formation activity
Santos et al. (2015) derived the SFR in the cluster core galaxies through Herschel far-IR data (red contour in Fig. 7), finding a SFR . Unfortunately, given the SPIRE point spread function ranging from 17.6′′ at 250m to 35.2′′ at 500m, this value includes all sources studied here plus an additional very bright object to the north of the studied region. On the contrary, ALMA observations provide sufficient angular resolution (0.98 0.78′′) to distinguish the single sources within the observed ALMA field shown in cyan in Fig. 7.
The analysis of the ALMA data did not spot emission lines in the region covered by the SINFONI FOV. On the contrary, in the ALMA continuum map observed at 230 GHz with an rms sensitivity of 0.024 mJy/beam (magenta contours in Fig. 7), we detected the source b1 at 5 significance with a rest-frame 600 GHz flux of mJy. No emission is associated to a2, a 3 upper limit on the flux has been computed to be <0.59 mJy.
For the source b1, we derived the SFR by assuming a typical QSO SED, i.e. Mrk 231 template, and normalising it to the observed ALMA flux. The derived value obtained by integrating from 8-to-1000, is . This value is consistent with the SFR derived from IR Herschel data by Santos et al. (2015) for the entire central region, suggesting that most of the IR emission, and therefore of the SF, might be associated to b1. However, if we consider a different modelization for the dust emission and we assume e.g. a simple blackbody template normalized to the ALMA flux with dust temperature of 40 K, the SFR we obtain is lower, i.e. 150 M⊙/yr. Also for source a2 we computed an upper limit on the SFR (1) using the Mrk 231 template, finding SFR<285 and (2) by fitting with a simple blackbody template with different temperatures, finding a best fit with and a SFR< 240 .
JVLA data reveal an extended radio emission associated to Complex A with a flux density of (green contours in Fig. 7). Its luminosity is and under the assumption that the radio signal is produced by a single source, its power (=23.45) would be just above the threshold at z1.6, introduced by Magliocchetti et al. (2014, =21.7+z), to discriminate SF processes from AGN, suggesting therefore a likely AGN powered radio emission. However, since the value is slightly above but below , there is a 20 to 40 probability that the radio emission is on the contrary due to SF processes (Magliocchetti et al., 2018). In this case the measured radio luminosity would translate into a according to the relation by Brown et al. (2017), in agreement with the upper limit estimated from the ALMA data.
We then estimated an upper limit on the CO flux, producing a velocity-integrated map by assuming a FWHM=500, typically expected for CO emission lines of AGN (e.g. Brusa et al., 2018; Herrera-Camus et al., 2019), centred at the redshift of the cluster. This translates into a 3 upper limit on the CO integrated flux for a point source of 0.27 Jy/beam km/s, equivalent to . This value corresponds to a following the relation from Solomon & Vanden Bout (2005) and assuming the ratio CO(5-4) to CO(1-0) given by Carilli & Walter (2013). According to the values found by Accurso et al. (2017) for massive galaxies (), this value results in , in agreement with what recently found for galaxies in high-z clusters (e.g. Pulido et al., 2018; Hayashi et al., 2018).
5 Discussion
5.1 Multiple AGN activity in the cluster core
As a very interesting result, we found that three out of the 7 galaxies in the core of XDCP0044 host an obscured AGN and that such galaxies are located at a minimum (maximum) projected distance of 10 kpc (40 kpc). This evidence seems to suggest a crucial role of AGN in the galaxy evolution at this epoch and for these environments. The discovery of multiple AGN activity is common in proto-clusters, where large centrally over-density of AGN are frequently found (Digby-North et al., 2010; Galametz et al., 2010; Krishnan et al., 2017; Casasola et al., 2018), but up to now only few works reported multiple AGN activity in high-z galaxy cluster cores, although not at such small distances. For example, Hilton et al. (2010) reported the detection of two central X-ray cluster member AGN at a projected distance of 90 kpc in the z = 1.46 galaxy cluster XMMXCS J2215.9-1738 and, at higher redshift (z2), Gobat et al. (2013) found two X-ray AGN at a projected distance of 100 kpc in CL J1449+0856. The newly discovered AGN in XDCP0044 are among the closest AGN found at z1 (De Rosa et al., 2019, and references therein) and their proximity implies a future merger between them. In addition, these AGN are located in merger systems and exhibit high luminosity, high/intermediate obscuration and high accretion rates. Specifically, two of them show broad lines and are mildly () or highly () X-ray obscured, while the third one is also optically obscured (type-2 AGN).
Semi-analytical models suggest that mergers between gas-rich galaxies can destabilize the gas and cause its inflow towards the inner regions, thus providing potential accreting material for the central BH and triggering starburst activity (e.g., Granato et al., 2004; Hopkins et al., 2008). This scenario is confirmed by several statistical works (e.g. Alberts et al., 2016; Martini et al., 2013) who observed a correlation between AGN and merger activity in both proto-clusters and galaxy clusters. Moreover, according to this scenario, in this phase the AGN is expected to be highly accreting and obscured (e.g. Koss et al., 2018), in agreement with our findings.
For the two discovered AGN showing broad lines, we also studied their location in the - plane. Stellar masses of the AGN host galaxies were computed, as detailed in Sect. 5.2, finding and for a2 and b1, respectively. As shown in Bongiorno & Travascio (2019), we found that both of them lie below the Kormendy & Ho (2013) relation for local inactive galaxies, i.e. at 2 from it with log() computed perpendicular to the relation. On the contrary, the ratios seem to be more in agreement with the recent local scaling relation computed for active galaxies at z<0.055 by Reines & Volonteri (2015) and with the unbiased - relation derived by Shankar et al. (2016).
5.2 Mass assembly and time scales for the BCG formation
How the BCG form is still an open question due to the difficulty in identifying the BCG progenitors at z>1.5. To test the scenario predicting the BCG formation at this epoch through mergers (Stott, 2008; Lidman et al., 2013; Webb et al., 2015; Laporte et al., 2013), we estimated the timescale for merging all galaxies discovered to be in the cluster core and the final mass of the possible newly formed galaxy. We first computed the stellar masses of each galaxy resolved by HAWK-I images (see Fassbender et al., 2014) by performing an SED-fitting procedure on the HST photometry, HAWK-I J- and K-bands. We used the zphot code (Fontana et al., 2000), with Bruzual & Charlot (2003) templates, Salpeter (1959) IMF and Calzetti et al. (2000) extinction. We adopted exponentially declining star formation histories (-models) and approximated the redshift of all the sources to . Assuming that the 7 confirmed cluster members (all 16 galaxies detected by HST) will be forming the BCG, their best-fit masses would sum up to a final stellar mass of , consistent with the mass range observed for local BCGs (Zhao et al., 2015).
The BCG assembly time scale is computed according to the average time for a major merger of close pairs reported in Kitzbichler & White (2008). We considered the case in which Complex A and B are cluster’s sub-clumps, each of which will aggregate to form a cD-like galaxy through a gravitational phase transition. In Complex B, this process seems to be already in an advanced state, with b1 dominating the system, while in Complex A, several galaxies with similar mass are still visible. However, the resulting merging time () is similar for both complexes, i.e. of the order of 1-1.5 Gyr. This process will lead to the formation of two massive galaxies (galaxy A from Complex A and galaxy B from Complex B) at the center of the galaxy cluster which will possibly merge to form the final BCG. We then assumed that these two galaxies and the L source will move towards the X-ray centroid in a dynamical friction time (Binney & Tremaine, 1987) of the order of 1.2-2.5 Gyr. Therefore, according to this scenario, all these galaxies will merge in 2.5 Gyr.
A different scenario has also been considered in which Complex A and Complex B do not represent subgroups of the cluster core and therefore all galaxies will directly merge close to the X-ray centroid to form the final BCG in a friction time scale.
In this case, we estimated the mass of the single galaxies resolved by HST observations by assuming a constant mass-to-light ratio in the HST F160W-band, which is the closest to the rest-frame K-band considered as a good indicator of the mass with a 1 scatter of about 0.1 dex (Madau
et al., 1998; Bell et al., 2003). According to this scenario, which does not imply the formation of sub-groups, the central QSO b1 and the L source are found to have shorter merger times () compared to all other galaxies, whose friction time ranges from 3.2 to 6 Gyr. Galaxy a3 needs more than 10 Gyrs to reach the X-ray centroid and therefore won’t merge.
Summarising, we find that in a time scale of a couple of Gyrs, all galaxies in the core of XDCP0044 will experience several major mergers, forming a massive central galaxy with at z1, in agreement with what predicted by semi-analytic models (De Lucia & Blaizot, 2007) and found observationally (Prieto & Eliche-Moral, 2015; Sawicki et al., 2020). The BCG will then keep slowly growing its mass at z1 through minor mergers (e.g. Lidman et al., 2013; Liu et al., 2015).
The newly formed BCG will host a central SMBH, whose lower limit to the mass is , obtained by summing the masses of the two AGN, a2 and b1. Stellar and BH masses of the final BCG as well as merging timescales have to be considered as lower limits. In our computation we have indeed conservatively considered only spectroscopically confirmed galaxies. However, additional cluster complexes (e.g. galaxies complex 3(a+b) identified in Fassbender et al. 2014) might also take part in the formation of the BCG.
6 Summary and Conclusions
In this paper we have investigated the properties of the galaxy population in the very central region (70 70 kpc2) of XDCP0044, one of the most massive galaxy clusters at 1.6. We have analyzed high resolution HST images in F105W, F140W and F160W-bands, IFU spectroscopy obtained with SINFONI in J- and H-band, and KMOS in JY- and H-band, together with JVLA at 1-2GHz and ALMA band 6 observations at 288 GHz.
The main results of our analysis are summarized as follows:
-
i)
High resolution HST F105W, F140W and F160W images reveal the presence of 16 sources in the core of XDCP0044. We find that most of such galaxies are grouped, forming two complexes, i.e. Complex A and Complex B. The first one includes the BCG identified by Fassbender et al. (2014) through HAWK-I images, while the second contains the central X-ray AGN identified by Tozzi et al. (2015).
-
ii)
Through SINFONI and KMOS spectroscopy, we have confirmed 7 cluster members with redshifts ranging from z=1.5567 to z=1.5904 (0.0337), consistently with the redshift of the cluster. In particular, we find that Complex A consists of at least 4 cluster members at a projected distance of 20 kpc, while the central AGN b1, and the nearby (5 kpc) galaxy b2, belong to the Complex B.
-
iii)
In 2 of the 7 confirmed cluster members (a2 in Complex A and b1 in Complex B) we detect a broad () H emission line. These sources have been therefore classified as BL-AGN, hosting massive () and highly accreting () BHs. Moreover, the analysis of the BPT diagram pointed out the presence of an additional AGN which does not show broad lines (a3 in Complex A). The minimum distance in this AGN triple is 10 kpc between a2 and a3, while the maximum distance between a3 and b1 is 40 kpc.
-
iv)
One of the BLAGN, i.e. b1, was already identified as AGN from its unresolved X-ray emission by Tozzi et al. (2015). The analysis of the spectrum reveals that b1 is a luminous and moderately obscured AGN, with X-ray luminosity and column density . The other two objects (the BLAGN a2 and the NLAGN a3), on the contrary, are not detected in the Chandra data, implying a high level of obscuration. In particular, source a2, for which the intrinsic X-ray luminosity could be derived from the bolometric one, is found to be X-ray luminous () and obscured ().
-
v)
The integrated SFR of the whole central region of XDCP0044 is . This value has been derived by Santos et al. (2015) using Herschel data which however do not allow us to distinguish the different sources. Thanks to the higher resolution ALMA observations, we derive the SFR of the single observed sources finding that the central AGN b1 alone contributes to this value with a SFR ranging from 150 to 490 , depending on the assumed SED, while a2 might contribute less than 285 /yr, in agreement with the radio emission of Complex A.
In conclusion, XDCP0044 allows us to witness the BCG assembly in one of the densest galaxy cluster core at z, which is thought to be in a crucial formation epoch, when both SF and nuclear activity are at their peak (Madau &
Dickinson, 2014; Aird et al., 2015). We confirm that high-z galaxy cluster cores show different properties compared to the z=0 ones. Indeed, no single, early-type BCG has been detected in the core of XDCP0044, which is found to host a large number (at least 7 confirmed) of highly star-forming interacting galaxies grouped in two main complexes, both hosting multiple AGN activity. The discovered AGN triple is one of the closest revealed so far at z>1 (De Rosa
et al., 2019), with a projected distance ranging from 10 to 40 kpc.
Moreover, these results lead to a scenario in which obscured AGN activity is triggered during the formation of the cluster BCG, when mergers between gas-rich galaxies provide the fuel for the AGN and for triggering starburst activity. According to our data, we expect to form a typical massive galaxy of , hosting a SMBH with mass , in a time scale of few Gyrs.
Acknowledgements
We thank Andrea Biviano, Claudio Ricci and Alessandra Lamastra for useful discussions. This work is based on observations collected at the European Southern Observatory under ESO programmes 094.A-0713(A) and 092.A-0114(A). AB, EP, LZ and MB acknowledge the support from ASI-INAF 2017-14-H.0. PT acknowledges support from the Istituto Nazionale di Astrofisica (INAF) PRIN-SKA 2017 program 1.05.01.88.04 (ESKAPE). This paper makes use of the following ALMA data: ADS/JAO.ALMA2017.1.01387.S. ALMA is a partnership of ESO (representing its member states), NSF (USA) and NINS (Japan), together with NRC (Canada), MOST and ASIAA (Taiwan), and KASI (Republic of Korea), in cooperation with the Republic of Chile. The Joint ALMA Observatory is operated by ESO, AUI/NRAO and NAOJ.
Data availability
All data are free in the archive of the different telescopes, while data generated in this work are available on request.
References
- Accurso et al. (2017) Accurso G., et al., 2017, MNRAS, 470, 4750
- Acker et al. (1989) Acker A., Köppen J., Samland M., Stenholm B., 1989, The Messenger, 58, 44
- Aird et al. (2015) Aird J., Coil A. L., Georgakakis A., Nandra K., Barro G., Pérez-González P. G., 2015, MNRAS, 451, 1892
- Alberts et al. (2016) Alberts S., et al., 2016, ApJ, 825, 72
- Amodeo et al. (2018) Amodeo S., et al., 2018, ApJ, 853, 36
- Andreon (2013) Andreon S., 2013, A&A, 554, A79
- Bai et al. (2007) Bai L., et al., 2007, ApJ, 664, 181
- Bai et al. (2009) Bai L., Rieke G. H., Rieke M. J., Christlein D., Zabludoff A. I., 2009, ApJ, 693, 1840
- Baldwin et al. (1981) Baldwin J. A., Phillips M. M., Terlevich R., 1981, PASP, 93, 5
- Beers et al. (1990) Beers T. C., Flynn K., Gebhardt K., 1990, AJ, 100, 32
- Bell et al. (2003) Bell E. F., McIntosh D. H., Katz N., Weinberg M. D., 2003, ApJS, 149, 289
- Bernardi et al. (2007) Bernardi M., Hyde J. B., Sheth R. K., Miller C. J., Nichol R. C., 2007, AJ, 133, 1741
- Bertin & Arnouts (1996) Bertin E., Arnouts S., 1996, A&AS, 117, 393
- Best et al. (2007) Best P. N., von der Linden A., Kauffmann G., Heckman T. M., Kaiser C. R., 2007, MNRAS, 379, 894
- Binney & Tremaine (1987) Binney J., Tremaine S., 1987, Galactic dynamics
- Biviano et al. (2017) Biviano A., Popesso P., Dietrich J. P., Zhang Y. Y., Erfanianfar G., Romaniello M., Sartoris B., 2017, A&A, 602, A20
- Bonaventura et al. (2017) Bonaventura N. R., et al., 2017, MNRAS, 469, 1259
- Bongiorno & Travascio (2019) Bongiorno A., Travascio A., 2019. , doi:Proceeding IAU Symposium No. 356, 2019 arXiv in press.
- Bower et al. (1997) Bower R. G., Castander F. J., Ellis R. S., Couch W. J., Boehringer H., 1997, MNRAS, 291, 353
- Brodwin et al. (2013) Brodwin M., et al., 2013, ApJ, 779, 138
- Brown et al. (2017) Brown M. J. I., et al., 2017, ApJ, 847, 136
- Brusa et al. (2018) Brusa M., et al., 2018, A&A, 612, A29
- Bruzual & Charlot (2003) Bruzual G., Charlot S., 2003, MNRAS, 344, 1000
- Calzetti et al. (2000) Calzetti D., Armus L., Bohlin R. C., Kinney A. L., Koornneef J., Storchi-Bergmann T., 2000, ApJ, 533, 682
- Carilli & Walter (2013) Carilli C. L., Walter F., 2013, ARA&A, 51, 105
- Carter (1977) Carter D., 1977, MNRAS, 178, 137
- Casasola et al. (2018) Casasola V., et al., 2018, A&A, 618, A128
- Cash (1976) Cash W., 1976, A&A, 52, 307
- Contini et al. (2014) Contini E., De Lucia G., Villalobos Á., Borgani S., 2014, MNRAS, 437, 3787
- Cooke et al. (2016) Cooke E. A., et al., 2016, ApJ, 816, 83
- Cooke et al. (2019) Cooke E. A., Smail I., Stach S. M., Swinbank A. M., Bower R. G., Chen C.-C., Koyama Y., Thomson A. P., 2019, MNRAS, 486, 3047
- Croton (2006) Croton D. J., 2006, MNRAS, 369, 1808
- Davies (2007) Davies R. I., 2007, MNRAS, 375, 1099
- Davies et al. (2011) Davies R., et al., 2011, ApJ, 741, 69
- Davies et al. (2013) Davies R. I., et al., 2013, A&A, 558, A56
- De Lucia & Blaizot (2007) De Lucia G., Blaizot J., 2007, MNRAS, 375, 2
- De Rosa et al. (2019) De Rosa A., et al., 2019, New Astron. Rev., 86, 101525
- Delahaye et al. (2017) Delahaye A. G., et al., 2017, ApJ, 843, 126
- Digby-North et al. (2010) Digby-North J. A., et al., 2010, MNRAS, 407, 846
- Dubinski (1998) Dubinski J., 1998, ApJ, 502, 141
- Duras et al. (2020) Duras F., et al., 2020, A&A, 636, A73
- Enßlin & Gopal-Krishna (2001) Enßlin T. A., Gopal-Krishna 2001, A&A, 366, 26
- Fassbender et al. (2011) Fassbender R., et al., 2011, New Journal of Physics, 13, 125014
- Fassbender et al. (2014) Fassbender R., et al., 2014, A&A, 568, A5
- Fontana et al. (2000) Fontana A., D’Odorico S., Poli F., Giallongo E., Arnouts S., Cristiani S., Moorwood A., Saracco P., 2000, AJ, 120, 2206
- Galametz et al. (2009) Galametz A., et al., 2009, ApJ, 694, 1309
- Galametz et al. (2010) Galametz A., Stern D., Stanford S. A., De Breuck C., Vernet J., Griffith R. L., Harrison F. A., 2010, A&A, 516, A101
- Gobat et al. (2013) Gobat R., et al., 2013, ApJ, 776, 9
- Granato et al. (2004) Granato G. L., De Zotti G., Silva L., Bressan A., Danese L., 2004, ApJ, 600, 580
- Greene & Ho (2005) Greene J. E., Ho L. C., 2005, ApJ, 630, 122
- Harrison (1974) Harrison E. R., 1974, ApJ, 191, L51
- Hayashi et al. (2018) Hayashi M., et al., 2018, ApJ, 856, 118
- Herrera-Camus et al. (2019) Herrera-Camus R., et al., 2019, ApJ, 871, 37
- Hilton et al. (2010) Hilton M., et al., 2010, ApJ, 718, 133
- Hogan et al. (2015) Hogan M. T., et al., 2015, MNRAS, 453, 1201
- Hopkins et al. (2008) Hopkins P. F., Hernquist L., Cox T. J., Kereš D., 2008, ApJS, 175, 356
- Intema et al. (2017) Intema H. T., Jagannathan P., Mooley K. P., Frail D. A., 2017, A&A, 598, A78
- Jones & Forman (1984) Jones C., Forman W., 1984, ApJ, 276, 38
- Kauffmann et al. (2003) Kauffmann G., et al., 2003, MNRAS, 346, 1055
- Kitzbichler & White (2008) Kitzbichler M. G., White S. D. M., 2008, MNRAS, 391, 1489
- Kormendy & Ho (2013) Kormendy J., Ho L. C., 2013, ARA&A, 51, 511
- Koss et al. (2018) Koss M. J., et al., 2018, Nature, 563, 214
- Krick et al. (2009) Krick J., Surace J., Thompson D., Ashby M., Hora J., Gorjian V., Yan L., 2009, in American Astronomical Society Meeting Abstracts #213. p. 339
- Krishnan et al. (2017) Krishnan C., et al., 2017, MNRAS, 470, 2170
- Laporte et al. (2013) Laporte C. F. P., White S. D. M., Naab T., Gao L., 2013, MNRAS, 435, 901
- Lee-Brown et al. (2017) Lee-Brown D. B., et al., 2017, ApJ, 844, 43
- Lenz & Ayres (1992) Lenz D. D., Ayres T. R., 1992, PASP, 104, 1104
- Lidman et al. (2013) Lidman C., et al., 2013, MNRAS, 433, 825
- Lin & Mohr (2004) Lin Y.-T., Mohr J. J., 2004, ApJ, 617, 879
- Lin et al. (2010) Lin Y.-T., Ostriker J. P., Miller C. J., 2010, ApJ, 715, 1486
- Liu et al. (2015) Liu F. S., Lei F. J., Meng X. M., Jiang D. F., 2015, MNRAS, 447, 1491
- Lotz et al. (2013) Lotz J. M., et al., 2013, ApJ, 773, 154
- Madau & Dickinson (2014) Madau P., Dickinson M., 2014, ARA&A, 52, 415
- Madau et al. (1998) Madau P., Pozzetti L., Dickinson M., 1998, ApJ, 498, 106
- Magliocchetti et al. (2014) Magliocchetti M., et al., 2014, MNRAS, 442, 682
- Magliocchetti et al. (2018) Magliocchetti M., Popesso P., Brusa M., Salvato M., 2018, MNRAS, 473, 2493
- Mancone et al. (2012) Mancone C. L., et al., 2012, ApJ, 761, 141
- Martinet et al. (2015) Martinet N., et al., 2015, A&A, 575, A116
- Martini et al. (2013) Martini P., et al., 2013, ApJ, 768, 1
- McDonald et al. (2016) McDonald M., et al., 2016, ApJ, 817, 86
- Mei et al. (2015) Mei S., et al., 2015, ApJ, 804, 117
- Modigliani et al. (2007) Modigliani A., et al., 2007, ArXiv Astrophysics e-prints,
- Moravec et al. (2020) Moravec E., et al., 2020, ApJ, 888, 74
- Narayanan et al. (2010) Narayanan D., et al., 2010, MNRAS, 407, 1701
- Offringa et al. (2012) Offringa A. R., van de Gronde J. J., Roerdink J. B. T. M., 2012, A&A, 539, A95
- Perley & Butler (2013) Perley R. A., Butler B. J., 2013, ApJS, 204, 19
- Pillepich et al. (2018) Pillepich A., et al., 2018, MNRAS, 473, 4077
- Planck Collaboration et al. (2018) Planck Collaboration et al., 2018, arXiv e-prints,
- Prieto & Eliche-Moral (2015) Prieto M., Eliche-Moral M. C., 2015, MNRAS, 451, 1158
- Pulido et al. (2018) Pulido F. A., et al., 2018, ApJ, 853, 177
- Ragone-Figueroa et al. (2018) Ragone-Figueroa C., Granato G. L., Ferraro M. E., Murante G., Biffi V., Borgani S., Planelles S., Rasia E., 2018, MNRAS, 479, 1125
- Reines & Volonteri (2015) Reines A. E., Volonteri M., 2015, ApJ, 813, 82
- Rudick et al. (2011) Rudick C. S., Mihos J. C., McBride C. K., 2011, ApJ, 732, 48
- Ruel et al. (2014) Ruel J., et al., 2014, ApJ, 792, 45
- Runnoe et al. (2012) Runnoe J. C., Brotherton M. S., Shang Z., 2012, MNRAS, 422, 478
- Salpeter (1959) Salpeter E. E., 1959, ApJ, 129, 608
- Sandage et al. (1976) Sandage A., Kristian J., Westphal J. A., 1976, ApJ, 205, 688
- Santos et al. (2011) Santos J. S., et al., 2011, A&A, 531, L15
- Santos et al. (2015) Santos J. S., et al., 2015, MNRAS, 447, L65
- Saro et al. (2013) Saro A., Mohr J. J., Bazin G., Dolag K., 2013, ApJ, 772, 47
- Sawicki et al. (2020) Sawicki M., Arcila-Osejo L., Golob A., Moutard T., Arnouts S., Cheema G. K., 2020, MNRAS, 494, 1366
- Shankar et al. (2016) Shankar F., et al., 2016, MNRAS, 460, 3119
- Solomon & Vanden Bout (2005) Solomon P. M., Vanden Bout P. A., 2005, ARA&A, 43, 677
- Springel et al. (2005) Springel V., Di Matteo T., Hernquist L., 2005, MNRAS, 361, 776
- Stott (2008) Stott J. P., 2008, The Observatory, 128, 148
- Strazzullo et al. (2013) Strazzullo V., et al., 2013, ApJ, 772, 118
- Tozzi et al. (2015) Tozzi P., et al., 2015, ApJ, 799, 93
- Wachter et al. (1979) Wachter K., Leach R., Kellogg E., 1979, ApJ, 230, 274
- Webb et al. (2015) Webb T. M. A., et al., 2015, ApJ, 814, 96
- Webb et al. (2017) Webb T. M. A., et al., 2017, ApJ, 844, L17
- Zhao et al. (2015) Zhao D., Aragón-Salamanca A., Conselice C. J., 2015, MNRAS, 453, 4444
- Zhao et al. (2017) Zhao D., Conselice C. J., Aragón-Salamanca A., Almaini O., Hartley W. G., Lani C., Mortlock A., Old L., 2017, MNRAS, 464, 1393
- van Velzen et al. (2012) van Velzen S., Falcke H., Schellart P., Nierstenhöfer N., Kampert K.-H., 2012, A&A, 544, A18
- van Weeren et al. (2019) van Weeren R. J., de Gasperin F., Akamatsu H., Brüggen M., Feretti L., Kang H., Stroe A., Zandanel F., 2019, Space Sci. Rev., 215, 16
Appendix A SINFONI and KMOS spectra of cluster members
Zoom-in of the SINFONI J and H-band and KMOS JY- and H-band (for a3) rest-frame spectra of the galaxies in the field of interest classified as cluster members.
Appendix B JVLA radio detected sources in XDCP0044
Radio JVLA data include the whole galaxy cluster field. Here, we briefly summarize the radio sources detected in XDCP0044. Fig. 10 shows the HST RGB image of the cluster with overlapped the 3 radio JVLA contours in green at 1.5 GHz and the soft X-ray emission in magenta.
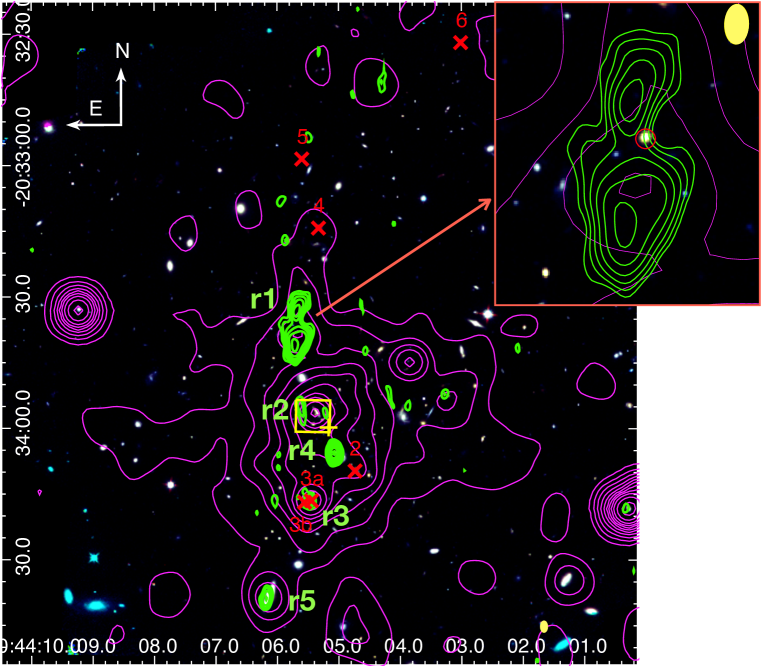
In addition to the extended radio emission associated with Complex A and described in Sec.4.2 (i.e. r2), four radio sources have been detected, i.e. three compact radio sources in the south region of the galaxy cluster (r3, r4 and r5) and an extended emission, r1, in the north part. We report the JVLA fluxes of the identified radio sources in Table 5.
The compact radio sources r5 and r4 are associated with optically detected galaxies for which the redshift is unknown. However, the optical counterpart of r5 is probably a foreground galaxy, since its size at z1.5 would be too large (35 - 50 kpc) compared to a typical galaxy.
On the contrary, the compact radio emission r3 is associated to a group of interacting galaxies hosting an X-ray AGN found to be part of the cluster (object 3 in Tozzi
et al., 2015). Its radio luminosity is , not k-corrected.
Finally, the hourglass-like extended emission , r1, does not show a radio core or a central radio galaxy. It might be associated to one or multiple optical counterparts located in the central narrowing, none of which has a known redshift. The most probable candidate seems the passive galaxy identified by Fassbender et al. 2014 (see zoom-in of Fig. 10). This radio source is spatially correlated to an X-ray north-south elongation reported by Tozzi et al. (2015) and described as evidence of mass accretion onto the cluster. This claim is supported by the presence of three spectroscopically confirmed cluster members (red crosses in figure) located along the north axis (Fassbender et al., 2014).
We extracted the radio spectral index888Defined as . of this source combining JVLA data at 1.5 GHz with a detection from the TGSS at 150 MHz (Intema et al., 2017). We found , steeper than the average spectral index associated with radio galaxy lobes. This might be interpreted as a signature of aged plasma from a remnant radio galaxy. Assuming this radio source at the distance of the cluster, its radio luminosity at 1.5 GHz would be W/Hz, k-corrected assuming the measured . This luminosity is high if compared with typical radio galaxies in local clusters (van Velzen et al., 2012). However, to date we know very little about the typical luminosities of high-redshift radio galaxies in cluster environments. Alternatively, this source might be directly associated to the Intra-Cluster medium (ICM), possibly generated by compression of old plasma bubbles from merging induced shock waves (the so-called "radio phoenixes"; Enßlin & Gopal-Krishna 2001). This would explain the steep spectrum of the source. However, the high luminosity is at odds with what expected for these kind of sources (van Weeren et al., 2019).
| r1 | 3.190.07 |
|---|---|
| r2 | 0.220.03 |
| r3 | 0.160.02 |
| r4 | 0.850.03 |
| r5 | 0.280.03 |