Comparative Computational Analysis of Global Structure in Canonical, Non-Canonical and Non-Literary Texts
Abstract
This study investigates global properties of literary and non-literary texts. Within the literary texts, a distinction is made between canonical and non-canonical works. The central hypothesis of the study is that the three text types (non-literary, literary/canonical and literary/non-canonical) exhibit systematic differences with respect to structural design features as correlates of aesthetic responses in readers. To investigate these differences, we compiled a corpus containing texts of the three categories of interest, the Jena Textual Aesthetics Corpus. Two aspects of global structure are investigated, variability and self-similar (fractal) patterns, which reflect long-range correlations along texts. We use four types of basic observations, (i) the frequency of POS-tags per sentence, (ii) sentence length, (iii) lexical diversity in chunks of text, and (iv) the distribution of topic probabilities in chunks of texts. These basic observations are grouped into two more general categories, (a) the low-level properties (i) and (ii), which are observed at the level of the sentence (reflecting linguistic decoding), and (b) the high-level properties (iii) and (iv), which are observed at the textual level (reflecting comprehension). The basic observations are transformed into time series, and these time series are subject to multifractal detrended fluctuation analysis (MFDFA), giving rise to three statistics: (i) the degree of fractality, (ii) the fractal dimension (width of the fractal spectrum), and (iii) the degree of asymmetry of the fractal spectrum. Our results show that low-level properties of texts are better discriminators than high-level properties, for the three text types under analysis. Canonical literary texts differ from non-canonical ones primarily in terms of variability. Fractality seems to be a universal feature of text, more pronounced in non-literary than in literary texts. While some of our results are hard to interpret from a literary point of view, we surmise that our findings reflect an important design feature of text, the distribution of discourse modes (Narrative, Report, Description, Information, Argument). Beyond the specific results of the study, we intend to open up new perspectives on the experimental study of textual aesthetics.
\helveticabold1 Keywords:
fractality, self-similarity, multifractal DFA, variability, POS tagging, sentence length, lexical diversity, topic modeling
2 Introduction
The goal of the present work is to objectively measure differences in global structure between texts of three categories (non-literary, literary/canonical and literary/non-canonical). To this aim, we introduce and validate various statistical measures that describe the self-similarity (fractality) and variance of specific semantic properties across individual texts. By comparing literary with non-literary texts, and within the group of literary texts, canonical and non-canonical ones, we provide a basis for understanding aesthetic responses of human readers to global properties of text. This line of research follows a similar approach that has been applied successfully in visual aesthetics during the last decade (Brachmann and Redies, 2017). By applying objective statistical measures to literary prose, we introduce computational text analysis into the field of experimental aesthetics (Chatterjee and Vartanian, 2014; Jacobs, 2015).
The founder of experimental aesthetics, Gustav Theodor Fechner, proposed that the aesthetic appeal of visual objects is based on stimulus properties that can be measured in an objective (formalistic) way (Fechner, 1876). A few decades later, Clive Bell (1914) speculated that visual artworks possess a ‘significant form’, which has the potential to elicit an aesthetic response in beholders across art periods and cultures. This notion has been opposed by some (post-)modern philosophers, art critics and psychologists (for example, see Danto, 1981; Leder et al., 2004). They advanced conceptual theories which stipulate that cultural context and content are crucial and sufficient to evaluate artworks. In this modern view of aesthetic experience, traditional concepts like ‘beauty‘ no longer play a prominent role. Pushing this view to the extreme, it has been claimed that any physical object can be a work of art, as long as experts declare it to be an artwork in the appropriate cultural context (Danto, 1981). Nevertheless, the idea that beautiful artworks possess an intrinsic formal structure keeps reappearing even in modern aesthetic theories (for visual stimuli, see Arnheim, 1974). Contemporary versions of such formalist theories (Taylor et al., 2011; Redies et al., 2007) postulate that large sets of visual artworks share image properties that reflect a specific physical structure. For example, it has been suggested that traditional artworks may share regularities in the layout of basic pictorial elements, such as luminance gradients and their orientations (Taylor et al., 2011; Redies et al., 2007). These and other structural image properties have been measured in visual artworks in recent years, and some of them can be used to distinguish traditional artworks from non-art images (for reviews, see Graham and Redies, 2010; Redies, 2015).
In visual aesthetics, a particular focus has been on global image properties of artworks. In contrast to local image properties, such as luminance contrast or color at a given location in an image, global image properties reflect summary statistics of pictorial elements or their relations to each other across an image (for a review, see Brachmann and Redies, 2017). Global statistical image properties seem particularly suitable for studying aesthetic properties because aesthetic concepts such as ‘balanced composition‘ (McManus et al., 1985), ‘good Gestalt‘ (Arnheim, 1974), or ‘visual rightness‘ (Locher et al., 1999) all refer to global image structure (Redies et al., 2017). Examples of global properties characteristic of artworks are an intermediate degree of complexity (Berlyne, 1974; Forsythe et al., 2011), specific color features (Palmer and Schloss, 2010; Mallon et al., 2014), a fractal-like image structure (Taylor et al., 2011), statistical regularities in the Fourier domain (Graham and Field, 2007; Redies et al., 2007), luminance statistics (Graham and Field, 2008), curvature (Bar and Neta, 2006; Bertamini et al., 2016) and regularities in edge orientation distribution (Redies et al., 2012, 2017). Moreover, traditional visual artworks exhibit a high richness and high variability of low-level features that are computed by a Convolutional Neural Network (CNN; Brachmann et al., 2017).
Even though there is no long-standing tradition in empirical textual aesthetics comparable to that of visual aesthetics, the question of objective, measurable properties of texts that reflect aesthetic perception has been raised in various contexts, more or less explicitly. The assumption that aesthetic appeal can be measured is most obvious for poetry, with its interplay of meaning and form as manifested in rhythm and rhyme, and other aspects of poetic form, e.g. alliteration (cf. for instance Jakobson, 1960; Leech, 1969; Jacobs, 2015; Jacobs et al., 2016; Vaughan-Evans et al., 2016; König and Pfister, 2017; Menninghaus et al., 2017; Egan et al., 2020). Relevant studies of prose texts refer to more abstract (global) structural properties of the texts. For example, global statistical properties such as complexity and entropy have been used to study the regularity (Mehri and Lashkari, 2016; Hernández-Gómez et al., 2017) and the quality of texts (Febres and Jaffe, 2017). Fractal analysis has been applied to literary texts (Drożdż and Oświȩcimka, 2015; Mehri and Lashkari, 2016; Chatzigeorgiou et al., 2017), and fractal patterns have been observed in both Western (Drożdż et al., 2016) and Chinese literature (Yang et al., 2016; Chen and Liu, 2018). Cordeiro et al. (2015, 796) claim that “there is a fractal beauty in the text produced by humans” and “that its quality is directly proportional to the degree of self-similarity.”
While the results obtained in the aforementioned studies are still tentative, they suggest that text has structural correlates of aesthetic experience in reading. The starting point of the present study is the hypothesis that these correlates are comparable to those found in vision, and we focus on two global properties, i.e. variability and fractality. Our hypothesis of an analogy between visual and linguistic processing is based on the assumption widely made in cognitive linguistics that “linguistic structure is shaped by domain-general processes” (Diessel, 2019, 23) such as figure-ground segregation and processes of memory retrieval. In other words, linguistic processing is based on the same type of brain activity as the processing of other types of sensory input. The analogy has obvious limitations though. Image data are three-dimensional – two-dimensional matrices with the luminance/color signals as the third dimension – whereas textual data are prima facie one-dimensional when regarded as strings of characters (though even silent reading implies prosody, adding a second dimension, cf. Gross et al. 2014).
Related to this, the processing of propositional information is incremental (Verhuizen et al., 2019), with new information constantly being added while earlier information fades out, being summarized and generalized in the process. A part of the aesthetic experience is thus less immediate and relates to higher levels of processing. Still, reading implies low-level processing activity which can be expected to trigger certain responses to the input signal in the brain.
While the processing of visual information is rather well understood, there is little experimental evidence about how information is processed during reading. The ‘classic’ model – the LaBerge/Samuels model of automatic information processing in reading (cf. LaBerge and Samuels, 1974; Samuels, 1994) – assumes four components, (i) visual memory (VM), (ii) phonological memory (PM), (iii) semantic memory (SM) and (iv) episodic memory (EM). VM and PM are closely connected to sensory experience, i.e. visual and acoustic perception, and they are the input gates to processing in reading. Semantic memory is not only the place where “individual word meanings are produced”, but also “where the comprehension of written messages occurs” (Samuels, 1994, 710). It is thus also responsible for the linguistic process of decoding, including the processing of morphology (word structure) and syntax (sentence structure). Episodic memory – or explicit memory, as we call it – is the place where propositional information is stored, and it is “responsible for putting a time, place and context tag on events and knowledge” (Samuels, 1994, 710).
We assume two levels of processing in reading, a low level of linguistic decoding, and a high level of integrating the propositional information conveyed in the input signal into explicit memory, i.e. comprehension. This is largely analogous to models of language processing for spoken language (see for instance Bornkessel-Schlesewsky and Schlesewsky 2006; Martin 2020). Reading (as well as the processing of spoken language) obviously implies bottom-up as well as top-down processes, and the continuous integration of linguistic information and world knowledge (Verhuizen et al., 2019). For example, the propositional content of a message is a function of its components, while the interpretation of any given word is heavily context-dependent and thus influenced by the surrounding information. This is particularly obvious for figurative language, cf. for instance I.A. Richards’ theory of metaphor (Richards, 1936). While low-level and high-level processing interact in the reading experience, we assume that they are cognitively distinct and have different neural substrates. Evidence for this assumption can be found in experimental work, e.g. using eye-tracking methodology (Weiss et al., 2018; Cook and Wei, 2019).
We hypothesize that the three text types under analysis differ in terms of aesthetic experience during reading. Literary texts are intended to evoke an aesthetic response while non-literary texts are primarily informative. Moreover, we assume that the long-term “success” of canonical literature reflects, to some extent, perceptual or cognitive processes in the reading experience, though literary success obviously depends on other factors as well (cf. Underwood and Sellers 2016).
Given the time-distributed nature of information processing in reading, aesthetic experience is hard to measure experimentally (see, for instance, Cook and Wei, 2019, for discussion). We therefore pursue an observational, rather than experimental approach, assuming that aesthetic responses to a text have structural correlates in the text itself. For a systematic quantitative analysis we have compiled a corpus of literary and non-literary texts, the Jena Textual Aesthetics Corpus (cf. Section 5). The literary texts of this corpus are classified into canonical and non-canonical ones. We use the Corpus of the Canon of Western Literature (Green, 2017), which was compiled on the basis of Bloom (1994) (The Western Canon: The Book and School of the Ages), as a benchmark for canonicity,111Obviously, a literary canon reflects not only properties of the texts themselves, but also attitudes held by the compilers, and aesthetic attitudes to literary works are highly culture specific and, to some extent, learned. These potential objections notwithstanding, we hypothesize that canonical literature is distinguished from non-canonical literature with respect to certain (measurable global) properties reflecting preferences of non-professional as well as professional readers, such as critics and literary scholars. It is an interesting question, beyond the scope of this study, whether a different canon – e.g., a canon of African American Literature (cf. Gates and McKay, 2004) – would yield different results. and use information from international Wikipedia Websites as additional evidence for the higher prestige of canonical (as opposed to non-canonical) authors. In comparing literary texts and non-literary texts, we assume that literary texts are aesthetically more pleasing than non-literary text. The framing of information and linguistic structures can be expected to be different between these text types. Literary and non-literary texts differ in terms of the distribution of ‘modes of discourse’ (Smith, 2003) or, for brevity’s sake, ‘discourse modes’ (cf. also the more traditional term ‘rhetorical mode’; see Newman 1827). Non-literary texts seem to cover all of the modes distinguished by Smith (2003), i.e. the temporal modes Information and Argument as well as the temporal modes Narrative, Report and Description. Literary texts mostly consist of narrative and descriptive parts but also contain elements of internal communication (dialogue, monologue, thoughts). Note also that the differentiation of the modes can be expected to be clearer in non-literary texts, which often have a schematic structure, reflected in labeled (sub-)sections. We surmise that such differences between literary and non-literary texts have reflexes in global structural properties of the texts.
The remainder of this article is organized as follows. Firstly, we provide a list of measurable text properties that may contribute to aesthetic experience in reading (Section 3). Based on these properties, the texts are transformed into time series. Secondly, we introduce methods that capture the distribution of these properties across the time series, with a particular focus on two features (variability and fractality/self-similarity), which we consider as potential mediators of aesthetic experience in reading (Section 4). Thirdly, to examine whether any of these properties are associated with the aesthetics of reading, we compare canonical with non-canonical literary texts as well as literary texts with non-literary ones. The three sub-corpora analyzed are introduced in Section 5. Fourthly, in Section 6, we study how well our new analytical methods and text features can distinguish between the three text categories. Note that this first pilot study is restricted to a subset of text properties and analysis methods that seemed particularly promising to us. A complete analysis of all combinations of properties and methods is beyond the scope of the present work. Finally, in Section 7, we discuss the implications of our preliminary findings and outline research questions that can be addressed with the proposed methods in the future.
3 Measurable properties of text
The central hypothesis of this study is that the aesthetic appeal of texts correlates with measurable structure of the texts. Such properties can be derived from various types of measurements. While all the measurements that we used for our analysis represent global properties of the texts, the basic units of observations are located at different levels of processing. As mentioned in Section 2, we distinguish two levels of processing. The lower level of processing concerns the task of linguistic decoding, which is largely automatic and resorts to implicit knowledge. Aesthetic experience at this level is connected to lexical meaning (e.g. is the imagery congruent and appealing?) and grammatical structure (e.g. is a sentence easy to process?). The higher level of processing concerns the integration of propositional information into explicit memory (comprehension).
In this section, we point out some measurable properties of text that we assume to trigger responses in the human reader: two types of low-level properties (frequencies of part-of-speech tags and sentence length; Subsections 3.1 and 3.2); and two types of high-level properties (lexical diversity and topic distribution; Subsections 3.3 and 3.4). These are the properties that were used in our exploratory studies (cf. Section 6). In addition, we point out two types of properties that can be applied at various levels of text, i.e. embedding vectors and language models (Subsections 3.6 and 3.5). We will not report any results obtained for the latter properties but we suggest that they may be used in future studies. We represent each property as time series that can then be subjected to an analysis of their global structural features, such as variances and fractal features.
3.1 Part-of-Speech Tags
Part-of-speech tags, commonly abbreviated as ‘POS-tags’, represent the syntactic class of a word. To some extent, they reflect syntactic structure. At the most general level, POS-tags classify words into major classes such as ‘noun’, ‘verb’, ‘adjective’ etc., but depending on the specific tagset used, more fine-grained distinctions can be made (e.g. between singular and plural nouns). For the present study, we used the Stanford Tagger (version 3.6.0)222https://nlp.stanford.edu/static/software/tagger.shtml, which assigns words to the classes distinguished by the Penn Treebank tagset.333https://www.ling.upenn.edu/courses/Fall_2003/ling001/penn_treebank_pos.html We determined the frequencies of specific POS-tags per sentence, giving rise to (sets of) time series.
3.2 Sentence Length
Sentence length has been used as a measurement for the study of fractality before by Drożdż et al. (2016), though not for a comparison of text types. It is easy to extract and provides some structural information at the sentence level. Sentence length is highly correlated with the frequency of specific POS-tags in sentences, e.g. the (absolute) number of nouns. In our corpus (Section 5), the average Spearman correlation coefficient of these two time series is 0.86. However, as will be seen, the variability and fractal analysis of these two text properties performs differently in classification of the three different text categories of our corpus (see Section 6).
3.3 Lexical Diversity
The choice of words is one of the most perspicuous properties of a text, and a rich vocabulary is often regarded as a hallmark of good authorship. For example, Simonton (1990) claims that lexical diversity correlates with “aesthetic success”. He analyzed Shakespeare’s sonnets and showed that there is a vocabulary shift from the more “obscure” to the more popular sonnets. Vocabulary and the richness of lexicon has also been found useful in the assessment of writers’ proficiency, for instance in research on second language acquisition (see Laufer and Nation, 1995; Zareva et al., 2005; Yu, 2009). Several metrics have been proposed for measuring lexical diversity. Type-Token Ratio (TTR) is the simplest one, in which the number of distinct words (types) is divided by the length of the text. However, TTR is highly affected by text length. In our experiments (cf. Section 6), we use the Measure for Textual Lexical Diversity (MTLD; McCarthy and Jarvis, 2010), which is more robust because it is less sensitive to text length.
3.4 Topic Distribution
Topic modeling is a method used to analyze the content of texts by revealing hidden topics of documents in a collection. We are interested in the changes of topic distribution along a text (rather than the global topics of a text). To extract the distribution of topics from a text, the text is split into segments and then, to infer the topic distribution, a topic modeling method is applied. Latent Dirichlet Allocation (LDA) (Blei et al., 2003; Griffiths and Steyvers, 2004), the most widely used topic modeling method, or an extension of it can be used for this purpose. For long-range correlations and variability analysis (see Section 4) one can convert the topic distribution of the text into a time series by computing a distance measure, e.g. the Jensen–Shannon divergence, of topic representations of adjacent chunks. It is also possible to analyze the topic distribution matrix in terms of its variability. In Section 6, we will show that patterns of topic distribution vary across texts and can thus be informative for recognizing categories of texts.
3.5 Language Model
Language modeling is an essential part of many language processing tasks such as machine translation, summarization and speech recognition. A language model computes the probability of a sequence of words and predicts the probability of the next word (Jurafsky and Martin, 2009). Language models capture both semantic and structural information, as the probability for a given word to occur is a function of both the surrounding structure and the semantic context. A time series can be created, for example, by calculating the probabilities of consecutive text segments, such as sentences or paragraphs.
3.6 Embedding vectors
More precise ways of making the distribution of linguistic segments measurable have been provided by recent advances in automatic language processing. By applying neural models, distributed representations of words and text have been developed, resulting in an improvement of almost all natural language processing tasks. Embedding vectors – n-dimensional vectors of floats – represent the distribution of a linguistic segment and allow for the computation of (dis)similarities between segments. A wide variety of models have been proposed to represent text at the level of sub-word, word, sentence, etc. (for example, see Pennington et al., 2014; Bojanowski et al., 2017; Devlin et al., 2018). For a study of global text properties, word embeddings can be converted to time series using distance measures, e.g. cosine distance, and analyzed by fractal analysis methods or processed directly using neural or non-neural algorithms.
4 Global measures of variability and self-similarity
In the present section, we introduce ways of analyzing the time series of text properties that were proposed in the previous section. We focus on two global statistical features (variability and self-similarity). These properties have previously been used in visual aesthetics and have been associated with artworks and other visually pleasing stimuli (see Section 2).
Variability reflects the degree to which a particular feature (e.g., edge orientation or color) is likely to vary across an image. Self-similarity is closely related to fractality and scale-invariance. This property reflects the degree to which parts of an image have features similar to the image as a whole, i.e., an image is self-similar if it shows similar features at different scales of resolution. To analyze variability and fractality several methods are available and some of them will be described in the following subsections. Where they have been used in text analysis before, we will briefly outline their previous usage. In Section 6, we will then apply these measures to analyze the time series that were introduced in Section 3 in our corpus of texts (Section 5).
Global statistical measures have been applied to texts before. For example, linguistic laws such as Zipf’s and Heaps’ laws were proposed to provide insights into the internal structure of text (for example, see Baayen, 2002; Serrano et al., 2009). Zipf’s law establishes a power law distribution between word frequencies and ranks of words (according to their frequencies) in texts. It states that a small number of word types accounts for a high percentage of word tokens in a text, while the number of low-frequent words is very high. Another empirical law, Heaps’ law, assumes a power law distribution between the vocabulary size, i.e. the number of distinct words, and the number of words in a document or a corpus. Heaps’ law states that the ratio of the vocabulary size to the length of document(s) decreases drastically as more text is added. These global features, however, have not been used in the context of text aesthetic. These linguistic laws ignore relations between text components and are supposed to be universally valid for different genres of texts.
4.1 Variance
The variability of a property can be measured simply by computing its variance. The variance of a random variable is
| (1) |
denotes the expected value and is the population mean. The variance of, for example, the distribution of sentence length reflects the amount of variation in the length of sentences across a text. Despite its mathematical simplicity, we will see that variance performs effectively in the classification of text categories (Section 6).
4.2 Entropy-Based Methods
Entropy, which is related to variability, measures uncertainty or (ir)regularity of a state or phenomenon represented by a random variable. If is a discrete random variable with a set of possible values and a corresponding probability function , the entropy of is defined as:
Entropy is zero when the state is certain and it is highest when the all possibilities are equally likely to occur, i.e. when uncertainty is maximal. The basic formula of entropy or its extensions have been utilized for text analysis previously.
Rosso et al. (2009) applied statistical complexity and entropy quantifiers to a collection of poems and plays. Their analyses revealed that poems have a higher complexity than plays and Shakepeare’s work is interestingly more homogeneous than that of his contemporaries and is exceptionally close to the average use of words in that time period. Chang et al. (2017) defined the information-based energy, combined from the relative temperature and information Shannon entropy, to quantify text complexity and an author’s performance. Applying this method to texts of an English and an Chinese author, Shakespeare and Jin Yong, they showed that their more popular works have higher information-based energy. Hernández-Gómez et al. (2017) used an entropy-based method, called approximate entropy, to measure the degree of irregularity or randomness in a time series. They applied this method to 14 different languages which belong to four linguistic families: Romance, Germanic, Slavic and Uralic. They showed that the languages exhibit different levels of irregularity which were similar for languages that belonged to the same family. The entropy of word distributions can also be informative for comparing different types of languages in term of word ordering. Montemurro and Zanette (2016) used entropy-based measures to show that word ordering is highly similar over several language families. Febres and Jaffe (2017) studied entropy and symbolic diversity of literary texts of Nobel and non-Nobel laureates in English and Spanish. While they presented some results to show that there is a correlation between these global statistical properties and the quality of writing, they did not classify different groups of texts.
4.3 Box Counting
There are several methods to measure fractality and the scaling behavior of structures. These methods typically represent measurements at different scales. Fractal analysis techniques have been widely applied to images (Wendt and Abry, 2007; Li et al., 2009; Wendt et al., 2009; Ji et al., 2013), including artworks (Taylor, 2002; Redies et al., 2007; Spehar et al., 2016). They are therefore of special interest of analyzing aesthetic phenomena (cf. Section 2).
One of the most widely used fractal analysis methods is box counting, which is mathematically straightforward and easy to apply. Given an object , for a the smallest possible number of subsets with a diameter of at most , , which covers , is found. For 1d objects, subsets are rulers and is their length. For 2d objects, subsets are boxes and is their area, and so forth. The growth ratio of , as , reflects the degree of fractality of . If can be approximated by
for a constant , then is called the box-counting dimension and shows how complex is.
Mehri and Lashkari (2016) applied this method to seven famous text books and computed their degree of fractality by averaging the fractality degrees of word occurrences. The results revealed that all texts are fractal and their fractal dimensions differed slightly. Fractality patterns of time series sometimes do not lend themselves to analysis with a single scaling measure. If different subsets of a time series exhibit different types of scaling behavior, the time series is multifractal. Chatzigeorgiou et al. (2017) used box counting to find the origin of multifractality in the word-length representation of texts in several Western languages. They showed that the long-range correlations in natural language are related to the clustering feature of long words, i.e. rare and often highly informative content words.
4.4 Wavelet-Based Methods
Fractal analysis methods based on wavelets are another family of techniques for studying scale-invariant properties of signals (Muzy et al., 1993; Wendt and Abry, 2007; Leonarduzzi et al., 2016). The wavelet transform (WT) is a method to analyze non-stationary signals. The WT of a signal is defined as (Mallat, 1999):
and it describes the content of around a time parameter and a scale parameter . is the analyzing wavelet whose first moments are zero, i.e. , which makes the WT insensitive to possible polynomial trends of order in the signal, something which is necessary for multifractal analysis (Muzy et al., 1994; Arneodo et al., 1995). The WT modulus maxima (WTMM) is a well-known method for analyzing multifractality and it is based on the WT coefficients. WTMM is defined by the local maxima of according to a given scale . Then the following partition function is defined:
If the signal is monofractal, is independent of . For multifractal signals, the scaling behavior cannot be explained with one value, so, changes for different values of . Based on WT and WTMM, other methods have been extended for discrete and multi-dimensional time series (for example, see Wendt and Abry, 2007; Leonarduzzi et al., 2016). Although wavelet-based methods have been applied to a variety of fields, they have been rarely used in text processing. Leonarduzzi et al. (2017) applied the wavelet p-leader method to the sentence-length series of novels that were written either for young people or adults. The authors showed that the latter category is more diverse in terms of its degree of multifractality.
4.5 Detrended Fluctuation Analysis
Detrended Fluctuation Analysis (DFA) (Peng et al., 1994) and its extension Multi-Fractal DFA (MFDFA) (Kantelhardt et al., 2002) have been widely used in studying long-range correlations in a broad range of research fields, such as biology (Das et al., 2016), economics (Caraiani, 2012), music (Sanyal et al., 2016) and animal song (Roeske et al., 2018). MFDFA can be related to Fourier spectral analysis and both methods provide similar results for the degree of fractality (Heneghan and McDarby, 2000). Moreover, MFDFA has a theoretical and practical connection with wavelet-based methods (Leonarduzzi et al., 2016).
MFDFA is a straightforward, efficient and numerically stable method for multifractal analysis (Oświȩcimka et al., 2006). In the present work, we will apply this method to the fractal analysis of texts. Given a time series , MFDFA can be summarized as follows:
-
1.
Subtract the mean and compute the cumulative sum, called the profile, of the time series:
-
2.
Divide the profile of the signal into windows for different values of
-
3.
Compute the local trend, , which the best fitting line (or polynomial), in each window
-
4.
Calculate the mean square fluctuation of the detrended profile in each window , :
-
5.
Calculate the th order of the mean square fluctuation:
-
6.
Determine the scaling behavior of versus :
The procedure is equivalent to DFA if is fixed at 2. For monofractal time series, is independent of . If a time series is stationary, is equal to the Hurst Exponent, a well-known measure in fractal analysis studies. We refer to this value as , which is the fractal degree of the time series. In the remainder of this text, wherever we use ‘Hurst exponent’ we refer this value, even though the time series may not be stationary. For uncorrelated time series, in which each event is independent of other events, . With increasing above 0.5, the time series is more fractal. In the opposite direction, if the time series is called anti-persistent in which a large value in the time series is most likely followed by a small value, and vice versa.
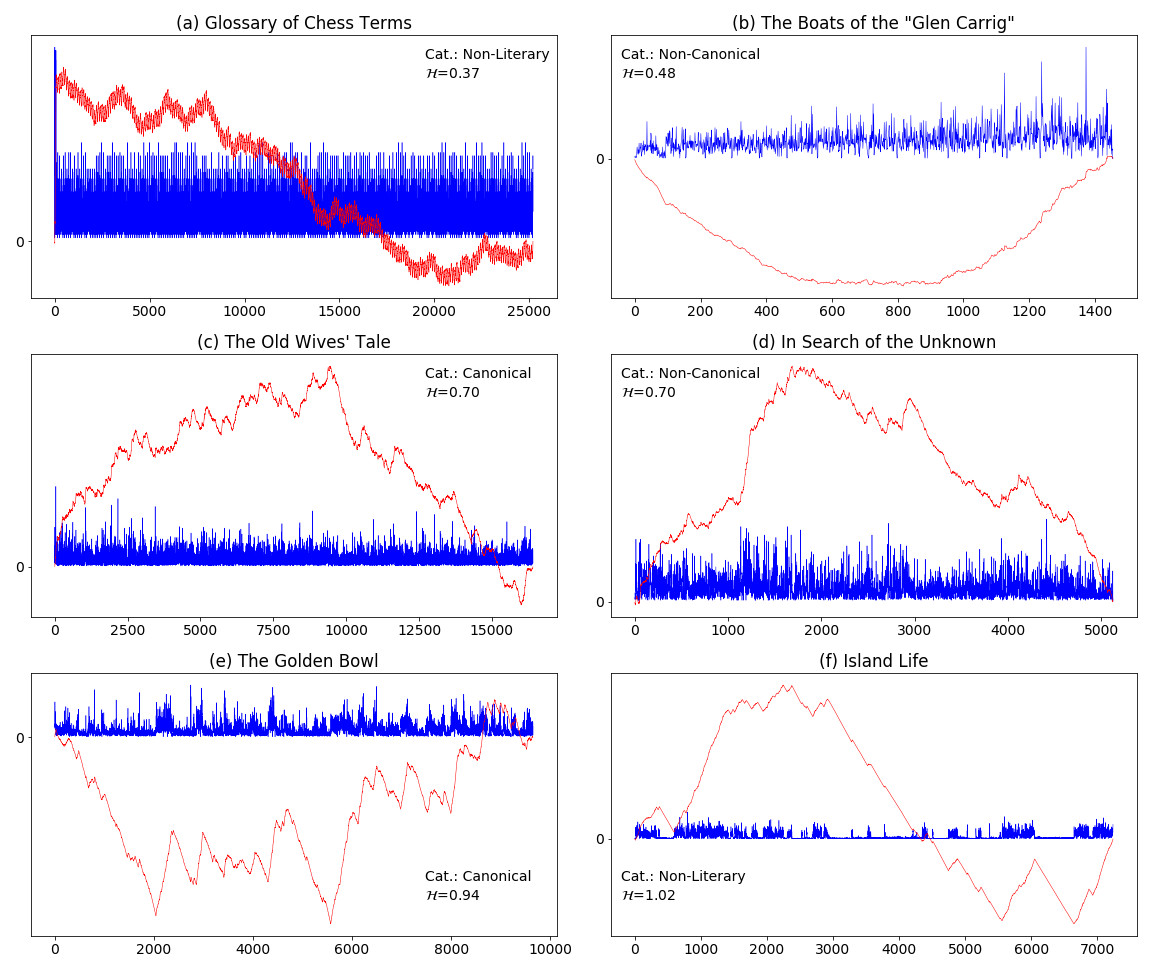
To explain better, we show the sentence-length time series of a few cases in our corpus (Section 5) as well as the profile of each time series in Figure 1 (see step 1 of MFDFA in above). Figure 1(a) represents the time series of the Glossary of Chess Terms by Gregory Zorzos, which is one of the texts in the non-literary categories of our corpus. This is not a usual text but a dictionary-like book consisting of a list of term-values. This example is an anti-persistent text with and an extreme case in the corpus with the lowest fractal degree. Figure 1(b) belongs to The Boats of the “Glen Carrig” by William Hope Hodgson. With , this book has the second lowest and the closest one to 0.5, which shows that there is almost no correlation among the elements of its time series. This book is categorised as a non-canonical text in our corpus. As a side note, the lower bound of fractality for sentence-length time series of canonical texts in the corpus starts from , which is the value measured for Old Mortality by Walter Scott. In Figure 1(c) and 1(d) we show the plots of one canonical and one non-canonical literary book with a median degree of fractality, within the relevant category/sub-corpus. For both The Old Wives’ Tale by Arnold Bennett, a canonical text, and In Search of the Unknown by Robert W. Chambers, a non-canonical text, . Figure 1(e) represents the time series of a canonical text with the highest fractal degree () in the corpus, namely The Golden Bowl by Henry James. Finally, the text with the highest fractality value in the entire corpus is Island Life by Alfred Russel Wallace, which is a non-literary book with .
From , one can compute the fractal dimension and the fractal asymmetry, two metrics that represent the fractal complexity of the time series. From , the Hölder exponents and the singularity spectrum are computed. Then, the fractal dimension is defined as (cf. Kantelhardt et al. 2002; Drożdż et al. 2016). and denote the beginning and the end of , respectively. The fractal asymmetry is also determined from :
where and (Drożdż and Oświȩcimka, 2015). , corresponding to , usually points to the peak of the curve. It is also obvious that . In Section 6, we will use the three values (fractal degree [], fractal dimension [] and fractal asymmetry []) as a basis to classify the three categories of text (canonical, non-canonical and non-literary).
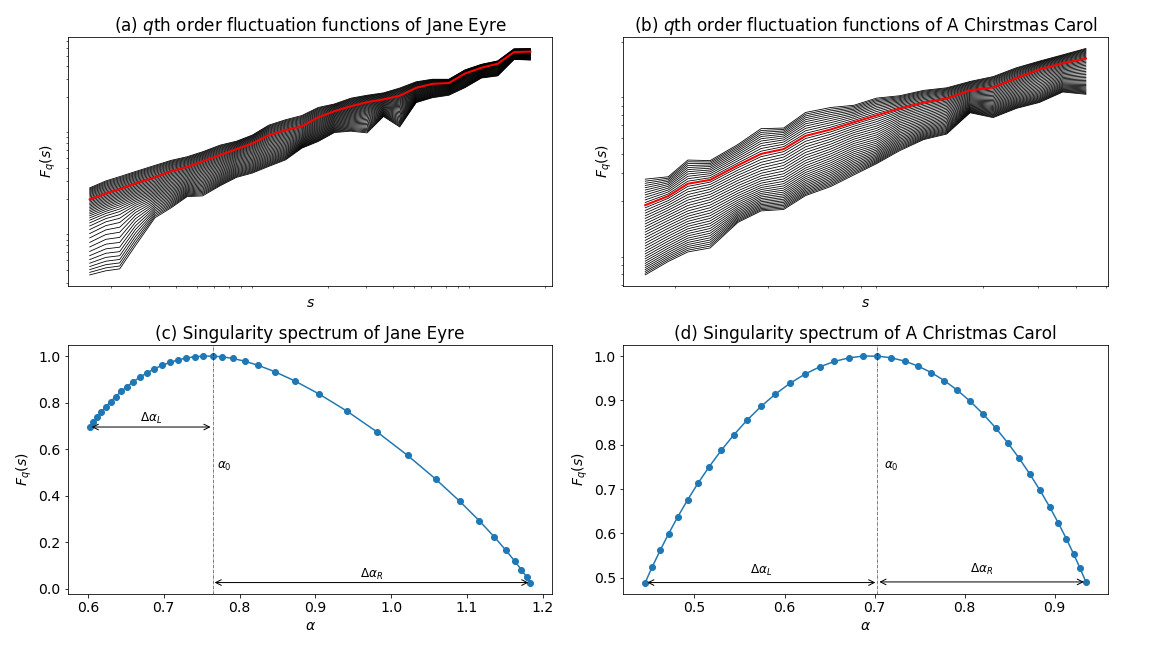
To illustrate these concepts visually, we show the results of the fractal analysis for canonical texts by Charlotte Brontë and Charles Dickens in Figure 2. The two texts have been converted to time series by using the sentence-length property (see Section 3.2 for details). Fig.2(a) and Fig.2(b) show for different values of ranging from to . It is obvious that the slope of the lines, , changes as changes. This result indicates that the texts are multifractal. Jane Eyre written by Charlotte Brontë has a fractal dimension indicating a high degree of multifractality. The figure also shows that the time series has a high fractal asymmetry, (Fig. 2(c)). Figure 2(d) presents the singularity spectrum for A Christmas Carol by Charles Dickens with and , which indicate that the time series of the text is multifractal and (almost) symmetrical.
DFA has been used for text analysis previously, in particular for sentence-length analysis. For example, Drożdż and Oświȩcimka (2015) applied MFDFA to sentence-length time series in comparison with other natural time series (e.g., the discharge of the Missouri river and sunspot number variability) and non-natural time series (e.g., stock market and Forex index prices). The results suggest that natural languages possess a multifractal structure that is comparable to other natural and non-natural phenomena. Yang et al. (2016) investigated long-range correlations in sentence-length series in a famous classic Chinese novel, based on the number of characters in each sentence. This study showed that there was a long-range correlation, though it was weak. A diachronic fractality analysis of word-length in Chinese texts spanning 2,000 years revealed two different long-range correlations regimes for short and large scales (Chen and Liu, 2018). An analysis of the fractal dimension of sentence-length time series in several Western literary texts revealed that, although most literary texts show a long-range correlation, the dimension of fractality can be quite different among them, ranging from monofractal to highly multifractal structure (Drożdż et al., 2016). Although sentence length can be measured in various ways, e.g., by the number of characters or words in unlemmatized and lemmatized texts, the different ways yield robust results that have comparable distributions and similar patterns of long-range correlations (Vieira et al., 2018).
4.6 Fractality and Cross-Correlation Analysis
Fractal analysis can be extended to analyzing more than one time series, in order to find relations between fractal behaviors of multiple time series. Detrended Cross-Correlation Analysis (DCCA) (Podobnik and Stanley, 2008) and Multi-Fractal Detrended Cross-Correlation Analysis (MFDCCA) (Jiang and Zhou, 2011) are two methods for analyzing correlations between two time series. Ghosh et al. (2019) applied MFDCCA, also known as MFDXA, to study correlations between two Tagore’s poems, one written in Bengali and one in English. They found a nonlinear correlation between the poems. In a similar study, birdsong and human speech were compared by computing the mutual information decay of signals and it was concluded that the two vocal communication signals have similar dynamics (Sainburg et al., 2019).
In our experiments, as mentioned above, we focus on the variability and self-similar (fractal) patterns of text properties. We will use variance to analyze variability of texts in our corpus. To analyze fractal patterns, we will focus on the most widely used method (MFDFA). The result of these analyses is used for classification of the categories of text that are introduced in the following section.
5 The corpus
As mentioned in Section 2, we use three sub-corpora representing three major categories: a corpus of canonical literary texts, a corpus of non-canonical literary texts, and a corpus of non-literary texts.
The canonical literary sub-corpus comprises 77 English prose texts, written by 29 different authors, from Period C (1832–1900) and Period D (20th century) of the Corpus of Canonical Western Literature (Green (2017); cf. also Section 2). We selected those texts from the corpus that were sufficiently long for our analysis (at least 35K words).
The non-canonical literary texts were downloaded from e-book publishing sites in the internet. We primarily used www.smashwords.com, an e-book distributor website that is catering to classic texts, independent authors and small press. It offers a large selection of books from several genres and allows downloads in various formats. The books are classified into ‘Fiction’, ‘Nonfiction’, ‘Essays’, ‘Poetry’ and ‘Screenplays’. We selected random books from various prose genres, using the site’s filter to make sure that the books had a specified minimal length as of canonical texts. We further supplemented the corpus of non-canonical books with the lowest rated books on www.goodreads.com and www.feedbooks.com, as well as books with the lowest rates of downloads on the Project Gutenberg site. These books are in the public domain, written mostly between 1880 and 1930 and more than 45K words in length. In this way, we obtained 95 books of non-canonical literature (from as many authors in each case). We made sure to collect non-canonical texts from the same time period as for our canonical sub-corpus to minimize the effect of phenomena such as language change on our analyses. However, collecting “low-quality” non-canonical texts from one century back is not easy as these texts have probably not been preserved or, at least, not digitized. If they survived and are still read, they are likely to be of relatively high quality. Therefore, our non-canonical sub-corpus can be regarded as a topnotch non-canonical and, thus, close to the canonical sub-corpus, which makes our analysis more difficult. Nevertheless, the non-canonical texts selected by us are clearly non-canonical in the sense that they currently do not belong to any canon of literature such as the one that we used for the selection of canonical texts.
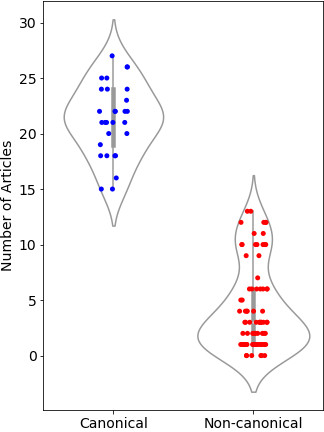
As another discriminating factors between canonical and non-canonical texts, we counted the number of articles that each author has in the top 30 language editions of Wikipedia. This measure is evidence for the international reputation of an author. Figure 3 shows a strip plot for all authors in each category. There is a clear separation between the authors of the two groups. All authors of canonical texts have at least 15 articles each in the 30 Wikipedia editions. In the non-canonical category, each author has up to 13 articles at the most; for the majority of authors, the number is less than 5. These numbers provide independent evidence for the higher degree of prestige (Underwood and Sellers, 2016) of canonical authors, in comparison to non-canonical authors.
To construct our non-literary category we relied on Project Gutenberg. We downloaded all non-literary books and randomly selected 133 books from different genres such as architecture, astronomy, geology, geography, philosophy, psychology, sociology. To increase the diversity, we added the first two volumes of The Encyclopedia Britannica by University of Cambridge and a text called Glossary of Chess Terms by Gregory Zorzos. The latter text was added to our corpus because of its strange and interesting fractal behavior, as discussed in the previous section and shown in Figure 1. The texts of the two literary categories, with the exception of the last one, were published during similar time periods.
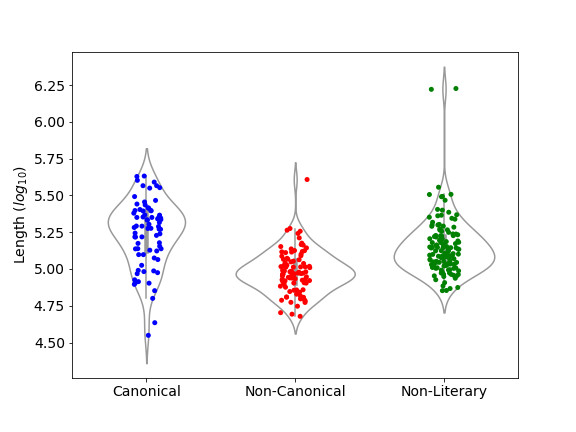
Figure 4 shows the number of tokens per book (i.e. the length of the texts) on a logarithmic scale, grouped into the three categories of interest. The three categories differ somewhat in the distribution of text lengths. The two very long non-literary texts shown in the figure are the two volumes of The Encyclopedia Britannica. It is important to realize that the exact length of a text does not affect the results of our experiments, given that the texts are sufficiently long to be analyzed robustly for their variability or fractal properties.
The texts were tagged manually to eliminate material not belonging to the core text, such as tables of contents and indices. Headers were left in the text, as they are potentially informative. Moreover, the texts were semi-automatically cleaned up using regular expressions to identify (and re-join) hyphenated words at the end of a line. Information about the entire corpus, which we named the ‘Jena Textual Aesthetics Corpus’, is provided in Supplementary Table S1.
The core hypothesis of the present study is that the three different text categories under analysis – non-literary texts, literary/canonical and literary/non-canonical ones – differ in terms of aesthetic responses in the reader, and that these aesthetic responses have measurable correlates in global text structure (cf. Section 3). The Jena Textual Aesthetics Corpus allows us to test this hypothesis, as it contains samples of text from the three categories of interest. In order to compare the text categories, we carried out two binary classification tasks. The first task (Task 1) is to separate the literary from the non-literary works. The second task (Task 2) consists in separating the canonical literary texts from the non-canonical ones. The results are reported in Section 6.
6 Analysis and Classification Results
In this section, we present an analysis of the variability and fractality of structural properties of text as well as the classification results for the three text categories in our corpus. For reasons of space, we have not calculated all measures or features that were proposed in Sections 3 and 4. Instead, we present the results for four textual properties only (POS-tag frequencies, sentence length, lexical diversity and topic distributions). The first two properties are low-level properties while the latter two are high-level properties (see Section 3). The time series derived from these properties have been subjected to a variance analysis as well as an analysis of their fractality, which has been restricted to MFDFA, the most widely-used fractal analysis methods of time series. The original results presented in the present work thus serve as a proof of concept and do not provide a complete coverage of all possible types of analyzing variability and fractality. To the best of our knowledge, the present work is the first to analyze fractality of text using lexical diversity, the frequency of POS-tags and topic distributions, and to utilize variability and fractality analysis to classify text categories.
6.1 Converting Texts into Time Series
POS-tags, sentence length, lexical diversity and topic distribution were introduced in Section 3. For the sake of reproducibility of our results, we will provide further details in the present section on how we calculated the relevant measures and thereby converted the texts to time series.
To convert a text into a time series of POS-tag frequencies, we determined the number of each specific tag in the sentences of the text (see Subsection 3.1). In our analysis, we focused on nouns, adjectives, verbs, and pronouns. Other POSs either did not yield interesting results or occurred too infrequently. For the annotations we used the Stanford POS-tagger (Toutanova et al., 2003). For the calculations, we included all types of nouns, i.e. singular as well as plural nouns and proper names. Several types of verb forms – for example, base forms, past tense forms, gerund, past participles – were all treated as verbs. Adjective includes simple, comparative as well as superlative adjectives. Pronouns are either personal or possessive. We thus obtained four different time series derived from the frequency of POS-tags.
Sentence length is another property of sentences that can be used to generate time series for the purpose of fractal analysis (see Subsection 3.2). To determine the length of a sentence, we first used the NLTK-package (Bird et al., 2009) to sentence-tokenize the texts. The length of each sentence is the number of its tokens. Punctuation marks were not removed, and were counted as elements of sentences.
Lexical diversity measures the richness of vocabulary of a text (see Subsection 3.3). To convert a text into a time series of lexical diversity values, we first segmented the text into chunks that were 100 tokens long, which seems like a good compromise between reliability of the calculations, and the required minimal length for fractal analysis. We then computed MTLD values (McCarthy and Jarvis, 2010) for each chunk to obtain a time series for this feature.
Topic modeling is a high-level analysis of text that focuses on the content conveyed (see Subsection 3.4). To extract the topic distribution of a text, we first segmented the text into coherent chunks using the TopicTiling algorithm (Riedl and Biemann, 2012). Then, we applied the LDA algorithm (Blei et al., 2003; Griffiths and Steyvers, 2004) to all chunks of all texts in the corpus, thus obtaining a topic model. The number of topics, one of the hyperparameters of LDA, was set to 100. The resulting topic model is a statistical model of 100 topic that shows the importance of each word in a topic. Afterwards, the topic model was applied to each chunk of a text to infer the distribution of the 100 topics (the ‘topic probabilities’). In order to convert the vector of topic probabilities to a time series, we calculated the Jensen–Shannon divergence of the topic representations of adjacent chunks.
6.2 Analysis of Variance and Fractality
After generating the time series for the seven text properties for all texts, we calculated the variance, , as a measure of how variable each text property was across each text. Moreover, we used MFDFA to calculate the following fractal features for each text: the degree of fractality (), the fractal dimension () and the degree of fractal asymmetry () (see Subsection 4.5). As Kolmogorov-Smirnov tests revealed that some of the data were not normally distributed, the data was entered into a Wilcoxon test to assess the differences between the three original subcorpora, supplemented by non-parametric Mann-Whitney tests for all (post-hoc) pairwise comparisons. The median values of the variances and fractal features are shown in Table 1 for all three subcorpora of text (canonical, non-canonical and non-literary). In addition, we obtained the same variables for both types of literary text (canonical and non-canonical texts) together, as we distinguish two classification tasks: the distinction between literary versus non-literary texts (Task 1), and between canonical versus non-canonical texts (Task 2; see Section 5).
| Noun | Verb | Adjective | Pronoun | Sentence Length | MTLD | Topic Distribution | ||
| Lit. | 11 (10, 13) | 6.5 (5.6, 7.2) | 2.3 (2.1, 2.8) | 3.3 (3.0, 3.6) | 220 (184, 277) | 376 (361, 391) | 4.5e-3 (4.4e-3, 4.6e-3) | |
| Non-Lit. | 19 (17, 20) | 7.5 (7.0, 8.3) | 4.2 (3.9, 4.5) | 1.9 (1.4, 2.1) | 305 (290, 336) | 322 (295, 348) | 4.8e-3 (4.6e-3, 5.3e-3) | |
| *** | ** | *** | *** | *** | *** | *** | ||
| Can. | 15 (14, 17)2 | 9.0 (7.2, 9.9) | 3.3 (3.0, 3.9)2 | 4.3 (3.7, 5.0)3 | 321 (296, 367) | 390 (375, 408)3 | 4.8e-3 (4.5e-3, 4.9e-3) | |
| Non-Can. | 9.1 (8.1, 10)3 | 5.0 (4.5, 6.0)3 | 1.9 (1.7, 2.1)3 | 2.7 (2.4, 3.0)3 | 163 (145, 194)3 | 357 (345, 381)2 | 4.2e-3 (4.0e-3, 4.5e-3)3 | |
| *** | *** | *** | *** | *** | ** | *** | ||
| Lit. | 0.714 (0.706, 0.725) | 0.66 (0.65, 0.67) | 0.685 (0.677, 0.695) | 0.67 (0.66, 0.68) | 0.70 (0.69, 0.71) | 0.65 (0.64, 0.66) | 0.63 (0.62, 0.65) | |
| Non-Lit. | 0.69 (0.67, 0.71) | 0.72 (0.70, 0.76) | 0.72 (0.70, 0.74) | 0.71 (0.70, 0.73) | 0.73 (0.70, 0.75) | 0.68 (0.66, 0.70) | 0.66 (0.61, 0.69) | |
| * | *** | *** | *** | *** | ||||
| Can. | 0.72 (0.70, 0.73) | 0.67 (0.65, 0.68)3 | 0.69 (0.68, 0.70)1 | 0.67 (0.65, 0.68)3 | 0.70 (0.68, 0.71) | 0.64 (0.63, 0.66)1 | 0.64 (0.61, 0.66) | |
| Non-Can. | 0.71 (0.70, 0.73) | 0.66 (0.64, 0.67)3 | 0.68 (0.67, 0.69)2 | 0.67 (0.65, 0.68)3 | 0.70 (0.68, 0.71) | 0.65 (0.64, 0.66)2 | 0.63 (0.61, 0.65) | |
| Lit. | 0.30 (0.26, 0.32) | 0.20 (0.17, 0.21) | 0.31 (0.28, 0.33) | 0.67 (0.66, 0.68) | 0.26 (0.24, 0.28) | 0.20 (0.17, 0.22) | 0.19 (0.18, 0.21) | |
| Non-Lit. | 0.26 (0.23, 0.31) | 0.37 (0.34, 0.40) | 0.30 (0.25, 0.37) | 0.71 (0.70, 0.73) | 0.34 (0.29, 0.42) | 0.20 (0.18, 0.22) | 0.25 (0.20, 0.28) | |
| *** | *** | *** | ||||||
| Can. | 0.34 (0.32, 0.36) | 0.23 (0.19, 0.25)3 | 0.32 (0.28, 0.34) | 0.67 (0.65, 0.68)3 | 0.31 (0.26, 0.35) | 0.20 (0.16, 0.22) | 0.18 (0.15, 0.21)1 | |
| Non-Can. | 0.26 (0.23, 0.30) | 0.16 (0.15, 0.20)3 | 0.29 (0.27, 0.33) | 0.67 (0.65, 0.68)3 | 0.23 (0.20, 0.25)3 | 0.21 (0.17, 0.23) | 0.20 (0.18, 0.21) | |
| *** | *** | *** | ||||||
| Lit. | 0.03 (-0.05, 0.09) | 0.09 (0.02, 0.14) | 0.04 (-0.03, 0.07) | 0.09 (-0.01, 0.17) | 0.08 (0.01, 0.14) | 0.11 (0.06, 0.18) | 0.15 (0.06, 0.23) | |
| Non-Lit. | 0.24 (0.12, 0.41) | 0.61 (0.55, 0.68) | 0.55 (0.48, 0.66) | 0.36 (0.28, 0.48) | 0.56 (0.45, 0.69) | 0.15 (0.04, 0.28) | 0.09 (-0.04, 0.27) | |
| *** | *** | *** | *** | *** | ||||
| Can. | 0.09 (0.00, 0.13)1 | 0.10 (0.04, 0.16)3 | 0.04 (-0.03, 0.08)3 | 0.16 (0.05, 0.21)2 | 0.13 (0.04, 0.23)3 | 0.10 (0.03, 0.20) | 0.20 (-0.02, 0.27) | |
| Non-Can. | -0.04 (-0.13, 0.06)3 | 0.07 (-0.03, 0.20)3 | 0.04 (-0.07, 0.11)3 | -0.01 (-0.07, 0.20)3 | 0.02 (-0.02, 0.12)3 | 0.12 (-0.06, 0.24) | 0.15 (0.05, 0.26) | |
Table 1 shows that none of the text properties (POS-tag frequencies, sentence length, lexical diversity and topic probabilities) results in significantly different median values for all features (variance and fractality measures) in both tasks. The high-level properties (MTLD and topic distributions) do not vary significantly across text types for the fractal features. However, the variance () is significantly different for all features in both tasks. Strikingly, values are always higher for non-literary texts than for literary texts, except for the values obtained from frequencies of pronouns, and MTLD values. This difference is mainly driven by non-canonical texts. values for canonical texts range in between those for non-literary and non-canonical texts. In some cases (verb frequencies, sentence length and topic distributions), the values for canonical texts are not significantly different from those of non-literary texts, but higher than the values for non-canonical texts.
In summary, in terms of , canonical texts are more similar to non-literary texts than to non-canonical texts. Only for the frequency distribution of pronouns and MTLD values do the canonical texts exhibit the highest values, followed by non-canonical texts and, with even lower values, by non-literary texts. Note that the magnitude of the variances does not reflect the magnitude of mean values for the text properties (cf. Suppl. Table S2 for the mean values).
The degree of fractality, , is of similar magnitude (closer to 0.5) for all text properties for canonical and non-canonical literary texts. By contrast, the values for non-literary texts are generally higher than for either type of literary text (canonical or non-canonical), with the exception of the frequencies of nouns, sentence length and topic distributions. These results suggest that a lower degree of long-range correlations might be a uniform characteristic of literary texts as opposed to non-literary texts, regardless of the status of the literary texts as canonical or non-canonical.
The values for the fractal dimension, , are significantly higher for the frequencies of verbs and pronouns as well as sentence length in non-literary as opposed to literary texts. A comparison of canonical and non-canonical literary texts reveals that the values of canonical texts are consistently higher than or equal to the values for non-canonical texts, even though this tendency reaches statistical significance only for the frequencies of nouns and verbs, as well as sentence length.
The degree of asymmetry, , does not differ between canonical and non-canonical texts. For low-level properties, literary texts are rather symmetrical (i.e. close to 0), and is higher for non-literary texts than for literary texts. For the higher-level properties (MTLD values and topic distributions), values do not vary across the three sub-corpora.
To summarize the observations made above, canonical texts show more variability with respect to the properties measured in our study than non-canonical texts, and are, in this respect, more similar to non-literary texts. However, the lower degree of fractality () suggests that the two types of literary texts display a lower degree of long-range correlations than non-literary texts do. Moreover, canonical texts tend to be more multifractal than non-canonical texts in terms of the frequencies of nouns and verbs, as well as for sentence length (higher ). Unlike in the case of non-literary texts, the fractal spectra of literary texts are rather symmetrical ( is closer to 0).
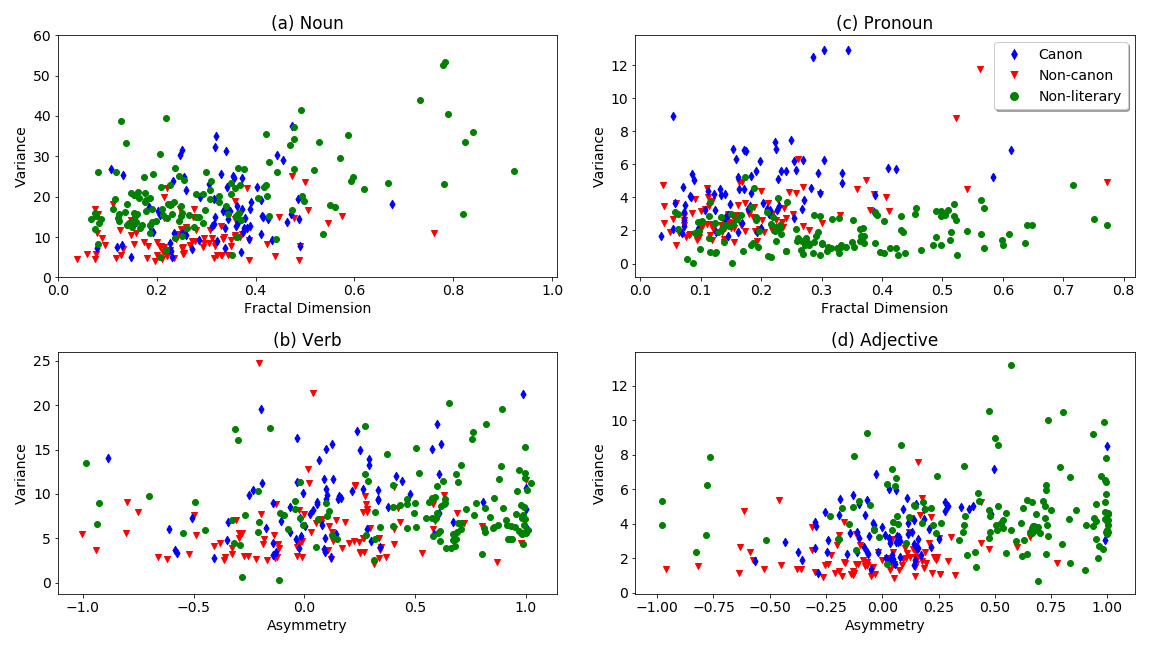
The individual values for the variance (y-axis) and fractal features (x-axis) for selected text properties are shown as scatter plots in Figure 5 to illustrate the separation and overlap between the different text categories. For this figure, we chose plots that showed a relatively clear separation of the text categories by subjective visual inspection. Figure 5(a) shows the fractal dimension and the variance of noun times series. As stated above (Table 1), the variances for non-canonical texts tend to be lower than those of the other two categories. Fig. 5(b) depicts the fractal dimension and the variance of pronoun frequencies; it shows that literary texts tend to have a higher variance compared to non-literary texts. Both Figure 5(a) and Figure 5(b) confirm that non-literary texts scatter in a wider range of the fractal dimension. In Figure 5(c) and Figure 5(d), the variances of verb and adjective time series are plotted as a function of the degree of asymmetry. Fractal patterns of non-literary texts are more asymmetrical (higher ). Again, canonical texts exhibit a wider scatter, as variance is higher compared to non-canonical texts, which suggests more diverse usage of language structures in canonical texts. The behavior of non-literary texts varies across the tags. For example, the texts scatter more widely in the plot of adjectives (Fig. 5[d]), while their pronoun variances cover a narrower range (Fig. 5[d]), since pronouns are not so frequent in non-literary texts (Suppl. Table S2). Figure 5 also illustrates that non-literary texts have a more complex fractal pattern and spread more broadly along the fractal feature (x-)axes. Non-literary texts tend to show a higher fractal degree and more fractal asymmetry than literary texts.
6.3 Classification
While a statistical analysis of features gives insights into the distribution of a single feature (cf. Section 6.2), classification separates classes from each other, potentially in a non-linear fashion, which is a more sensitive way to detect differences between the text categories than a linear analysis of single properties. In this section, we describe the results for the classification of the text categories in detail. As indicated above (see Section 5), we distinguish two classification tasks: Literary texts are classified against non-literary texts (Task 1), and canonical literary texts against non-canonical literary texts (Task 2). Moreover, for a better understanding of the postulated level of text processing, we present results for the low-level and high-level properties separately, as well as in combination (Table 2). For classification, we used a Support Vector Machine (SVM) with a Radial Basis Function (RBF) kernel. As the features have varying scales, we normalized them to have a mean of 0 and standard deviation of 1. The evaluation measure is balanced accuracy, which is a weighted average accuracy value that is proportional to the size of each class and, therefore, does not favor larger classes. We assessed statistical significance of differences between settings by using a 52cv paired test (Dietterich 1998) (significance level at ). In this test, 2-fold cross validation is repeated 5 times and the dataset is shuffled each time. In Table 2, we report the mean and the standard deviation for the 10 runs for each setting.
| Task 1 | Task 2 | |||
| Variability | Fractal Features | Variability | Fractal Features | |
| Noun | 71.0 2.5 | 75.3 2.3 | 69.5 3.8 | 62.4 3.0 |
| Verb | 56.8 3.7 | 75.1 1.5 | 68.3 2.1 | 55.5 3.0 |
| Adjective | 74.1 2.7 | 80.4 2.3 | 69.7 4.0 | 51.6 3.7† |
| Pronoun | 69.5 0.9 | 72.1 1.8 | 68.0 1.9 | 52.2 4.7† |
| Sentence-Length | 65.0 2.2 | 74.0 2.0 | 69.3 2.9 | 59.7 3.2 |
| MTLD | 63.7 2.3 | 56.9 3.2 | 52.3 3.3† | 55.5 3.1 |
| Topic Distribution | 62.8 2.3 | 64.0 3.3 | 60.6 3.4 | 49.2 3.5† |
| Low-Level | 92.4 2.1 | 86.0 2.0 | 71.6 2.6 | 62.9 3.9 |
| Low-Level, Combined | 94.9 1.0 | 71.4 4.8 | ||
| High-Level | 72.4 1.9 | 63.2 3.3 | 63.5 3.2 | 57.1 1.8 |
| High-Level, Combined | 71.8 2.9 | 61.9 4.5 | ||
| Low- & High-Level | 93.6 1.3 | 84.9 1.6 | 73.6 2.3 | 65.0 1.7 |
| Low- & High-Level, Combined | 94.7 1.3 | 71.6 3.6 | ||
The top part of Table 2 shows the classification results for individual properties. On the one hand, the analysis of variability provides comparable accuracies in Task 1 and Task 2. Exceptions are provided by verb frequency, which leads to much higher classification rates in Task 2 than in Task 1, and MTLD values, which are a better predictor in Task 1. The best performance is observed for adjective frequency, which yields the highest accuracy of all predictors in Task 1 and provides the best results in Task 2 as well (see also Table 1). The variance of MTLD values is more powerful in distinguishing literary texts from non-literary text (Task 1), but it cannot separate canonical from non-canonical texts in Task 2. As a lexical diversity measure, MTLD reflects the richness of vocabulary of a text. To get a better understanding of lexical diversity of literary and non-literary texts, we submitted the global MTLD-values of the texts, grouped into the categories ‘non-literary’, ‘literary/canonical’ and ‘literary/non-canonical’, to an ANOVA. The test did not reveal a significant difference between the lexical diversity of the text categories (p=0.68). This finding is surprising, as lexical diversity is often regarded as a hallmark of good authorship, and can thus be expected to vary across the sub-corpora of interest.
The fractal features result in better accuracies in Task 1 than in Task 2 for all properties, with the exception of MTLD, which performs similarly in both tasks. The highest classification rate for Task 1 is, again, obtained for adjective time series (80.4%). The time series of low-level properties, i.e. POS-tags frequencies and sentence length, perform well in Task 1. By contrast, the fractal features cannot distinguish well between canonical and non-canonical literary texts (Task 2). This result is in accordance with the finding that the degree of fractality () and the degree of asymmetry () are of similar magnitude for canonical and non-canonical texts for almost all text properties (cf. Table 1).
The POS-tag frequencies and sentence length are regarded as low-level properties and MTLD and topic distribution as high-level properties. The top part of Table 2 presents the classification results for variance and the fractal features separately. When combining the two features for all low-level and all high-level properties, respectively, as shown in the middle part of the table, a considerably improved accuracy is achieved in Task 1. Although the variance of each property alone does not provide a classification accuracy higher than 74% (for adjective), their combination effectively raises the accuracy up to 92%. Using all fractal features together for the classification task also increases the performance considerably. Finally, when all variances and fractal features are combined, the performance gets even better. Applying 52cv paired test confirms that all of these improvements are significant. In Task 2, we do not observe such a large improvement in accumulating the variances or the fractal features. For example, the performance of a model combining all variances of low-level features is only slightly better than the performance of the variance of noun or adjective frequencies. For the fractal features, the classification accuracy of the combined model is similar to that of noun time series only. The combination of all features does not offer any improvement either.
Similarly, we ran the classification task using all high-level properties. In Task 1 (cf. the middle part of Table 2), the combination of the variances of two high-level properties results in a considerable improvement. In contrast, the combination of the fractal features offers no enhancement in the result and is statistically similar to the performance using topic distribution. It is therefore expected that the combination of all variances and fractal features does not improve classification. Adding more features to an SVM classifier may actually decrease the classification result, because the SVM classifier tries to maximize generalization. Such a decrease is observed when all features are combined together. In Task 2, we observe that the combination of variances of the high-level features improves the classification results, though not for the fractal features. The accumulation of all features does not provide any obvious improvement either.
Low-level and high-level properties can be combined to analyze the different classes of text, as shown at the bottom of Table 2. In Task 1, we observe no improvement when combining all variances or all fractal features. Finally, the result obtained by combining all features is not significantly different from the classifier that was trained on all features (variances and fractal features) of low-level properties. In Task 2, when all variances or all fractal features are taken into account, an improvement can be observed. The combination of all features does not improve the accuracy of the model compared to the model trained on all variances.
In summary, the results of the classification experiment show that low-level properties are more effective in distinguishing literary text from non-literary text (Task 1) than high-level properties. Even individual properties – the frequencies of nouns and verbs – reach accuracies higher than , or even in the case of the fractal features for adjectives. By combining low-level features in the classification task, the accuracy reaches 95%. The accuracy values for Task 2 range between for individual low-level features, and are much lower for high-level features. The performance of the classifier does not improve significantly if the low-level features are combined, and the resulting accuracy score () is not significantly better than the score for adjective frequencies (). This finding points to a strong correlation of the low-level features in Task 2.
7 Discussion and Conclusions
What makes literature aesthetically pleasing? While many researchers have tackled this question by studying the semantics and cultural context of literary text, we focus on the formal structure of text in this study, an approach taken less commonly (cf. Section 2). Specifically, we put forward ideas to generate time series of formal structural text properties (Section 3), and to study the global properties of these time series across individual texts (Section 4). Previous research in visual aesthetics suggests that global features of stimuli, such as fractality and variability, are associated with the aesthetic preference of human observers (cf. Section 2). Here, we propose to analyze similar global features in texts of varying aesthetic claim or prestige (non-literary, literary/canonical and literary/non-canonical texts). For selected text properties that seemed particularly promising to us, we carried out a pilot study to validate our approach towards the analysis of objective (measurable) global features that vary across the three text categories. Such features will be considered as candidate predictors of textual aesthetics. The results of our analyses are briefly summarized in the following subsections.
7.1 Classification of Text Types
We analyzed three subcategories of text, associated with different degrees of aesthetic claim (canonical non-canonical non-literary). An ANOVA revealed differences between the three subcategories for several of the properties and features (Table 1). In addition, we considered two specific tasks for a classification experiment. In Task 1, we compared the two literary text categories (canonical and non-canonical) with the non-literary category and in Task 2, the canonical texts with the non-canonical texts (see Sections 2 and 5). We assumed that global structural features of literary texts are more similar between canonical and non-canonical texts, which would make Task 2 more difficult.
As we expected, Task 1 resulted in higher classification accuracies than Task 2 in general (Table 2). Also, our results show that variability is more effective in classifying canonical, non-canonical, and non-literary texts than the fractal features. Moreover, fractal analysis is less successful in Task 2 than in Task 1. For the variances, classification rates reached a maximum rate of in Task 1 for a combination of all variances, and of in Task 2, respectively. This finding conforms to our expectation that Task 2 is more difficult than Task 1. For the fractal features, the Hurst exponent, , for the frequencies of verbs, adjectives and pronouns (as well as for MTLD) is lower for literary text than for non-literary text (Task 1), and literary texts display more fractal symmetry than non-literary text (Task 1), for all low-level properties. In Task 2, the fractal features do not result in a good separation of canonical vs. non-canonical texts. Accordingly, the values and the asymmetry values () do not differ much between the two literary categories for any of the text properties analyzed (Table 1). We thus conclude that canonical and non-canonical texts differ less in their global structural features than literary and non-literary texts.
7.2 Low-Level and High-Level Properties
The present findings show that, in general, the structural analysis of low-level properties (POS-tag frequencies and sentence length) results in a better separation of the three text categories than the analysis of high-level properties (MTLD and topic distribution). Regarding MTLD, it is important to note that lexical diversity is often regarded as a hallmark of good authorship. However, our analyses showed that literary texts do not make use of a broader range of vocabulary than non-literary texts; neither has such difference been observed for canonical as opposed to non-canonical texts. Considering the high-level properties, only one of the four features studied, the variance , showed differences between the text categories. No differences were observed for any of the fractal features, except for the Hurst exponents for literary and non-literary texts (cf. Table 1). Accordingly, classification rates obtained by using the high-level properties are relatively low (up to ; cf. Table 2). By contrast, for the low-level properties, we observe differences between the text categories, both in terms of their variances and their fractal features. Low-level properties yield higher classification rates both individually (up to ; cf. Table 2) and in combination (up to ).
At first glance it may seem surprising that the global distribution of low-level properties leads to a better separation of the text categories than the high-level properties. However, low-level properties have been associated with aesthetic preference in other sensory domains as well. In the visual domain, the global spatial distribution of several low-level properties (for example, luminance changes, edge orientations, curvilinear shape and color features; see Section 2) has been related to the global structure of traditional artworks and other preferred visual stimuli. In the auditory domain, music has been shown to be characterized by fluctuations in low-level features, such as loudness and pitch (Voss and Clarke, 1975), frequency intervals (Hsü and Hsü, 1991), sound amplitude (Kello et al., 2017; Roeske et al., 2018), and other simple metrices, such as measures of pitch, duration, melodic intervals and harmonic intervals (Manaris et al., 2005), as well as patterns of consonance (Wu et al., 2015). These and many other studies indicate that low-level properties of music show long-range correlations that are scale-invariant and obey a power law. Interestingly, similar results were obtained for animal song (Kello et al., 2017; Roeske et al., 2018).
We surmise that low-level properties of text primarily reflect discourse modes (Smith, 2003). These modes – Narrative, Report, Description (temporal), Information and Argument (atemporal) – are associated with different frequency distributions of POS-tags (cf. also Biber 1995, who uses more specific categories in his multi-dimensional register analysis, however). For example, the Narrative mode is associated with verbs, while Description requires more adjectives. In a comparison of literary and non-literary text, it is moreover important to bear in mind that literary text implies both external communication (between the narrator and the reader) and internal communication (between the protagonists, in the form of dialogues) as well as internal monologues and thoughts. Our results suggest that non-literary texts show more global variability between discourse modes than literary texts, while the time series are smoother, pointing to more local homogeneity (clearer structural differentiation as reflected in hierarchical text structure). Canonical literary texts seem to pattern with non-literary texts in terms of their higher global variability, in comparison to non-canonical literature. While this hypothesis requires more (qualitative) in-depth studies, it suggests that canonical authors may use a richer variety of discourse modes than non-canonical authors.
7.3 Variability Versus Fractal Features
Our results show that global variability, operationalized as variance, is an important feature that distinguishes canonical from non-canonical texts. In general, the variability of canonical texts is higher than the variability of non-canonical texts, for all properties investigated by us. The pattern concerning the variability of non-literary texts in comparison to literary texts is less uniform. For most properties, variability is higher for non-literary than for literary texts. As a result, the variability of canonical texts is closer to (or the same as) that of non-literary texts. Only for pronoun frequencies and MTLD values can a different pattern be observed. Here, canonical texts are more variable than both non-canonical and non-literary texts.
A direct comparison with the visual domain is difficult due to the different dimensions and study paradigms used in visual and literary studies. Nevertheless, the formal structure of traditional visual artworks was also described as particularly rich and variable, compared to other types of natural and man-made objects and scenes (Brachmann and Redies, 2017; Redies and Brachmann, 2017).
MFDFA, the method used by us to detect multi-fractal patterns, has shown that long-range correlations are less pronounced in literary texts than in non-literary texts, for all properties except sentence length and topic distributions. Moreover, the similarity of the Hurst exponent, , of all text properties for canonical and non-canonical texts suggests that a particular degree of fractality could be a universal characteristic of different categories of literary texts, regardless of the specific text category. The fact that non-literary texts seem to exhibit a higher degree of fractality than literary ones could be related to the smoother signal, reflecting local homogeneity (in terms of discourse modes), as pointed out above.
In the visual domain, traditional artworks can be characterized by an intermediate to high degree of self-similarity (Braun et al., 2013; Brachmann and Redies, 2017). In the Fourier domain, large subsets of traditional artworks have spectral properties similar to pink noise, with a power () spectral exponent around (Graham and Field, 2007; Redies et al., 2007), which is also characteristic of many (but not all) natural patterns and scenes (Tolhurst et al., 1992). In MFDFA, this corresponds to a Hurst exponent of , while indicates white noise (no long-range correlations; corresponding to a Fourier power spectral exponent of ). The median value for the different text properties ranges from to in our study, confirming previous results for sentence length by (Drożdż et al., 2016). This degree of self-similarity thus lies in between that of most natural signals and random (white) noise. The relevance of this finding requires further exploration. In particular, detailed qualitative studies of individual texts will be required to gain a better understanding of the distributional factors giving rise to fractal patterns.
7.4 Generalization and Future Directions
While our study has led to some non-trivial results, it has some obvious limitations. First, we investigated English texts only, and these texts were taken from a restricted time period (19th and early 20th centuries). In order to investigate whether any of the present findings can be generalized to other types of literary texts, other languages and other time periods would have to be investigated separately. If variability and fractality do not represent universal characteristics of literary texts, they might still be useful to distinguish different literary styles or genres, and perhaps texts from different epochs or cultures.
Our sample of texts has been deliberately limited to prose. We did not study poetry, for several reasons. First, several of the features analyzed in the present study require long texts, which are uncommon in poetry. Studying fractality of time series is possible if they are long enough to potentially exhibit long-range correlation. To study poetry, our analysis tools would thus have to be adapted to short texts. Second, the aesthetics of poetry can only be studied in relation to metre and other prodosic properties (e.g. rhyme), and thus requires an entirely different approach.
A number of questions for future studies arise from a medical point of view. Does brain damage have an impact on patterns of variability and fractality in texts? Such effects have been observed in the visual domain. For example, dementia and cerebral stroke have been shown to alter artistic creativity (Miller et al., 1998; Sherwood, 2012). Changes in low-level image properties have also been observed in the art produced by persons with schizophrenia, (Henemann et al., 2017).
Our results suggest that high-level properties are less distinctive than low-level properties for distinguishing both literary as opposed to non-literary texts, and canonical as opposed to non-canonical texts. However, it is obviously possible that there are other ways of operationalizing and measuring high-level features that we have not taken into consideration. Identifying other methods that reflect propositional information and comprehension is thus an important task for future studies. In the visual domain, it is generally agreed that both the formal properties as well as the content and context of aesthetical stimuli can contribute to their liking by human observers (Chatterjee and Vartanian, 2014; Redies, 2015).
Another limitation is that, while we have provided a broad list of possible text properties and global features, we did not study all of their combinations, due to limitations of space and time. Instead, we focused on a set of properties and features that seemed particularly promising to us. Indeed, the low-level properties that we selected proved efficient in the classification tasks. However, using high-level properties, such as MTLD and topic distribution did not yield high classification rates. Studying other text properties and their combination is thus another important future line of research.
References
- Arneodo et al. (1995) Arneodo, A., Bacry, E., and Muzy, J. (1995). The thermodynamics of fractals revisited with wavelets. Physica A: Statistical Mechanics and Its Applications 213, 232 – 275. 10.1016/0378-4371(94)00163-N
- Arnheim (1974) Arnheim, R. (1974). Art and Visual Perception: A Psychology of the Creative Eye (Berkeley: University of California Press)
- Baayen (2002) Baayen, R. H. (2002). Word Frequency Distributions, vol. 18 (Berlin: Springer Science & Business Media)
- Bar and Neta (2006) Bar, M. and Neta, M. (2006). Humans prefer curved visual objects. Psychological Science 17, 645–648. 10.1111/j.1467-9280.2006.01759.x
- Bell (1914) Bell, C. (1914). Art (London: Chatoo & Windus)
- Berlyne (1974) Berlyne, D. E. (1974). Studies in the New Experimental Aesthetics: Steps Toward an Objective Psychology of Aesthetic Appreciation. (New York: Hemisphere). 10.2307/3394907
- Bertamini et al. (2016) Bertamini, M., Palumbo, L., Gheorghes, T. N., and Galatsidas, M. (2016). Do observers like curvature or do they dislike angularity? British Journal of Psychology 107, 154–178
- Biber (1995) Biber, D. (1995). Dimensions of Register Variation. A Cross-linguistic Comparison (Cambridge: Cambridge University Press)
- Bird et al. (2009) Bird, S., Klein, E., and Loper, E. (2009). Natural Language Processing with Python (Sebastopol, CA: O’Reilly Media, Inc.), 1st edn.
- Blei et al. (2003) Blei, D. M., Ng, A. Y., and Jordan, M. I. (2003). Latent dirichlet allocation. Journal of Machine Learning Research 3, 993–1022
- Bloom (1994) Bloom, H. (1994). The Western Canon: The Books and School of the Ages (New York: Harcourt)
- Bojanowski et al. (2017) Bojanowski, P., Grave, E., Joulin, A., and Mikolov, T. (2017). Enriching word vectors with subword information. Transactions of the Association for Computational Linguistics 5, 135–146. 10.1162/tacl_a_00051
- Bornkessel-Schlesewsky and Schlesewsky (2006) Bornkessel-Schlesewsky, I. and Schlesewsky, M. (2006). The extended argument dependency model: A neurocognitive approach to sentence comprehension across languages. Psychological Review 113, 787–821. 10.1037/0033-295X.113.4.787
- Brachmann et al. (2017) Brachmann, A., Barth, E., and Redies, C. (2017). Using CNN features to better understand what makes visual artworks special. Frontiers in Psychology 8, 830. 10.3389/fpsyg.2017.00830
- Brachmann and Redies (2017) Brachmann, A. and Redies, C. (2017). Computational and experimental approaches to visual aesthetics. Frontiers in Computational Neuroscience 11, 102. 10.3389/fncom.2017.00102
- Braun et al. (2013) Braun, J., Amirshahi, S. A., Denzler, J., and Redies, C. (2013). Statistical image properties of print advertisements, visual artworks and images of architecture. Frontiers in Psychology 4, 808. 10.3389/fpsyg.2013.00808
- Caraiani (2012) Caraiani, P. (2012). Evidence of multifractality from emerging european stock markets. PloS ONE 7, 1–9. 10.1371/journal.pone.0040693
- Chang et al. (2017) Chang, M.-C., Yang, A. C.-C., Stanley, H. E., and Peng, C.-K. (2017). Measuring information-based energy and temperature of literary texts. Physica A: Statistical Mechanics and Its Applications 468, 783 – 789. 10.1016/j.physa.2016.11.106
- Chatterjee and Vartanian (2014) Chatterjee, A. and Vartanian, O. (2014). Neuroaesthetics. Trends in Cognitive Sciences 18, 370 – 375. 10.1016/j.tics.2014.03.003
- Chatzigeorgiou et al. (2017) Chatzigeorgiou, M., Constantoudis, V., Diakonos, F., Karamanos, K., Papadimitriou, C., Kalimeri, M., et al. (2017). Multifractal correlations in natural language written texts: Effects of language family and long word statistics. Physica A: Statistical Mechanics and Its Applications 469, 173 – 182. 10.1016/j.physa.2016.11.028
- Chen and Liu (2018) Chen, H. and Liu, H. (2018). Quantifying evolution of short and long-range correlations in chinese narrative texts across 2000 years. Complex. 2018, 9362468. 10.1155/2018/9362468
- Cook and Wei (2019) Cook, A. E. and Wei, W. (2019). What can eye movements tell us about higher level comprehension? Vision 3, 45–61. 10.3390/vision3030045
- Cordeiro et al. (2015) Cordeiro, J., Inácio, P. R. M., and Fernandes, D. A. B. (2015). Fractal beauty in text. In Progress in Artificial Intelligence, eds. F. Pereira, P. Machado, E. Costa, and A. Cardoso (Cham: Springer International Publishing), 796–802
- Danto (1981) Danto, A. C. (1981). The Transfiguration of the Commonplace: A Philosophy of Art (Cambridge: Harvard University Press)
- Das et al. (2016) Das, N. K., Dey, R., Chakraborty, S., Panigrahi, P., and Ghosh, N. (2016). Probing multifractality in depth-resolved refractive index fluctuations in biological tissues using backscattering spectral interferometry. Journal of Optics 18. 10.1088/2040-8978/18/12/125301
- Devlin et al. (2018) Devlin, J., Chang, M.-W., Lee, K., and Toutanova, K. (2018). Bert: Pre-training of deep bidirectional transformers for language understanding. arXiv:1810.04805 [preprint] Available at: https://arxiv.org/abs/1810.04805
- Diessel (2019) Diessel, H. (2019). The Grammar Network. How Linguistic Structure is Shaped by Language Use (Cambridge: Cambridge University Press)
- Dietterich (1998) Dietterich, T. G. (1998). Approximate statistical tests for comparing supervised classification learning algorithms. Neural Computation 10, 1895–1923
- Drożdż and Oświȩcimka (2015) Drożdż, S. and Oświȩcimka, P. (2015). Detecting and interpreting distortions in hierarchical organization of complex time series. Physical Review E 91, 030902. 10.1103/physreve.91.030902
- Drożdż et al. (2016) Drożdż, S., Oświȩcimka, P., Kulig, A., Kwapień, J., Bazarnik, K., Grabska-Gradzińska, I., et al. (2016). Quantifying origin and character of long-range correlations in narrative texts. Information Sciences 331, 32 – 44. 10.1016/j.ins.2015.10.023
- Egan et al. (2020) Egan, C., Cristino, F., Payne, J. S., Thierry, G., and Jones, M. W. (2020). How alliteration enhances conceptual–attentional interactions in reading. Cortex 124, 111 – 118. 10.1016/j.cortex.2019.11.005
- Febres and Jaffe (2017) Febres, G. and Jaffe, K. (2017). Quantifying structure differences in literature using symbolic diversity and entropy criteria. Journal of Quantitative Linguistics 24, 16–53. 10.1080/09296174.2016.1169847
- Fechner (1876) Fechner, G. T. (1876). Vorschule der Ästhetik (Leipzig: Breitkopf and Härtel)
- Forsythe et al. (2011) Forsythe, A., Nadal, M., Sheehy, N., Cela-Conde, C. J., and Sawey, M. (2011). Predicting beauty: fractal dimension and visual complexity in art. British Journal of Psychology 102, 49–70. 10.1348/000712610X498958
- Gates and McKay (2004) Gates, H. L. and McKay, N. Y. (eds.) (2004). The Norton Anthology of African American Literature (New York: W.W. Norton & Co), 2nd edn.
- Ghosh et al. (2019) Ghosh, D., Chakraborty, S., and Samanta, S. (2019). Study of translational effect in tagore’s gitanjali using chaos based multifractal analysis technique. Physica A: Statistical Mechanics and Its Applications 523, 1343 – 1354. 10.1016/j.physa.2019.04.171
- Graham and Field (2007) Graham, D. and Field, D. (2007). Statistical regularities of art images and natural scenes: Spectra, sparseness and nonlinearities. Spatial Vision 21, 149–164. 10.1163/156856807782753877
- Graham and Field (2008) Graham, D. J. and Field, D. J. (2008). Variations in intensity statistics for representational and abstract art, and for art from the eastern and western hemispheres. Perception 37, 1341–1352. 10.1068/p5971
- Graham and Redies (2010) Graham, D. J. and Redies, C. (2010). Statistical regularities in art: Relations with visual coding and perception. Vision Research 50, 1503–1509. 10.1016/j.visres.2010.05.002
- Green (2017) Green, C. (2017). Introducing the corpus of the canon of western literature: A corpus for culturomics and stylistics. Language and Literature 26, 282–299. 10.1177/0963947017718996
- Griffiths and Steyvers (2004) Griffiths, T. L. and Steyvers, M. (2004). Finding scientific topics. Proceedings of the National Academy of Sciences 101, 5228–5235. 10.1073/pnas.0307752101
- Gross et al. (2014) Gross, J., Millett, A., Bartek, B., Bredell, K., and Winegard, B. (2014). Evidence for prosody in silent reading. Reading Research Quarterly 49, 189–208. 10.1002/rrq.67
- Heneghan and McDarby (2000) Heneghan and McDarby (2000). Establishing the relation between detrended fluctuation analysis and power spectral density analysis for stochastic processes. Physical Review E 62 5 Pt A, 6103–10. 10.1103/physreve.62.6103
- Henemann et al. (2017) Henemann, G. M., Brachmann, A., and Redies, C. (2017). Statistical image properties in works from the prinzhorn collection of artists with schizophrenia. Frontiers in Psychiatry 8, 273. 10.3389/fpsyt.2017.00273
- Hernández-Gómez et al. (2017) Hernández-Gómez, C., Basurto-Flores, R., Obregón-Quintana, B., and Guzmán-Vargas, L. (2017). Evaluating the irregularity of natural languages. Entropy 19, 521. 10.3390/e19100521
- Hsü and Hsü (1991) Hsü, K. and Hsü, A. (1991). Self-similarity of the “1/f noise” called music. Proceedings of the National Academy USA 88, 3507–3509. 10.1073/pnas.88.8.3507
- Jacobs (2015) Jacobs, A. M. (2015). Neurocognitive poetics: methods and models for investigating the neuronal and cognitive-affective bases of literature reception. Frontiers in Human Neuroscience 9, 186. 10.3389/fnhum.2015.00186
- Jacobs et al. (2016) Jacobs, A. M., Lüdtke, J., Aryani, A., Meyer-Sickendieck, B., and Conrad, M. (2016). Mood-empathic and aesthetic responses in poetry reception. A model-guided, multilevel, multimethod approach (Amsterdam: John Benjamins)
- Jakobson (1960) Jakobson, R. (1960). Linguistics and poetics. In Style in Language (Cambridge, MA: MIT Press). 350–377
- Ji et al. (2013) Ji, H., Yang, X., Ling, H., and Xu, Y. (2013). Wavelet domain multifractal analysis for static and dynamic texture classification. IEEE Transactions on Image Processing 22, 286–299. 10.1109/TIP.2012.2214040
- Jiang and Zhou (2011) Jiang, Z.-Q. and Zhou, W.-X. (2011). Multifractal detrending moving-average cross-correlation analysis. Physical Review E 84. 10.1103/PhysRevE.84.016106
- Jurafsky and Martin (2009) Jurafsky, D. and Martin, J. H. (2009). Speech and Language Processing (2nd Edition) (Upper Saddle River, NJ: Prentice Hall)
- Kantelhardt et al. (2002) Kantelhardt, J. W., Zschiegner, S. A., Koscielny-Bunde, E., Havlin, S., Bunde, A., and Stanley, H. (2002). Multifractal detrended fluctuation analysis of nonstationary time series. Physica A: Statistical Mechanics and Its Applications 316, 87 – 114. 10.1016/S0378-4371(02)01383-3
- Kello et al. (2017) Kello, C. T., Bella, S. D., Médé, B., and Balasubramaniam, R. (2017). Hierarchical temporal structure in music, speech and animal vocalizations: jazz is like a conversation, humpbacks sing like hermit thrushes. Journal of the Royal Society, Interface 14. 10.1098/rsif.2017.0231
- König and Pfister (2017) König, E. and Pfister, M. (2017). Literary Analysis and Linguistics (Berlin: Erich Schmidt Verlag)
- LaBerge and Samuels (1974) LaBerge, D. and Samuels, S. J. (1974). Toward a theory of automatic information processing in reading. Cognitive Psychology 6, 293–323. 10.1016/0010-0285(74)90015-2
- Laufer and Nation (1995) Laufer, B. and Nation, P. (1995). Vocabulary size and use: Lexical richness in l2 written production. Applied Linguistics 16, 307–322. 10.1093/applin/16.3.307
- Leder et al. (2004) Leder, H., Belke, B., Oeberst, A., and Augustin, D. (2004). A model of aesthetic appreciation and aesthetic judgments. British Journal of Psychology 95, 489–508. 10.1348/0007126042369811
- Leech (1969) Leech, G. N. (1969). A Linguistic Guide to English Poetry (London: Harlow, Longmans)
- Leonarduzzi et al. (2017) Leonarduzzi, R., Abry, P., Jaffard, S., Wendt, H., Gournay, L., Kyriacopoulou, T., et al. (2017). P-leader multifractal analysis for text type identification. In 2017 IEEE International Conference on Acoustics, Speech and Signal Processing (ICASSP). 4661–4665. 10.1109/ICASSP.2017.7953040
- Leonarduzzi et al. (2016) Leonarduzzi, R., Wendt, H., Abry, P., Jaffard, S., Melot, C., Roux, S., et al. (2016). p-exponent and p-leaders, Part II: Multifractal analysis. relations to detrended fluctuation analysis. Physica A: Statistical Mechanics and Its Applications 448, 319 – 339. 10.1016/j.physa.2015.12.035
- Li et al. (2009) Li, J., Du, Q., and Sun, C. (2009). An improved box-counting method for image fractal dimension estimation. Pattern Recognition 42, 2460 – 2469. 10.1016/j.patcog.2009.03.001
- Locher et al. (1999) Locher, P. J., Stappers, P. J., and Overbeeke, K. (1999). An empirical evaluation of the visual rightness theory of pictorial composition. Acta Psychologica 103, 261–280. 10.1016/S0001-6918(99)00044-X
- Mallat (1999) Mallat, S. (1999). A Wavelet Tour of Signal Processing (2. ed.). (Cambridge: Academic Press)
- Mallon et al. (2014) Mallon, B., Redies, C., and Hayn-Leichsenring, G. U. (2014). Beauty in abstract paintings: perceptual contrast and statistical properties. Frontiers in Human Neuroscience 8, 161. 10.3389/fnhum.2014.00161
- Manaris et al. (2005) Manaris, B., Romero, J., Machado, P., Krehbiel, D., Hirzel, T., Pharr, W., et al. (2005). Zipf’s law, music classification, and aesthetics. Computer Music Journal 29, 55–69. 10.1162/comj.2005.29.1.55
- Martin (2020) Martin, A. (2020). A compositional neural architecture for language. Journal of Cognitive Neuroscience 32, 1407–1428. 10.1162/jocn_a_01552
- McCarthy and Jarvis (2010) McCarthy, P. M. and Jarvis, S. (2010). MTLD, vocd-D, and HD-D: A validation study of sophisticated approaches to lexical diversity assessment. Behavior Research Methods 42, 381–392. 10.3758/BRM.42.2.381
- McManus et al. (1985) McManus, I., Edmondson, D., and Rodger, J. (1985). Balance in pictures. British Journal of Psychology 76, 311–324. 10.1111/j.2044-8295.1985.tb01955.x
- Mehri and Lashkari (2016) Mehri, A. and Lashkari, S. M. (2016). Power-law regularities in human language. The European Physical Journal B 89, 241. 10.1140/epjb/e2016-70423-9
- Menninghaus et al. (2017) Menninghaus, W., Wagner, V., Wassiliwizky, E., Jacobsen, T., and Knoop, C. (2017). The emotional and aesthetic powers of parallelistic diction. Poetics 63. 10.1016/j.poetic.2016.12.001
- Miller et al. (1998) Miller, B., Cummings, J., Mishkin, F., Boone, K., Prince, F., Ponton, M., et al. (1998). Emergence of artistic talent in frontotemporal dementia. Neurology 51, 978–982. 10.1212/wnl.51.4.978
- Montemurro and Zanette (2016) Montemurro, M. A. and Zanette, D. H. (2016). Complexity and universality in the long-range order of words. In Creativity and Universality in Language, eds. M. Degli Esposti, E. G. Altmann, and F. Pachet (Cham: Springer). 27–41. 10.1007/978-3-319-24403-7_3
- Muzy et al. (1993) Muzy, J.-F., Bacry, E., and Arneodo, A. (1993). Multifractal formalism for fractal signals: The structure-function approach versus the wavelet-transform modulus-maxima method. Physical Review E 47, 875–884. 10.1103/PhysRevE.47.875
- Muzy et al. (1994) Muzy, J.-F., Bacry, E., and Arneodo, A. (1994). The multifractal formalism revisited with wavelets. International Journal of Bifurcation and Chaos 4, 245–302. 10.1142/S0218127494000204
- Newman (1827) Newman, S. (1827). A Practical System of Rhetoric (New York: Mark H. Newman)
- Oświȩcimka et al. (2006) Oświȩcimka, P., Kwapień, J., and Drożdż, S. (2006). Wavelet versus detrended fluctuation analysis of multifractal structures. Physical Review E 74. 10.1103/PhysRevE.74.016103
- Palmer and Schloss (2010) Palmer, S. E. and Schloss, K. B. (2010). An ecological valence theory of human color preference. Proceedings of the National Academy of Sciences USA 107, 8877–8882. 10.1073/pnas.0906172107
- Peng et al. (1994) Peng, C.-K., Buldyrev, S. V., Havlin, S., Simons, M., Stanley, H. E., and Goldberger, A. L. (1994). Mosaic organization of DNA nucleotides. Physical Review E 49, 1685–1689. 10.1103/physreve.49.1685
- Pennington et al. (2014) Pennington, J., Socher, R., and Manning, C. (2014). Glove: Global vectors for word representation. In Proceedings of the 2014 Conference on Empirical Methods in Natural Language Processing (EMNLP). 1532–1543. 10.3115/v1/D14-1162
- Podobnik and Stanley (2008) Podobnik, B. and Stanley, H. E. (2008). Detrended cross-correlation analysis: a new method for analyzing two nonstationary time series. Physical Review Letters 100, 084102. 10.1103/PhysRevLett.100.084102
- Redies (2015) Redies, C. (2015). Combining universal beauty and cultural context in a unifying model of visual aesthetic experience. Frontiers in Human Neuroscience 9, 218. 10.3389/fnhum.2015.00218
- Redies et al. (2012) Redies, C., Amirshahi, S. A., Koch, M., and Denzler, J. (2012). PHOG-Derived aesthetic measures applied to color photographs of artworks, natural scenes and objects. In ECCV 2012 Ws/Demos, Part I, Lecture Notes in Computer Science, eds. A. Fusiello, V. Murino, and R. Cucchiara (Berlin: Springer-Verlag), vol. 7583, 522–531. 10.1007/978-3-642-338-63-2_54
- Redies and Brachmann (2017) Redies, C. and Brachmann, A. (2017). Statistical image properties in large subsets of traditional art, bad art, and abstract art. Frontiers in Neuroscience 11, 593. 10.3389/fnins.2017.00593
- Redies et al. (2017) Redies, C., Brachmann, A., and Wagemans, J. (2017). High entropy of edge orientations characterizes visual artworks from diverse cultural backgrounds. Vision Research 133, 130 – 144. 10.1016/j.visres.2017.02.004
- Redies et al. (2007) Redies, C., Hasenstein, J., and Denzler, J. (2007). Fractal-like image statistics in visual art: similarity to natural scenes. Spatial Vision 21, 137–148. 10.1163/156856807782753921
- Richards (1936) Richards, I. A. (1936). The Philosophy of Rhetoric (Oxford: Oxford University press)
- Riedl and Biemann (2012) Riedl, M. and Biemann, C. (2012). Text segmentation with topic models. Journal for Language Technology and Computational Linguistics (JLCL) 27, 13–24
- Roeske et al. (2018) Roeske, T. C., Kelty-Stephen, D., and Wallot, S. (2018). Multifractal analysis reveals music-like dynamic structure in songbird rhythms. Scientific Reports 8. 10.1038/s41598-018-22933-2
- Rosso et al. (2009) Rosso, O. A., Craig, H., and Moscato, P. (2009). Shakespeare and other english renaissance authors as characterized by information theory complexity quantifiers. Physica A: Statistical Mechanics and Its Applications 388, 916 – 926. 10.1016/j.physa.2008.11.018
- Sainburg et al. (2019) Sainburg, T., Theilman, B., Thielk, M., and Gentner, T. Q. (2019). Parallels in the sequential organization of birdsong and human speech. Nature Communications 10. 10.1038/s41467-019-11605-y
- Samuels (1994) Samuels, S. J. (1994). Toward a theory of automatic information processing in reading, revisited. In Theoretical Models and Processes of Reading, eds. R. B. Ruddell, M. R. Ruddell, and H. Singer (Newark, DE: International Reading Association). 816–837
- Sanyal et al. (2016) Sanyal, S., Banerjee, A., Patranabis, A., Banerjee, K., Sengupta, R., and Ghosh, D. (2016). A study on improvisation in a musical performance using multifractal detrended cross correlation analysis. Physica A: Statistical Mechanics and Its Applications 462, 67 – 83. 10.1016/j.physa.2016.06.013
- Serrano et al. (2009) Serrano, M. Á., Flammini, A., and Menczer, F. (2009). Modeling statistical properties of written text. PLoS ONE 4, 1–8. 10.1371/journal.pone.0005372
- Sherwood (2012) Sherwood, K. (2012). How a cerebral hemorrhage altered my art. Frontiers in Human Neuroscience 6, 55. 10.3389/fnhum.2012.00055
- Simonton (1990) Simonton, D. K. (1990). Lexical choices and aesthetic success: A computer content analysis of 154 shakespeare sonnets. Computers and the Humanities 24, 251–264. 10.1007/BF00123412
- Smith (2003) Smith, C. (2003). Modes of Discourse. The Local Structure of Texts (Cambridge: Cambridge University Press)
- Spehar et al. (2016) Spehar, B., Walker, N., and Taylor, R. (2016). Taxonomy of individual variations in aesthetic responses to fractal patterns. Frontiers in Human Neuroscience 10, 350. 10.3389/fnhum.2016.00350
- Taylor (2002) Taylor, R. (2002). Order in Pollock’s chaos - computer analysis is helping to explain the appeal of Jackson Pollock’s paintings. Scientific American 287, 116–121
- Taylor et al. (2011) Taylor, R., Spehar, B., Hagerhall, C., and Van Donkelaar, P. (2011). Perceptual and physiological responses to Jackson Pollock’s fractals. Frontiers in Human Neuroscience 5, 60. 10.3389/fnhum.2011.00060
- Tolhurst et al. (1992) Tolhurst, D. J., Tadmor, Y., and Chao, T. (1992). Amplitude spectra of natural images. Ophthalmic and Physiological Optics 12, 229–232. 10.1111/j.1475-1313.1992.tb00296.x
- Toutanova et al. (2003) Toutanova, K., Klein, D., Manning, C. D., and Singer, Y. (2003). Feature-rich part-of-speech tagging with a cyclic dependency network. In Proceedings of the 2003 Conference of the North American Chapter of the Association for Computational Linguistics on Human Language Technology - Volume 1 (Association for Computational Linguistics), NAACL ’03, 173–180. 10.3115/1073445.1073478
- Underwood and Sellers (2016) Underwood, T. and Sellers, J. (2016). The long durée of literary prestige. Modern Language Quarterly 77, 321–344. 10.1215/00267929-3570634
- Vaughan-Evans et al. (2016) Vaughan-Evans, A., Trefor, R., Jones, L., Lynch, P., Jones, M. W., and Thierry, G. (2016). Implicit detection of poetic harmony by the naïve brain. Frontiers in Psychology 7, 1859. 10.3389/fpsyg.2016.01859
- Verhuizen et al. (2019) Verhuizen, N. J., Crocker, M. W., and Brower, H. (2019). Expectation-based comprehension: Modeling the interaction of world knowledge and linguistic experience. Discourse Processes 56, 229–255. 10.1080/0163853X.2018.1448677
- Vieira et al. (2018) Vieira, D. S., Picoli, S., and Mendes, R. S. (2018). Robustness of sentence length measures in written texts. Physica A: Statistical Mechanics and Its Applications 506, 749–754
- Voss and Clarke (1975) Voss, R. and Clarke, J. (1975). ‘1/f’noise in music and speech. Nature 258, 317–318. 10.1038/258317a0
- Weiss et al. (2018) Weiss, A. F., Kretzschmar, F., Schlesewsky, M., Bornkessel-Schlesewsky, I., and Staub, A. (2018). Comprehension demands modulate re-reading, but not first-pass reading behavior. Quarterly Journal of Experimental Psychology 71, 198–210. doi.org/10.1080/17470218.2017.1307862
- Wendt and Abry (2007) Wendt, H. and Abry, P. (2007). Multifractality tests using bootstrapped wavelet leaders. IEEE Transactions on Signal Processing 55, 4811–4820. 10.1109/TSP.2007.896269
- Wendt et al. (2009) Wendt, H., Roux, S. G., Jaffard, S., and Abry, P. (2009). Wavelet leaders and bootstrap for multifractal analysis of images. Signal Processing 89, 1100 – 1114. 10.1016/j.sigpro.2008.12.015
- Wu et al. (2015) Wu, D., Kendrick, K., Levitin, D., Chaoyi, L., and Dezhong, Y. (2015). Bach is the father of harmony: Revealed by a 1/f fluctuation analysis across musical genres. PLoS ONE 10. 10.1371/journal.pone.0142431
- Yang et al. (2016) Yang, T., Gu, C., and Yang, H. (2016). Long-range correlations in sentence series from a story of the stone. PLoS ONE 11, 1–11. 10.1371/journal.pone.0162423
- Yu (2009) Yu, G. (2009). Lexical diversity in writing and speaking task performances. Applied Linguistics 31, 236–259. 10.1093/applin/amp024
- Zareva et al. (2005) Zareva, A., Schwanenflugel, P., and Nikolova, Y. (2005). Relationship between lexical competence and language proficiency: Variable sensitivity. Studies in Second Language Acquisition 27, 567–595. 10.1017/S0272263105050254