Multimessenger Gamma-Ray and Neutrino Coincidence Alerts using HAWC and IceCube subthreshold Data
Abstract
The High Altitude Water Cherenkov (HAWC) and IceCube observatories, through the Astrophysical Multimessenger Observatory Network (AMON) framework, have developed a multimessenger joint search for extragalactic astrophysical sources. This analysis looks for sources that emit both cosmic neutrinos and gamma rays that are produced in photohadronic or hadronic interactions. The AMON system is running continuously, receiving subthreshold data (i.e. data that are not suited on their own to do astrophysical searches) from HAWC and IceCube, and combining them in real time. Here we present here the analysis algorithm, as well as results from archival data collected between 2015 June and 2018 August, with a total live time of 3.0 years. During this period we found two coincident events that have a false-alarm rate (FAR) of coincidence yr-1, consistent with the background expectations. The real-time implementation of the analysis in the AMON system began on 2019 November 20 and issues alerts to the community through the Gamma-ray Coordinates Network with an FAR threshold of coincidences yr-1.
1 Introduction
The coincident detection of gravitational waves and electromagnetic radiation (Abbott et al., 2017), as well as the evidence found for a neutrino coincident with a gamma-ray flare from the blazar TXS 0506+056 (Aartsen et al., 2018), have shown the potential of multimessenger astrophysics. The ability to combine data from different observatories in real time or near-real time is driving this new era in astrophysics. The Astrophysical Multimessenger Observatory Network (AMON) has been created to facilitate the interaction of different observatories, create a framework for analyses with distinct datasets across multiple experiments, and notify the astrophysical community of any interesting events worthy of follow-up (Smith et al., 2013; Ayala Solares et al., 2019a)111AMON website: https://www.amon.psu.edu/.
AMON focuses on using data that are below the discovery threshold of individual observatories. These events by themselves are heavily background-dominated, which complicates a search for astrophysical sources. By statistically combining the temporal and/or spatial information of these subthreshold events provided by different detectors, AMON aims to recover the signal events that are hidden among the background of each single observatory. Two multimessenger analyses were previously developed combining gamma-ray data from Fermi-LAT with neutrino data: one analysis using IceCube data (Turley et al., 2018) and the other using ANTARES data (Ayala Solares et al., 2019b).222Although what constitutes the data depends on the groups or collaborations, in general, the position and time of the events are always used. Other information is added if available. The Fermi-LAT and ANTARES coincidence search started running in real time in 2019 April and has issued two alerts to date (see GCN circulars Turley, 2020a, b).
In this work, we focus on a new coincidence analysis combining information from the High Altitude Water Cherenkov (HAWC) Gamma-Ray Observatory (Abeysekara et al., 2017) and the IceCube Neutrino Observatory (Aartsen et al., 2017a) using the AMON infrastructure. This new multimessenger channel has been operational as a real-time coincidence search since 2019 December.
The purpose of this analysis is to search for hadronic accelerators that produce both gamma rays and neutrinos as secondary particles, with an emphasis on transient events. The accelerated cosmic rays can interact with target material surrounding the environment of the sources or with radiation fields. These interactions produce charged and neutral pions. Charged pions predominantly decay via , followed by the decay of the muon as (and charge conjugate). Neutral pions decay into two gamma-ray photons, . The ratio between charged pions and neutral pions depends on the type of interaction of the cosmic rays with the targets. If the interaction occurs with electromagnetic radiation, the interaction will be photohadronic, which produces charged and neutral pions with probabilities of one-third and two-thirds, after considering both resonant and nonresonant pion productions. If the pions originate from interactions of cosmic rays with matter, the probability of producing charged and neutral pions is one-third for each type of pion (Biehl et al., 2019). A useful relation between the fluxes of gamma rays () and neutrinos () is expressed as
| (1) |
where are the gamma ray and neutrino energies; corresponds to the neutrino flavor; is the ratio of charged to neutral pions, with for photohadronic interactions and for hadronuclear interactions; is the distance to the source; and accounts for the attenuation of gamma rays due to their interaction with the extragalactic background light (EBL) (see Murase et al., 2013; Murase & Ahlers, 2014).
In this paper, we present the algorithm and analysis to search for possible sources of gamma rays and neutrinos by looking at HAWC’s and IceCube’s subthreshold data. In section 2, we describe briefly the detectors and their data. In section 3, we present the statistical method and provide the false-alarm rate (FAR), sensitivities and discovery potentials.
In section 4, we present the results obtained using 3 years of archival data, including upper limits for the same period of time for the total isotropic equivalent energy and source rate density parameter space. Finally, we conclude and discuss the implementation of the analysis in real-time using the AMON framework.
2 HAWC and IceCube detectors and datasets
HAWC and IceCube are two detectors that focus on high-energy astrophysics, searching for sources that accelerate cosmic rays. Both detectors use the Cherenkov technique where photomultipliers are used to detect the Cherenkov light produced by the passage of secondary charged relativistic particles—from gamma ray, neutrinos, and cosmic-ray showers—through a medium. HAWC uses water as the medium, while IceCube uses the Antarctic ice.
Due to the attenuation of gamma rays on the extragalactic background photons, the signal from a source might not be significantly detected above background in the HAWC data. However, if IceCube neutrino events are found in spatiotemporal coincidence with a subthreshold HAWC hot spot, this might become an interesting coincidence that could be followed up by other observatories. In addition, the uncertainty region of HAWC events is generally smaller compared to IceCube events, which can give a better localization of a potential joint source.
2.1 High-energy Gamma Rays from HAWC
The HAWC observatory is a high-energy gamma-ray detector located in central Mexico. The complete detector has been in operation since 2015 March. HAWC has a large field of view, covering two-thirds of the sky every day with a high-duty cycle in the declination range from to . HAWC is mainly sensitive to gamma rays in the energy range between GeV and TeV. It has an angular resolution of (68% containment) that depends on the energy of the event, its zenith angle and size of the shower footprint measured by HAWC (Abeysekara et al., 2017).
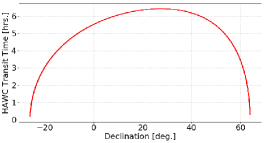
We select locations of excess exceeding a given significance threshold— called “hot spots” —from the HAWC data to be used as inputs to the combined search. Hot spots are defined as locations in the sky with a cluster of events above the estimated cosmic-ray background level and measured by the significance (excess above the background). They are identified during one full transit of that sky location above the detector. The main hot-spot parameters AMON receives are: the position coordinates and their uncertainty; significance value, with a minimum of (threshold defined by HAWC); and the start and stop times of the transit. The duration of the transits are declination dependent as shown in Fig. 1. Since we are searching for unknown sources or sources that cannot be significantly detected above the background, we mask the data from the following parts of the sky above HAWC: the Galactic plane (), the Crab Nebula, Geminga, Monogem, Mkr 421 and Mkr 501. The current rate of these hot spots received by AMON is 800 per day.
2.2 High-energy Neutrinos from IceCube
The IceCube observatory is a detector of high-energy neutrinos located at the South Pole (Aartsen et al., 2017a). It became fully operational in 2011 after 7 years of construction. IceCube first observed the high-energy astrophysical neutrino flux in 2013 (Aartsen et al., 2013).
IceCube can search for neutrinos from the whole sky, though it is more sensitive to sources from the northern celestial hemisphere, since the Earth helps reduce the atmospheric background in IceCube. This is an advantage in this analysis since HAWC is primarily sensitive in the northern sky. IceCube is sensitive to energies that can reach up to 1 EeV near the horizon (declination of ). The angular resolution depends on the topology of the events inside the detector. Two main topologies are observed: track events and cascade events. Track events are mostly induced by charged-current muon-neutrino interactions. These tracks can have a length of several kilometers and most of the time extend beyond the detector volume. The track events have a median angular resolution of above 100 TeV. Cascade events are produced by the other types of neutrinos or neutral-current interactions of any neutrino type. They have better energy resolution compared to tracks, since the energy deposited by the events is completely contained inside the detector. Their angular resolution, however, is with current reconstruction methods (Aartsen et al., 2017b).
The IceCube candidate events sent to AMON consist of single throughgoing tracks. These events can have energies above 0.1 TeV for upgoing events, while downgoing events can have energies above 100 TeV. Lower-energy events are more probable to be background events. The parameters consist of the sky position and its uncertainty, the time of the event, and the reconstructed energy or boosted decision tree (BDT)333The BDT score is used to reduce the atmospheric muon background as well as separate the astrophysical signal. score (see Section 3 of Aartsen et al., 2017b), depending on whether the event is in the northern or southern hemisphere, respectively, and can be used to calculate the background -value of the event. The current rate of the events received by AMON is 650 per day.
3 Method
The coincidence analysis is applied to events satisfying two criteria. The first is a temporal selection requiring the neutrino events to arrive within the transit time of the HAWC hot spot. Second, we select neutrinos that are within a radius of from the HAWC hot-spot localization.444The angular distance is motivated from IceCube multiplet searches (see Aartsen et al., 2017c). After the neutrino events have passed the selection criteria, we calculate a statistic to rank the coincident events. The rate of coincidences after passing the criteria is 100 per day. This ranking statistic is based on Fisher’s method (Fisher, 1938), where we combine all the information that we have from the events. It is defined as
| (2) |
where the number of degrees of freedom is (as described below). The quantity quantifies the overlap of the spatial uncertainties of the events. The value is the probability of the HAWC event being compatible with a background fluctuation. Since we can expect more than one IceCube candidate event in the time window (i.e. the HAWC transit period), we can calculate the probability of background IceCube events occurring in that time window. Given that we have at least one event detected, the 555Here ), where is the IceCube background rate and is the HAWC transit time. is the probability of that one event to be in the same time-window with the observed number of IceCube events, , or more from background; if there is only one IceCube event, this value is equal to 1.0. The value is the probability of measuring a similar or higher energy/BDT score for an IceCube event, assuming it is a background event (calculated using the energy/BDT score and zenith angle). The value is obtained by a maximum-likelihood method that measures how much the positions of the HAWC and IceCube events overlap. This is calculated as
| (3) |
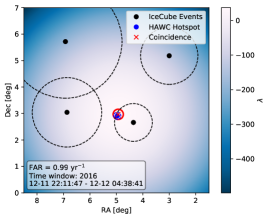
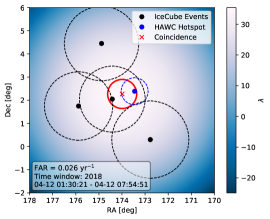
where is the HAWC hot spot plus the number of IceCube candidate events. corresponds to a signal directional probability distribution function, which is assumed to be a Gaussian distribution on the sphere with a width given by the measured positional uncertainty from each detector, . is the background directional probability distribution from each detector at the position of the events. The position of the coincidence, , is defined as the position of the maximum likelihood value, , as shown in Figure 5. The uncertainty of is calculated by the standard error .
The values are used to make a distribution of the overlap of the coincidences. A higher value indicates a more significant overlap of the event uncertainties. This translates into a smaller -value .
Due to the fact that we can have more than one IceCube event passing the selection criteria, the degrees of freedom of Eq. 2 vary. We therefore calculate a -value of the with degrees of freedom. The ranking statistic (RS) is then simply defined as .
3.1 Calibration of the FAR
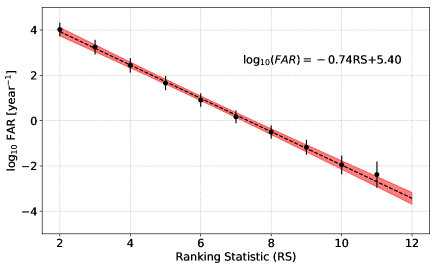
We apply the above-described algorithm to 3 years of scrambled data sets from both observatories. Scrambling consists of randomizing the right ascension and time values of the events many times in order to calibrate the FAR. The result of this process is shown in Fig. 2. For a specific ranking statistic, we calculate the total number of coincidences above this ranking statistic value and then divide by the total amount of scrambled simulation time to get the rate. The linear fit in Fig. 2 is used to estimate the FAR in real-time analyses.
3.2 Sensitivity and Discovery Potential
To put the archival results into context, we look at a simulation for transient events that can produce both neutrinos and gamma rays. We quantify the sensitivity and discovery potential for the 1 coincidence per year threshold for a live time of 3 years of data.
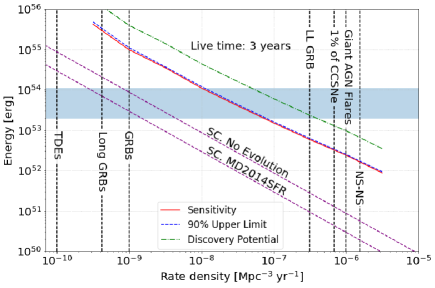
We use the FIRESONG software package (Taboada et al., 2017), which simulates neutrino sources for a given local rate density of transient gamma-ray and neutrino sources, total neutrino isotropic equivalent energies, and timescales. The outcome of the simulation is a list of simulated neutrino sources with declination, redshift and neutrino flux normalization. This is based on a power-law energy spectrum with spectral index of -2 for the flux, in the energy range between 10 TeV and 10 PeV,666The simulation was also run with a spectral index of -2.4. Since the energy range for IceCube’s sensitivity changes with index, the range was extended from 100 GeV to 10 PeV. The sensitivity and discovery potential of the analysis are higher by a factor of 3. Figure 3 shows the result for the simulation with a spectral index of -2.0. and a time of the burst of 6 hrs.777Since the information given by HAWC is averaged over one transit, we use this timescale for the simulations. Using Eq. 1, we can transform the normalization to a gamma-ray flux assuming photohadronic interactions. We then simulate the sources in HAWC, adding EBL attenuation with the model from Domínguez et al. (2011) and in addition, we draw a Poisson random number of neutrinos with an expectation value given by the source flux and IceCube’s background. Finally, we quantify the coincidence.
We calculate the sensitivity and discovery potential by running simulations for a given pair of rate density and total neutrino isotropic energy. We apply the coincidence algorithm and after finding the signal coincidences, they are added to a distribution with random coincidences. We keep the total number of coincidences the same as that of the 3 years of data, so we remove the same number of random coincidences as injected sources. We apply this procedure several times in order to build a distribution of the number of coincidences that cross the 1 coincidence per year threshold, . If no sources are injected, is a Poisson distribution with a rate of (B stands for background) for the 3 years of observations. For the sensitivity, we find the pair of parameters that will give us a (where S stands for signal). This corresponds to a distribution that crosses the median of the Poisson background distribution 90% of the time. For the discovery potential, we find the pair of parameters that will give a rate of since this distribution will have 50% of its population with a -value smaller than with respect to the Poisson background distribution. We fit the distribution of to a Poisson function and find the best value for . The pair of rate density and total neutrino isotropic energy that gives the corresponding values for sensitivity or discovery potential is plotted in Fig. 3. To put the sensitivity and discovery potential in context, we include diagonal lines that show the total neutrino isotropic energy as a function of rate density that would be required to produce the total observed IceCube diffuse neutrino flux (assuming a power-law spectrum with index of -2.5). This assumes either no evolution or the star-formation evolution following the Madau-Dickinson model (Madau & Dickinson, 2014); it also assumes a standard candle (SC.) luminosity function. Based on Aartsen et al. (2018), we marked a region on Fig. 3 showing the estimated released neutrino energy of the IceCube event 170922A related to TXS 0506+056.
4 Results
4.1 Archival Data
We analyzed data collected from June 2015 to August 2018. Fig. 4 shows the distribution of ranking statistic value of the unblinded data compared to the expected distribution of random coincidences (i.e. scrambled datasets mentioned in Section 3).
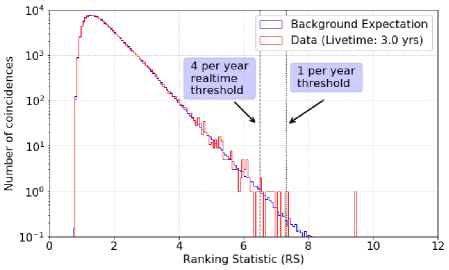
Since we are interested in searching for rare coincidences, we look for coincidences with an FAR of less than 1 coincidence per year, which corresponds to a ranking statistic value of 7.31. We found two coincidences, one in 2016 and one in 2018, with ranking statistics of 7.34 (1 coincidence per year) and 9.43 (1 coincidence in 38.5 years) respectively. These coincidences are not significant with respect to the background distribution. Using , with years, the -values are 0.95 and 0.075 respectively. The skymaps of the two coincident events with the highest ranking statistic values are shown in Fig. 5. Table 1 contains the summary information on them. Information of the individual events that form each coincidence can be found in Tables 2 and 3.
| Dec [deg] | RA [deg] | Uncertainty (50% containment)[deg] | Ranking Statistic | FAR [per year] | -value |
|---|---|---|---|---|---|
| 2.96 | 4.93 | 0.16 | 7.3 | 0.99 | 0.95 |
| 2.27 | 173.99 | 0.53 | 9.4 | 0.026 | 0.075 |
| Dec | RA | Uncertainty | Initial Time | Final Time | Significance | Flux upper limit |
|---|---|---|---|---|---|---|
| [deg] | [deg] | [deg] | [UT] | [UT] | [TeV-1 cm-2 s-1] | |
| 2.91 | 4.96 | 0.17 | 2016-12-11 22:11:47 | 2016-12-12 04:38:41 | 3.71 | 3.9e-11 |
| 2.38 | 173.4 | 0.74 | 2018-04-12 01:31:21 | 2018-04-12 07:54:51 | 2.77 | 8.3e-11 |
| Dec | RA | Uncertainty | Time | Background -value | |
|---|---|---|---|---|---|
| [deg] | [deg] | [deg] | [UT] | p | [deg] |
| 3.04 | 6.86 | 1.31 | 2016-12-11 23:20:25 | 0.944 | 1.90 |
| 2.66 | 4.35 | 0.71 | 2016-12-12 00:24:48 | 0.055 | 0.65 |
| 5.18 | 3.00 | 1.08 | 2016-12-12 01:37:28 | 0.391 | 2.99 |
| 5.71 | 6.92 | 2.13 | 2016-12-12 03:22:12 | 0.993 | 3.42 |
| 0.30 | 172.77 | 1.67 | 2018-04-12 01:57:33 | 0.222 | 2.12 |
| 4.45 | 174.88 | 1.61 | 2018-04-12 03:53:08 | 0.860 | 2.51 |
| 1.75 | 175.88 | 1.48 | 2018-04-12 04:36:11 | 0.001 | 2.50 |
| 2.05 | 174.42 | 1.42 | 2018-04-12 05:19:36 | 0.005 | 1.02 |
We looked at the SIMBAD catalog (Wenger et al., 2000) for sources that appear near the coincidences888For the SIMBAD catalog search, we focus on sources in the 50% containment region, and at the Fermi All-sky Variability Analysis (FAVA) online tool999https://fermi.gsfc.nasa.gov/ssc/data/access/lat/FAVA/ for any evidence of past flares in the region based on the light curves provided by FAVA.
For the coincidence of 2016 with FAR of 0.99 per year, there is a radio galaxy in the nearby region, PKS 0017+026 also known as TXS 0017+026 (Dunlop et al., 1989). This source is 0.04∘ away from the best-fit position of the coincidence. Unfortunately, no distance information is available to estimate the gamma-ray attenuation. Other sources that appear nearby are quasars, but in general these sources are too distant (redshift above 0.3), resulting in strong gamma-ray attenuation. With the FAVA tool, the source from the 3FGL catalog, J0020.9+0323, was found 0.52∘ away from the best-fit coincidence position, which is outside the 50% containment region. The 3FGL catalog mentions that this is an unassociated source (Acero et al., 2015).
For the coincidence of 2018 with FAR of 0.026 per year, several sources appear in the SIMBAD catalog. There are nine radio galaxies within 0.74 degrees of the best-fit location of the coincidence from the NRAO VLA Sky Survey Catalog. From these, only NVSS J113719+022200 had some information about its distance (redshift of 0.19). We did not find nearby sources in the FAVA monitoring tool for this coincidence.
Both coincidences found with this analysis are therefore consistent with background expectations. Follow-up observations in the optical and X-ray could be helpful to discern if any of these sources are related to the coincident events.
4.2 Upper Limit
Knowing that we observed two coincidences in 3 years of observations, we calculate an upper limit for the parameter space shown in Fig. 3. We apply Poisson statistics to obtain a 90% confidence level by using Equation (9.54) in Cowan (2002). This equation gives us an upper limit on the Poisson rate of the signal based on the observation and assuming that in 3 years of observations we expect three coincidences from background. The result is a signal Poisson rate , giving a total Poisson rate of . We use the procedure in Sec. 3.2 to find the corresponding upper limit values in the parameter space in Fig. 3.
5 Real-time system
The real-time implementation of the analysis started on 2019 November 20. As specified in Ayala Solares et al. (2019a), we use the amonpy software for the real-time implementation of the analysis. A major difference is that the system is now running at Amazon Web Services (AWS) servers, which will further improve AMON’s uptime. We set a threshold for public alerts at an FAR coincidences per year. This threshold is set so that there is a reasonable number of statistically interesting coincidences that can be followed up during a year. Alerts are sent immediately to AMON members, and a GCN notice is generated. A GCN circular is also written to inform the rest of the astrophysical community. The first public alert of the system was sent out on 2020 February 2. It had an FAR of 1.39 per year. The reported position is (RA, Dec)200.3∘, 12.71∘, with 50% radius of 0.17∘ (see GCN circular, 26963 Ayala Solares, 2020). The MASTER Global Robotic Net and the ANTARES observatory performed follow-up observations of the coincidence, but no transient event was observed (see GCN circulars 26973 and 26976 Lipunov, 2020; Kouchner, 2020).
The largest latency of the analysis comes from the HAWC analysis of the hot spots, since the transit needs to complete before sending that information to AMON. Based on Fig. 1, the hot-spot duration can last from less than an hour to a bit more than 6 hours. The latency, once the data are in the AMON server, is less than a minute to perform the analysis and send the alert to the public.
6 Conclusion
We developed a method to search for coincidences of subthreshold data from the HAWC and the IceCube observatories. Using coincidences of subthreshold data allows us to recover signal events that cannot be differentiated from the background in each individual detector. The method was tested on archival data taken between the years 2015 and 2018. We found two coincidences in the archival analysis that crossed the FAR threshold of one per year, consistent with the background expectations of three coincidences in three years. Although a few sources were found near the best coincidence positions, these results are still consistent with the expectation from random coincidences. The real-time analysis has produced one alert so far, with an FAR of 1.39 per year. It was sent out to the community. We encourage other observatories to perform follow-up observations of these results and the real-time alerts in the future.
References
- Aartsen et al. (2013) Aartsen, M. G., Abraham, K., Ackermann, M., et al. 2013, Science, 342, 1242856
- Aartsen et al. (2017a) Aartsen, M. G., Ackermann, M., Adams, J., et al. 2017a, JINST, P03012, 12
- Aartsen et al. (2017b) —. 2017b, Astroparticle Physics, 92, 30
- Aartsen et al. (2017c) —. 2017c, AAP, 607, A115
- Aartsen et al. (2018) —. 2018, Science, 361, 8
- Abbott et al. (2017) Abbott, B. P., Abbott, R., Abbott, T. D., et al. 2017, ApJ, 848, L12
- Abeysekara et al. (2017) Abeysekara, A. U., Albert, A., Alfaro, R., et al. 2017, ApJ, 843, 39
- Acero et al. (2015) Acero, F., Ackermann, M., Ajello, M., et al. 2015, APJs, 218, 23
- Ayala Solares (2020) Ayala Solares, H. A. 2020, AMON Coincidence Alert from the sub-threshold IceCube-HAWC search NuEm-200202A, GCN. https://gcn.gsfc.nasa.gov/gcn3/26963.gcn3
- Ayala Solares et al. (2019a) Ayala Solares, H. A., Coutu, S., Cowen, D. F., et al. 2019a, Astro. Physics., 114, 68,76
- Ayala Solares et al. (2019b) Ayala Solares, H. A., Cowen, D. F., DeLaunay, J. J., et al. 2019b, ApJ, 886, 98
- Barthelmy (1990) Barthelmy, S. 1990, Galactic Coordinates website, NASA. https://gcn.gsfc.nasa.gov/
- Biehl et al. (2019) Biehl, D., Boncioli, D., Fedynitch, A., et al. 2019, in European Physical Journal Web of Conferences, Vol. 208, European Physical Journal Web of Conferences, 04002
- Cowan (2002) Cowan, G. 2002, Statistical Data Analysis (Oxford University Press)
- Domínguez et al. (2011) Domínguez, A., Primack, J. R., Rosario, D. J., et al. 2011, MNRAS, 410, 2556
- Dunlop et al. (1989) Dunlop, J. S., Peacock, J. A., Savage, A., et al. 1989, Monthly Notices of the Royal Astronomical Society, 238, 1171
- Farrar & Gruzinov (2009) Farrar, G. R., & Gruzinov, A. 2009, ApJ, 693, 329. https://doi.org/10.1088%2F0004-637x%2F693%2F1%2F329
- Fisher (1938) Fisher, R. A. 1938, Statistical methods for research workers (Edinburgh, Oliver and Boyd)
- Hunter (2007) Hunter, J. 2007, Computing in Science Engineering, 9, 90
- Kouchner (2020) Kouchner, A. 2020, AMON IceCube-HAWC_200202A: No neutrino counterpart seen with ANTARES, GCN. https://gcn.gsfc.nasa.gov/gcn3/26976.gcn3
- Lipunov (2020) Lipunov, V. 2020, AMON IceCube-HAWC_200202A: MASTER optical inspect, GCN. https://gcn.gsfc.nasa.gov/gcn3/26973.gcn3
- Madau & Dickinson (2014) Madau, P., & Dickinson, M. 2014, ARA&A, 52, 415
- McKinney (2010) McKinney, W. 2010, in Proceedings of the 9th Python in Science Conference, ed. Stéfan van der Walt & Jarrod Millman, 56 – 61
- Murase & Ahlers (2014) Murase, K., & Ahlers, M. 2014, Phys. Rev. D, 90, 023010
- Murase et al. (2013) Murase, K., Ahlers, M., & Lacki, B. 2013, PhRvD, 88, 121301
- Murase & Fukugita (2019) Murase, K., & Fukugita, M. 2019, Phys. Rev. D, 99, 063012
- Murase & Waxman (2016) Murase, K., & Waxman, E. 2016, PhRvD, 10, 103006
- Price-Whelan et al. (2018) Price-Whelan, A. M., Sipőcz, B. M., Günther, H. M., et al. 2018, AJ, 156, 123
- Smith et al. (2013) Smith, M., Fox, D., Cowen, D., et al. 2013, Astro. Part., 45, 56
- Strolger et al. (2015) Strolger, L., Dahlen, T., Rodney, S. A., et al. 2015, ApJ, 813, 93
- Taboada et al. (2017) Taboada, I., Tung, C. F., & Wood, J. 2017, in ”Proceedings of 35th International Cosmic Ray Conference — PoS(ICRC2017)”, Vol. 301, 663
- Turley (2020a) Turley, C. F. 2020a, ANTARES 200108A: AMON + ANTARES Identification of a High-Energy Neutrino + Fermi LAT Coincidence, GCN. https://gcn.gsfc.nasa.gov/gcn3/26674.gcn3
- Turley (2020b) —. 2020b, ANTARES 200127A: AMON + ANTARES Identification of a Low False Alarm Rate High-Energy Neutrino + Fermi LAT Coincidence, GCN. https://gcn.gsfc.nasa.gov/gcn3/26915.gcn3
- Turley et al. (2018) Turley, C. F., Fox, D. B., Keivani, A., et al. 2018, ApJ, 863, 64
- Van der Walt et al. (2011) Van der Walt, S., Colbert, S. C., & Varoquaux, G. 2011, Computing in Science Engineering, 13, 22
- Virtanen et al. (2020) Virtanen, P., Gommers, R., Oliphant, T. E., et al. 2020, Nature Methods, 17, 261
- Wanderman & Piran (2015) Wanderman, D., & Piran, T. 2015, MNRAS, 448, 3026
- Wenger et al. (2000) Wenger, M., Ochsenbein, F., Egret, D., et al. 2000, AAPS, 143, 9