Chandra reveals a luminous Compton-thick QSO powering a blob in a starbursting protocluster
Abstract
Context. Galaxy clusters in the local universe descend from high-redshift overdense regions known as protoclusters. The large gas reservoirs and high rate of galaxy interaction in protoclusters are expected to enhance star-formation activity and trigger luminous supermassive black-hole accretion in the nuclear regions of the host galaxies.
Aims. We investigated the active galactic nucleus (AGN) content of a gas-rich and starbursting protocluster at , known as the Distant Red Core (DRC). In particular, we search for luminous and possibly obscured AGN in 13 identified members of the structure, and compare the results with protoclusters at lower redshifts. We also test whether a hidden AGN can power the blob (LAB) detected with VLT/MUSE in the DRC.
Methods. We observed all of the identified members of the structure with 139 ks of Chandra ACIS-S imaging. Being less affected by absorption than optical and IR bands, even in the presence of large column densities of obscuring material, X-ray observations are the best tools to detect ongoing nuclear activity in the DRC galaxies.
Results. We detect obscured X-ray emission from the two most gas-rich members of the DRC, named DRC-1 and DRC-2. Both of them are resolved into multiple interacting clumps in high-resolution Atacama Large Millimeter Array (ALMA) and Hubble Space Telescope (HST) observations. In particular, DRC-2 is found to host a luminous ( ) Compton-thick () quasar (QSO) candidate, comparable to the most luminous QSOs known at all cosmic times. The AGN fraction among DRC members is consistent with results found for lower redshift protoclusters. However, X-ray stacking analysis reveals that supermassive black hole (SMBH) accretion is likely also taking place in other DRC galaxies that are not detected individually by Chandra.
Conclusions. The luminous AGN detected in the most gas-rich galaxies in the DRC and the widespread SMBH accretion in the other members, which is suggested by stacking analysis, point toward the presence of a strong link between large gas reservoirs, galaxy interactions, and luminous and obscured nuclear activity in protocluster members. The powerful and obscured QSO detected in DRC-2 is likely powering the nearby LAB detected with VLT/MUSE, possibly through photoionization; however, we propose that the diffuse emission may be due to gas shocked by a massive outflow launched by DRC-2 over a kpc scale.
Key Words.:
Galaxies: active – Galaxies: high-redshift – quasars: general – quasars: supermassive black holes – Galaxies: starburst – X-rays: galaxies1 Introduction
Galaxy evolution is widely recognized to be strongly affected by environment. Galaxy growth at high redshift is enhanced in high-density regions (e.g., Kauffmann, 1996; De Lucia et al., 2006), causing the most massive and evolved spheroids in the local universe to reside in galaxy clusters (e.g., Smith et al., 2008). Present-day galaxy clusters are descendants of these overdense regions, known as “protoclusters,” at (Overzier 2016, and references therein). The number of known protoclusters, and thus our knowledge of the early phases of cluster formation and evolution, is still limited. Different approaches have been used to select such structures. Wide-field spectroscopic surveys allowed the detection of protoclusters as 3D overdensities of galaxies (e.g., Steidel et al., 2000, 2005; Cucciati et al., 2014). A similar approach adopts photometric preselection (e.g., exploiting the Lyman dropout technique or high-quality photometric redshifts) of galaxy candidates at a given redshift in multiwavelength surveys, and subsequent spectroscopic follow-up (e.g., Chiang et al., 2014; Toshikawa et al., 2016). At high redshift, narrow-band imaging has been used to discover overdensities of emitters (Ouchi et al., 2005; Higuchi et al., 2019). Finally, galaxy overdensities have been detected around objects expected to trace highly biased regions of the universe, such as powerful radio galaxies (e.g., Pentericci et al., 2000; Venemans et al., 2002; Overzier et al., 2008; Gilli et al., 2019), QSOs up to (e.g., Balmaverde et al. 2017), and blobs (LABs; e.g., Prescott et al., 2008; Bădescu et al., 2017). All of these methods rely on the detection of optical and UV continuum emission and emission lines in protocluster galaxies.
Since galaxy and supermassive black hole (SMBH) growth are strongly related (Kormendy & Ho 2013, and references therein), investigating the effects of environment on SMBH growth at high redshift is necessary to obtain a complete picture (see, e.g., Brandt & Alexander 2015, and references therein). In addition, nuclear activity produces both mechanical and radiative feedback, which is necessary to explain several observational findings, such as the possible enhancement of star-formation activity in protocluster members (e.g., Gilli et al., 2019), the efficient quenching of star formation in clusters (especially in the most massive galaxies), and the presence of shocked hot gas, detected as “cavities” in the cluster extended X-ray emission (e.g., Fabian 2012; Overzier 2016, and references therein).
Several studies in the X-ray band, although limited by poor source statistics, have found enhanced active galactic nucleus (AGN) activity in massive protoclusters at with respect to the field environment (e.g., Pentericci et al., 2002; Lehmer et al., 2009b, 2013; Digby-North et al., 2010). Strikingly, this is the opposite of what is found for galaxy clusters in the local universe (e.g., Kauffmann et al., 2004; Eastman et al., 2007; Martini et al., 2006, 2009, 2013; Ehlert et al., 2014). This behavior is similar to the reversal of the relation between star-formation rate density and environment from the distant to the local universe (e.g., Elbaz et al., 2007; Brodwin et al., 2013). A possible explanation is that unvirialized, overdense regions at high redshift provide both the large reservoirs of cold gas and the mechanisms (mergers and galaxy encounters) to drive this gas into the SMBH potential well and trigger nuclear accretion, while SMBH accretion is prevented in the virialized structures at low redshift (e.g., van Breukelen et al., 2009). Pushing the study of AGN in protoclusters to earlier cosmic times would thus provide a key insight into the connection between SMBHs, host galaxies, and their environment.
At high redshift, the availability of large gas reservoirs is also expected to trigger intense star-formation activity in the galaxies residing in overdense regions, as is often observed in protocluster candidates (e.g., Capak et al., 2011; Umehata et al., 2015, 2019; Kubo et al., 2019). Starbursting galaxies, often identified as dusty star-forming galaxies (DSFGs; e.g., Hodge & da Cunha 2020) or sub-mm galaxies (SMGs), represent a short but key phase in galaxy evolution, possibly resulting from “wet” (i.e., gas-rich) merger events. In the framework of BH-galaxy coevolution scenarios (e.g., Hopkins et al., 2008), luminous AGN are also thought to be triggered under the same conditions, and eventually to shut down both nuclear accretion and star-formation activity in the host galaxies through negative feedback. While some luminous and obscured AGN have been detected in SMGs (e.g., Alexander et al., 2016; Ivison et al., 2019) or other starbursting galaxies (e.g., Tsai et al., 2015), the prevalence of nuclear accretion in SMGs is still a debated issue (e.g., Alexander et al., 2005; Wang et al., 2013).
Usually, DSFGs are very faint in the optical/UV bands, due to strong dust extinction, and are generally missed by widely used protocluster selection methods. However, recently, bright FIR-to-mm sources have been resolved with ALMA into multiple DSFGs at high redshift (), pinpointing the positions of massive, star-forming and gas-rich galaxy overdensities (e.g., Oteo et al., 2018; Miller et al., 2018; Hill et al., 2020). This approach allowed the discovery of one of the most extreme protoclusters in terms of total mass, star-formation rate, and gas mass known at high redshift (, i.e., the redshift of the brightest member), referred to as the Distant Red Core (DRC; RA = 00:42:23.8, Dec = 33:43:34.8), as discussed by Ivison et al. (2016), Fudamoto et al. (2017), Lewis et al. (2018), Oteo et al. (2018), Long et al. (2020), and Ivison et al. (2020). The DRC was first selected by Ivison et al. (2016) as a high-redshift DSFG candidate on the basis of its very red Herschel colors in the H-ATLAS survey (Eales et al., 2010). Subsequent LABOCA and ALMA observations resolved this source into several individual galaxies, identified as DRC-1 to DRC-11, in descending order of 2 mm continuum brightness, in the inner core of the structure, over an area of , and sources C to G in the external regions.
Currently, 13 of these sources have been spectroscopically confirmed with ALMA to be members of the same structure at (Oteo et al. 2018; Ivison et al. 2020) via detection of up to five emission lines (12CO(2-1), 12CO(4-3), 12CO(6-5), [C I](1-0), H2(2)). The identified members are all of the core galaxies except for DRC-5, plus three galaxies in the external regions of the protocluster (i.e., Sources C, D, and E). Several continuum and line emitters have been detected in the fields of sources C-G but remain unidentified, and possibly some of them belong to the same overdensity. In particular, a second CO(4–3) line emitter was detected at arcsec and from source D. It is currently unclear if this is another member of the DRC aligned with source D, or if it traces an outflow launched by that source. For the purpose of this paper, we will consider the two line emitters in source D as a single structure member. The core of the structure is characterized by a DSFG surface density that is higher than SSA22 (Umehata et al., 2015) at , which is one the most massive structures known at high redshift (Steidel et al., 2000)). Radio observations ( GHz) identified DRC-6 as a radio galaxy, with a radio flux 50 brighter than that expected from star formation (Oteo et al., 2018). A high-resolution ( arcsec) 870 ALMA image of the brightest DSFG (DRC-1) reveals it is composed of three distinct and likely interacting star-forming clumps (Oteo et al., 2018). Similarly, recent HST/WFC3 observations in the F125W band resolved several DRC members into multiple star-forming and likely interacting clumps on scales of a few kpc (Long et al., 2020).
Individual star-formation rates of confirmed protocluster members, derived from the FIR or CO(4–3) line luminosities by Oteo et al. (2018) and Ivison et al. (2020), and from spectral energy distribution (SED) fitting by Long et al. (2020), are in the range . The total is the highest among known protoclusters at (Oteo et al., 2018; Hill et al., 2020), with attributed to the three brightest member galaxies (i.e., DRC-1, DRC-2, and DRC-3). It is likely that the DRC has been caught during a phase of fast and efficient stellar-mass building, not yet quenched by AGN feedback. This is also supported by the large estimated molecular gas mass of the structure (; Long et al. 2020). The estimated total mass of the protocluster makes the DRC a likely progenitor of a Coma-like cluster in the local universe (Long et al., 2020). The vigorous collective SFR of the DRC is most likely fueled by a continuous inflow of gas (e.g., Umehata et al., 2019). The same gas reservoir is also expected to trigger efficient, fast, and obscured SMBH growth typical of the peak phases of SMBH growth as predicted by several theoretical models (e.g., Menci et al., 2003; Hopkins et al., 2006).
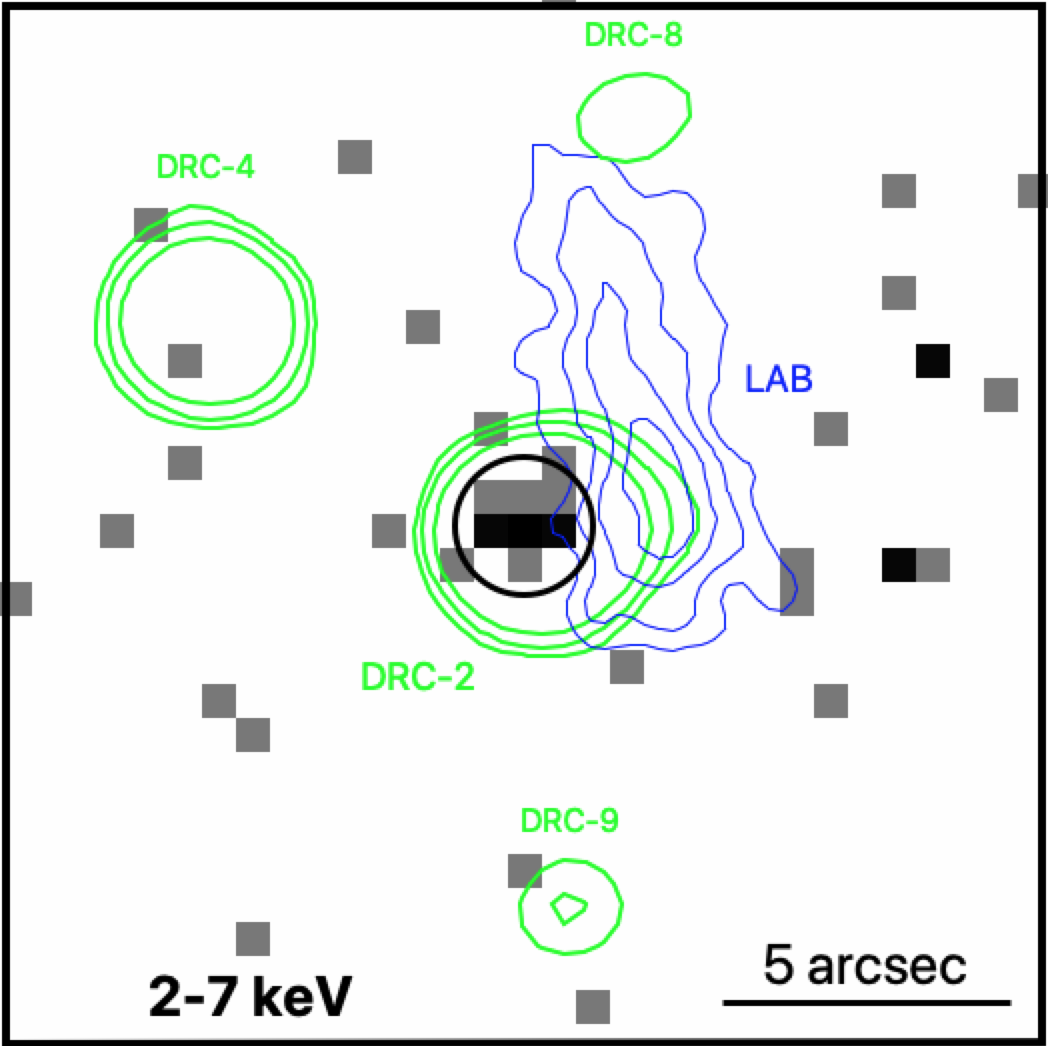
A VLT/MUSE observation of the DRC reveals the presence of an LAB (with linear size kpc) close to DRC-2 (Oteo et al., 2018). Similar objects are often found in protoclusters (e.g., Overzier, 2016), and are signposts of large amounts of neutral gas. The powering sources of LABs have been often identified with the photoionizing emission from a close ionizing source (e.g., a QSO) (e.g., Geach et al., 2009; Overzier et al., 2013; Hennawi et al., 2015), resonant scattering of photons emitted by a central source (e.g., Borisova et al., 2016), shocks (e.g., Taniguchi & Shioya, 2000; Mori et al., 2004), or “cooling radiation” following collisional ionization during the gravitational collapse of the gas (e.g., Haiman et al., 2000). None of the protocluster members were detected as emitters in the MUSE data (Oteo et al., 2018).
In this paper, we present the results of a 139 ks Chandra observation of the DRC, aimed at investigating its AGN content. We compare it with similar structures at lower redshift and assess whether the source of energy powering the LAB is a buried AGN. Uncertainties and limits are reported at a 68% confidence level, unless otherwise noted. We adopt a flat CDM cosmology with and (Planck Collaboration et al., 2016). At , arcsec corresponds to kpc.
2 Chandra data reduction and analysis
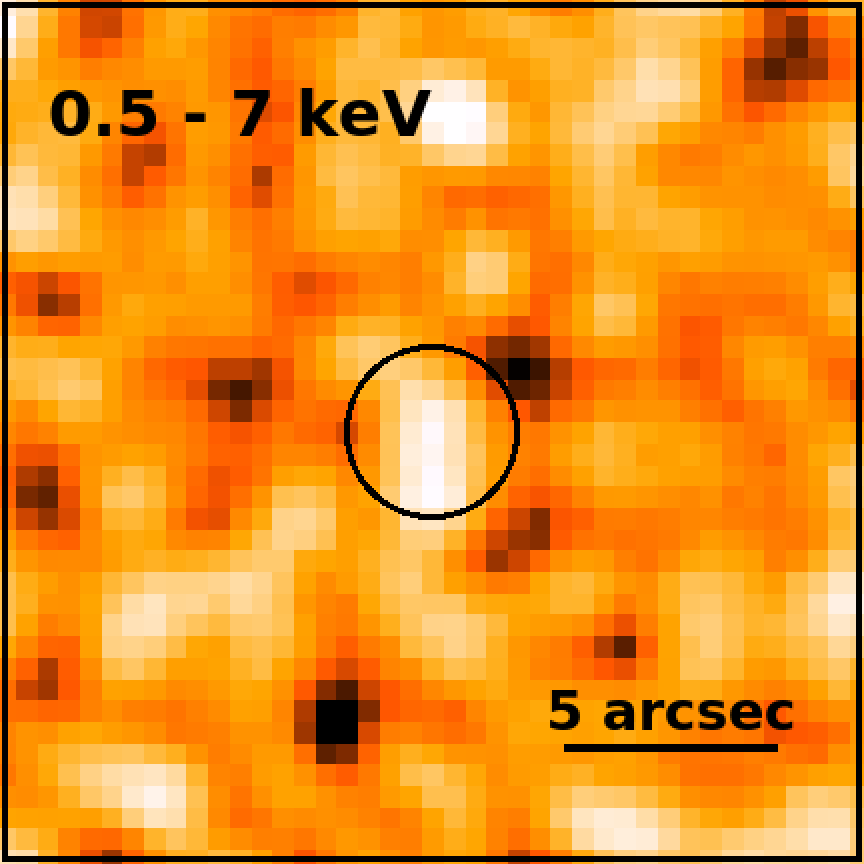
We observed the DRC with Chandra for a total of 139 ks, split into 3 observations (see Tab. 1 for details). We used the back-illuminated ACIS S3 CCD to cover all of the spectroscopically identified members of the structure. The core of the DRC has been placed at the aimpoint of the observations, where the Chandra sensitivity is highest. We reprocessed the Chandra observations with the chandra_repro script in CIAO 4.11 (Fruscione et al., 2006),111http://cxc.harvard.edu/ciao/ using CALDB v4.8.4,222http://cxc.harvard.edu/caldb/ setting the option check_vf_pha=yes, since observations were taken in very faint mode. In order to correct the astrometry of each observation, we performed source detection with the wavdetect script with a significance threshold of , and matched the positions of the detected point sources with the USNO-B1 optical source catalog (which has a typical astrometric accuracy; Monet et al. 2003) using the wcs_match and wcs_update tools. Finally, we merged the individual observations with the reproject_obs tool, and derived merged images and exposure maps. Fig. 1 presents the Chandra 0.5–7 keV image of the DRC. Spectra, response matrices, and ancillary files were extracted from individual pointings using the specextract tool and were added using the mathpha, addrmf, and addarf HEASOFT tools333https://heasarc.gsfc.nasa.gov/docs/software/heasoft/, respectively, weighting by the individual exposure times. Ancillary files, which are used to derive fluxes and luminosities, were aperture corrected.
We assessed the detection significance for each member of the structure in three energy bands: 0.5–2 keV, 2–7 keV, and 0.5–7 keV, which we refer to as the soft, hard, and full bands, respectively. We stress that at these bands sample rest-frame energies up to keV, allowing us to detect hard X-rays, which are not absorbed even by large (i.e., up to highly Compton-thick) column densities of obscuring material. We computed the detection significance with the binomial no-source probability (Weisskopf et al., 2007; Broos et al., 2007)
| (1) |
where is the total number of counts in the source region in the considered energy band, is the total number of counts in the background region, , and , with being the ratio of the background and source region areas. We consider a source to be detected if . This threshold is often used for assessing the detection significance of faint sources at predetermined positions (e.g., Vito et al., 2019). We used circular extraction regions with for evaluating the source counts S, and nearby regions free of contaminating sources for background evaluation.
| OBSID | Start date | [ks] |
|---|---|---|
| 21463 | 2019-09-13 | 57 |
| 22843 | 2019-09-15 | 59 |
| 22844 | 2019-09-16 | 23 |
3 Results
Among the 13 spectroscopically confirmed protocluster members, DRC-1 and DRC-2 are detected in our Chandra observations (§ 3.1 and 3.2). We performed stacking analysis on the remaining 11 undetected galaxies to study their average X-ray emission (§ 3.3 and Appendix A). We also detected in the X-rays three ALMA sources in the DRC field that are not yet identified spectroscopically (Appendix B).
3.1 X-ray emission from DRC-1
DRC-1 is significantly detected () in the full band (Fig. 2) and hard band with and net counts, respectively, while it is not detected in the soft band ( net counts). The hardness ratio444The hardness ratio is defined as , where and are the net counts in the soft band and hard band, respectively. It can be used to derive a simple description of the spectral shape of an X-ray source. corresponds to an effective photon index . If we assume an intrinsic power-law spectrum with , the limit implies a lower limit on the obscuring column density of . This spectral model implies fluxes and in the soft and hard bands, respectively. Correcting for a column density of , we estimate a rest-frame X-ray luminosity of .
Despite the very limited number of detected photons, we extracted the X-ray spectrum and fitted it with a simple absorbed power-law model (phabs*zphabs*pow in XSPEC,555XSPEC v.12.9 (Arnaud, 1996), https://heasarc.gsfc.nasa.gov/xanadu/xspec/. We fitted the X-ray spectrum using the modified Cash statistics (Cash, 1979, https://heasarc.gsfc.nasa.gov/xanadu/xspec/manual/XSappendixStatistics.html) where phabs accounts for Galactic absorption; Kalberla et al. 2005), fixing . We used the W-statistic,666https://heasarc.gsfc.nasa.gov/xanadu/xspec/manual/XSappendixStatistics.html which extends the Cash (1979) statistic in the case of background-subtracted data. The best-fitting model returns a column density , fluxes of and , and an absorption-corrected luminosity . According to these values, which are in line with those estimated from the hardness ratio, DRC-1 hosts a heavily obscured, and possibly Compton-thick, AGN with moderate luminosity.
DRC-1 is the confirmed protocluster member with the highest molecular gas mass (), and one of the most massive in terms of stellar mass (; Long et al., 2020). Moreover, it is resolved into three star-forming clumps by a high-resolution () ALMA observation at 870 m (Oteo et al., 2018, see green contours in Fig. 2) and rest-frame UV HST observations (Long et al., 2020). Both the availability of a large gas reservoir and possible galaxy interaction are thought to trigger luminous AGN activity (e.g., Vito et al., 2014; Donley et al., 2018; Weigel et al., 2018). SMGs, in particular, are both gas rich and often associated with galaxy mergers (e.g., Alexander & Hickox, 2012; Narayanan et al., 2015, and references therein), as in the case of DRC-1. Therefore, it is not surprising to find luminous and obscured AGN among them (e.g., Ivison et al., 1998, 2019; Wang et al., 2013). Due to Chandra ’s angular resolution and the limited photon statistics, we are unable to identify which of the three clumps constituting DRC-1 is the X-ray source, or if more than one of them provides significant contributions to the total X-ray emission.
DRC-1 is forming stars at a powerful rate (; Oteo et al. 2018; Long et al. 2020). X-ray emission from high-mass X-ray binaries (HMXBs), which is proportional to SFR (e.g., Bauer et al., 2002; Ranalli et al., 2003, 2005; Basu-Zych et al., 2013; Symeonidis et al., 2014; Lehmer et al., 2019), can thus contribute significantly to the X-ray emission detected from this source. The formation timescale of HMXBs after a star-formation event is on the order of Myr (e.g., Fragos et al., 2013; Garofali et al., 2018). To estimate the contribution of HMXBs to the X-ray emission of DRC-1, we used the Fragos et al. (2013) model 269 of the evolution of /, which has been found by Lehmer et al. (2016) to be the one that best agrees with observational data up to . According to such a model, a value of at can produce an X-ray luminosity of , a factor of times lower than the estimated luminosity of DRC-1. Moreover, XRB populations usually produce X-ray spectra softer than the emission detected from DRC-1 (e.g., Mineo et al., 2012; Lehmer et al., 2015).
Several caveats should be noted when using this argument. For instance, the Fragos et al. (2013) theoretical models have been observationally validated only up to , although they are consistent with results at (Vito et al., 2016). Moreover, the physical assumptions made by Fragos et al. (2013) might not be valid for sub-mm bright DSFGs. For instance, at a fixed SFR, the X-ray emission produced by XRBs is expected to decrease with increasing metallicity (e.g., Basu-Zych et al., 2016; Brorby et al., 2016; Fornasini et al., 2019, 2020). The metallicity of high-redshift DSFGs is probably higher than that of the typical galaxy population (e.g., Swinbank et al., 2004; Rigopoulou et al., 2018; De Breuck et al., 2019). Therefore, the XRB contribution to the X-ray luminosity has been observed to be lower in DSFGs than in typical star-forming galaxies. Hereafter we will consider the X-ray emission in DRC-1 to be primarily produced by an AGN.
3.2 X-ray emission from DRC-2
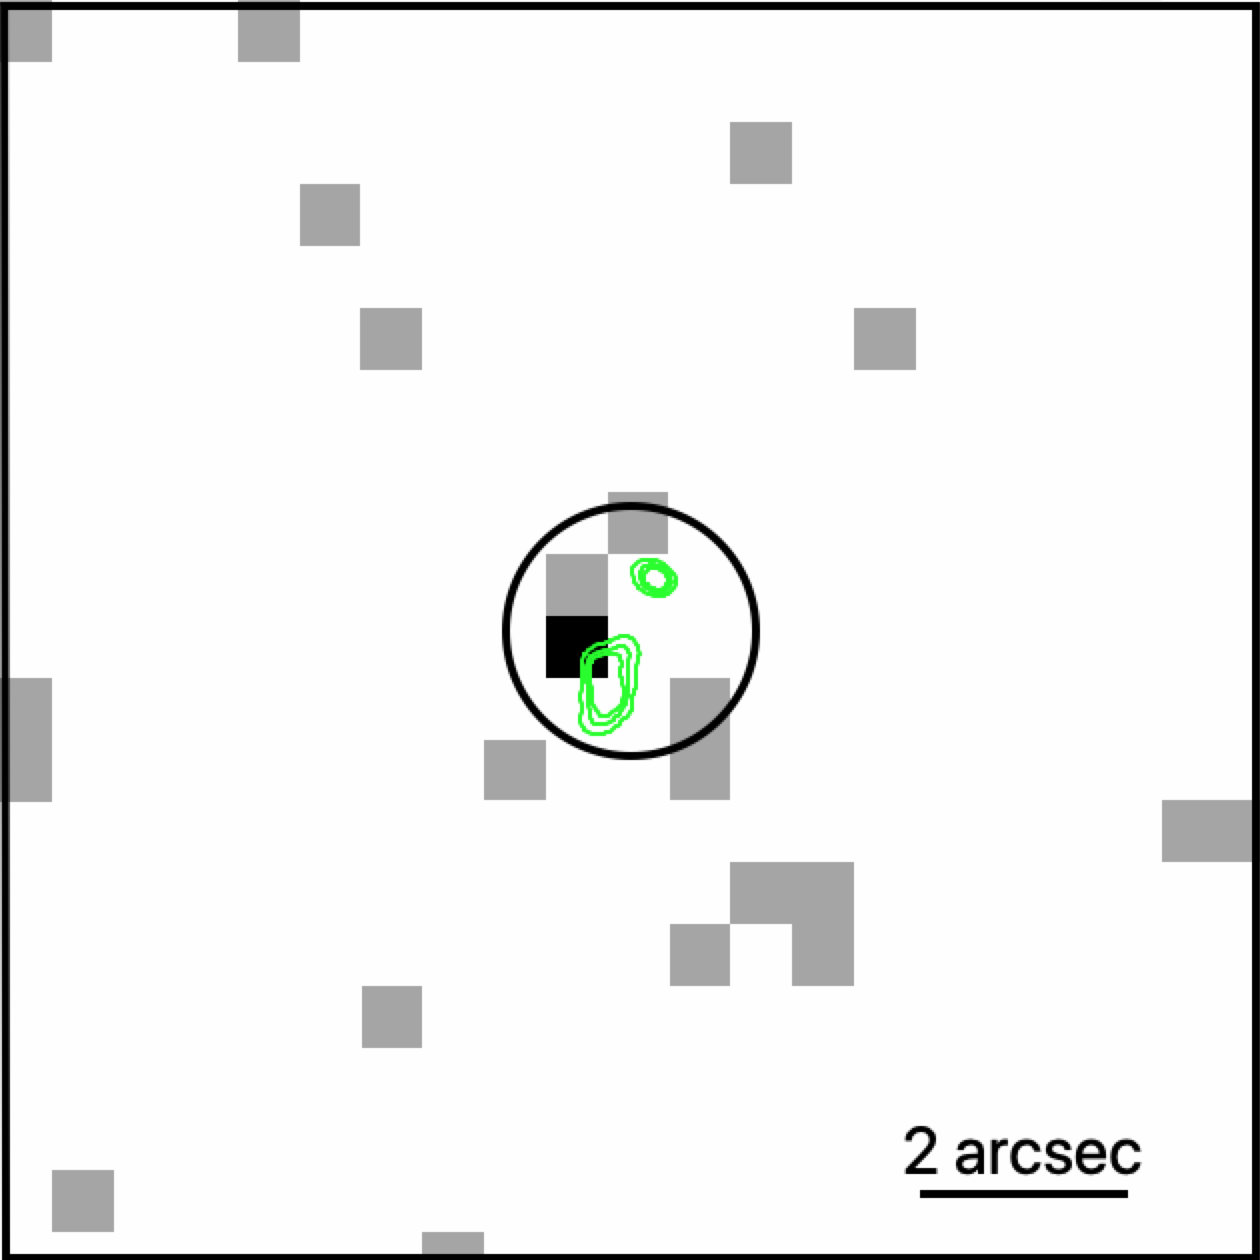
DRC-2 (Fig. 3) is detected in the full band ( net counts) and hard band ( net counts), while it is not detected in the soft band ( net counts). Such relatively bright emission at high energies (10–35 keV in the rest frame) not associated with a soft-band detection is indicative of heavy obscuration. Fitting the X-ray spectrum with a simple power-law, we obtained a very hard effective photon index (i.e., ).
We first modeled the DRC-2 X-ray spectrum with an absorbed power-law emission (wabs*zphabs*pow in XSPEC). Due to the limited photon counting statistics, we fixed . The best-fitting model returns a hard-band flux . The intrinsic absorbing column density along the line of sight is , and the absorption-corrected rest-frame luminosity is . However, this simple spectral model may not be a good representation of the X-ray emission in the case of heavy obscuration, as additional components, such as scattered emission, become increasingly important.
Therefore, we also fit the DRC-2 X-ray spectrum with the MYTorus model (Murphy & Yaqoob, 2009), which treats self-consistently both the transmission and the reflected components. Due to the limited photon counting statistics, we fixed , the normalization of the scattered and line components to that of the transmitted component, and the inclination angle to 90 deg. The best-fitting model returns , while we derived only a lower limit on the column density ().777We restricted the hard upper limit of in the MYTorus model from to , as for the column density and the power-law component normalization become completely degenerate and insensitive to the data, due to the limited photon statistics, leading to the appearance of a second minimum of the fit statistics at . The absorption-corrected rest-frame X-ray luminosity is . A pure reflection model, obtained by setting the normalization of the transmitted component to zero, returns an equally good quality fit, with intrinsic .
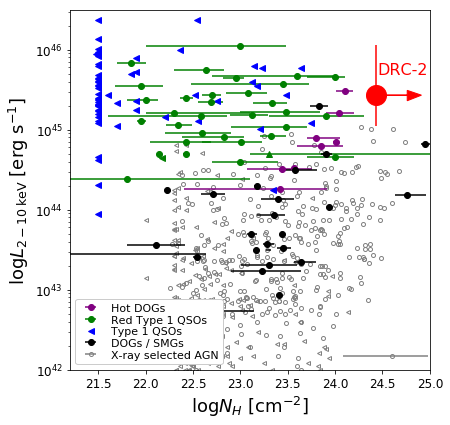
In Fig. 4 we compare the best-fitting parameters for DRC-2, derived with the MYTorus model, with other sub-populations of AGN. The X-ray luminosity of DRC-2 is typical of luminous optically selected Type 1 QSOs. However, DRC-2 is obscured by a large column density, similar to some luminous hot dust-obscured galaxies (Hot DOGs) and X-ray selected AGN with moderate luminosity. DRC-2 is therefore one of the most luminous and distant QSOs deeply buried in Compton-thick material (e.g., Vito et al., 2018), and the first one to be found in a protocluster environment (e.g., Lehmer et al., 2009a; Digby-North et al., 2010).
DRC-2 is the second most gas-rich () and star-forming (; Oteo et al., 2018; Long et al., 2020) member of the protocluster after DRC-1. Moreover, like DRC-1, it is resolved into multiple rest-frame UV components, suggesting ongoing galaxy interaction. These properties confirm the presence of a strong link between massive gas reservoirs, galaxy interactions, and powerful and obscured nuclear activity. Given the SFR of DRC-2, the Fragos et al. (2013) model predicts that HMXBs would only produce a factor weaker X-ray emission than the measured luminosity. The same caveats regarding XRBs discussed at the end of § 3.1 hold also for DRC-2.
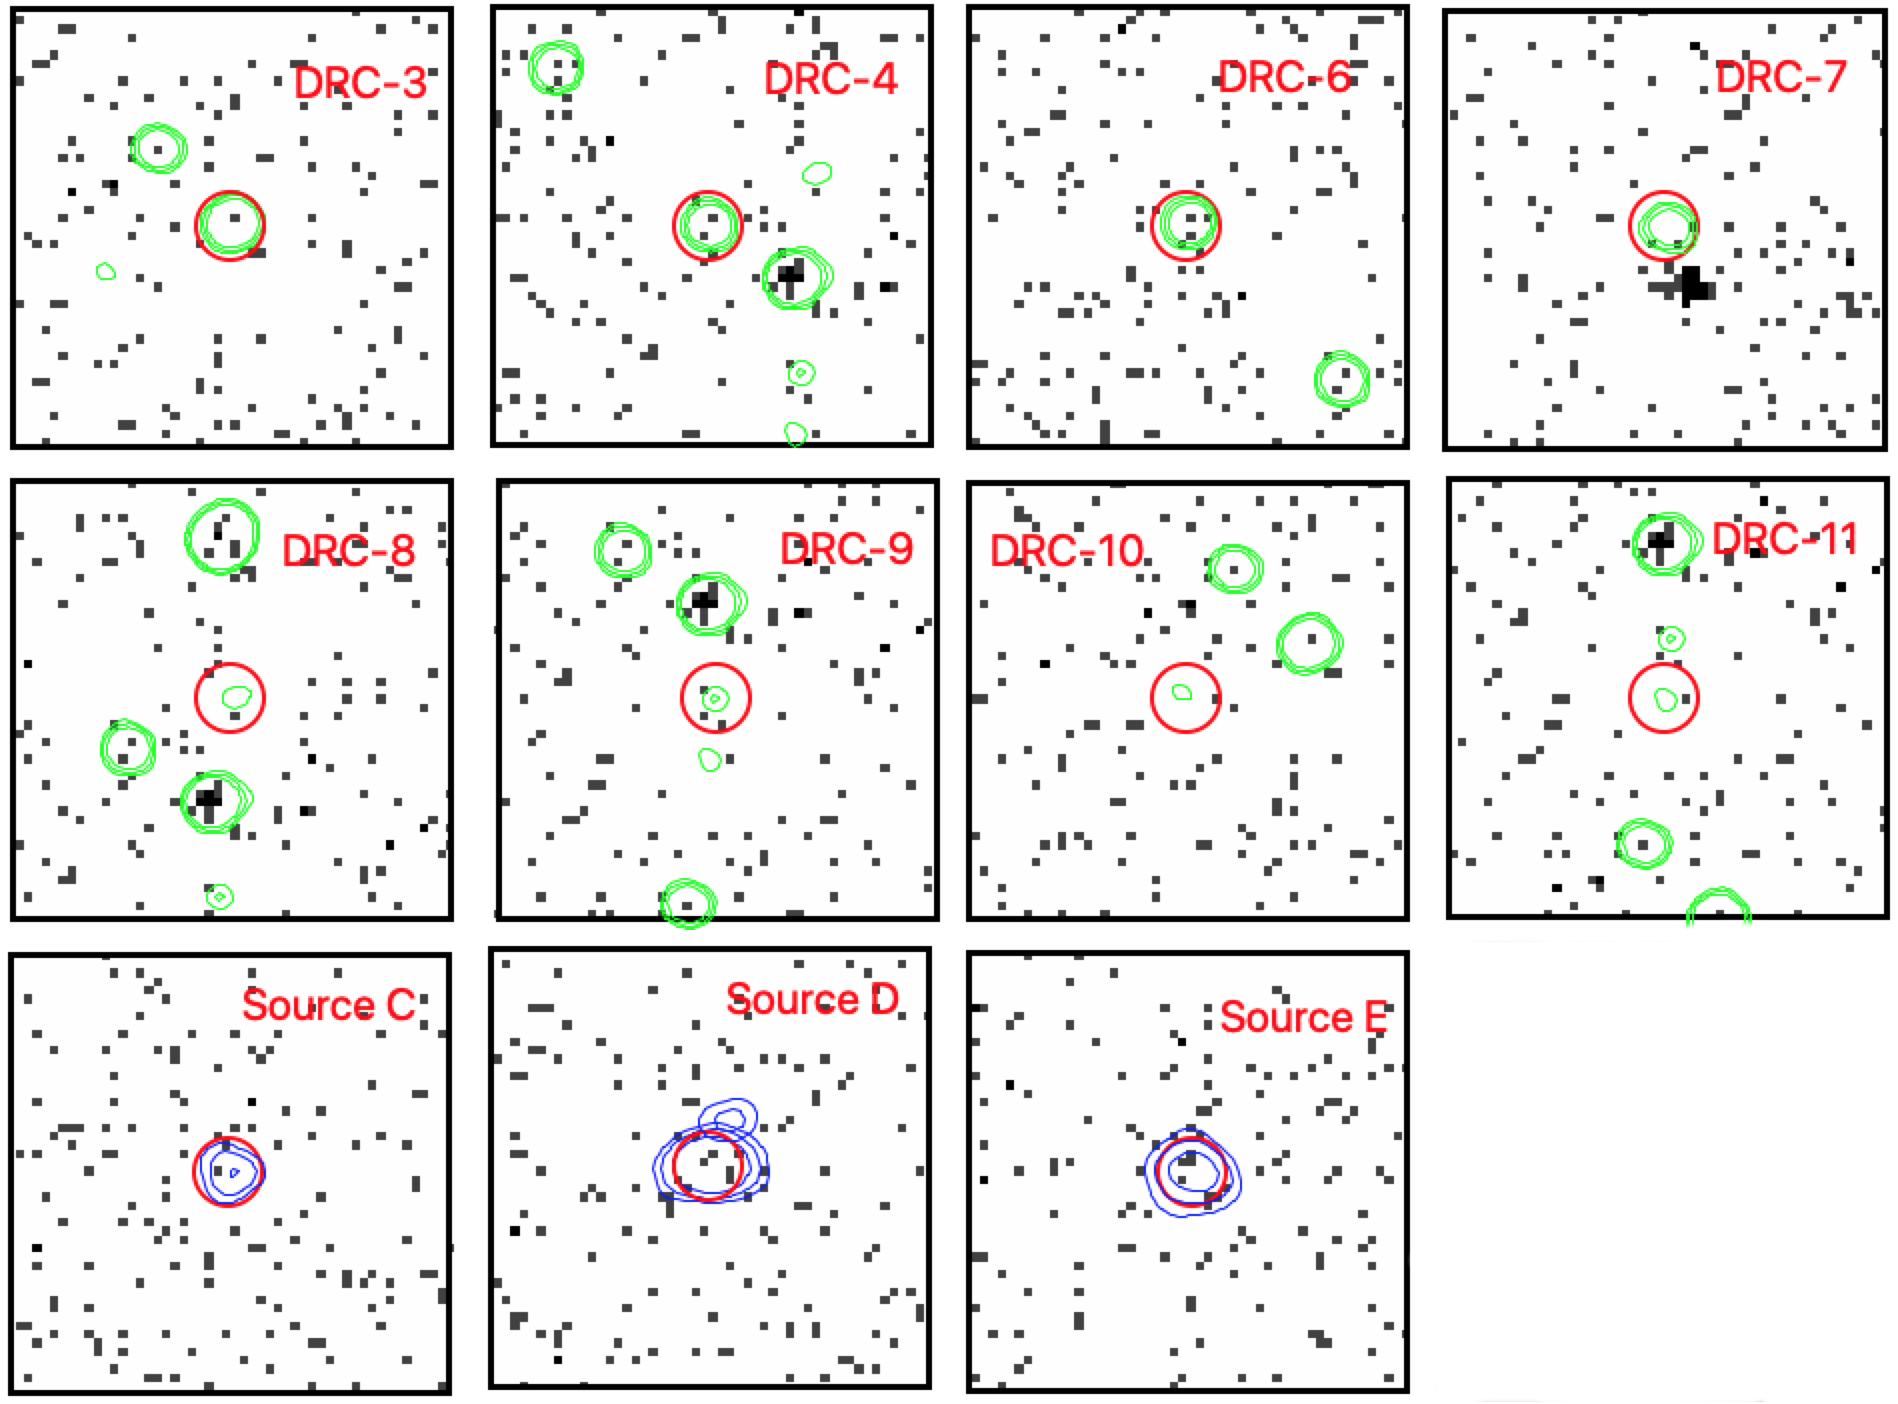
3.3 Stacking results for undetected sources
Stacking analysis can be used to place constraints on the average X-ray emission of the spectroscopically confirmed members of the structure that are not detected individually by Chandra: i.e., DRC-3, DRC-4, DRC-6, DRC-7, DRC-8, DRC-9, DRC-10, DRC-11, Source C, Source D, and Source E (see Appendix A for individual X-ray images). First, we used the dmfilth tool to mask field X-ray sources detected with wavdetect at a significance of in the full band. Then we stacked the Chandra emission centered on the ALMA positions with the dmimgcalc tool in the three standard X-ray bands. Fig. 5 presents the stacked image in the full band, which has an effective exposure time of Ms.
We used a circular aperture to extract the source photometry of the stacked images (16 total counts in the full band), and annular regions with inner and outer radii of arcsec and arcsec, respectively, to extract the background photometry. We detected () stacked emission in the full band with net counts, while the stacked emission in both the soft and hard bands is slightly below the detection threshold. Assuming power-law emission, characteristic of the cosmic X-ray background, the stacked photometry corresponds to an average flux and an average rest-frame luminosity . Therefore, our stacking analysis suggests that nuclear activity with low or moderate accretion rate and possibly obscured may be ongoing even among the DRC members that are not individually detected in our Chandra observations. We note that the reported luminosity is order of magnitude higher than the expected X-ray emission from XRBs (Fragos et al., 2013), given the typical of a few of the stacked galaxies (e.g., Oteo et al., 2018; Long et al., 2020) .
While all galaxies contribute at most to the stacked X-ray flux, one of them, DRC-6, is a known radio galaxy (see § 1 and 4.5) that is expected to emit in the X-ray band, and in fact provides one of the major contributions (3 out of the 16 total counts in the source region). We repeated the stacking analysis excluding DRC-6, and found that the significance of the stacked emission decreases to (i.e., slightly below the detection threshold we set for the detection of individual sources in § 3). This result implies that X-ray sources in the stacked galaxies, if present, are low luminosity and possibly obscured AGN, although a fractional contribution from XRBs cannot be excluded.
4 Discussion
The presence of luminous and obscured QSO candidates revealed by Chandra in DRC-1 and DRC-2 (see § 3.1 and § 3.2) motivated us to study in more detail the physical properties of these galaxies. In § 4.1 and § 4.2 we fit the SED of DRC-1 and DRC-2, respectively, including the X-ray emission. In § 4.3, we investigate the MUSE datacube to extract the UV spectrum of DRC-2 and search for high-ionization emission lines, which are indicators of nuclear activity in this source. In § 4.4 we discuss the possible link between the hidden QSO in DRC-2 and the nearby LAB (see Fig. 3). Finally, in § 4.5 we compare the AGN content of the DRC with other protoclusters at lower redshifts.
4.1 Spectral energy distribution and the X-ray-to-UV emission ratio of DRC-1
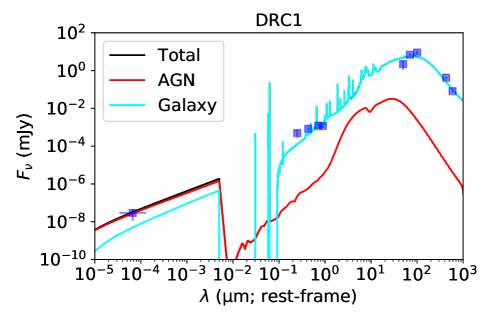
We performed SED fitting of DRC-1 using the X-CIGALE software (Yang et al., 2020), which expands the CIGALE code (Boquien et al., 2019) to include a self-consistent treatment of X-ray photometry, allowing for the decomposition of the DRC-1 SED into AGN and galaxy components. We used similar parameter settings for the galaxy component as in Long et al. (2020), and added an AGN component as in Yang et al. (2020) and Zou et al. (2019). We use the GEMINI/FLAMINGO-2 (), HST WFC3 (F125W), Spitzer IRAC ( and ), Herschel/SPIRE (, , ), and ALMA (2 mm and 3 mm) photometry reported in Tab. 1 of Long et al. (2020). We also added the absorption-corrected X-ray flux corresponding to the best-fitting absorbed power-law model described in § 3.1. The decomposed SED is shown in Fig. 6.
The resulting best-fitting stellar mass () and SFR () are consistent with the results of Long et al. (2020). In addition, thanks to the X-ray data, we can investigate the AGN component, which is sub-dominant at all of the sampled wavelengths, except for the X-ray band. The AGN bolometric luminosity, log, is consistent with a bolometric correction of a few tens, given the X-ray luminosity we derived in § 3.1, which is typical of moderately luminous QSOs (e.g. Lusso et al., 2012; Duras et al., 2020). Having estimated of the AGN bolometric luminosity, we can derive the black-hole accretion rate as , where we assumed a standard radiation efficiency . We found .
X-CIGALE returns also the ratio between the X-ray and UV emission in QSOs, which is usually parametrized with the quantity (e.g., Brandt & Alexander 2015 and references therein). carries information on the physical structure of the hot-corona and accretion-disk system in QSOs (e.g., Lusso & Risaliti, 2017), and is well known to anti-correlate with the UV luminosity (e.g., Steffen et al., 2006; Just et al., 2007; Lusso & Risaliti, 2016). The deviation of the measured value of from the expectation of the anti-correlation with UV luminosity is measured with the parameter . The best-fitting SED model of DRC-1 returns and ; i.e., the X-ray-to-UV luminosity ratio of DRC-1 is well consistent with the predicted value.
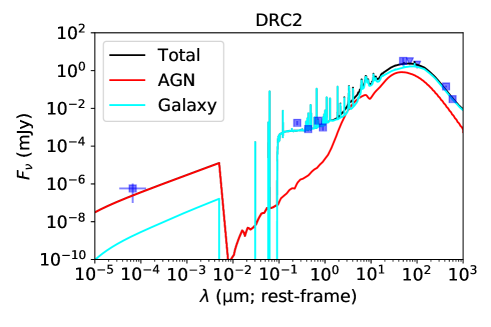
4.2 Spectral energy distribution and the X-ray-to-UV emission ratio of DRC-2
We repeated the SED fitting procedure with X-CIGALE for DRC-2, using the photometry reported in Tab. 1 of Long et al. (2020), and the absorption-corrected X-ray flux corresponding to the best-fitting MYTorus model described in § 3.2. The decomposed SED is shown in Fig. 6. The resulting best-fitting stellar mass () and SFR () are in agreement with the results of Long et al. (2020). X-CIGALE returns an AGN bolometric luminosity of log. In contrast with this value, scaling the X-ray luminosity derived in § 3.2 with the bolometric corrections of Lusso et al. (2012) and Duras et al. (2020), we would have expected log. We estimate the accretion rate of DRC-2 in the range , depending whether the bolometric luminosity derived from SED fitting or scaled from the X-ray emission is assumed.
The discrepancy between the two estimates of the bolometric luminosity can be explained if the QSO hosted in DRC-2 is particularly X-ray bright with respect to its intrinsic UV emission. The best-fitting SED model of DRC-2 returns and . This value of corresponds to a factor of times higher X-ray luminosity than the expectation from the relation, and is significantly higher than the value expected for typical radio-quiet QSOs (i.e., ), but still consistent with the upper bound of the distribution of the radio-quiet QSO population (e.g., Gibson et al., 2008; Vito et al., 2019).
Enhanced X-ray emission is often observed in radio-loud QSOs (e.g., Miller et al., 2011; Ballo et al., 2012), due to the contribution of the jets to the total X-ray emission via inverse Compton scattering of external photons or synchrotron self-Compton scattering (e.g., Medvedev et al., 2020; Worrall et al., 2020). DRC-2 is covered with VLA (28 GHz) and ATCA (5.5 GHz) observations, but it is not detected (Oteo et al., 2018). However, radio jets can have steep radio spectra, and may remain undetected at the high rest-frame frequencies probed by such data. Additional sensitive radio observations at lower frequencies are required to confirm the presence of radio jets in DRC-2.
Another possible explanation for the discrepancy between the bolometric luminosity derived from SED fitting and that inferred directly from the X-ray emission is related to the fitted Herschel fluxes. These have been derived by Long et al. (2020) with a thorough and complex deblending procedure using the ALMA 2 mm fluxes as priors, as the PSF of Herschel is too large to resolve the individual DRC members. We investigated the effect of an underestimate of the far-IR fluxes produced by DRC-2. In particular, we repeated the SED fitting procedure under the extreme assumption that the entire DRC fluxes in the Herschel bands were associated with DRC-2. We found log, which is consistent with the luminosity inferred from X-ray data only. We also note that DRC-2 is resolved into multiple components by HST, but the used photometry refers to the entire system.
4.3 UV spectrum of DRC-2
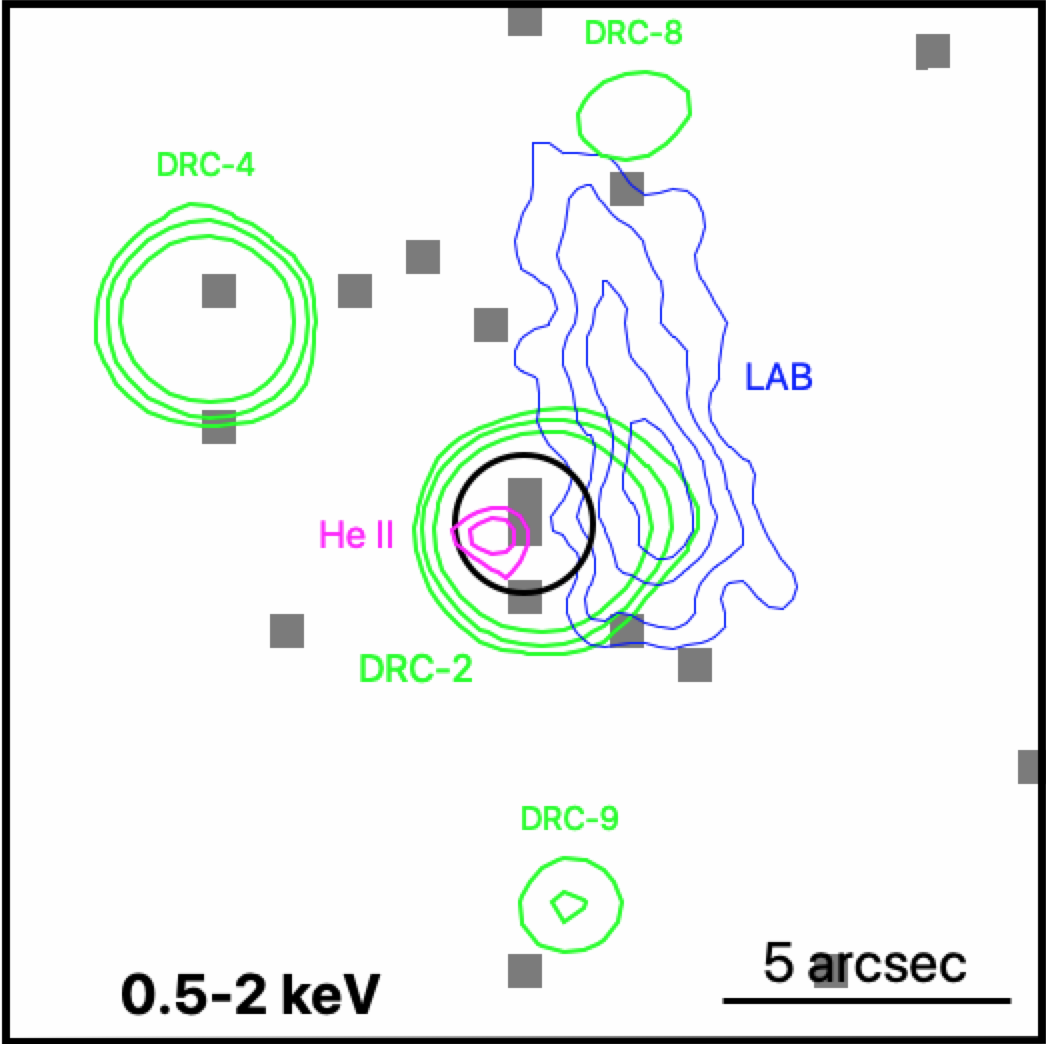
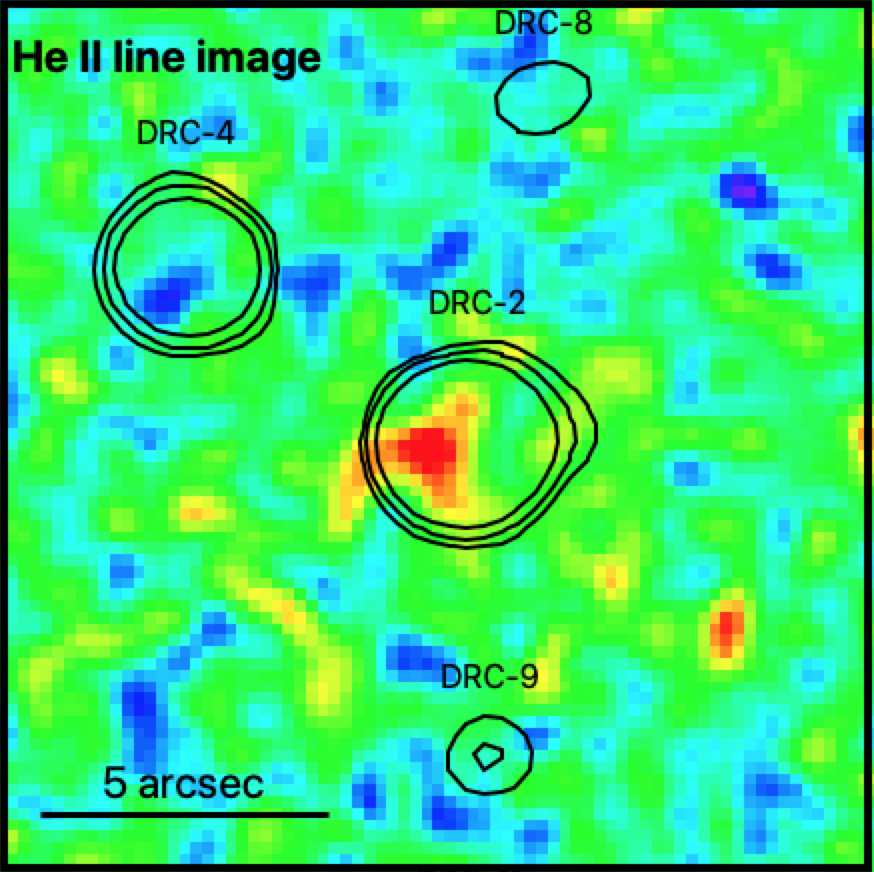
We investigated the MUSE datacube (Oteo et al., 2018) at the position of DRC-2 to search for high-ionization emission lines, like C IV and He II . The presence of these features requires a strong and hard UV continuum, such as that produced by nuclear accretion. We found significant emission at (Fig. 7) at from the ALMA and Chandra positions of DRC-2 (see Fig. 3), which we identify with the He II emission line redshifted at . The He II line can also be produced by extremely young () Pop III stars (Schaerer, 2003) or metal-poor HMXBs (e.g. Eldridge & Stanway, 2012; Schaerer et al., 2019; Stanway et al., 2020). However, as we noted also for DRC-1 in § 3.1, these are dusty (i.e., already enriched with metals) and massive galaxies, which are unlikely to be forming metal-poor stars. Therefore, the ionizing photons required for He II line emission in this galaxy are most likely associated with the nuclear accretion we found in § 3.2.
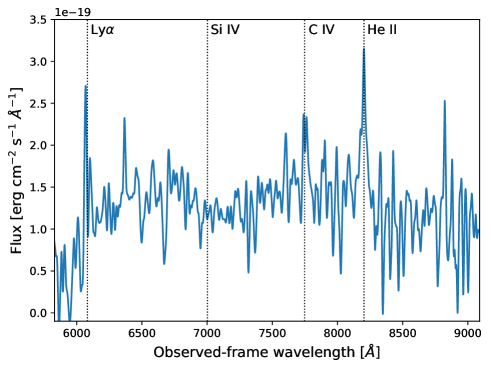
Fig. 8 presents the MUSE spectrum at the position of the He II emission line in DRC-2. We mark the expected wavelengths at of some of the strongest AGN emission features with vertical dashed lines. Besides the strong He II line, we also identify emission and a drop in the faint continuum emission expected at rest-frame due to the forest and the Lyman break. It is unclear if the line in Fig. 8 is produced by the hidden QSO or if it is due to contamination by the LAB, since the extraction region is located at the border of the extended emission. We also note that the C IV line can be identified in the MUSE spectra, although it falls in a spectral range with strong noise residuals. The detected UV emission could also be due to young and hot stars, although the presence of the C IV and He II lines point toward an AGN origin. We do not find strong evidence for extended C IV or He II emission in the LAB.
Similar heavily obscured, extremely luminous QSOs with “leaking” UV emission are the hot dust-obscured galaxies (Hot DOGs) presented by Assef et al. (2015, 2019) in which, according to the authors, the emission from the hidden central QSO is scattered by gas and dust into the line of sight. This scenario helps to explain the weakness of the UV emission relative to the intrinsic QSO power derived by SED decomposition and X-ray observations in those Hot DOGs. Similar physical processes may be in place in DRC-2, which has an estimated intrinsic luminosity similar to the Assef et al. QSOs.
4.4 DRC-2 as the powering source of the LAB
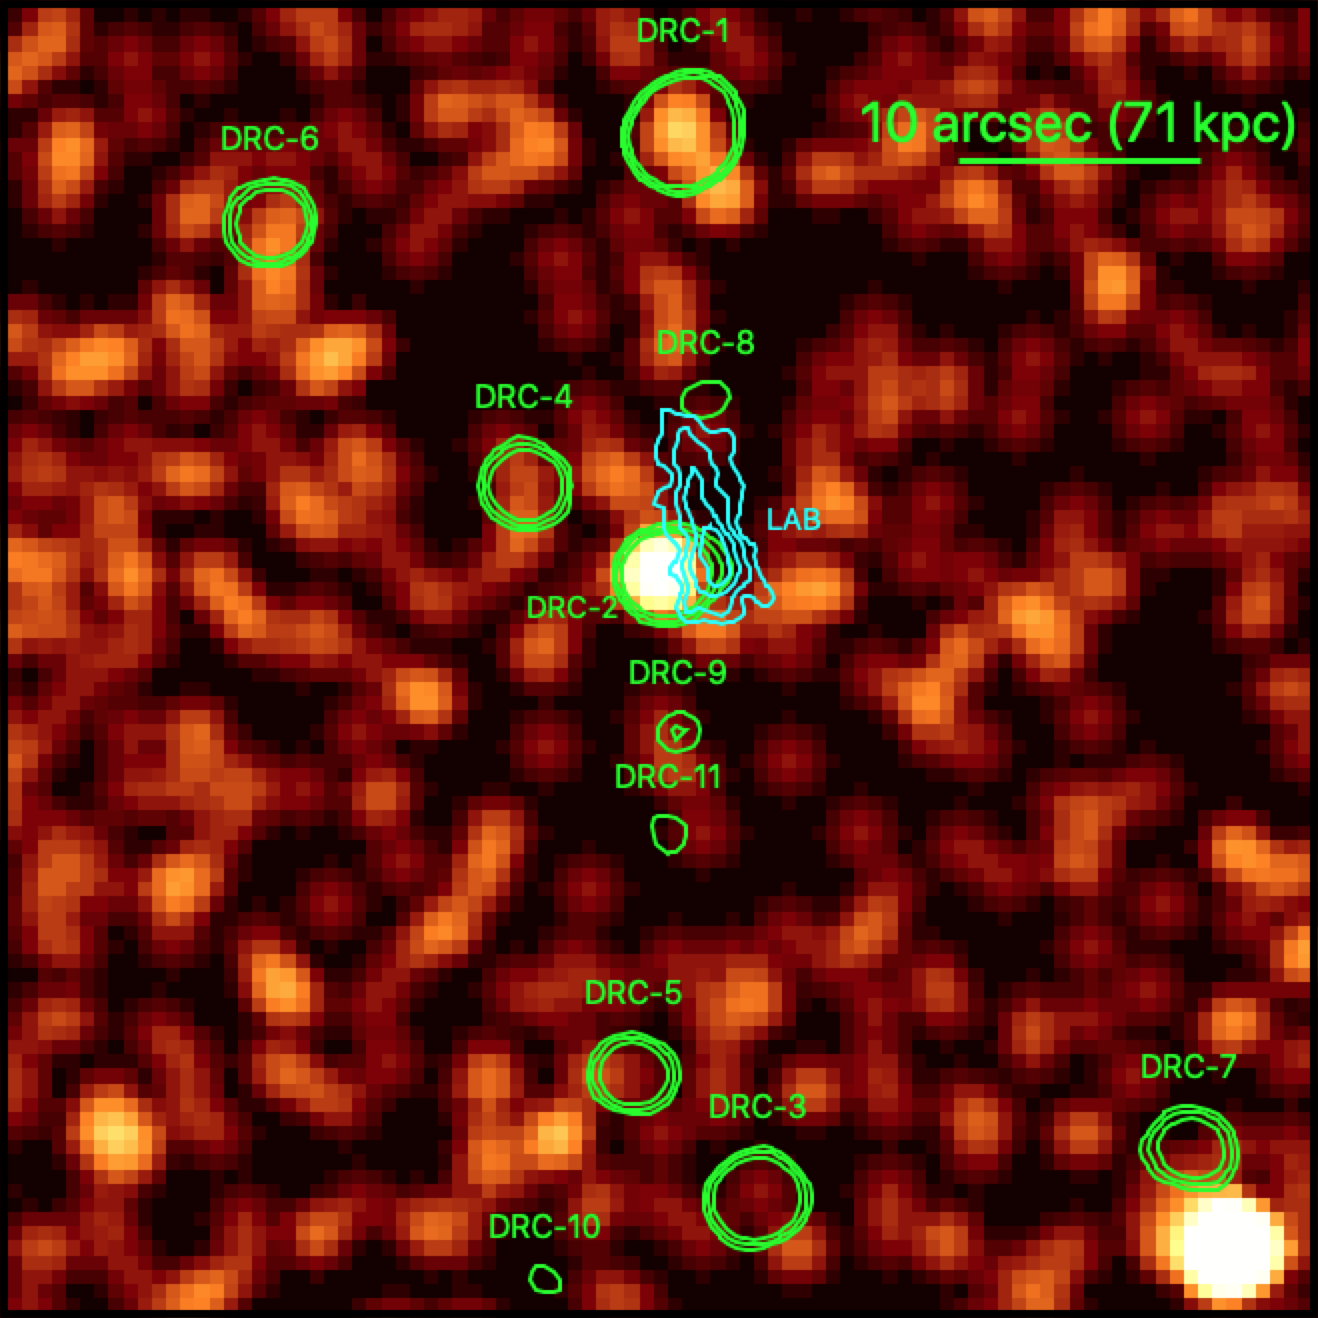
LABs trace large reservoirs of cold gas, possibly flowing through cosmic filaments and fueling both star formation and SMBH accretion (e.g., Umehata et al., 2019). Oteo et al. (2018) reported the detection with MUSE of an LAB (with size kpc) in the central part of the DRC, close to the position of DRC-2 (see Fig. 1 and 3). The projected distance between the X-ray source centroid and the peak of the extended emission is , corresponding to kpc at . The heavily obscured and luminous QSO hiding in DRC-2, as revealed by Chandra , is the most obvious source to power the extended emission (e.g., Geach et al. 2009; Overzier 2016), although independent mechanisms cannot be ruled out (e.g., “cooling radiation”; e.g., Haiman et al. 2000). The LAB luminosity (log) is in line with other LABs powered by radio-quiet obscured QSOs (e.g., Geach et al., 2009; Overzier et al., 2013; Borisova et al., 2016). Extended emission powered by QSOs can be produced by photoionization due to a strong ionizing flux of the central source or by resonant scattering of the photons emitted in the QSO emission line regions.
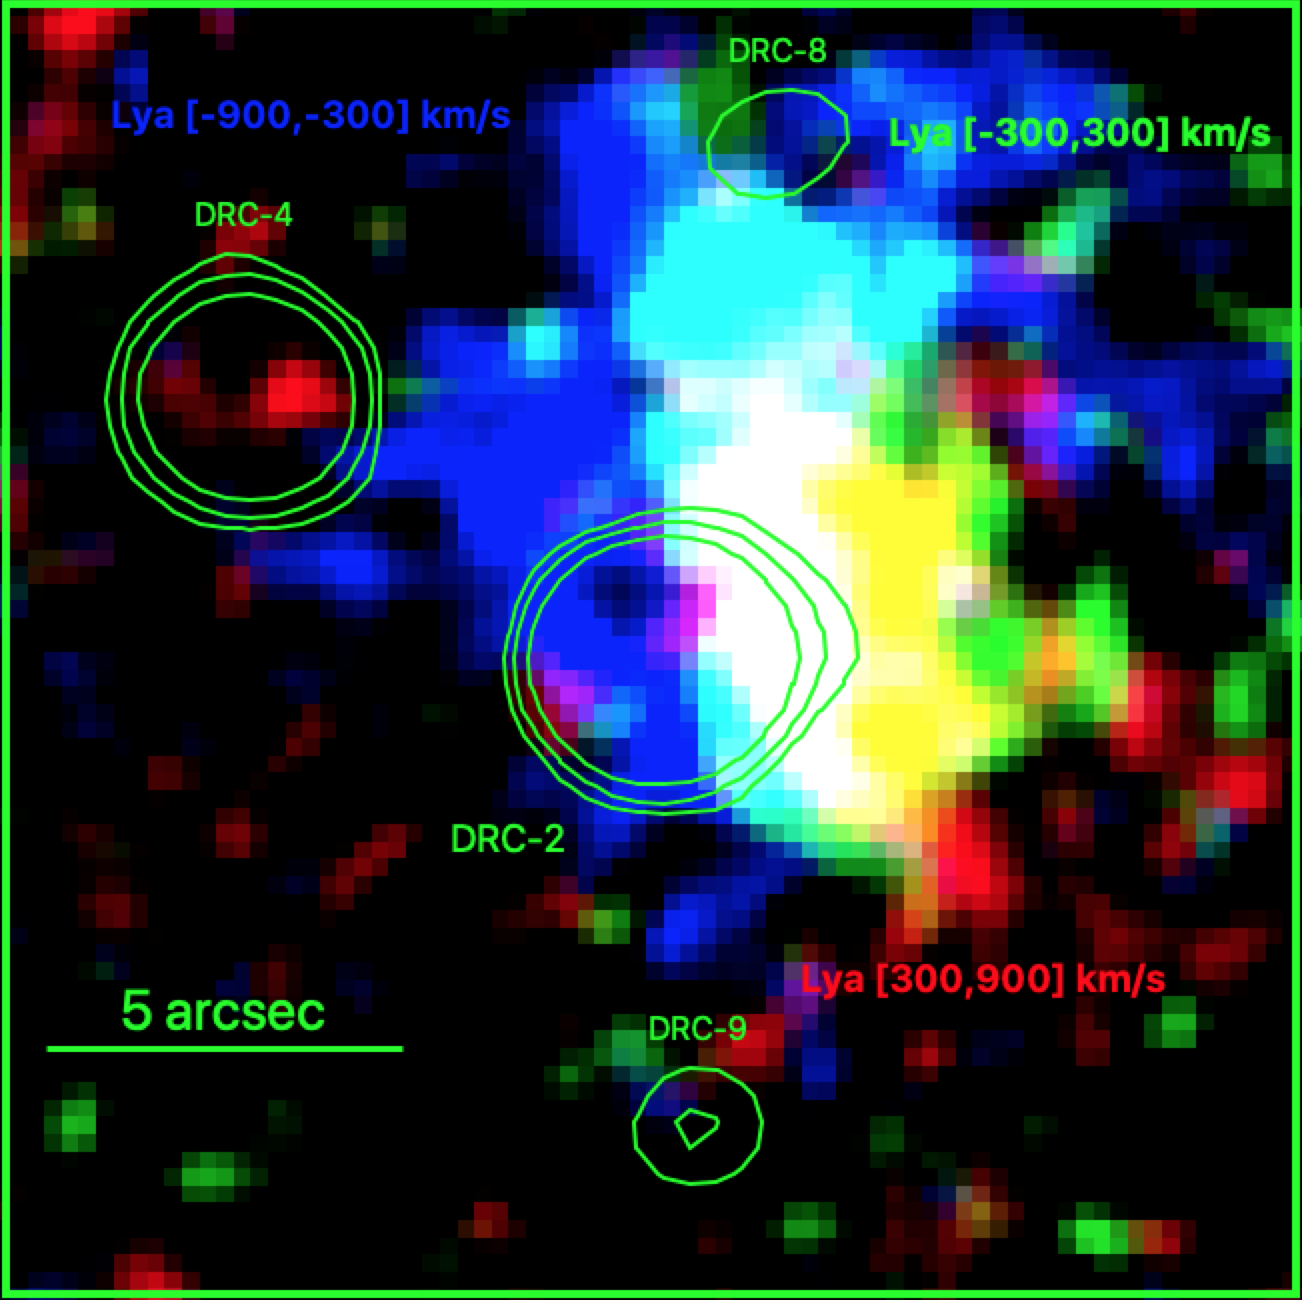
Another intriguing, but currently quite speculative, possibility is that the extended emission traces gas shocked by a QSO-driven or starburst-driven outflow. Oteo et al. (2018) showed that the profile of the CO(4–3) emission line in DRC-2 is strongly asymmetric and double peaked (). Moreover, the ALMA continuum emission (with an angular resolution of ) is elongated toward the projected position of the maximum of the extended intensity (see green and cyan contours in Fig. 1 and 3). While these findings could be related to the multiple components revealed with HST contributing to the total ALMA flux with different velocities, they may also be due to outflowing material. The extended emission also appears to be structured in velocity space (Fig. 9). In particular, the emission at the position of maximum intensity is redshifted with respect to the outer parts of the LAB. The double peaked CO(4–3) emission line and the positional coincidence of the tip of the elongated ALMA emission with the maximum surface brightness may be indicative of the presence of a massive dusty and molecular outflow ejected from the DRC-2 nuclear regions. The mechanical push of the ouflowing material on the gas can also explain the redshifted emission at the impact point. However, most of these properties can also be ascribed to projection effects, and an inflow scenario cannot be excluded. New ALMA spectroscopic observations of molecular lines with higher sensitivity and angular resolution () will securely identify a possible massive outflow, allowing us to assess its geometry and its possible contribution to the powering of the LAB. Moreover, deeper MUSE observations of the LAB will study in detail its geometry and velocity structure.
4.5 AGN content in the structure
In order to compare the AGN content of the DRC protocluster with similar structures at lower redshifts, we considered only AGN identified in sub-mm galaxies (SMGs), which were confirmed spectroscopically to belong to each structure. Among the 13 spectroscopically identified members of the DRC protocluster, we detect two X-ray AGN (DRC-1 and DRC-2). Oteo et al. (2018) reported that DRC-6, which is not detected in our Chandra observations, is a radio galaxy (see § 1). Therefore DRC-6 likely hosts a low-luminosity and/or obscured AGN. Thus, the fraction of known AGN among DSFGs in this protocluster is . Considering only X-ray detected sources, the fraction is , which is consistent with the X-ray selected AGN fraction in field SMGs (e.g., Wang et al., 2013). However, as discussed in § 3.3, some of the DRC protocluster members undetected in our Chandra observations may host low-luminosity AGN, resulting in a higher intrinsic AGN fraction.
We compare these values with the results found for SSA22, a massive protocluster at . Considering only the 8 SMGs detected at 1.1 mm in this structure (Umehata et al., 2015), 4 of them () are X-ray detected AGN (Lehmer et al., 2009a).888A ninth SMG in SSA22 which lacks spectroscopic confirmation but is associated with a photometric redshift of (i.e., a likely member of SSA22) is also detected in the X-rays. Although the 400 ks Chandra observation of SSA22 at reaches a deeper flux limit and intrinsic luminosity limit than our observation of the DRC, all of the X-ray AGN among SMGs in SSA22 have fluxes , and could have been detected in our Chandra observation. Therefore, in this sense, the comparison is fair. A caveat instead arises from the selection of SMGs in the two structures, as 1 mm observations have been used for SSA22 at , while SMGs in the DRC structure at have been selected in 2 mm and 3 mm observations.
Another well-studied, massive protocluster is the structure at discovered by Steidel et al. (2005) in the field of the QSO HS 1700+643. Using 200 ks Chandra observations, Digby-North et al. (2010) did not find a significant enhancement of X-ray selected AGN among galaxy members of that protocluster. Recently, Lacaille et al. (2019) presented SCUBA-2 observations of the same field at m and m. In order to estimate the AGN content among the 4 spectroscopically confirmed sub-mm galaxies in the HS 1700+643, we matched their coordinates with the positions of X-ray sources in the Chandra Source Catalog 2.0,999https://cxc.harvard.edu/csc/ finding no match. This result corresponds to an AGN fraction among sub-mm galaxies of .
From the comparison discussed in this section, we conclude that the AGN fraction in sub-mm galaxies in the DRC protocluster is not significantly different from those in similar structures at lower redshift, although the statistics upon which this result is based are limited. Future observations of the DRC protocluster aimed at identifying emitter and Lyman-break galaxies will allow the investigation of the AGN content in the more general galaxy population, and comparison of the results with a larger sample of similar structures for which sub-mm/mm observations are currently lacking (e.g., Lehmer et al. 2009b; Digby-North et al. 2010; Krishnan et al. 2017, but see also Macuga et al. 2019).
Considering the BHAR values described in § 4.1 and 4.2, BH accretion in the DRC is strongly dominated by DRC-2, which accretes times faster than DRC-1, the second most luminous AGN in the structure. As discussed above, DRC-6 likely hosts a low-luminosity AGN, thus most probably characterized by a low BHAR. From the stacking analysis performed in § 3.3, the typical BHAR of individually undetected DRC members is , and thus their cumulative accretion rate is comparable to, or even higher than, the BHAR of DRC-1.
5 Conclusions
We presented new Chandra observations (139 ks) of the DRC, a starbursting and gas-rich protocluster, constituted of at least 13 DSFGs at . We summarize here the main results.
-
•
We detected in the X-ray band two members of the protocluster, DRC-1 and DRC-2. Both sources present a hard X-ray spectrum, consistent with being heavily obscured. These two SMGs have the highest gas content among the protocluster members (Oteo et al., 2018). Moreover, high-resolution ALMA and HST imaging resolved them into multiple likely interacting star-forming clumps. This is consistent with the idea that the availability of a large amount of gas and galaxy interactions, both of which are enhanced in gas-rich, unvirialized overdensities at high redshift, can trigger fast and obscured SMBH accretion.
-
•
DRC-1 is detected in the full and hard X-ray bands. From X-ray hardness ratio arguments and basic spectral analysis we estimated a high obscuration level () and moderate intrinsic luminosity ().
-
•
DRC-2 is a bright hard X-ray source (), while it is not detected in the soft band. We fitted its X-ray spectrum with the MYTorus model and found a best-fitting column density and intrinsic luminosity . According to these values, DRC-2 hosts a powerful, Compton-thick QSO candidate, with an X-ray luminosity similar to the most-luminous known optically selected type 1 QSOs.
-
•
We fitted the SEDs of DRC-1 and DRC-2 and decomposed them using galaxy and AGN templates. Resulting stellar masses and star-formation rates are consistent with previous findings. Adding the X-ray data, we could investigate for the first time the AGN component in these two galaxies. The bolometric luminosity of the QSO hosted in DRC-1 is in line with the expectation from the X-ray emission. In contrast, the bolometric luminosity of the QSO in DRC-2 derived via SED fitting is a factor of lower than the estimate from X-ray data. While this discrepancy has been found in other radio-quiet QSOs, it could be explained by the presence of radio jets in DRC-2, undetected by current radio observations due to the high rest-frame frequencies that they sample.
-
•
Led by the discovery of a luminous obscured QSO in DRC-2, we investigated previously performed MUSE observations to search for high-ionization emission lines consistent with the position of DRC-2. We derived the rest-frame UV spectrum, detecting the continuum, strong He II and emission lines, and possibly the C IV emission line. Due to the presence of high-ionization emission lines, we consider the UV emission as of nuclear origin. We speculate that the detection of UV continuum and emission lines in a DSFG hosting a Compton-thick QSO might be due to UV photons scattered back into the line of sight, as found in other luminous and obscured QSOs.
-
•
A blob (LAB) was detected by Oteo et al. (2018) with MUSE observations in the proximity of DRC-2. The luminous obscured QSO hosted in this SMG is the most obvious source for powering the LAB, through photoionization or scattering of photons. This implies a largely unobscured line of sight in the direction of the LAB. Alternatively, we propose that DRC-2 could be launching a powerful dusty and molecular outflow that ionized the surrounding gas through shocks, producing the LAB. This interpretation is supported by the highly asymmetric and doubled peaked profile () of the CO(4-3) emission line (Oteo et al., 2018). Moreover, ALMA revealed that the DRC-2 dust emission is elongated toward the LAB, and reaches the peak position of the extended surface brightness.
-
•
Considering also a known radio galaxy in another member of the structure, DRC-6, in addition to DRC-1 and DRC-2, the AGN content among SMGs in this protocluster () is consistent with the fractions estimated for other protoclusters at lower redshifts (). However, an X-ray stacking analysis reveals that nuclear accretion producing X-ray emission below our detection threshold might be ongoing also in other SMG members of the DRC.
Acknowledgements.
We thank the anonymous referee for their prompt and useful comments. We thank E. Vanzella for his help with MUSE data, and A. Long for providing ALMA and HST contours. FV acknowledges financial support from CONICYT and CASSACA through the Fourth call for tenders of the CAS-CONICYT Fund. We acknowledge financial contribution from ANID grants Basal-CATA AFB-170002 (FV, FEB), FONDECYT Regular 1190818 (FEB) and1200495 (FEB), and the Ministry of Economy, Development, and Tourism’s Millennium Science Initiative through grant IC120009, awarded to The Millennium Institute of Astrophysics, MAS (FEB). WNB and FZ acknowledge CXC grant GO9-20099X. RG acknowledges financial contribution from the agreement ASI-INAF n. 2017-14-H.O. CS is grateful for support from the National Research Council of Science and Technology, Korea (EU-16-001). This research has made use of data obtained from the Chandra Data Archive and software provided by the Chandra X-ray Center (CXC) in the application package CIAO. Based on observations collected at the European Organisation for Astronomical Research in the Southern Hemisphere under ESO programme 295.A-5029(A). Images have been produced with SAO Image DS9 (Joye & Mandel, 2003). This research made use of Astropy,101010http://www.astropy.org a community-developed core Python package for Astronomy (Astropy Collaboration et al., 2013, 2018)References
- Alexander et al. (2005) Alexander, D. M., Bauer, F. E., Chapman, S. C., et al. 2005, ApJ, 632, 736
- Alexander & Hickox (2012) Alexander, D. M. & Hickox, R. C. 2012, New A Rev., 56, 93
- Alexander et al. (2016) Alexander, D. M., Simpson, J. M., Harrison, C. M., et al. 2016, MNRAS, 461, 2944
- Arnaud (1996) Arnaud, K. A. 1996, in Astronomical Society of the Pacific Conference Series, Vol. 101, Astronomical Data Analysis Software and Systems V, ed. G. H. Jacoby & J. Barnes, 17
- Assef et al. (2019) Assef, R. J., Brightman, M., Walton, D. J., et al. 2019, arXiv e-prints, arXiv:1905.04320
- Assef et al. (2015) Assef, R. J., Eisenhardt, P. R. M., Stern, D., et al. 2015, ApJ, 804, 27
- Assef et al. (2016) Assef, R. J., Walton, D. J., Brightman, M., et al. 2016, ApJ, 819, 111
- Astropy Collaboration et al. (2018) Astropy Collaboration, Price-Whelan, A. M., Sipőcz, B. M., et al. 2018, AJ, 156, 123
- Astropy Collaboration et al. (2013) Astropy Collaboration, Robitaille, T. P., Tollerud, E. J., et al. 2013, A&A, 558, A33
- Ballo et al. (2012) Ballo, L., Heras, F. J. H., Barcons, X., & Carrera, F. J. 2012, A&A, 545, A66
- Balmaverde et al. (2017) Balmaverde, B., Gilli, R., Mignoli, M., et al. 2017, A&A, 606, A23
- Banerji et al. (2014) Banerji, M., Fabian, A. C., & McMahon, R. G. 2014, MNRAS, 439, L51
- Basu-Zych et al. (2016) Basu-Zych, A. R., Lehmer, B., Fragos, T., et al. 2016, ApJ, 818, 140
- Basu-Zych et al. (2013) Basu-Zych, A. R., Lehmer, B. D., Hornschemeier, A. E., et al. 2013, ApJ, 774, 152
- Bauer et al. (2002) Bauer, F. E., Alexander, D. M., Brandt, W. N., et al. 2002, AJ, 124, 2351
- Boquien et al. (2019) Boquien, M., Burgarella, D., Roehlly, Y., et al. 2019, A&A, 622, A103
- Borisova et al. (2016) Borisova, E., Cantalupo, S., Lilly, S. J., et al. 2016, ApJ, 831, 39
- Brandt & Alexander (2015) Brandt, W. N. & Alexander, D. M. 2015, A&A Rev., 23, 1
- Brodwin et al. (2013) Brodwin, M., Stanford, S. A., Gonzalez, A. H., et al. 2013, ApJ, 779, 138
- Broos et al. (2007) Broos, P. S., Feigelson, E. D., Townsley, L. K., et al. 2007, ApJS, 169, 353
- Brorby et al. (2016) Brorby, M., Kaaret, P., Prestwich, A., & Mirabel, I. F. 2016, MNRAS, 457, 4081
- Bădescu et al. (2017) Bădescu, T., Yang, Y., Bertoldi, F., et al. 2017, ApJ, 845, 172
- Capak et al. (2011) Capak, P. L., Riechers, D., Scoville, N. Z., et al. 2011, Nature, 470, 233
- Cash (1979) Cash, W. 1979, ApJ, 228, 939
- Chiang et al. (2014) Chiang, Y.-K., Overzier, R., & Gebhardt, K. 2014, ApJ, 782, L3
- Corral et al. (2016) Corral, A., Georgantopoulos, I., Comastri, A., et al. 2016, A&A, 592, A109
- Cucciati et al. (2014) Cucciati, O., Zamorani, G., Lemaux, B. C., et al. 2014, A&A, 570, A16
- De Breuck et al. (2019) De Breuck, C., Weiß, A., Béthermin, M., et al. 2019, A&A, 631, A167
- De Lucia et al. (2006) De Lucia, G., Springel, V., White, S. D. M., Croton, D., & Kauffmann, G. 2006, MNRAS, 366, 499
- Digby-North et al. (2010) Digby-North, J. A., Nandra, K., Laird, E. S., et al. 2010, MNRAS, 407, 846
- Donley et al. (2018) Donley, J. L., Kartaltepe, J., Kocevski, D., et al. 2018, ApJ, 853, 63
- Duras et al. (2020) Duras, F., Bongiorno, A., Ricci, F., et al. 2020, A&A, 636, A73
- Eales et al. (2010) Eales, S., Dunne, L., Clements, D., et al. 2010, PASP, 122, 499
- Eastman et al. (2007) Eastman, J., Martini, P., Sivakoff, G., et al. 2007, ApJ, 664, L9
- Ehlert et al. (2014) Ehlert, S., von der Linden, A., Allen, S. W., et al. 2014, MNRAS, 437, 1942
- Elbaz et al. (2007) Elbaz, D., Daddi, E., Le Borgne, D., et al. 2007, A&A, 468, 33
- Eldridge & Stanway (2012) Eldridge, J. J. & Stanway, E. R. 2012, MNRAS, 419, 479
- Fabian (2012) Fabian, A. C. 2012, ARA&A, 50, 455
- Fornasini et al. (2020) Fornasini, F. M., Civano, F., & Suh, H. 2020, MNRAS, 495, 771
- Fornasini et al. (2019) Fornasini, F. M., Kriek, M., Sanders, R. L., et al. 2019, ApJ, 885, 65
- Fragos et al. (2013) Fragos, T., Lehmer, B., Tremmel, M., et al. 2013, ApJ, 764, 41
- Fruscione et al. (2006) Fruscione, A., McDowell, J. C., Allen, G. E., et al. 2006, Society of Photo-Optical Instrumentation Engineers (SPIE) Conference Series, Vol. 6270, CIAO: Chandra’s data analysis system, 62701V
- Fudamoto et al. (2017) Fudamoto, Y., Ivison, R. J., Oteo, I., et al. 2017, MNRAS, 472, 2028
- Garofali et al. (2018) Garofali, K., Williams, B. F., Hillis, T., et al. 2018, MNRAS, 479, 3526
- Geach et al. (2009) Geach, J. E., Alexander, D. M., Lehmer, B. D., et al. 2009, ApJ, 700, 1
- Gibson et al. (2008) Gibson, R. R., Brandt, W. N., & Schneider, D. P. 2008, ApJ, 685, 773
- Gilli et al. (2019) Gilli, R., Mignoli, M., Peca, A., et al. 2019, A&A, 632, A26
- Goulding et al. (2018) Goulding, A. D., Zakamska, N. L., Alexand roff, R. M., et al. 2018, ApJ, 856, 4
- Haiman et al. (2000) Haiman, Z., Spaans, M., & Quataert, E. 2000, ApJ, 537, L5
- Hennawi et al. (2015) Hennawi, J. F., Prochaska, J. X., Cantalupo, S., & Arrigoni-Battaia, F. 2015, Science, 348, 779
- Higuchi et al. (2019) Higuchi, R., Ouchi, M., Ono, Y., et al. 2019, ApJ, 879, 28
- Hill et al. (2020) Hill, R., Chapman, S., Scott, D., et al. 2020, arXiv e-prints, arXiv:2002.11600
- Hodge & da Cunha (2020) Hodge, J. A. & da Cunha, E. 2020, arXiv e-prints, arXiv:2004.00934
- Hopkins et al. (2006) Hopkins, P. F., Hernquist, L., Cox, T. J., et al. 2006, ApJS, 163, 1
- Hopkins et al. (2008) Hopkins, P. F., Hernquist, L., Cox, T. J., & Kereš, D. 2008, ApJS, 175, 356
- Ivison et al. (2020) Ivison, R. J., Biggs, A. D., Bremer, M., Arumugam, V., & Dunne, L. 2020, MNRAS[arXiv:2006.10753]
- Ivison et al. (2016) Ivison, R. J., Lewis, A. J. R., Weiss, A., et al. 2016, ApJ, 832, 78
- Ivison et al. (2019) Ivison, R. J., Page, M. J., Cirasuolo, M., et al. 2019, MNRAS, 489, 427
- Ivison et al. (1998) Ivison, R. J., Smail, I., Le Borgne, J. F., et al. 1998, MNRAS, 298, 583
- Joye & Mandel (2003) Joye, W. A. & Mandel, E. 2003, in Astronomical Society of the Pacific Conference Series, Vol. 295, Astronomical Data Analysis Software and Systems XII, ed. H. E. Payne, R. I. Jedrzejewski, & R. N. Hook, 489
- Just et al. (2007) Just, D. W., Brandt, W. N., Shemmer, O., et al. 2007, ApJ, 665, 1004
- Kalberla et al. (2005) Kalberla, P. M. W., Burton, W. B., Hartmann, D., et al. 2005, A&A, 440, 775
- Kauffmann (1996) Kauffmann, G. 1996, MNRAS, 281, 487
- Kauffmann et al. (2004) Kauffmann, G., White, S. D. M., Heckman, T. M., et al. 2004, MNRAS, 353, 713
- Kormendy & Ho (2013) Kormendy, J. & Ho, L. C. 2013, ARA&A, 51, 511
- Krishnan et al. (2017) Krishnan, C., Hatch, N. A., Almaini, O., et al. 2017, MNRAS, 470, 2170
- Kubo et al. (2019) Kubo, M., Toshikawa, J., Kashikawa, N., et al. 2019, ApJ, 887, 214
- Lacaille et al. (2019) Lacaille, K. M., Chapman, S. C., Smail, I., et al. 2019, MNRAS, 488, 1790
- Lansbury et al. (2020) Lansbury, G. B., Banerji, M., Fabian, A. C., & Temple, M. J. 2020, MNRAS[arXiv:1910.00602]
- Lehmer et al. (2009a) Lehmer, B. D., Alexander, D. M., Chapman, S. C., et al. 2009a, MNRAS, 400, 299
- Lehmer et al. (2009b) Lehmer, B. D., Alexander, D. M., Geach, J. E., et al. 2009b, ApJ, 691, 687
- Lehmer et al. (2016) Lehmer, B. D., Basu-Zych, A. R., Mineo, S., et al. 2016, ApJ, 825, 7
- Lehmer et al. (2019) Lehmer, B. D., Eufrasio, R. T., Tzanavaris, P., et al. 2019, ApJS, 243, 3
- Lehmer et al. (2013) Lehmer, B. D., Lucy, A. B., Alexander, D. M., et al. 2013, ApJ, 765, 87
- Lehmer et al. (2015) Lehmer, B. D., Tyler, J. B., Hornschemeier, A. E., et al. 2015, ApJ, 806, 126
- Lewis et al. (2018) Lewis, A. J. R., Ivison, R. J., Best, P. N., et al. 2018, ApJ, 862, 96
- Li et al. (2019) Li, J., Xue, Y., Sun, M., et al. 2019, ApJ, 877, 5
- Long et al. (2020) Long, A. S., Cooray, A., Ma, J., et al. 2020, arXiv e-prints, arXiv:2003.13694
- Lusso et al. (2012) Lusso, E., Comastri, A., Simmons, B. D., et al. 2012, MNRAS, 425, 623
- Lusso & Risaliti (2016) Lusso, E. & Risaliti, G. 2016, ApJ, 819, 154
- Lusso & Risaliti (2017) Lusso, E. & Risaliti, G. 2017, A&A, 602, A79
- Macuga et al. (2019) Macuga, M., Martini, P., Miller, E. D., et al. 2019, ApJ, 874, 54
- Martini et al. (2006) Martini, P., Kelson, D. D., Kim, E., Mulchaey, J. S., & Athey, A. A. 2006, ApJ, 644, 116
- Martini et al. (2013) Martini, P., Miller, E. D., Brodwin, M., et al. 2013, ApJ, 768, 1
- Martini et al. (2009) Martini, P., Sivakoff, G. R., & Mulchaey, J. S. 2009, ApJ, 701, 66
- Martocchia et al. (2017) Martocchia, S., Piconcelli, E., Zappacosta, L., et al. 2017, A&A, 608, A51
- Medvedev et al. (2020) Medvedev, P., Sazonov, S., Gilfanov, M., et al. 2020, arXiv e-prints, arXiv:2007.04735
- Menci et al. (2003) Menci, N., Cavaliere, A., Fontana, A., et al. 2003, ApJ, 587, L63
- Miller et al. (2011) Miller, B. P., Brandt, W. N., Schneider, D. P., et al. 2011, ApJ, 726, 20
- Miller et al. (2018) Miller, T. B., Chapman, S. C., Aravena, M., et al. 2018, Nature, 556, 469
- Mineo et al. (2012) Mineo, S., Gilfanov, M., & Sunyaev, R. 2012, MNRAS, 419, 2095
- Monet et al. (2003) Monet, D. G., Levine, S. E., Canzian, B., et al. 2003, AJ, 125, 984
- Mori et al. (2004) Mori, M., Umemura, M., & Ferrara, A. 2004, ApJ, 613, L97
- Mountrichas et al. (2017) Mountrichas, G., Georgantopoulos, I., Secrest, N. J., et al. 2017, MNRAS, 468, 3042
- Murphy & Yaqoob (2009) Murphy, K. D. & Yaqoob, T. 2009, MNRAS, 397, 1549
- Narayanan et al. (2015) Narayanan, D., Turk, M., Feldmann, R., et al. 2015, Nature, 525, 496
- Oteo et al. (2018) Oteo, I., Ivison, R. J., Dunne, L., et al. 2018, ApJ, 856, 72
- Ouchi et al. (2005) Ouchi, M., Shimasaku, K., Akiyama, M., et al. 2005, ApJ, 620, L1
- Overzier (2016) Overzier, R. A. 2016, A&A Rev., 24, 14
- Overzier et al. (2008) Overzier, R. A., Bouwens, R. J., Cross, N. J. G., et al. 2008, ApJ, 673, 143
- Overzier et al. (2013) Overzier, R. A., Nesvadba, N. P. H., Dijkstra, M., et al. 2013, ApJ, 771, 89
- Pentericci et al. (2002) Pentericci, L., Kurk, J. D., Carilli, C. L., et al. 2002, A&A, 396, 109
- Pentericci et al. (2000) Pentericci, L., Kurk, J. D., Röttgering, H. J. A., et al. 2000, A&A, 361, L25
- Planck Collaboration et al. (2016) Planck Collaboration, Ade, P. A. R., Aghanim, N., et al. 2016, A&A, 594
- Prescott et al. (2008) Prescott, M. K. M., Kashikawa, N., Dey, A., & Matsuda, Y. 2008, ApJ, 678, L77
- Ranalli et al. (2003) Ranalli, P., Comastri, A., & Setti, G. 2003, A&A, 399, 39
- Ranalli et al. (2005) Ranalli, P., Comastri, A., & Setti, G. 2005, A&A, 440, 23
- Ricci et al. (2017) Ricci, C., Assef, R. J., Stern, D., et al. 2017, ApJ, 835, 105
- Rigopoulou et al. (2018) Rigopoulou, D., Pereira-Santaella, M., Magdis, G. E., et al. 2018, MNRAS, 473, 20
- Schaerer (2003) Schaerer, D. 2003, A&A, 397, 527
- Schaerer et al. (2019) Schaerer, D., Fragos, T., & Izotov, Y. I. 2019, A&A, 622, L10
- Smith et al. (2008) Smith, R. J., Marzke, R. O., Hornschemeier, A. E., et al. 2008, MNRAS, 386, L96
- Stanway et al. (2020) Stanway, E. R., Chrimes, A. A., Eldridge, J. J., & Stevance, H. F. 2020, MNRAS[arXiv:2004.11913]
- Steffen et al. (2006) Steffen, A. T., Strateva, I., Brandt, W. N., et al. 2006, AJ, 131, 2826
- Steidel et al. (2005) Steidel, C. C., Adelberger, K. L., Shapley, A. E., et al. 2005, ApJ, 626, 44
- Steidel et al. (2000) Steidel, C. C., Adelberger, K. L., Shapley, A. E., et al. 2000, ApJ, 532, 170
- Stern et al. (2014) Stern, D., Lansbury, G. B., Assef, R. J., et al. 2014, ApJ, 794, 102
- Swinbank et al. (2004) Swinbank, A. M., Smail, I., Chapman, S. C., et al. 2004, ApJ, 617, 64
- Symeonidis et al. (2014) Symeonidis, M., Georgakakis, A., Page, M. J., et al. 2014, MNRAS, 443, 3728
- Taniguchi & Shioya (2000) Taniguchi, Y. & Shioya, Y. 2000, ApJ, 532, L13
- Toshikawa et al. (2016) Toshikawa, J., Kashikawa, N., Overzier, R., et al. 2016, ApJ, 826, 114
- Tsai et al. (2015) Tsai, C.-W., Eisenhardt, P. R. M., Wu, J., et al. 2015, ApJ, 805, 90
- Umehata et al. (2019) Umehata, H., Fumagalli, M., Smail, I., et al. 2019, Science, 366, 97
- Umehata et al. (2015) Umehata, H., Tamura, Y., Kohno, K., et al. 2015, ApJ, 815, L8
- Urrutia et al. (2005) Urrutia, T., Lacy, M., Gregg, M. D., & Becker, R. H. 2005, ApJ, 627, 75
- van Breukelen et al. (2009) van Breukelen, C., Simpson, C., Rawlings, S., et al. 2009, MNRAS, 395, 11
- Venemans et al. (2002) Venemans, B. P., Kurk, J. D., Miley, G. K., et al. 2002, ApJ, 569, L11
- Vito et al. (2019) Vito, F., Brandt, W. N., Bauer, F. E., et al. 2019, A&A, 630, A118
- Vito et al. (2018) Vito, F., Brandt, W. N., Stern, D., et al. 2018, MNRAS, 474, 4528
- Vito et al. (2016) Vito, F., Gilli, R., Vignali, C., et al. 2016, MNRAS, 463, 348
- Vito et al. (2014) Vito, F., Maiolino, R., Santini, P., et al. 2014, MNRAS, 441, 1059
- Wang et al. (2013) Wang, S. X., Brandt, W. N., Luo, B., et al. 2013, ApJ, 778, 179
- Weigel et al. (2018) Weigel, A. K., Schawinski, K., Treister, E., Trakhtenbrot, B., & Sanders, D. B. 2018, MNRAS, 476, 2308
- Weisskopf et al. (2007) Weisskopf, M. C., Wu, K., Trimble, V., et al. 2007, ApJ, 657, 1026
- Worrall et al. (2020) Worrall, D. M., Birkinshaw, M., Marshall, H. L., et al. 2020, MNRAS, 497, 988
- Yang et al. (2020) Yang, G., Boquien, M., Buat, V., et al. 2020, MNRAS, 491, 740
- Zappacosta et al. (2018) Zappacosta, L., Piconcelli, E., Duras, F., et al. 2018, A&A, 618, A28
- Zou et al. (2019) Zou, F., Yang, G., Brandt, W. N., & Xue, Y. 2019, ApJ, 878, 11
Appendix A X-ray images of undetected protocluster members
Fig. 10 presents the full-band images of the spectroscopically confirmed members of the protocluster which are not detected individually (see § 3).
Appendix B X-ray emission in unidentified field ALMA sources
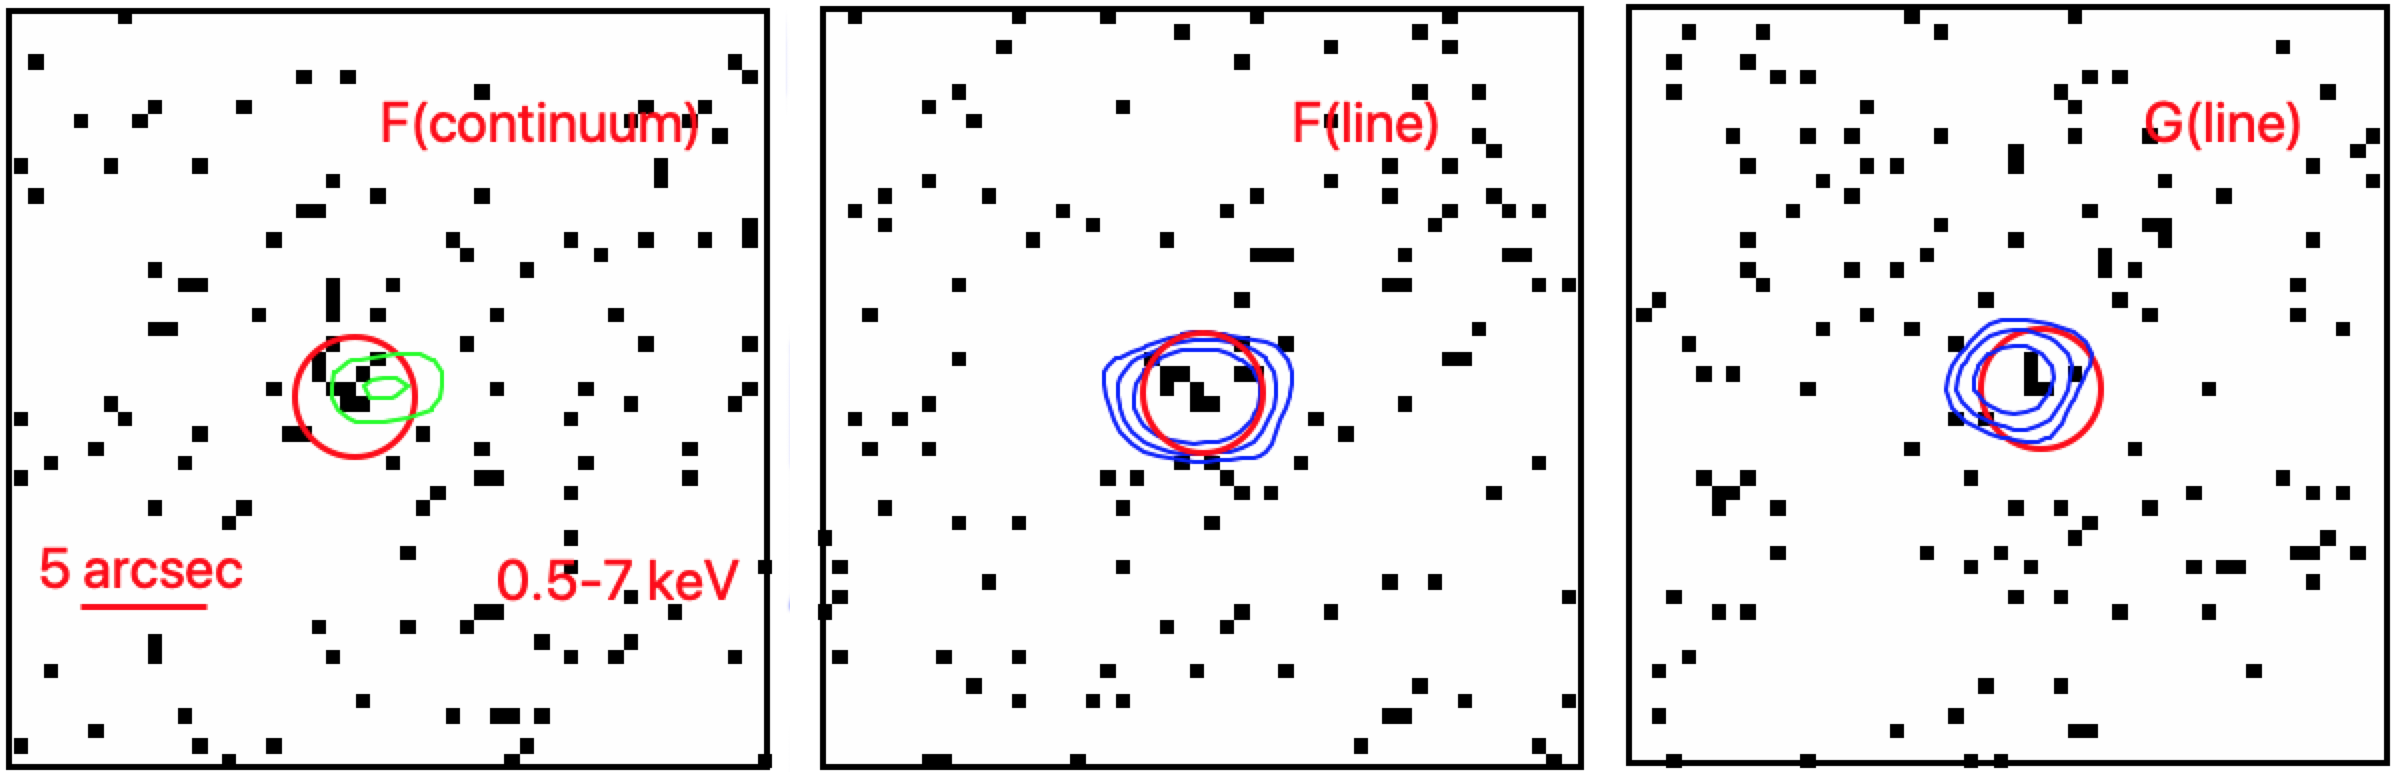
Besides the 13 spectroscopically confirmed members of the protocluster, several additional LABOCA 870m sources have been detected by ALMA in the outskirts of the DRC field (see Ivison et al. 2020, for details). Most of them have been resolved with ALMA into multiple galaxies, either (unidentified) line emitters or continuum emitters, or both. In this section, we briefly discuss three of these sources which are associated with detected X-ray emission. In particular, we detected significant X-ray emission () associated with a 3 mm continuum source and a line emitter in the field of LABOCA source F, which we refer to as sources Fcont and Fline, respectively, and a line emitter in the field of LABOCA source G, which we refer to as Gline (Fig. 11). X-ray photometry has been computed in a circular region centered on the centroid of the X-ray sources.
Source Fcont is detected in the hard band with net counts (), while no count has been detected in the soft band ( net counts; ), corresponding to a hardness ratio of and an effective photon index of . Source Fline is detected both in the soft and hard bands, with () and () net counts, respectively, corresponding to and . Source G is detected only in the hard band with net counts (), while net counts are detected in the soft band (), corresponding to and . Therefore, all of these sources present hard X-ray spectra, probably due to ongoing nuclear accretion in obscured conditions.