Multiplicity and pseudorapidity density distributions of charged particles produced in pp, pA and AA collisions at RHIC & LHC energies
Abstract
Multiplicity and pseudorapidity () density () distributions of charged hadrons provide key information towards understanding the particle production mechanisms and initial conditions of high-energy heavy-ion collisions. However, detector constraints limit the -range across which charged particle measurements can be carried out. Extrapolating the measured distributions to large -range by parameterizing measured distributions and by using calculations from event generators, we characterize the production of charged particles over the full kinematic range. In the present study, we use three different anstze to obtain quantitative descriptions of the shape of pseudorapidity distributions of charged hadrons produced in pp, p-A, and A-A collisions for beam energies () ranging from a few GeV to a few TeV corresponding to RHIC and LHC energies. We study the limiting fragmentation behavior in these collisions and report evidence for participant-scaling violations in high-energy collisions at the TeV scale. We additionally examine measured pseudorapidity distributions to constrain models describing initial conditions of particle production. We predict the centrality dependence of charged particle multiplicity distributions at FAIR and NICA energies and give an estimation of charged particle multiplicity at for the proposed HE-LHC and FCC energies.
1 Introduction
Multiplicity and pseudorapidity () density distributions of charged particles along with the transverse momentum () spectra constitute some of the basic observables for understanding the particle production mechanisms in high-energy elementary particle and heavy-ion collisions [1, 2, 3, 4]. The dependence of these distributions on the colliding particle species, collision energy, and collision centrality have been extensively discussed in the literature [5, 6, 7, 8, 9, 10]. In proton-proton (pp) collisions, these distributions provide precise calibration of particle production models such as PYTHIA [11] and HERWIG [12], which are used to make predictions of various searches including those of physics beyond the standard model. These measurements play an important role in the study of heavy-ion collisions at ultra-relativistic energies in which short-lived systems consisting of nuclear matter at extreme conditions of temperature and energy density are created. There is evidence that this matter undergoes a phase transition from a confined state to a de-confined state of quark-gluon plasma (QGP) [13, 14]. The comparison of the charged particle distributions in pp, p–A, and A–A collisions are essential to characterize the formation of QGP and understand the particle production mechanisms.
The measured charged-particle multiplicity and distributions are dominated by final state interactions and the state of matter at freeze-out. Nonetheless, these distributions are also sensitive to the initial stages of the collision. At small Bjorken- (expressed as , being the rapidity), the gluon density of the parton distribution functions (PDF) of the proton grows and is expected to reach a saturation domain [15, 16, 17]. So the particle productions at large collision energies and forward rapidities are characterized by a large number of gluons [18, 19, 20, 21, 22, 23]. With present theoretical understandings and available deep inelastic scattering (DIS) experiments at HERA [24, 25], it becomes possible to study the expected growth and saturation of gluon density at high collision energies. The measurements of produced charged-particle multiplicity, , and distributions are typically restricted to the mid-rapidity region. Such restrictions arise in part because of favorable kinematic conditions at mid-rapidity and largely because of experimental limitations at forward rapidities. Understanding the particle production dynamics, including effects of nuclear stopping, color transparency, jet quenching, and long range correlations, requires the measurement of particle production in full pseudorapidity ranges. However, energy-momentum conservation dictates that particle production must vanish at or beyond the beam rapidity. It is thus of interest to consider pseudorapidity ansatz that assumes vanishing density at such large rapidities. These may then be compared to production models and may, in principle, be used to estimate the total charged-particle production in pp and A–A collisions. The precision achievable with such extrapolations is obviously limited by the quality of the ansatz but it can be tested with existing pp and A–A collision models. However, no specific or widely accepted pseudorapidity rapidity model is currently available in the literature to carry out such extrapolation. In this work, we exploit the large body of available experimental data measured in high-energy pp, p–A, and A–A collisions to examine and compare the merits of three anstze towards a phenomenological description of pseudorapidity density as well as the extrapolation and integration of measured densities to estimate total charged-particle production with beam energy. Our analysis is based on data collected from a variety of collision systems and for collision energies ranging from a few GeV to the top LHC energy. These distributions, at close to beam rapidities, are used to study the limiting fragmentation of particle production [26, 27, 28].
Total particle multiplicities and pseudorapidity densities at mid-rapidity at CERN SPS (Super Proton Synchrotron) and RHIC (Relativistic Heavy Ion Collider) energies have been observed to be proportional to the number of participating nucleons () [29, 30]. But at higher energies of the CERN Large Hadron Collider (LHC), the scaling has been observed to be broken [31, 32]. One of the main reasons for this scale breaking is the enhancement in gluon productions at high energies (low Bjorken-) [16, 17, 33].
The paper is organised as follows. In sec. 2, we examine the measured charged-particle multiplicity, and pseudorapidity distributions, , observed in pp, p–A, and A–A collisions across a wide range of beam energies and compare these with results from selected event generators. In sec. 3, we parameterize these distributions using three different anstze to obtain a satisfactory model one can integrate over the full pseudorapidity range spanned by particle production. Such an extrapolation requires that we examine, in sec. 4, the measured distributions in the vicinity of the beam rapidity and study the applicability of the notion of limiting fragmentation. In sec. 5, we use the favored ansatz to estimate the total number of charged particles produced per as a function of collision energy and centrality. We inspect whether the charged particle production scales with irrespective of the collision energy. Using the parameterization of the pseudorapidity density distributions, we give predictions for these distributions as well as total charged particle multiplicities for lower collision energies of the future experiments at FAIR (Facility for Anti-proton and Ion Research) at GSI, Germany and NICA (Nuclotron-based Ion Collider fAcility) at JINR, Russia. Additionally, we extend the charged particle multiplicity density at for the proposed HE-LHC (High-Energy LHC) and FCC (Future Circular Collider) at CERN. Finally, in sec. 6, we explore whether selected initial condition scenarios can be meaningfully constrained by measured particle multiplicity distributions. The paper is summarized in sec. 7.
2 Charged-particle multiplicity distributions
In this section, we present the charged particle multiplicity density at mid-rapidity and pseudorapidity distributions from available experimental data for pp, p–, d–Au, p–Pb, Au–Au, and Pb–Pb collisions. These data are compared to calculations from event generators. For pp and p– collisions, the multiplicities are calculated with PYTHIA (Perugia tune) [11], whereas those for A–A collisions are computed with UrQMD [34, 35, 36, 37], AMPT [38, 39, 40], EPOS (we have used EPOS-LHC v3.4) [41, 42, 43], and THERMINATOR [46]. UrQMD (Ultrarelativistic Quantum Molecular Dynamics) is a microscopic transport model based on the covariant propagation of all produced hadrons in combination with stochastic binary scatterings, color string formation, and resonance decay. It has been widely used to simulate the production of different particles, particle flow and fluctuations. AMPT (A Multi-Phase Transport) models the initial stage of A–A collisions in terms of partonic interactions. It converts produced partons into hadrons and includes a hadronic interactions stage [38, 39, 40]. AMPT calculations have been carried out with the string melting (SM) option, which involves a fully partonic QGP phase that hadronizes through quark coalescence. EPOS is a hybrid event generator describing A–A as well as pp collisions in terms of a core (high density) and corona (low density) components [41, 43]. It describes the evolution of the core component with a viscous hydrodynamical model while collisions within the corona are computed with Gribov-Regge (GR) theory and perturbative QCD [41, 42]. The core/corona approach is known to successfully reproduce the measured collision centrality evolution of several observables, including relative particle abundance ratios, transverse distributions, and anisotropic flow [44, 41, 42, 43, 45]. THERMINATOR (THERMal heavy IoN generator) is a statistical hadronization model commonly used to estimate the relative abundances of particles species produced in relativistic heavy-ion collisions. It enables arbitrary implementations of the shape of the freeze-out hyper surface and the expansion velocity field. The multiplicities were computed including HBT effects and 3+1 dimensional profiles [46].
2.1 Charged-particle multiplicity density at mid-rapidity
The charged-particle multiplicity density at mid-rapidity has been reported for different colliding systems, collision centrality and collision energies. The average number of participants () characterizes the collision centrality and colliding system. In Fig. 1, we present a compilation of the measurements of scaled charged-particle multiplicity density at mid-rapidity, , as a function of collision energy in pp [47, 48, 49], p– [51, 50], Au–Au [5, 52, 53, 57, 56, 54, 55], Pb–Pb [60, 58, 59], d–Au [61], and p–Pb [62, 63, 64] collisions observed at Fermilab, RHIC, and LHC energies. Results from pp and p– collisions are for non-single diffractive (NSD) as well as inelastic (INEL) collisions, whereas those from Au–Au and Pb–Pb collisions correspond to most central collisions.
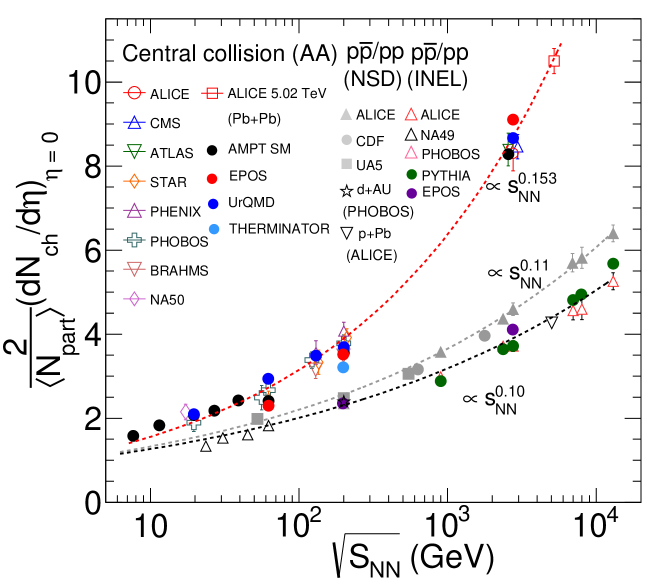
The multiplicity densities measured in pp (p–) and A–A collisions exhibit rather different dependence as a function of collision energy. These dependencies can be characterised with power-law fits performed separately for A–A , NSD pp, and INEL pp (p–) collisions. We find that the dependence of the multiplicity density of pp (p–) collisions are well matched by power laws of the form with exponent and for INEL and NSD collisions, respectively. In contrast, the multiplicity densities observed in A–A collisions exhibit a steeper dependence on the beam energy and are best described with a power law exponent . Additionally, we find that the dependences of the multiplicity densities achieved in d–Au and p–Pb collisions are similar to those observed in pp collisions.
Comparing the results from different models and data shown in Fig. 1, we note that for the p–p collision system, PYTHIA predictions are in good agreement with INEL data for beam energies GeV. In the case of A–A systems, one finds that AMPT SM and UrQMD predictions are in good agreement with data over the entire range considered in this work. We additionally find that EPOS predictions are also in reasonable agreement with data from both p–p and A–A systems over a wide range of beam energies. However, the single THERMINATOR prediction considered at GeV is found to considerably underestimate the measured charged-particle density. Overall, PYTHIA , EPOS, AMPT, and UrQMD are found to reproduce reasonably well the observed power law behavior even though they are based on rather different interaction and transport models. The evolution of the , an integrated observable, is not a strong discriminant of these models and their underlying particle production mechanisms. Indeed, although historically important, measurements of scaled charge particle density at central rapidity provide only a rather limited amount of information about the specific particle creation and transport mechanisms involved in pp and A–A collisions [10]. Additional insight into these mechanisms, however, may be gained from charged-particle pseudorapidity distributions. Figure 2 presents a compilation of distributions measured in pp, Au–Au, and Pb–Pb collisions at the SPS, RHIC and LHC.
2.2 Pseudorapidity distributions
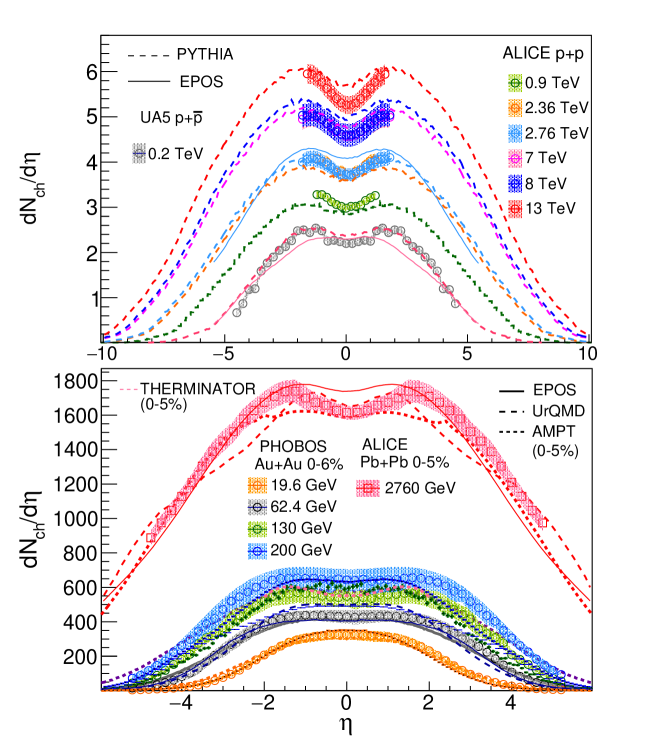
The upper panel of Fig. 2 displays distributions measured in pp collisions at energies ranging from 0.9 to 13 TeV [47, 48, 49, 50], and p– collisions at 0.2 TeV [51] (open symbols), while the lower panel presents pseudorapidity distributions of charged hadrons measured in 6% most central Au–Au collisions in the range GeV [5, 57, 56, 54, 55, 61], and top 5% central Pb–Pb collisions at 2.76 TeV [60, 58].
First focusing our attention to the upper panel of Fig. 2, we note that only the UA5 data cover a wide enough pseudorapidity range capable of revealing the full shape of the distribution measured in pp collisions while the measurements reported by the ALICE collaboration are limited to the central rapidity region in pp collisions. One nonetheless observes that the particle density produced in pp (p–) collisions rises monotonically, as expected, with beam energy. One also notes that the measured pseudorapidity distributions all feature a dip, centered at , whose depth and width increases with rising . The presence of this dip is in part associated with partial transparency and limited stopping power of the colliding protons (or anti-protons) [73]. The dip may also result, in part, from the measurement being reported as a function of pseudorapidity. A boost invariant rapidity distribution would indeed yield a broad dip in pseudorapidity owing to the presence of mass term in the denominator of transformation Jacobian.
The pseudorapidity distributions measured in pp (p–) collisions are compared with Monte Carlo calculations performed with PYTHIA 6.4 [11] (dash lines) and EPOS [44] (solid lines) event generators. One observes that both PYTHIA and EPOS approximately reproduce the magnitude and dependence of the distributions: both models indeed capture the essential features of the measured distributions, including the presence of the widening and deepening dip, centered at , with increasing . However, PYTHIA appears to be in better agreement with the data than EPOS at 0.2, 2.76, and 8 TeV. Observe, in particular, that EPOS does not reproduce the dip structure seen in p– data at 0.2 TeV.
Let us next examine the pseudorapidity distributions reported by the PHOBOS and ALICE collaborations shown in the lower panel of Fig 2. The PHOBOS data cover the range whereas those of the ALICE experiment span the range . One finds that the pseudorapidity distribution observed at = 19.6 GeV features an approximate Gaussian shape peaked at , while distributions observed at higher beam-energy are much broader and feature dip structures qualitatively similar to those observed in pp collisions. However, the dip structures observed in A–A collisions are typically shallower and wider than those observed in pp collisions.
The experimental data are compared to calculations based on the UrQMD, AMPT, EPOS, and THERMINATOR models shown as solid lines in Fig. 2. The calculations were performed within ranges reproducing the experimental conditions of the PHOBOS and ALICE experiments. Overall, we note that all four models qualitatively reproduce the observed distributions. However, we also note that best agreement with the measured pseudorapidity density distributions is obtained with the EPOS model at beam energies GeV, while at 2.76 TeV, none of the models reproduce the observed distributions quantitatively. Overall, all four models considered manage to capture the general trend of the observed data, including the produced particle density and its dependency on pseudorapidity, but none perfectly reproduce the shape of the measured distributions. EPOS arguably works very well given that it matches not only the amplitude and breadth of the distributions but it also produces a dip near , albeit with insufficient depth. EPOS’ predictions are low at RHIC energies and approximately high at 2.76 TeV. AMPT and UrQMD, on the other hand, seem to reproduce the measured densities rather well at mid-rapidity, across the entire range presented in Fig. 2, but fail to reproduce the overall shape at higher values. THERMINATOR, on the other hand, is doing rather poorly at GeV.
3 Parameterization of the pseudorapidity distributions
Although the PHOBOS and ALICE data presented in the lower panel of Fig. 2 cover large ranges of pseudorapidity, they do not capture the full range of particle production involved at top RHIC energy and at the LHC. In fact, most reported measurements of charged-particle pseudorapidity distributions are limited to somewhat narrow ranges of pseudorapidity and do not account for the full particle production. For instance, the measured distributions reported by the ALICE collaboration for Pb-Pb collisions cover a fairly wide range, , but this range is quite narrow relative to the beam rapidity (). One may then wonder how much particle production actually takes place at forward/backward rapidities? Can the stark differences between the dependence of the multiplicity densities observed in pp and A–A collisions result from an overall increase in the produced multiplicity per participant pair or does it result simply from a shift in the particle production towards central rapidity, due possibly to larger stopping in A–A collisions?
Very few experiments are equipped to cover the entire pseudorapidity range required to answer these questions unambiguously. In the absence of such measurements, we seek to parameterize the measured distributions to obtain sensible extrapolations at forward/backward rapidities that may be used to estimate the total charged-particle production.
In the transverse direction, extrapolation of measured particle densities, , to zero and infinite is relatively straightforward because the cross-section must vanish at these limits [72]. Evidently, models used to integrate spectra are not constrained outside of the fiducial acceptance, but the fact that the cross-section vanishes at null and infinite significantly constrains the shape of distributions. Uncertainties as to the exact shape of the distribution outside of the fiducial acceptance thus yield systematic uncertainties on the integral of the distributions.
We seek to use the same concept towards extrapolating at forward and backward rapidities beyond the fiducial pseudorapidity acceptance. The pseudorapidity density must obviously vanish at suitably large values of but extrapolation beyond the measurement acceptance does require one makes assumptions about the overall shape of the distributions. In this work, we explore three fitting functions to fit and extrapolate measured yields beyond their fiducial ranges. These functions can then be integrated numerically over the entire range of particle production to obtain (extrapolated) total produced particle multiplicities.
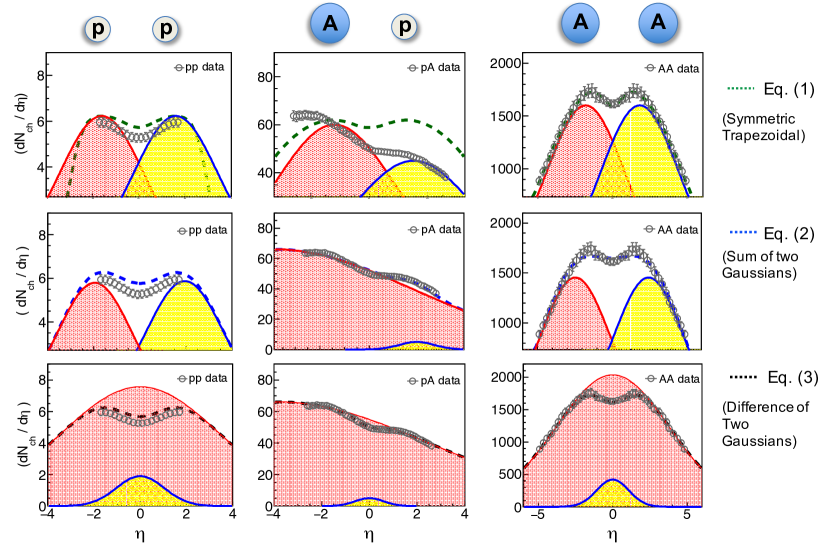
The analysis of the shapes of the pseudorapidity distributions is based on the distributions presented in Fig. 2. We first note that the pseudorapidity density distributions produced in symmetric collisions (e.g., pp and A–A ) are symmetric about , but distributions of the pA collisions feature a pronounced forward/backward asymmetry, with an excess of particles being produced in the nucleus direction. We further note that the shape of the pseudorapidity distributions may be characterized by one broad peak with approximate Gaussian shape or two peaks of approximately Gaussian shape separated by a trough. For simplicity, we thus consider three basic shapes defined according to:
| (1) | |||||
| (2) | |||||
| (3) |
Equation (1) is motivated by observed symmetric trapezoidal functions with a plateau around mid-rapidity [55]. It was used by the PHOBOS collaboration to model their measurements and extract the produced total particle multiplicity. Although Eq. (1) adequately reproduces some of the measured distributions, its built-in symmetry about limits its applicability to symmetric collision systems exclusively. Equations (2) and (3) involve sum and differences of two Gaussian distributions, respectively. Equation (1) features four parameters (), while Equation (2) involves six parameters (, ). Equation (3) features five parameters () but reduces to four for symmetric collisions, which are characterized by = 0.
Figure 3 shows schematic diagrams of distributions obtained for pp, p–A, and A–A collisions obtained with the anstze embodied by Eqs. 1-3. The red and blue lines and associated shaded areas schematically represent the contributions from nucleon participants originating from either incoming nuclei. In the middle panel row, the blue dash line corresponds to the sum of both contributions. The shape of the distribution is here determined by the relative contributions of the incoming nuclei as well as the degree of nuclear stopping achieved in the collisions. In the bottom panel row, the relative contributions and stopping are modeled with a difference of two Gaussians as per Eq. (3) and illustrated with the black dash line. In the upper panel, the trapezoidal ansatz sums contributions from both incoming nucleai, and is thus not easy to visualize. In each case, the overlap region can be visualized as a measure of the dip at for overall distribution. If the overlap region decreases, then the dip is pronounced and if the overlap region increases, the overall distribution becomes flat.
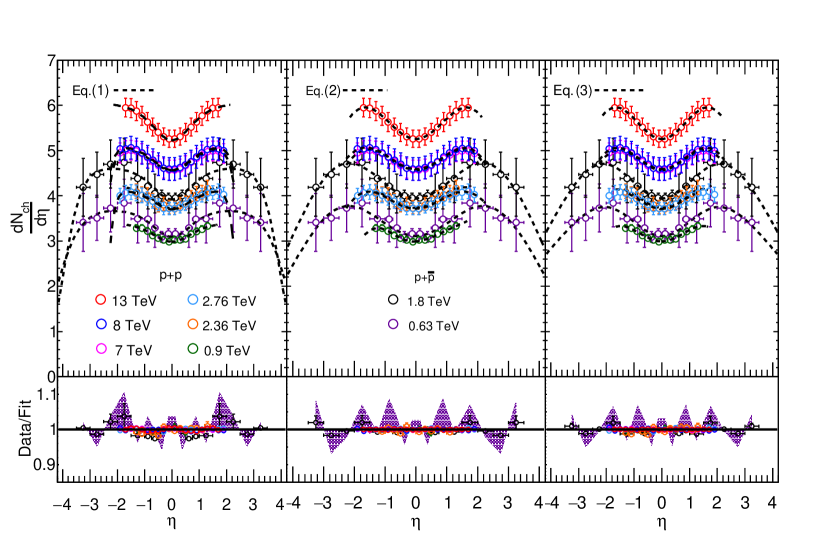
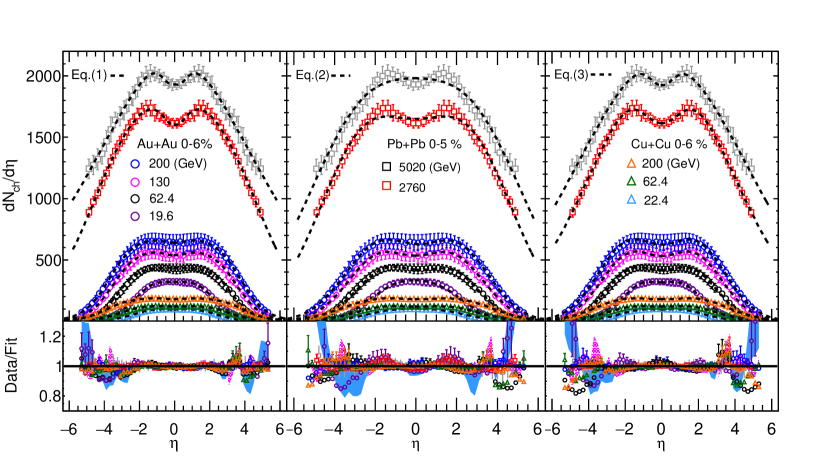
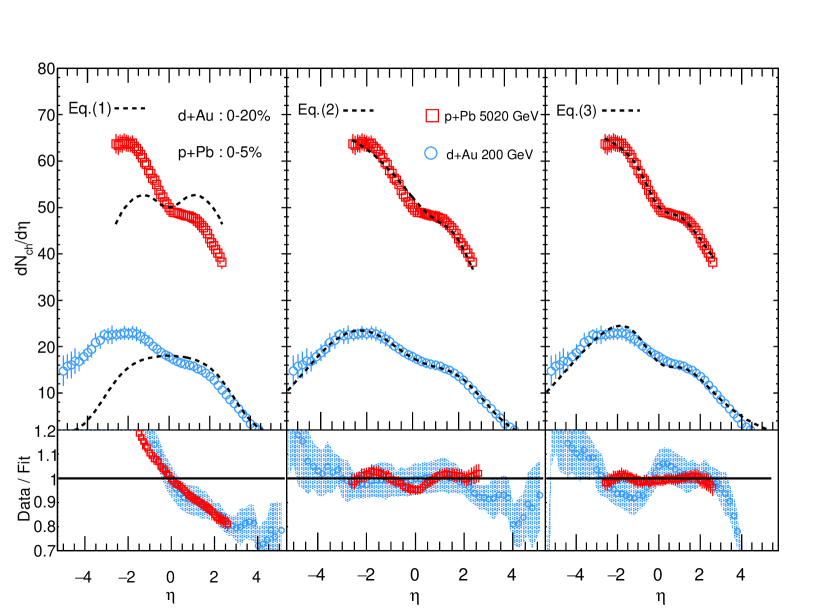
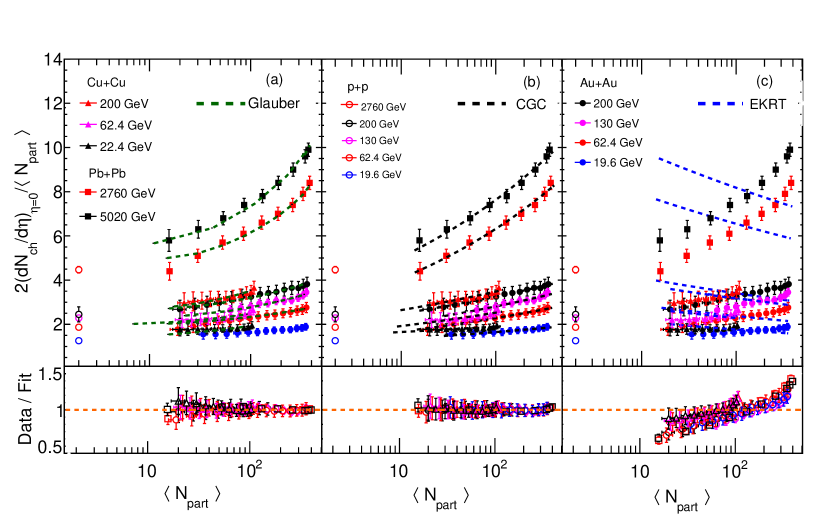
The three functions are used to fit the available experimental data displayed in Figs. 4 – 6. The parameter of Eq. (3) is set to zero for symmetric collisions but left unconstrained for asymmetric systems. Fits to pseudorapidity distributions measured in pp and p– collisions are displayed in Fig. 4; those to Cu–Cu, Au–Au, and Pb–Pb collisions data are shown in Fig. 5; whereas those to asymmetric systems, d–Au and p–Pb collisions, are presented in Fig. 6. The upper panels of each figure display experimental data and fits obtained with the three functions in distinct panels horizontally, while the lower panels of the figure show ratios of the measured data to the fits. The fits were carried out with the ROOT least square minimization function [65]. Data uncertainties included in the fits were set as quadratic sums of statistical and systematic errors reported by the experiments. The goodness of fit is reported in terms of per degrees of freedom (NDF) in Tab. 1.
| System | Centrality | /NDF | |||
|---|---|---|---|---|---|
| (GeV) | Eq. (1) | Eq. (2) | Eq. (3) | ||
| pp | MB | 900 | 1.056 | 0.552 | 0.826 |
| pp | 2360 | 0.691 | 1.367 | 0.742 | |
| pp | 2760 | 2.670 | 14.805 | 1.495 | |
| pp | 7000 | 0.458 | 14.805 | 1.495 | |
| pp | 8000 | 1.103 | 9.320 | 0.157 | |
| pp. | 13000 | 0.416 | 1.312 | 0.0145 | |
| p– | 630 | 2.355 | 2.636 | 2.144 | |
| p– | 1800 | 0.986 | 0.184 | 0.155 | |
| CuCu | (0-6%) | 22.4 | 1.1806 | 1.503 | 1.026 |
| CuCu | 62.4 | 0.802 | 0.778 | 0.766 | |
| CuCu | 200 | 0.877 | 1.095 | 1.185 | |
| AuAu | 19.6 | 0.596 | 0.725 | 0.592 | |
| AuAu | 62.4 | 2.184 | 2.074 | 0.412 | |
| AuAu | 130 | 1.889 | 2.176 | 0.179 | |
| AuAu | 200 | 1.103 | 0.262 | 0.419 | |
| PbPb | (0-5%) | 2760 | 1.813 | 1.562 | 0.943 |
| PbPb | 5020 | 1.319 | 4.216 | 1.462 | |
| dAu | top 5% | 200 | No Fit | 2.149 | 3.57 |
| pPb | mult class | 5020 | No Fit | 3.299 | 2.118 |
We find that the three functions fit the pp data relatively well with NDF typically smaller than 3. However, best fits are achieved with Eqs. (1) and (3). Similarly, we find that all three functions provide reasonably sensible parameterizations of the Au–Au, Pb–Pb, and Cu–Cu data presented in Fig. 5. We note, however, that Eq. (1) yields fits with smaller deviations from the data, on average, in the central rapidity region. We also find that Eq. (2) does not fully reproduce the dip structure observed at central rapidity in high-energy datasets.
As anticipated, fits with Eq. (1) fail to describe pseudorapidity density distributions measured for asymmetric systems but Eqs. (2,3) produce reasonable fits. Note, however, that deviations in excess of 5% are observed at with these models. Irrespective of system size, centrality and collision energy, Eq. 3 can be used for forward ranges up to the beam rapidity (where experimental measurement has severe limitations) to estimate the number of produced charge particles. Altogether, we conclude that Eq. (3) provides the best descriptions of the pseudorapidity density distributions, regardless of collision system size and energy considered in this work.
4 Multiplicity distributions at large : limiting fragmentation
Fits with Eqs. (1-3) of pseudorapidity distributions measured in Pb–Pb collisions at 2.76 and 5.02 TeV, discussed in the previous section, successfully model the data but are under constrained at large rapidities. In this section, we use the notion of limiting fragmentation to provide constraints on the shape of these distributions at large rapidity. In high-energy hadronic collisions, the limiting fragmentation [26, 27, 28, 67] concept stipulates that pseudorapidity densities reach a fixed or universal curve close to the beam rapidity (). This implies that the particle production in the rest frame of one of the colliding hadrons is (approximately) independent of the collision center-of-mass energy. Many explanations have been suggested to interpret this behavior, including gluon saturation in the color glass condensate (CGC) framework [18, 19, 20, 66]. Indeed, parton distribution functions measured in deep inelastic scattering show that, at very high collision energies, gluons densities largely dominate those of quarks. This suggests that the medium produced in these collisions mostly consists of gluons. With increasing collision energy, the gluon density increases, eventually leading to saturation.
In the previous section, we found that Eq. (3) provides the best fit to the experimental data considered in Fig. 4 – 6. But the fits remain poorly constrained at large rapidities, i.e., at rapidities in excess of . In this context, we investigate whether the notion of limiting fragmentation can further constrain our modeling of the particle density distributions.
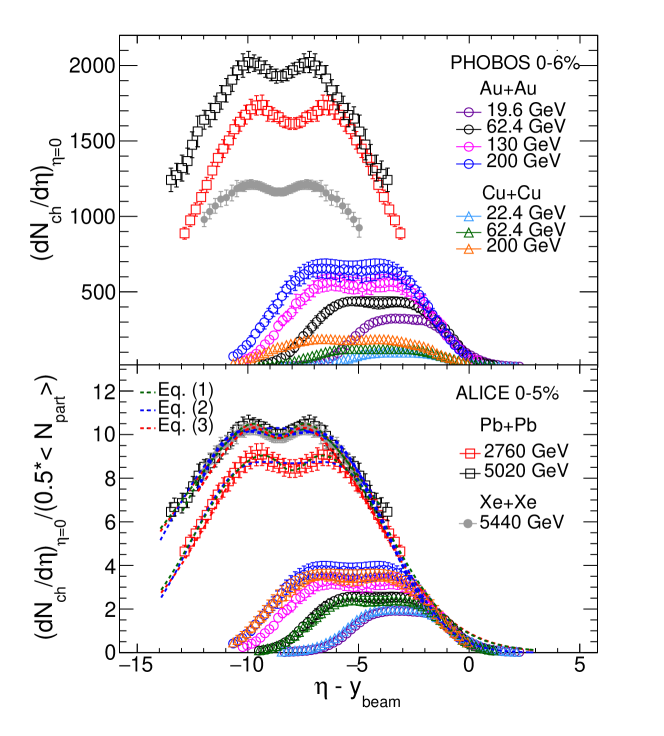
Recent studies of limiting fragmentation have shown that Glauber-inspired models of particle production in heavy-ion collisions generally fail to reproduce limiting fragmentation [68, 69] behaviour, especially at LHC energies. These studies indicate that the particle production is a function of the combination of and number of collisions (), as the ratio between the two depends non-trivially on the collision energy. Hence, if the nuclei-sized domains are uncorrelated, one generically expects limiting fragmentation to be broken and which is also true in Color Glass type models. In Ref. [68], the authors have argued that wounded parton models, provided the nucleon size and parton density vary predominantly with Bjorken-, could in principle reproduce both multiplicity dependence with energy and limiting fragmentation. The different calculations can be verified by studying the limiting fragmentation behaviour of particle production by re-plotting the the pseudorapidity density distributions measured in central Cu–Cu, Au–Au, Xe-Xe and Pb–Pb collisions at RHIC and LHC energies as a function of shifted rapidities, .
The upper panel of Fig. 7 shows the pseudorapidity distributions for central collisions at different colliding energies as a function of for Xe–Xe [31] and Pb–Pb [32] systems at the LHC, and Au–Au collisions at the RHIC energies. We observe that the distributions tend to converge towards a single curve close to . This convergence is observed to be dependent on the system size. This is already quite remarkable considering that the distributions correspond to systems with rather different number of participants and collision energies. Accounting for the system sizes, i.e., scaling (dividing) the pseudo-rapidity densities by their respective number of participant pairs, , we obtain the distributions shown in the lower panel of Fig. 7. We observe that the scaled distributions obtained from Xe–Xe, Au–Au, and Pb–Pb collisions at several energies closely overlap and more or less follow a universal limiting fragmentation behavior near .
We further test the notion of limiting fragmentation with fits of the data presented in Fig. 7 with Eqs. (1-3). Fits of the different data sets, presented in the figure, indeed merge together near the beam rapidity. In order to further validate the different anstze, the fits were performed by restricting the fit regions and then extrapolating to higher . This is verified for Xe-Xe collision (at 5.44 TeV) and Pb-Pb collisions (at both 2.76 TeV and 5.02 TeV), by fitting the experimental data in the ranges (i) and (ii) . We find that the extrapolations of these fits in the beam rapidity are in near perfect agreement, with a maximum mutual difference of 1%. We also verified that integrals of the fits, yielding total charged-particle multiplicity, differ by less than 5%. Additionally, we further checked the validity of the limiting fragmentation hypothesis by considering fits to two hybrid datasets. These hybrid datesets were constructed by joining data points from LHC energies in the range (where experimental data are available), with scaled values from the STAR 200 GeV data points in the range . Fits of the two hybrid sets were then performed and we verified that their integrals matched those of constrained fits to LHC only data with maximum deviations of 3.5%. We thus conclude that, within the precision afforded with the LHC data, one verifies that (1) the limiting fragmentation hypothesis is approximately valid at the LHC and (2) one can then exploit the hypothesis to constrain the LHC data at large rapidity. Using this limiting fragmentation hypothesis, and extrapolating fitting functions to beam rapidity, it is thus possible to estimate, with reasonable accuracy, the total charge particles () production at LHC energies and compare with values obtained at RHIC energies. We discuss the extraction of in detail in the next section.
5 Total charged-particle multiplicity
We proceed to determine the total charged-particle multiplicity, , produced in Cu–Cu, Au–Au, and Pb–Pb collisions by integration of the fitted pseudorapidity densities, constrained by limiting fragmentation, over the full range of particle production. Figure 8 presents values of scaled by as a function of for Pb–Pb collisions at 2.76 TeV and Au–Au collisions at 200 GeV. Experimental data points reported by the ALICE[70] and PHOBOS[71] collaborations are shown with red and blue dash curves, respectively. Total charged-particle production values are obtained by integration of the fitted Eq. (1-3) in the range . Values obtained with Eqs. (1), (2), and (3) are shown with solid red, blue and green points, respectively.
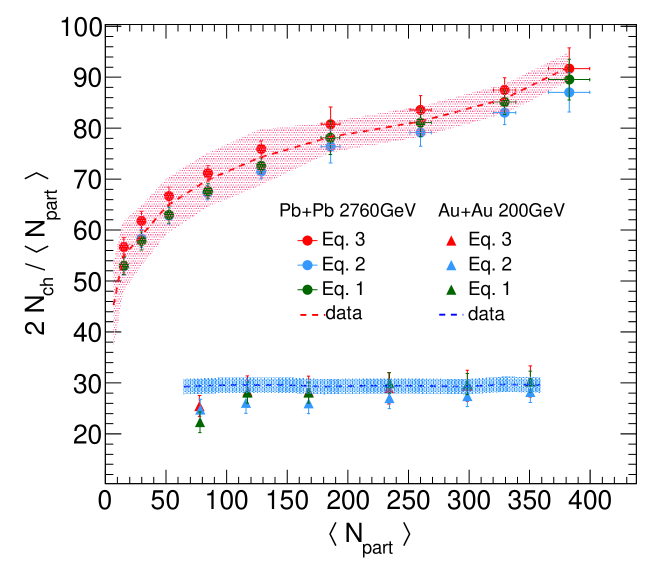
We find that the scaled values of (red triangles and red circles) obtained by integration of Eq. (3) are consistent, within uncertainties (represented by shaded bands), with those reported by the PHOBOS and ALICE collaborations. Only the values obtained at the lowest shown appreciably underestimate the PHOBOS data. Scaled values of obtained by integration of Eq. (1) follow a similar trend while those obtained with Eq. (2) tend to systematically underestimate the values reported by PHOBOS. Overall, we find the best agreement with PHOBOS data is achieved using Eq. (3), with deviations of the order of 0.5% compared to 1% with the other two equations. Hereafter, we use the differences of the three fit extractions as an estimate of the systematic errors associated with the extrapolation procedure based on fits of Eq. (3) to obtain the total charged-particle multiplicities.
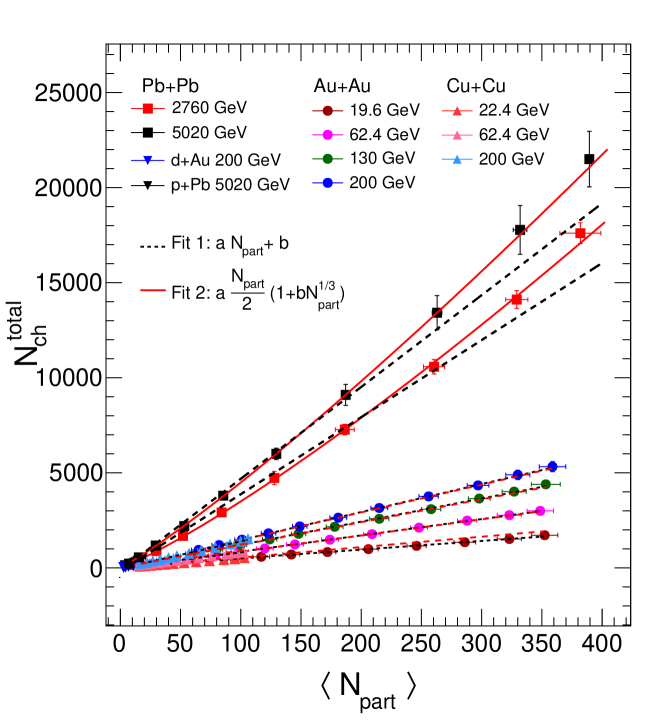
We next proceed to use fits of the measured pseudorapidity distributions with Eq. (3) to extract values of for several colliding systems, collision energies, and collision centralities. Results are shown in Fig. 9 as a function of the number of participating nucleons in pp collisions at 19.6 GeV, 200 GeV and 2.76 TeV, Au–Au collisions at 19.6, 62.4, 130, and 200 GeV, Cu–Cu collisions at 22.4, 62.4 and 200 GeV, d–Au collisions at 200 GeV, Pb–Pb collisions at 2.76 and 5.02 TeV, and p–Pb collisions at 5.02 TeV. We observe that the integrated multiplicities generally exhibit a power law dependence on the average number of participants. Additionally, while the integrated multiplicities obviously increase with the system size and collision energy, they otherwise appear, upon first inspection, to feature a similar power-law dependence on .
We further examine the dependence on by considering parameterizations of this dependence with (a) a linear function , and (b) a power law , shown in Fig. 9 with black dashed and red solid lines, respectively. We find that the power-law parameterization provides a better description of the evolution of with . Notably, the linear fit fails to describe the evolution of with at LHC energies. Deviations are observed for peripheral collisions with both parameterizations. Moreover, both the linear and power law functions provide a rather poor description of the computed multiplicities in the case of p–Pb collisions.
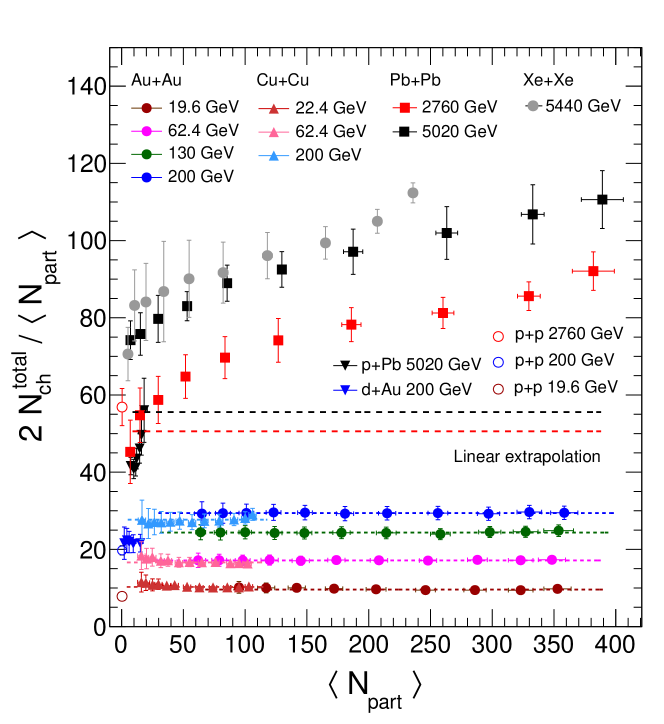
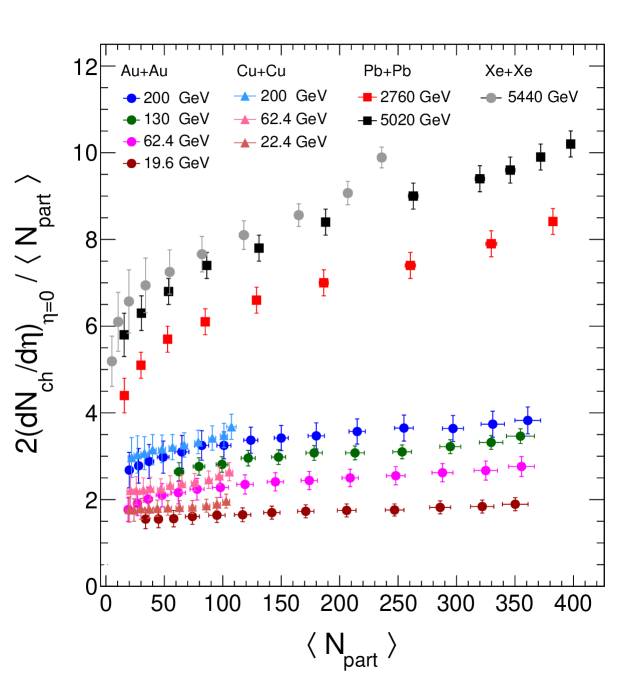
In order to further examine the evolution of with , we plot the centrality dependence of total charged particle multiplicities scaled by the number of participant pair in Fig. 10. We observe that for Cu–Cu and Au–Au collisions at RHIC energies, scaled values of are essentially independent of the collision centrality, whereas , plotted in Fig. 11, displays a monotonic rise with in these collision systems. This implies that the shape of the density distribution changes with centrality and becomes more peaked with increasing centrality. In contrast, we find that, at LHC energies, both (Fig. 10) and (Fig. 11) display monotonic increase with . For LHC collisions, the ratio shows a growth, compatible with a power-law behavior. A similar behavior is observed for p–Pb collisions at 5.02 TeV (Fig. 10).
The observed violation of participant scaling at LHC energies is in sharp contrast to the near perfect scaling observed at RHIC energies. Furthermore, a scaling violation is observed for both charged-particle multiplicity density at mid-rapidity as well as the total number of charged particles. The causes of these violations can be manifolded. First, the increase in beam energy by more than one order of magnitude from RHIC to LHC energies makes the typical Bjorken- at LHC much lower compared to that at RHIC. At RHIC energies, a transverse mass, , of 1 GeV corresponds to at , whereas at LHC it corresponds to . Bjorken- values are even lower at large . The gluon density is expected to grow and reach saturation with lowering [74]. At the LHC, one gets to the small domain where gluon productions dominates thereby producing large number of additional particles with no relation to the number of participants. This is consistent with the CGC formalism of the initial state of the colliding nuclei.
Alternatively, particle production at high energy may be described in terms of a two component model involving soft and hard components, , in which represents the cross-section for soft particle production and is proportional to , whereas , the cross-section for high- particle production, is proportional to the number of inelastic nucleon-nucleon collisions (). A significant increase of from RHIC to LHC, relative to could then possibly explain the observed departure from scaling.
5.1 Extrapolation of particle multiplicities to lower beam energies
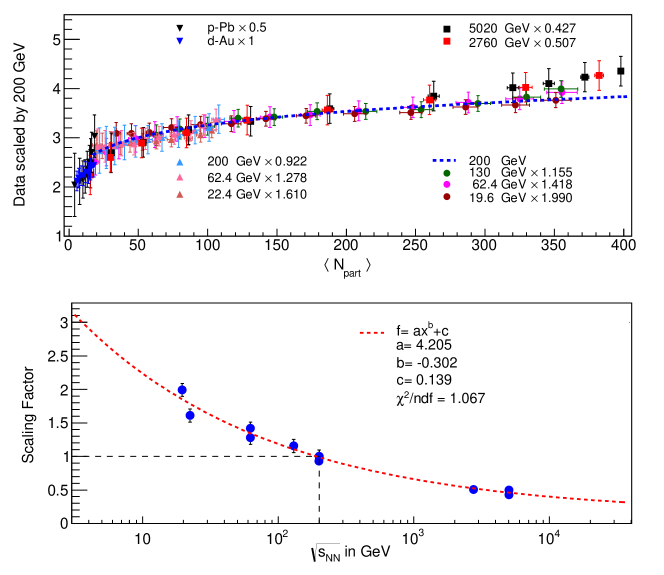
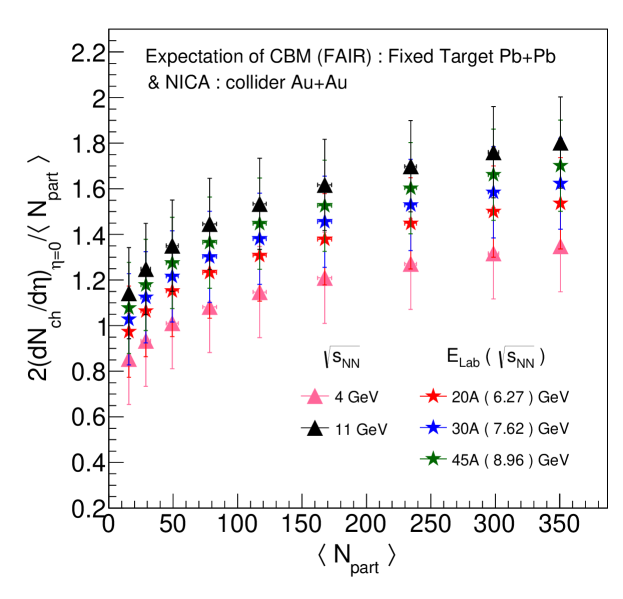
We use the power law obtained in the previous section to “predict” the total charged-particle production as a function of the number of participants at the FAIR and NICA facilities, expected to become online in 2022 and 2025, respectively. To calculate these predictions, we first remark that the shape of the dependence of the central rapidity particle density for RHIC energies is essentially invariant with respect to . To illustrate this approximate invariance, we plot central multiplicity densities scaled to the corresponding multiplicity density at = 200 GeV as a function of for several collision systems and energies in Fig. 12. The scaling factors were determined as the ratio of multiplicity density at central rapidity measured at different beam energies to the multiplicity density observed at central rapidity in = 200 GeV Au–Au collisions. These are listed for each collision system and energy in the upper panel of the figure. The scaled densities are compared to the CGC initial condition motivated fit (discussed in the next section) to the data at = 200 GeV, shown as a blue dash line.
We observe from Fig. 12 that the overlap of the data points is reasonable at energies lower than = 200 GeV, which makes it possible to predict the particle densities at lower collision energies. The scaling factors are plotted as a function of in the lower panel of the figure and fitted with a first order polynomial shown by the red dash line. We extract the coefficients and , and use these to obtain scaling factors for NICA and FAIR energies. These scaling factors are used to obtain predictions of collision centrality evolution of the central particle density per participant, . This is shown in Fig. 13 as a function of .
5.2 Extrapolation of particle multiplicities to higher beam energies
The High-Energy Large Hadron Collider (HE-LHC) [75] and the FCC [76] accelerators proposed at CERN will achieve unprecedented large collision energies for pp as well as heavy-ions. The expected energies for Pb-Pb collisions are 11 TeV and 39 TeV for HE-LHC and FCC, respectively. It is thus imperative to make predictions for the number of produced particles at such large energies. The scaling technique used to extrapolate the particle multiplicities for collision energies lower than = 200 GeV is not appropriate for extending to higher energies as the approximate scaling is broken (as per figure 11). The indication of the scale breaking for multiplicity density at mid-rapidity is also evident by a closer look to upper panel of Fig. 12 at = 2760 GeV and = 5020 GeV for . But using the power-law dependence of beam energy (Fig. 1) for AA collision at top 5% centrality (), we can predict the charged particle multiplicity densities at mid-rapidity for Pb–Pb collisions at 11 TeV and 39 TeV. The extrapolation gives as and , respectively for top central collisions. Taking these values into account, the charged particle multiplicity density at are and for 11 TeV and 39 TeV, respectively. As these higher energies probe more low-x region, one should be careful by considering the present knowledge of gluon saturation picture, which could limit the particle production in these energies and push the multiplicity towards a lower value than expected from these extrapolation.
6 Multiplicity density from initial condition motivated models
The collision centrality dependence of the ratio is expected to be somewhat sensitive to the initial state conditions of heavy-ion collisions [79, 80]. The measured evolution of charged-particle multiplicity distributions vs. collision centrality, presented in Fig. 14 for selected collision systems, may thus be used to contrast predictions obtained with different models. We focus our discussion on the Glauber [52, 53] and color glass condensate [79, 80] models.
Within the Glauber model, a soft/hard two-component model is used to parameterize the particle production as a function of collision centrality according to
| (4) |
where and represent the number of soft and hard scatterings, respectively, and denotes the average number of produced charged particles per unit pseudorapidity in pp collisions. The variable , representing the fraction of hard collisions, is here considered a fit parameter. The fit results of hard scattering component , is within the range of 0.10 to 0.16 and in agreement with previous measurements. Panel (a) of Fig. 14 displays fits (green dash lines) of data from Cu–Cu, Au–Au, and Pb–Pb collisions across a wide span of beam energies. To carry out the fits, we evaluated values of vs. based on the parameterization, , presented for (NSD) p–p collisions in Fig. 1.
In the context of the Color Glass Condensate model, one expects that small gluons overlap and recombine thereby reducing the overall number of gluons and the number of hadrons they hadronize into. The charged-particle density is hence modeled according to [19]:
| (5) |
where and are free parameters. Fits based on this model are shown in Fig. 14 (b). By contrast, models based on final state gluon saturation, e.g., EKRT [77], predict a decreasing trend in charged-particle multiplicities per participant nucleon with increasing collision centrality according to
| (6) |
where is the only free parameter. While the Glauber and CGC initial conditions parameterizations shown in panels (a) and (b) provide excellent agreement with measured data, one finds fits based on Eq. (6), presented in Fig. 14 (c) are in stark disagreement with the data, owing evidently to the fixed power smaller than unity.
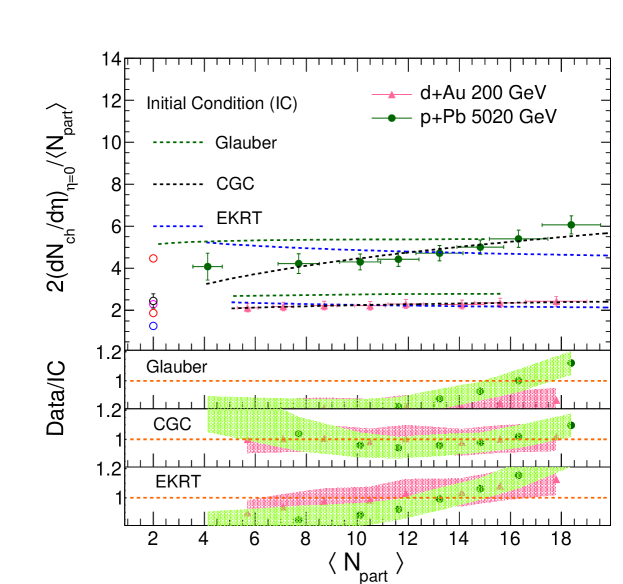
We extend this study to d–Au and p–Pb collision systems in Fig. 15 using the parameterizations (4-6). We find that, in these two systems, the soft/hard two-component model and the EKRT Eq. (6) provide a relatively poor representation of the data. Overall then, we conclude the CGC inspired parameterization, Eq. (5), provides a suitable description of the evolution of the charged-particle multiplicity density with in both symmetric and asymmetric collision systems.
However, we note that recent event-by-event calculations carried out using next-to-leading order EKRT model [78], with saturation for soft particle production and viscous hydrodynamics for the space-time evolution of the produced matter, can well describe the multiplicity density discussed above. In addition, the recent theoretical development on initial conditions known as TRENTO [81, 82] initial conditions also provides a successful description of the densities (as well as several other observables) in p–p, p–Pb, Au–Au, and Pb–Pb collisions both at RHIC and LHC energies.
7 Summary
We have presented a comprehensive study of the multiplicity and pseudorapidity distributions of charged particles produced in p–p, p–Pb, d–Au, Cu–Cu, Au–Au, and Pb–Pb collisions at energies ranging from a few GeV to several TeV, corresponding to the available experimental data at RHIC and LHC. The experimental data have been compared to calculations of selected event generators, including PYTHIA, EPOS, AMPT, UrQMD, and THERMINATOR, which feature different physics model assumptions. We find these event generators qualitatively reproduce the observed particle densities at . However, none are able to satisfactorily explain measured distributions over a broad range of pseudorapidities. With the goal of extrapolating the measured data to forward rapidities, to estimate the total charged particle production in various collision systems, and to obtain the dependence on the collision energy, we have studied three different functional forms to describe the experimental data on the pseudorapidity distributions. Among these functional forms, the difference of two Gaussian distributions, Eq. (3), is found to best reproduce the measured multiplicity densities observed in different collision systems and collision energies.
Furthermore, we used Eq. (3) to estimate the total charged-particle production and study the evolution of multiplicity density at central rapidity () as a function of collision centrality and collision energy. At beam energies GeV, the charged-particle rapidity density exhibits a modest increase with while the total charge production is approximately independent of collision centrality. In contrast, at LHC energies, both the particle density at mid-rapidity and the total charge particle production exhibit a rapid increase with . We thus conclude that there is a qualitative change in the particle production at LHC relative to RHIC. At RHIC energies, the multiplicity density at mid-rapidity increases with while the total particle production remains fixed. That implies the pseudorapidity distribution narrows with increasing thereby yielding a larger central rapidity density albeit with a fixed integral. At the LHC, by contrast, both the central rapidity density and the total charged-particle production increase with . One then has entered a different regime of particle production in which both the central rapidity and total multiplicities per participant monotonically increase with .
We found that the limiting fragmentation hypothesis holds at the TeV energy scale and thus can be used to approximately constrain the shape of distributions and their integrals over the full range of particle production. In addition, we have studied charged-particle multiplicity productions considering different initial conditions. We observe that CGC like initial condition is best suited to describe the published data for both symmetric and asymmetric type of collisions. We have extended the particle production studies to lower collision energies corresponding to those of upcoming accelerator facilities of FAIR at GSI, Darmstadt and NICA at JINR Dubna. We have extrapolated the charged particle multiplicity densities at for expected heavy-ion collisions at the proposed HE-LHC and FCC at CERN.
Acknowledgments:
SB & CP acknowledge the financial support by the U.S. Department of Energy Office of Science, Office of Nuclear Physics
under Award Number DE-FG02-92ER-40713.
References
References
- [1] A. Biallas, M. Bleszynski, and W. Czyz, Nucl. Phys. B 111, 461 (1976).
- [2] J. D. Bjorken, Phys. Rev. D 27, 140 (1983).
- [3] D. Kharzeev and M. Nardi, Phys. Lett. B 507, 121 (2001).
- [4] J.F. Grosse-Oetringhaus and K. Reygers, J. Phys. G: Nucl. Part. Phys. 37, 083001 (2010).
- [5] B. Alver et al. [PHOBOS Collaboration],Phys. Rev. C 83 (2011) 024913.
- [6] L. Adamczyk et al. (STAR Collaboration) Phys. Rev. C 96, 044904 (2017).
- [7] A. Toia et al. (ALICE Collaboration) J. Phys. G 38, 124007 (2011).
- [8] R. Sahoo, A. N. Mishra, N. K. Behera and B. K. Nandi, Adv. high-energy Phys. 2015, 612390 (2015).
- [9] E. K. G. Sarkisyan, A. N. Mishra, R. Sahoo and A. S. Sakharov, Phys. Rev. D 93, 054046 (2016).
- [10] S. Basu, T.K. Nayak, K. Datta, Phys. Rev. C 93, 064902 (2016).
- [11] Torbjorn Sjöstrand, Stephen Mrenna, and Peter Skands, J. High Energy Phys. 05, 026 (2006).
- [12] G.Corcella et. al. Jour. High Ener. Physics. 01 (2001)010.
- [13] J. Adams et al. (STAR Collaboration) Nucl. Phys. A 757, 102 (2005).
- [14] U. W. Heinz and M. Jacob, arXiv:nucl-th/0002042 [nucl-th].
- [15] L. McLerran, J. Dunlop, D. Morrison, R. Venugopalan, Nucl. Phys. A 854 (2011) 1.
- [16] E. Iancu, K. Itakura, L. McLerran, Nucl. Phys. A 708 (2002) 327.
- [17] E. Iancu, L. McLerran, Phys. Lett. B 510 (2001) 145.
- [18] Jamal Jalilian-Marian Phys. Rev. C 70, 027902 (2004).
- [19] D. Kharzeev and E. Levin, Phys. Lett. B 523, 79 (2001).
- [20] K. Dusling and R. Venugopalan, Phys. Rev. Lett. 108 (2012) 262001.
- [21] F.O. Duraes, A.V. Giannini, V.p. Goucalves and F.S. Navarra, Phys. Rev. C 94, 024917 (2016).
- [22] T. Lappi, H. Mantysaari, Nucl. Phys. A 926, 186 (2014).
- [23] A. H. Rezaeian, Phys. Lett. B 727, 218 (2013).
- [24] M. Derrick et al. (ZEUS Collaboration) Phys. Lett. B 345 (1995) 576.
- [25] C. Adlof et al. (H1 Collaboration), Phys. Lett. B 520 (2001) 183.
- [26] J. Benecke, T. T. Chou, C. N. Yang and E. Yen, Phys. Rev. 188, 2159 (1969).
- [27] R. Beckmann, S. Raha, N. Stelte, R.M. Weiner, Phys. Lett. B105, 411 (1981).
- [28] F. Gelis, A.N. Stasto, R. Venugopalan, Eur. Phys. J. C 48, 489 (2006).
- [29] B. Alver et al. (PHOBOS Collaboration) Phys. Rev. C 94, 024903 (2016).
- [30] G. Torrieri, EPJ Web of Conferences, 04002 (2011).
- [31] S. Acharya et al. (ALICE Collaboration) arXiv:1805.04432 [nucl-ex].
- [32] J. Adam et al. (ALICE Collaboration) Phys. Lett B 772, 567 (2017).
- [33] L. D. McLerran, Raju Venugopalan, Phys. Rev. D 49 (1994) 2233.
- [34] M. Bleicher et al.,, Phys. Lett. B 435, 9 (1998).
- [35] M. Bleicher, S. Jeon, V. Koch, Phys. Rev. C 62, 061902(R) (2000)
- [36] S. Haussler, H. Stocker and M. Bleicher, Phys. Rev. C 73, 021901(R) (2006).
- [37] A. Chatterjee, S. Chatterjee, T. K. Nayak, N. R. Sahoo, J. Phys. G: Nucl. Phys. J. Phys. 43, 125103 (2016)
- [38] Z.-W. Lin et al. Phys. Rev. C 72, 064901 (2005).
- [39] Z.-W. Lin et al., Phys. Rev. C 64, 011902 (2001).
- [40] B. Zhang et al., Phys. Rev. C 61, 067901 (2000).
- [41] A.G. Knospe et al. Phys. Rev. C 93, 014911 (2016).
- [42] K. Werner et al., Phys. Rev. C 89, 064903 (2014).
- [43] K. Werner, Phys. Rev. Lett. 98, 152301 (2007).
- [44] K. Werner et al., Phys. Rev. C 82, 044904 (2010).
- [45] M. Nahrgang et al., Phys. Rev. C 90, 024907 (2014).
- [46] M. Chojnacki, A. Kisiel, W. Florkowski and W. Broniowski, Comput. Phys. Commun. 183 (2012) 746.
- [47] K. Aamodt et al. [ALICE Collaboration], Eur. Phys. J. C 68 (2010) 89.
- [48] J. Adam et al. [ALICE Collaboration], Eur. Phys. J. C 77 (2017) no.1, 33.
- [49] J. Adam et al. [ALICE Collaboration], Phys. Lett. B 753 (2016) 319.
- [50] F. Abe et al. [CDF Collaboration], Phys. Rev. D 41 (1990) 2330.
- [51] K. Alpgard et al. [UA5 Collaboration] Phys. Lett.B 112 (1982) 183, G. J. Alner et al. [UA5 Collaboration] Phys. Rept.154 (1987) 247.
- [52] B. I. Abelev et al. [STAR Collaboration], Phys. Rev. C 79 (2009) 034909.
- [53] B. Alver et al. [PHOBOS Collaboration], Phys. Rev. Lett. 102 (2009) 142301.
- [54] B. B. Back et al. [PHOBOS Collaboration], Phys. Rev. C 74 (2006) 021901.
- [55] B. Alver et al. [PHOBOS Collaboration], Phys. Rev. C 83 (2011) 024913
- [56] B. B. Back et al. [PHOBOS Collaboration], Phys. Rev. Lett. 87 (2001) 102303
- [57] B. B. Back et al. [PHOBOS Collaboration], Phys. Rev. Lett. 91 (2003) 052303
- [58] E. Abbas et al. [ALICE Collaboration], Phys. Lett. B 726 (2013) 610.
- [59] J. Adam et al. [ALICE Collaboration], Phys. Lett. B 772 (2017) 567.
- [60] J. Adam et al. [ALICE Collaboration], Phys. Rev. Lett. 116 (2016) 222302.
- [61] B. B. Back et al. [PHOBOS Collaboration], Phys. Rev. C 72 (2005) 031901
- [62] G. Aad et al. [ATLAS Collaboration], Eur. Phys. J. C 76 (2016) no.4, 199
- [63] B. Abelev et al. [ALICE Collaboration], Phys. Rev. Lett. 110 (2013) no.3, 032301
- [64] J. Adam et al. [ALICE Collaboration], Phys. Rev. C 91 (2015) no.6, 064905.
- [65] R. Brun and F. Rademakers, Nucl. Inst. and Meth. in Phys. Res. A 389 (1997) 81.
- [66] A. Krasnitz and R. Venugopalan, Nucl. Phys. A 698 (2002) 209.
- [67] B. Kellers, G. Wolschin, Prog. Theor. Exp. Phys. 2019 (2019) 053D03.
- [68] K. J. Gonçalves, A. V. Giannini, D. D. Chinellato and G. Torrieri, Phys. Rev. C 100 (2019) 054901.
- [69] P. Sahoo, P. Pareek, S. K. Tiwari and R. Sahoo, Phys. Rev. C 99 (2019) 044906.
- [70] J. Adam et al. [ALICE Collaboration], ‘Phys. Lett. B 754 (2016), 373.
- [71] B. B. Back et al. [PHOBOS], Phys. Rev. C 74 (2006), 021902.
- [72] V. Khachatryan et al.[CMS Collaboration] Jour. High Ene. Phys. 1002 (2010) 041.
- [73] G. Wolschin, Phys. Rev. C 91, 014905 (2015).
- [74] L. A. Harland-Lang, A. D. Martin, P. Motylinski, and R.S. Thorne, Eur.Phys.J. C 75 (2015) no.5, 204
- [75] A. Abada et al. [FCC Collaboration], Eur. Phys. J. Special Topics 228 (2019) 1109.
- [76] A. Dainese et al. PoS HardProbes2018 (2019) 005 (e-Print: 1901.10952 [hep-ph]).
- [77] K. J. Eskola, K. Kajantie, P. V. Ruuskanen, and K.Tuominen, Nucl. Phys. B 570, 379 (2000).
- [78] K. J. Eskola, H. Niemi and R. Paatelainen, Nucl. and Part. Phys. Proc., 276-278 (2016) 161.
- [79] J.L. Albacete, C. Marquet, Progress in Particle and Nuclear Physics 76, 1 (2014).
- [80] J. L. Albacete, A. Dumitru, Y. Nara, J. Phys.: Conf. Ser. 316, 012011 (2011).
- [81] J. Scott Moreland, Jonah E. Bernhard, and Steffen A. Bass, Phys. Rev. C 92 (2015) 011901.
- [82] C. Shen et al. Comput. Phys. Commun. 199 (2016) 61.