Measurements of production in 7Be+9Be collisions at beam momenta from 19 to 150 in the NA61/SHINE experiment at the CERN SPS \PreprintIdNumberCERN-EP-2020-150 \ShineJournalEur. Phys. J. C \ShineAbstract The NA61/SHINE collaboration studies at the CERN Super Proton Synchrotron (SPS) the onset of deconfinement in hadronic matter by the measurement of particle production in collisions of nuclei with various sizes at a set of energies covering the SPS energy range. This paper presents results on inclusive double-differential spectra and mean multiplicities of mesons produced in the 5% most central 7Be+9Be collisions at beam momenta of 19, 30, 40, 75 and 150 obtained by the so-called method which does not require any particle identification. The shape of the transverse mass spectra differs from the shapes measured in central Pb+Pb collisions and inelastic p+p interactions. The normalized width of the rapidity distribution decreases with increasing collision energy and is in between the results for inelastic nucleon-nucleon and central Pb+Pb collisions. The mean multiplicity of pions per wounded nucleon in central 7Be+9Be collisions is close to that in central Pb+Pb collisions up to 75. However, at the top SPS energy the result lies between those for nucleon-nucleon and Pb+Pb interactions. The results are discussed in the context of predictions for the onset of deconfinement at the CERN SPS collision energies.
The NA61/SHINE Collaboration
A. Acharya 9, H. Adhikary 9, A. Aduszkiewicz 15, K.K. Allison 25, E.V. Andronov 21, T. Antićić 3, V. Babkin 19, M. Baszczyk 13, S. Bhosale 10, A. Blondel 4, M. Bogomilov 2, A. Brandin 20, A. Bravar 23, W. Bryliński 17, J. Brzychczyk 12, M. Buryakov 19, O. Busygina 18, A. Bzdak 13, H. Cherif 6, M. Ćirković 22, M. Csanad 7, J. Cybowska 17, T. Czopowicz 9,17, A. Damyanova 23, N. Davis 10, M. Deliyergiyev 9, M. Deveaux 6, A. Dmitriev 19, W. Dominik 15, P. Dorosz 13, J. Dumarchez 4, R. Engel 5, G.A. Feofilov 21, L. Fields 24, Z. Fodor 7,16, A. Garibov 1, M. Gaździcki 6,9, O. Golosov 20, V. Golovatyuk 19, M. Golubeva 18, K. Grebieszkow 17, F. Guber 18, A. Haesler 23, S.N. Igolkin 21, S. Ilieva 2, A. Ivashkin 18, S.R. Johnson 25, K. Kadija 3, N. Kargin 20, E. Kashirin 20, M. Kiełbowicz 10, V.A. Kireyeu 19, V. Klochkov 6, V.I. Kolesnikov 19, D. Kolev 2, A. Korzenev 23, V.N. Kovalenko 21, S. Kowalski 14, M. Koziel 6, A. Krasnoperov 19, W. Kucewicz 13, M. Kuich 15, A. Kurepin 18, D. Larsen 12, A. László 7, T.V. Lazareva 21, M. Lewicki 16, K. Łojek 12, V.V. Lyubushkin 19, M. Maćkowiak-Pawłowska 17, Z. Majka 12, B. Maksiak 11, A.I. Malakhov 19, A. Marcinek 10, A.D. Marino 25, K. Marton 7, H.-J. Mathes 5, T. Matulewicz 15, V. Matveev 19, G.L. Melkumov 19, A.O. Merzlaya 12, B. Messerly 26, Ł. Mik 13, S. Morozov 18,20, S. Mrówczyński 9, Y. Nagai 25, M. Naskręt 16, V. Ozvenchuk 10, V. Paolone 26, O. Petukhov 18, R. Płaneta 12, P. Podlaski 15, B.A. Popov 19,4, B. Porfy 7, M. Posiadała-Zezula 15, D.S. Prokhorova 21, D. Pszczel 11, S. Puławski 14, J. Puzović 22, M. Ravonel 23, R. Renfordt 6, D. Röhrich 8, E. Rondio 11, M. Roth 5, B.T. Rumberger 25, M. Rumyantsev 19, A. Rustamov 1,6, M. Rybczynski 9, A. Rybicki 10, S. Sadhu 9, A. Sadovsky 18, K. Schmidt 14, I. Selyuzhenkov 20, A.Yu. Seryakov 21, P. Seyboth 9, M. Słodkowski 17, P. Staszel 12, G. Stefanek 9, J. Stepaniak 11, M. Strikhanov 20, H. Ströbele 6, T. Šuša 3, A. Taranenko 20, A. Tefelska 17, D. Tefelski 17, V. Tereshchenko 19, A. Toia 6, R. Tsenov 2, L. Turko 16, R. Ulrich 5, M. Unger 5, D. Uzhva 21, F.F. Valiev 21, D. Veberič 5, V.V. Vechernin 21, A. Wickremasinghe 26,24, Z. Włodarczyk 9, K. Wojcik 14, O. Wyszyński 9, E.D. Zimmerman 25, and R. Zwaska 24
1 National Nuclear Research Center, Baku, Azerbaijan
2 Faculty of Physics, University of Sofia, Sofia, Bulgaria
3 Ruđer Bošković Institute, Zagreb, Croatia
4 LPNHE, University of Paris VI and VII, Paris, France
5 Karlsruhe Institute of Technology, Karlsruhe, Germany
6 University of Frankfurt, Frankfurt, Germany
7 Wigner Research Centre for Physics of the Hungarian Academy of Sciences, Budapest, Hungary
8 University of Bergen, Bergen, Norway
9 Jan Kochanowski University in Kielce, Poland
10 Institute of Nuclear Physics, Polish Academy of Sciences, Cracow, Poland
11 National Centre for Nuclear Research, Warsaw, Poland
12 Jagiellonian University, Cracow, Poland
13 AGH - University of Science and Technology, Cracow, Poland
14 University of Silesia, Katowice, Poland
15 University of Warsaw, Warsaw, Poland
16 University of Wrocław, Wrocław, Poland
17 Warsaw University of Technology, Warsaw, Poland
18 Institute for Nuclear Research, Moscow, Russia
19 Joint Institute for Nuclear Research, Dubna, Russia
20 National Research Nuclear University (Moscow Engineering Physics Institute), Moscow, Russia
21 St. Petersburg State University, St. Petersburg, Russia
22 University of Belgrade, Belgrade, Serbia
23 University of Geneva, Geneva, Switzerland
24 Fermilab, Batavia, USA
25 University of Colorado, Boulder, USA
26 University of Pittsburgh, Pittsburgh, USA
1 Introduction
This paper presents measurements of inclusive spectra and mean multiplicities of mesons produced in central 7Be+9Be collisions at beam momenta of 19, 30, 40, 75 and 150 ( = 6.1, 7.6, 8.8, 11.9 and 16.8 GeV) performed by the NA61/SHINE collaboration. These results are part of the strong interactions studies proposed by the NA61/SHINE collaboration [1] to investigate the properties of the onset of deconfinement and to search for the possible existence of a critical point in the phase diagram of strongly interacting matter. The first goal of the programme is motivated by the observation of rapid changes of hadron production properties in central Pb+Pb collisions at about 30 by the NA49 experiment [2, 3] - a sharp peak in the kaon to pion ratio ("horn"), the start of a plateau in the inverse slope parameter for kaons ("step"), and a steepening of the increase of pion production per wounded nucleon with increasing collision energy ("kink"). These findings were predicted and interpreted as the onset of deconfinement [4, 5]. They were recently confirmed by the RHIC beam energy scan programme [6], and the interpretation is supported by the LHC results (see Ref. [7] and references therein). Experimentally the goals of the NA61/SHINE strong interaction programme are persued by a two dimensional scan in collision energy and nuclear mass number of colliding nuclei. The scan allows to explore systematically the phase diagram of strongly interacting matter [1]. In particular, the analysis of the existing data within the framework of statistical models suggests that by increasing collision energy one increases temperature and decreases baryon chemical potential of strongly interacting matter at freeze-out [8], whereas by increasing nuclear mass number of the colliding nuclei one decreases the temperature [9, 8, 10].
Within this programme NA61/SHINE recorded data on p+p, Be+Be, Ar+Sc, Xe+La and Pb+Pb collisions. Further high statistics measurements of Pb+Pb collisions are planned with an upgraded detector starting in 2021 [11]. Results on particle spectra and multiplicities have already been published from p+p interactions [12, 13, 14] which represent the basic reference. This paper reports NA61/SHINE results from the next step in size of the collision system namely measurements of production for the 5% most central 7Be+9Be collisions. The data were recorded in 2011, 2012 and 2013 using a secondary 7Be beam produced by fragmentation of the primary Pb beam from the CERN SPS [15]. The 7Be+9Be collisions play a special role in the NA61/SHINE scan programme. First, it was predicted within the statistical models [16, 17] that the yield ratio of strange hadrons to pions in these collisions should be close to those in central Pb+Pb collisions and significantly higher than in p+p interactions. Second, the collision system composed of a 7Be and a 9Be nucleus has eight protons and eight neutrons, and thus is isospin symmetric. Within the NA61/SHINE scan programme the 7Be+9Be collisions serve as the lowest mass isospin symmetric reference needed to study collisions of medium and large mass nuclei. This is of particular importance when data on proton-proton, neutron-proton and neutron-neutron are not available to construct the nucleon-nucleon reference [18].
In this paper the so-called method is used for determining production since it provides the largest phase space coverage. This procedure utilizes the fact that negatively charged particles are predominantly mesons with a small admixture (of order 10%) of mesons and anti-protons which can be subtracted reliably.
The paper is organized as follows: after this introduction the experiment is briefly described in Sec. 2. The analysis procedure is discussed in Sec. 3. Section 4 describes the results of the analysis. In Sec. 5 the new measurements are discussed and compared to model calculations. A summary closes the paper.
The following variables and definitions are used in this paper. The particle rapidity is calculated in the collision center of mass system (cms), , where and are the particle energy and longitudinal momentum, respectively. The transverse component of the momentum is denoted as , and the transverse mass is defined as where is the particle mass. The momentum in the laboratory frame is denoted and the collision energy per nucleon pair in the center of mass by .
Be+Be collisions can be characterized by the energy detected in the region populated by projectile spectators. Low values of this forward energy are referred to central collision and a selection of collisions based on the forward energy is called a centrality selection. Although for Be+Be collisions the forward energy is not tightly correlated with the impact parameter of the collision, the terms central and centrality are adopted following the convention widely used in heavy-ion physics.
2 Experimental setup
2.1 Detector
The NA61/SHINE experiment is a multi-purpose facility designed to measure particle production in nucleus-nucleus, hadron-nucleus and p+p interactions [19]. The detector is situated at the CERN Super Proton Synchrotron (SPS) in the H2 beamline of the North experimental area. A schematic diagram of the setup during Be+Be data taking is shown in Fig. 1.
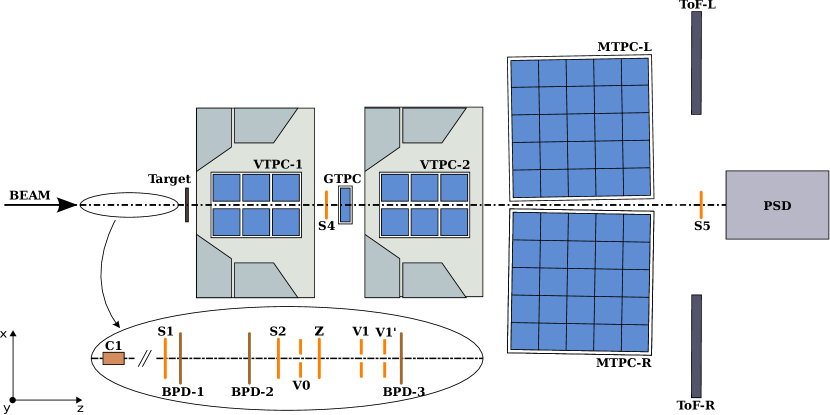
The main components of the produced particle detection system are four large volume Time Projection Chambers (TPC). Two of them, called Vertex TPCs (VTPC), are located downstream of the target inside superconducting magnets with maximum combined bending power of 9 Tm. The magnetic field was scaled down in proportion to the beam momentum in order to obtain similar phase space acceptance at all energies. The main TPCs (MTPC) and two walls of pixel Time-of-Flight (ToF-L/R) detectors are placed symmetrically to the beam line downstream of the magnets. The fifth small TPC (GAP-TPC) is placed between VTPC1 and VTPC2 directly on the beam line. The TPCs are filled with Ar:CO2 gas mixtures in proportions 90:10 for the VTPCs and the GAP-TPC, and 95:5 for the MTPCs.
The Projectile Spectator Detector (PSD), which covers the region into which the projectile spectators are emitted is positioned 20.5 m (16.7 m) downstream of the MTPCs at 75 and 150 (19, 30, 40) centered in the transverse plane on the deflected position of the beam. The PSD allows to select the centrality of the collision by imposing an upper limit on the measured forward energy.
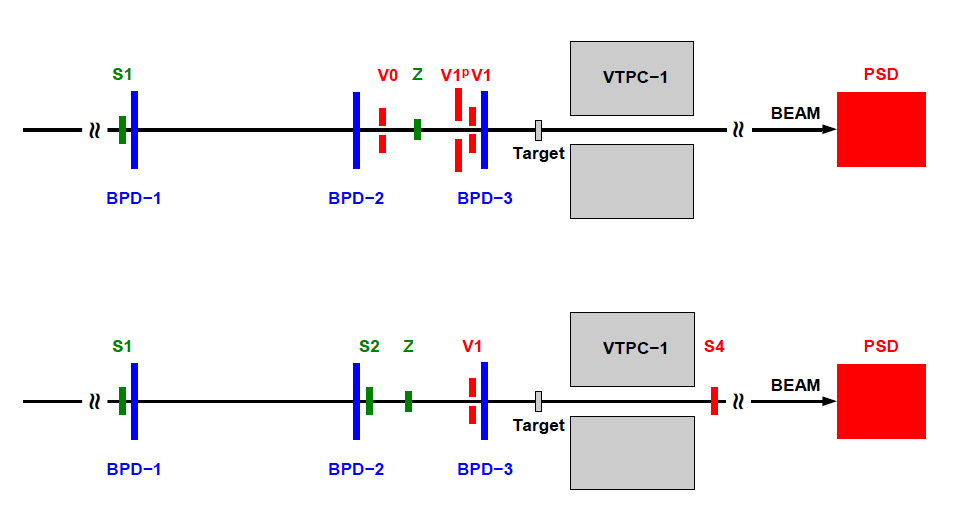
The beam line instrumentation is schematically depicted in Fig. 2. A set of scintillation counters as well as beam position detectors (BPDs) [19] upstream of the target provide timing reference, selection, identification and precise measurement of the position and direction of individual beam particles.
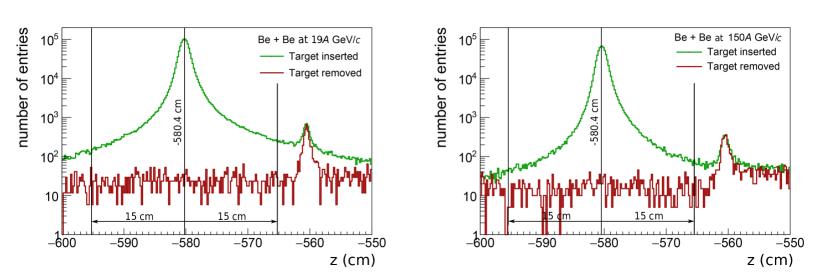
The target was a 12 mm thick plate of 9Be placed 80 cm upstream of VTPC1. Mass concentrations of impurities in the target were measured at 0.3% resulting in an estimated increase of the produced pion multiplicity by less than 0.5% [20]. No correction was applied for this negligible contamination. Data were taken with target inserted (denoted I, 90%) and target removed (denoted R, 10%).
2.2 7Be Beam
The beam line of NA61/SHINE experiment is designed to provide good momentum resolution and particle identification even with secondary ion beams. The beam instrumentation (see Fig. 2) consists of scintillator counters (S) used for triggering and beam particle identification, veto scintillation counters (V) with a hole in the middle for rejection of upstream interactions and beam halo particles, and a Cherenkov charge detector Z built based on quartz glass radiator for the measurement of the secondary beam charge. Additionally the three Beam Position Detectors (BPDs) are used for determination of the charge of individual beam particles.
This paragraph provides a brief description of the 7Be beam properties (see [15]). Primary Pb82+ ions extracted from the SPS were steered toward a 180 mm long beryllium fragmentation target placed 535 m upstream of the NA61/SHINE experiment. An interaction of a Pb-ion with the fragmentation target produces a mixture of nuclear fragments with a large fraction of so-called spectator nucleons which originate from the Pb nucleus but did not participate in the collision. Their momenta per nucleon are equal to the beam momentum per nucleon smeared by Fermi motion. The field strength in the bending magnets of the beam line define the rigidity of the transported charged particles: , where can be adjusted by setting the current in the dipole magnets and is the beam momentum and the charge of the beam particle. Thus the beam line selects particles with the wanted ratio. Figure 3 shows the charge spectrum of a fragment beam with a rigidity corresponding to fully stripped 7Be ions with a momentum of 150 measured by the Z detector.
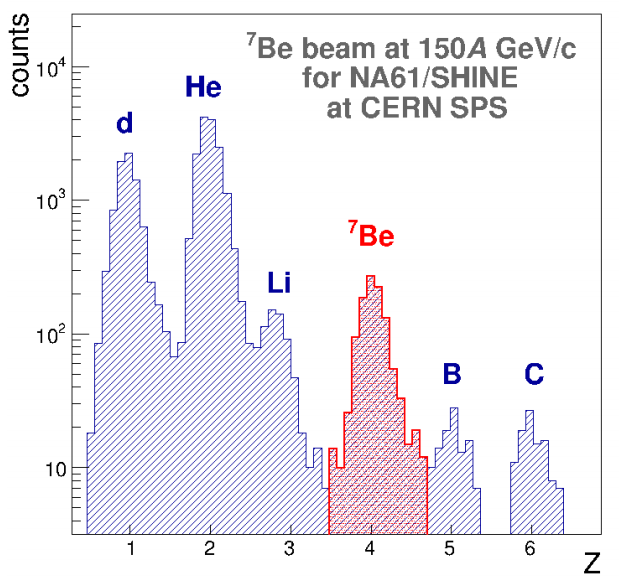
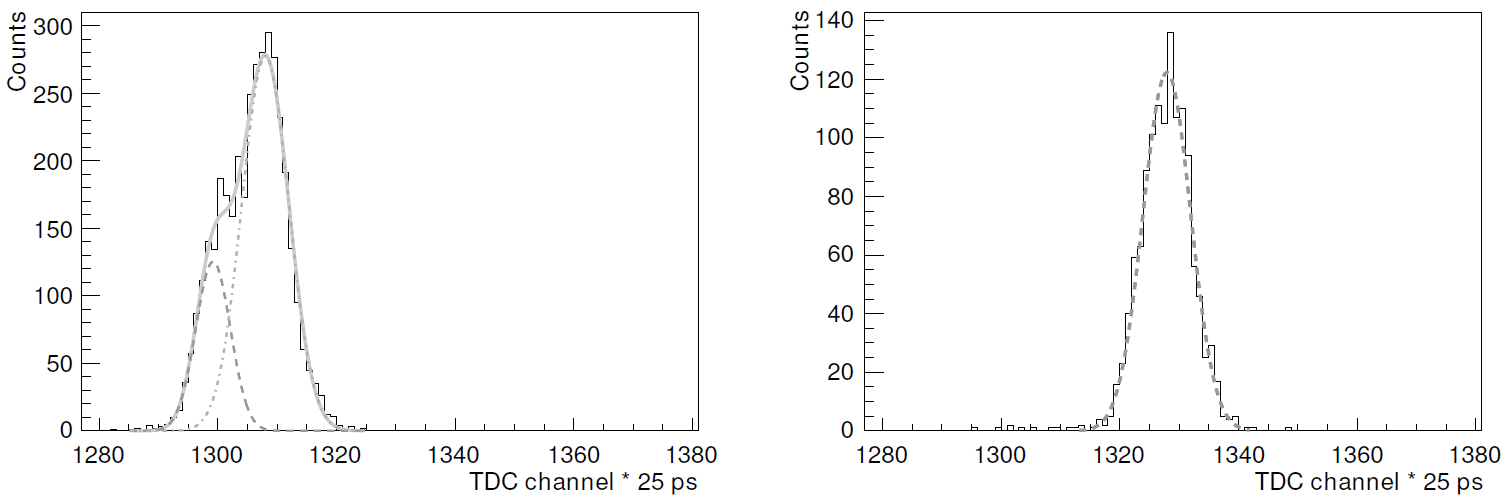
A well separated peak for charge equal 4 is visible. In a special run taken at beam momentum of 13.9 it was possible to also measure the time-of-flight of the beam particles. As demonstrated in Fig. 4 the selected Be fragments are pure 7Be.
2.3 Trigger
The schematic of the placement of the beam and trigger detectors can be seen in Fig. 2. The trigger detectors consist of a set of scintillation counters recording the presence of the beam particle (S1, S2), a set of veto scintillation counters with a hole used to reject beam particles passing far from the centre of the beamline (V0, V1), and a charge detector (Z). Beam particles were defined by the coincidence T1 = and T1 = for low and high momentum data taking respectively. In addition, for the two lower energies an interaction trigger detector (S4) was used to check whether the beam particle changed charge after passing through the target. Central collisions were selected by requiring an energy signal below a set threshold from the 16 central modules of the PSD. The event trigger condition thus was T2 = T1 and T2 = T1 for the lower and higher energies, respectively. The PSD threshold was set to retain from 70% to 40% of inelastic interactions at beam momenta from 19 to 150, respectively. The statistics of recorded events are summarised in Tab. 1.
| Recorded events (all triggers) | Number of selected events | ||
|---|---|---|---|
| 19 | 6.1 | ||
| 30 | 7.6 | ||
| 40 | 8.8 | ||
| 75 | 11.9 | ||
| 150 | 16.8 |
3 Analysis procedure
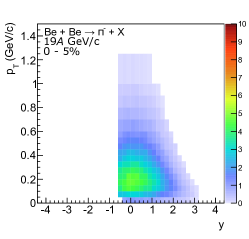
In this paper the so-called method is used for determining production utilizing the fact that negatively charged particles are predominantly mesons with a small admixture (of order 10%) of mesons and anti-protons which can be subtracted reliably. Compared to the other analysis strategies used by NA61/SHINE, aiming at identifying particles based on measuring energy loss in the TPCs and time-of-flight, the method provides the largest phase space coverage. The acceptance of the analysis technique for produced in Be+Be collisions is shown in Fig. 5 for 30 and 150. It covers almost the full forward and part of the backward hemisphere of and down to zero.
This section gives a brief overview of the data analysis procedure and the applied corrections. It also defines to which class of particles the final results correspond. A description of the calibration and the track and vertex reconstruction procedure can be found in Ref. [12].
The analysis procedure consists of the following steps:
-
(i)
application of event and track selection criteria,
-
(ii)
determination of spectra of negatively charged hadrons using the selected events and tracks,
-
(iii)
evaluation of corrections to the spectra based on experimental data and simulations,
-
(iv)
calculation of the corrected spectra and mean multiplicities,
-
(v)
calculation of statistical and systematic uncertainties.
Corrections for the following biases were evaluated:
-
(i)
contribution from off-target interactions,
-
(ii)
bias of selection procedure of central collisions,
-
(iii)
geometrical acceptance,
-
(iv)
contribution of particles other than primary (see below) negatively charged pions produced in Be+Be interactions,
-
(v)
losses of produced negatively charged pions due to their decays and secondary interactions.
Correction (i) was not applied due to insufficient statistics of the target removed data. The contamination of the target inserted data was estimated from the z distribution of fitted vertices (see Fig. 9) and found to be very small ( 0.35%) for the selected central interactions. Correction (ii) was estimated to be small and was therefore included in the systematic uncertainty (see Sec. 3.1). Corrections (iii)-(v) were estimated by simulations, see Sec. 3.3 below.
The final results refer to produced in central Be+Be collisions by strong interaction processes and in electromagnetic decays of produced hadrons. Such hadrons are referred to as primary hadrons. The definition and the selection procedure of central collisions is given in Sec. 3.1.
The analysis was performed independently in (, ) bins. The bin sizes were selected taking into account the statistical uncertainties and the resolution of the momentum reconstruction [12]. Corrections as well as statistical and systematic uncertainties were calculated for each bin.
3.1 Central collisions
The term centrality of the collision is related in the simplest models to the impact parameter or the number of wounded nucleons . Neither quantity is experimentally measurable and one uses instead the number of produced particles or the energy emitted into the forward spectator region to characterise the centrality of the collision. The first choice may bias the measurements of particle production probabilities whereas such a bias is avoided by the second choice. Therefore final results presented in this paper refer to the 5% of Be+Be collisions with the lowest value of the forward energy (central collisions). The quantity is defined as the total energy in the laboratory system of all particles produced in a Be+Be collision via strong and electromagnetic processes in the forward momentum region defined by the acceptance map in Ref. [21]. Results on central collisions defined as above allow a precise comparison with predictions of models without any additional information about the NA61/SHINE setup and used magnetic field. Using this definition the mean number of wounded nucleons and the mean collision impact parameter were calculated within the Wounded Nucleon Model [22] implemented in Epos, see Sec. 3.1.3.
Negatively charged pion production was studied in event ensembles the centrality of which was selected by upper limits of the energy measured by a subset of PSD modules. This subset was optimised for best sensitivity to projectile spectators (see Sec. 3.1.1 for details). For each collision energy the upper limit value was adjusted to select 5% of all inelastic interactions. The forward momentum acceptance in the definition of corresponds to the acceptance of the optimised subset of PSD modules. Based on simulations the results for the selected collisions were corrected to correspond to the selected results.
The details of the described procedures are given below.
3.1.1 Event selection based on the PSD energy
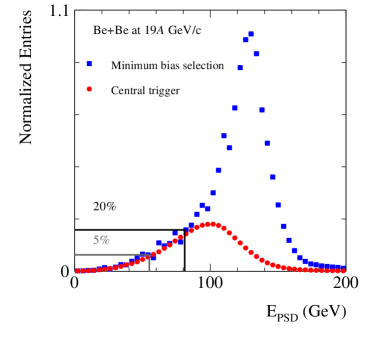
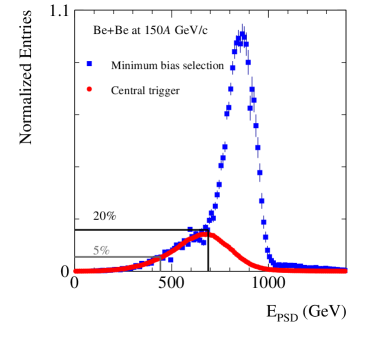
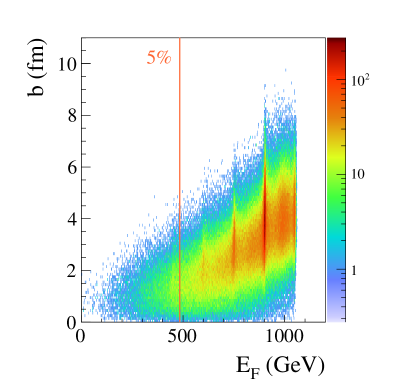
In order to optimize the sensitivity to projectile spectators, only a subset of PSD modules was included in the calculation of [23]. Figure 6 (top) shows the impact points of projectile spectator nucleons on the front face of the PSD obtained from the internal Glauber model of Epos [24] including Fermi motion. Figure 6 (bottom) depicts the modules selected for the summation of . Online event selection by the hardware trigger (T2) used a threshold on the sum of energies over the 16 central modules of the PSD.

Measured distributions of for minimum-bias and T2 trigger selected events, calculated in the offline analysis, are shown in Fig. 7 at beam momenta of 19 and 150, respectively. Also drawn are vertical lines which define the corresponding to the 5% and 20% of events with the lowest values. A minimum-bias distribution was obtained using the data from the beam trigger T1 with offline selection of events by requiring an event vertex in the target region and a cut on the ionisation energy detected in the GTPC to exclude Be beams. A properly normalized spectrum for target removed events was subtracted.
3.1.2 Scaling to selected results
Comparison of presented experimental results with other data require a realistic implementation of described centrality selection. This is more easily realized using a quantity "forward energy" () instead of , since the latter requires detailed knowledge of its response. The acceptance map provided in Ref. [21] gives the recipe for the computation of . Both and were calculated in simulations using the Epos model, which employed a dedicated software package which tracks particles through the magnetic fields and simulates the response of the PSD modules. A global factor was then calculated as the ratio of mean multiplicities of negatively charged pions obtained with the two selection procedures in the 5% most central events. A possible dependence of the scaling factor on rapidity and transverse momentum was neglected. The resulting factors range between 1.00 and 1.03 (see Table 2) corresponding to only a small correction compared to the systematic uncertainties of the measured multiplicities. The correction was therefore not applied but instead included as a contribution to the systematic uncertainties.
3.1.3 Mean number of wounded nucleons and collision impact parameter
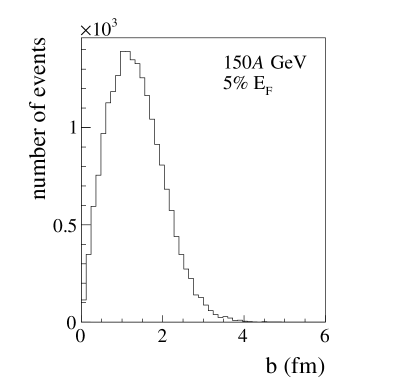
Comparisons of particle yields in collisions of different size nuclei usually employs the average number of wounded nucleons in the respective reactions. For estimating the average number of wounded nucleons corresponding to the selected central collisions Epos 1.99 (version Crmc 1.5.3) [25] was employed which uses the Glauber model and a parton ladder mechanism to generate the interactions. Epos was modified [24] to provide the values of of its internal Glauber model calculation. The results on for the 5% most central collisions from the Epos model are listed in Table 2. Fluctuations of the listed values are due to the integer nature of . As Epos simulates all particles of the final state a more realistic estimate of is obtained by selecting central collisions based on the energy . The resulting mean number of wounded nucleons and the mean impact parameter are also listed in Table 2. Values of for the two selection procedures differ by about two units. Examples of the distributions of and for the 5% most central collisions are shown in Fig. 8. As the nucleon density is low in the Be nucleus these distributions are quite broad. This emphasises that for model comparisons it is important to use equivalent centrality selection procedures to obtain a meaningful result.

| Momentum () | 19 | 30 | 40 | 75 | 150 | |
|---|---|---|---|---|---|---|
| Epos WNM | ||||||
| Epos | ||||||
3.2 Event and track selection
3.2.1 Event selection
For the analysis Be+Be events were selected using the following criteria:
-
(i)
four units of charge measured in S1, S2, and Z counters as well as BPD3 (this requirement also rejects most interactions upstream of the Be target),
-
(ii)
no off-time beam particle detected within a time window of 4.5s around the trigger particle,
-
(iii)
no other event trigger detected within a time window of 25s around the trigger particle,
-
(iv)
beam particle trajectory measured in at least three planes out of four of BPD-1 and BPD-2 and in both planes of BPD-3,
-
(v)
charge measured in the GTPC smaller than that of Be (applied at 40, 75 and 150),
-
(vi)
a well reconstructed interaction vertex with z position (fitted using the beam trajectory and TPC tracks) not farther away than 15 cm from the center of the Be target (see Fig 9; the cut removes less than 0.4% of central interactions),
-
(vii)
the energy measured in the subset of the PSD modules smaller than an upper limit (55, 73, 104, 165, 442 GeV for collisions at 19, 20, 30, 40, 75 and 150, respectively) in order to select the 5% most central collisions (see discussion in Sec. 3.1).
The event statistics after applying the selection criteria are summarized in Table 1.
3.2.2 Track selection
In order to select tracks of primary charged hadrons and to reduce the contamination of tracks from secondary interactions, weak decays and off-time interactions, the following track selection criteria were applied:
-
(i)
track momentum fit at the interaction vertex should have converged,
-
(ii)
fitted x component of particle rigidity at the vertex is positive. This selection minimizes the angle between the track trajectory and the TPC pad direction for the given magnetic field direction, reducing uncertainties of the reconstructed cluster position, energy deposition and track parameters,
-
(iii)
total number of reconstructed points on the track should be greater than 15,
-
(iv)
sum of the number of reconstructed points in VTPC-1 and VTPC-2 should be greater than 15 or greater than 4 in the GTPC,
-
(v)
the distance between the track extrapolated to the interaction plane and the interaction point (track impact parameter) should be smaller than 4 cm in the horizontal (bending) plane and 2 cm in the vertical (drift) plane,
-
(vi)
electron tracks were excluded by a cut on the measured particle energy loss in the TPCs.
3.3 Corrections
In order to determine the mean multiplicity of primary mesons produced in central Be+Be collisions a set of corrections was applied to the extracted raw results. The main effects are detector acceptance, loss of events due to the cut on reconstructed vertex position, reconstruction efficiency, contributions of particles from weak decays (feed-down), and contribution of primary hadrons other than negatively charged pions (mostly mesons). The contamination of events occurring outside the target was negligible.
A simulation of the NA61/SHINE detector is used to correct the data for acceptance, reconstruction efficiency and contamination. Only Be+Be interactions in the target material were simulated and reconstructed. The Epos model [25, 24] was selected to generate the primary interactions as it best describes the NA61/SHINE measurements. A Geant3 based program chain was used to track particles through the spectrometer, generate decays and secondary interactions and simulate the detector response (for more detail see Ref. [12]). Simulated events were then reconstructed using the NA61/SHINE reconstruction chain and reconstructed tracks were matched to the simulated particles based on the cluster positions. The same event selection procedure was used as for data (cut on the summed energy in the subset of PSD modules used to select the 5% most central collisions). Particles which were not produced in the primary interaction can amount to a significant fraction of the selected track sample. Thus a careful effort was undertaken to evaluate and subtract this contribution.
The correction factor for primary , based on the event and detector simulation was calculated for each and bin as:
| (1) |
where is the mean multiplicity of reconstructed negatively charged particles after the event and track selection criteria and is the mean multiplicity of primary negatively charged pions from the -selected Be+Be collisions generated by the Epos model.
The corrected multiplicities were then calculated as:
| (2) |
The final results in bins of and are shown in Fig. 10.
3.4 Statistical uncertainties
Statistical uncertainties of the yields receive contributions from the finite statistics of both the data and the simulated events used to obtain the correction factors. The dominating contribution is the uncertainty of the data which were calculated assuming a Poisson probability distribution for the number of entries in a bin. Compared to the statistics of the data the statistics of the simulation were much higher and the statistical uncertainties of the latter were neglected.
3.5 Systematic uncertainties
Systematic uncertainties presented in this paper were calculated taking into account contributions from the following effects.
-
(i)
Possible biases due to track cuts which are not corrected for. These are:
-
(a)
a possible bias due to the cut applied to remove electrons,
-
(b)
a possible bias related to the removal of events with off-time beam particles close in time to the trigger particle.
Their magnitude was estimated by varying the values of the corresponding cut for data selection. The possible bias due to the cut was changed by units (where 1 corresponds to a minimum ionising particle, and 0.04 is a typical width of the distribution for ), and the off-time interactions cut was varied from a s to a s time window. The assigned systematic uncertainty was calculated as the maximum of the absolute differences between the results obtained for lower and upper values. The estimated bias is on the level of 1-3%.
This uncertainty is listed in the tables including numerical values and it is visualised by a shaded band around the data points in plots presenting the results. Systematic biases in different bins are correlated, whereas statistical fluctuations are almost independent.
-
(a)
-
(ii)
Uncertainty related to the track cuts which were corrected for. It was estimated by varying the track selection cuts used for data and Monte Carlo events: removing the impact parameter cut and decreasing the minimum number of required points to 12 (total) and 10 (in VTPCs). The potential bias is below 2%.
-
(iii)
Uncertainty of the correction for contamination of the primary mesons. There was no data available to adjust the simulated spectra. To estimate a possible bias the simulated spectra were instead adjusted to preliminary NA61/SHINE data on the ratio [26], and the difference between the results with adjusted and standard correction of order 2% was assigned as relative potential systematic uncertainty. Since are the main contribution to the correction and the absolute correction is small, this contribution was finally neglected in the systematic uncertainty estimate.
The total systematic uncertainty was calculated by adding in quadrature the contributions (i) - (iii):
| (3) |
This uncertainty is listed in the tables including numerical values and it is visualised by a shaded band around the data points in plots presenting the results. Systematic biases in different bins are correlated, whereas statistical fluctuations fluctuations are almost independent.
4 Experimental results
This section presents results on negatively charged pion spectra at 19, 30, 40, 75 and 150 beam momentum in the 5% most central 7Be+9Be collisions (see Sec. 3.1 for definition of central collisions). The results refer to primary pions produced by strong interaction and decay processes and in electromagnetic decays of neutral hadrons.
4.1 Double-differential (, ) and (, ) yields
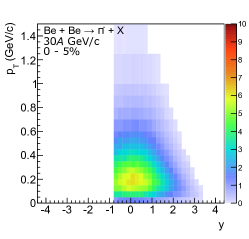
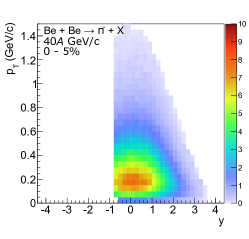
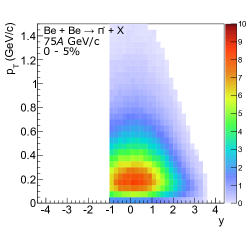
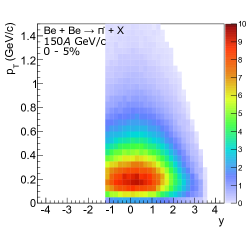
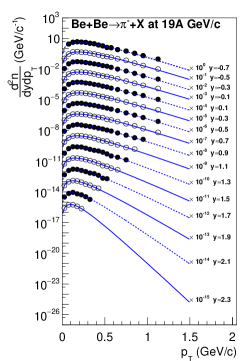
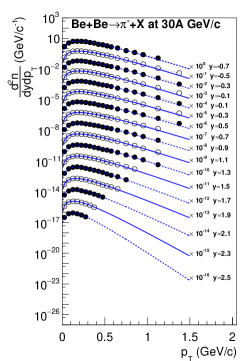
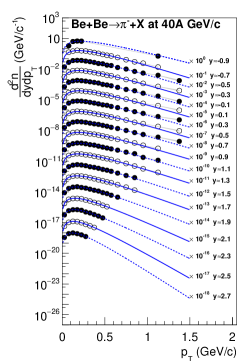
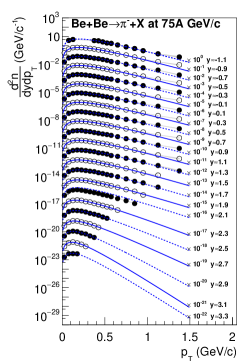
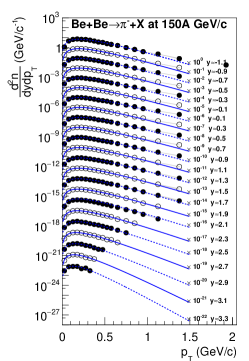
Figure 10 shows fully corrected double-differential (, ) distributions of measured in Be+Be interactions and illustrates the wide phase space acceptance of the detector. Rapidity bins with limited acceptance ( for 19, for 30, for 40, for 75 and for 150) are not used in the subsequent analysis.
4.2 Transverse momentum and transverse mass spectra
Spectra of transverse momentum in slices of rapidity are plotted in Fig. 11. Superimposed curves show the results obtained from fitting the function
| (4) |
motivated by the thermal model, where the inverse slope parameter and the normalisation constant are the fit parameters.
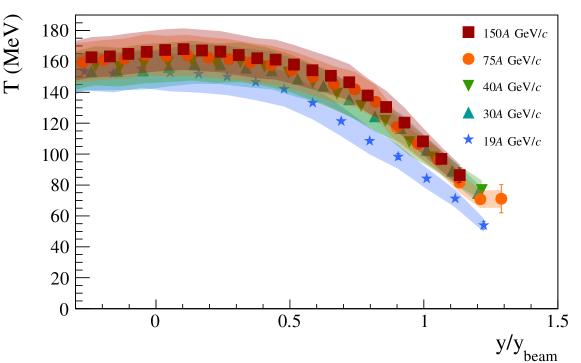
A summary of the fitted values of the inverse slope parameter are shown in Fig. 12 plotted versus rapidity divided by beam rapidity. The decrease of towards larger rapidities and the obtained values are close to those found for inelastic p+p interactions [12]. Numerical values of at 0 are given in Table 3.
| () | (MeV) | (MeV) | |
|---|---|---|---|
| 19 | 150 1 6 | 2.00 0.06 0.12 | 149.1 5.0 4.8 |
| 30 | 158 1 7 | 2.57 0.08 0.16 | 153.3 2.2 1.2 |
| 40 | 160 1 6 | 3.02 0.09 0.19 | 157.7 1.7 2.1 |
| 75 | 163 1 8 | 3.44 0.10 0.21 | 159.9 1.5 4.1 |
| 150 | 167 1 8 | 3.80 0.10 0.23 | 159.3 1.3 2.6 |
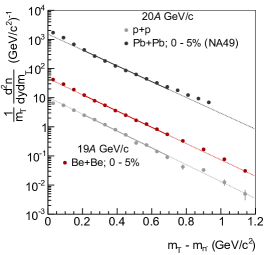
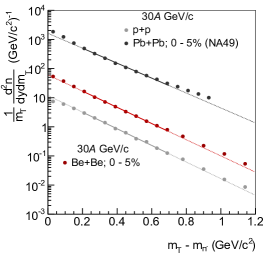
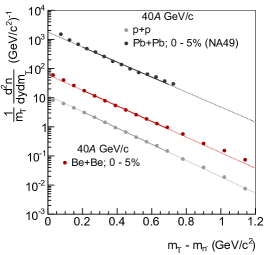
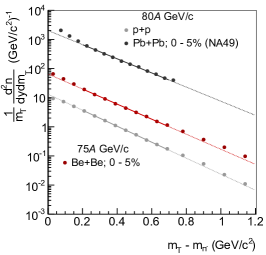
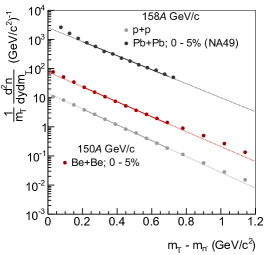
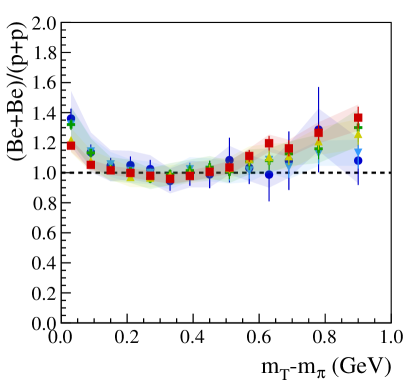
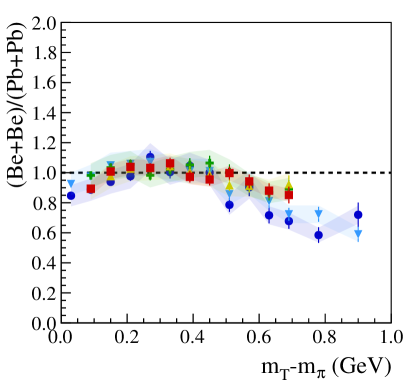
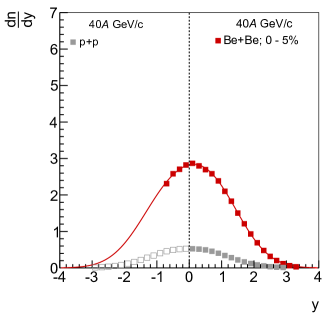
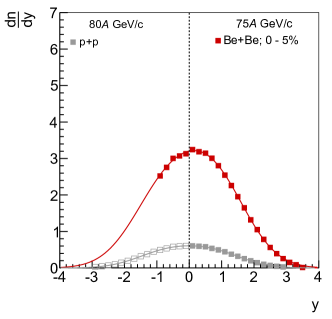
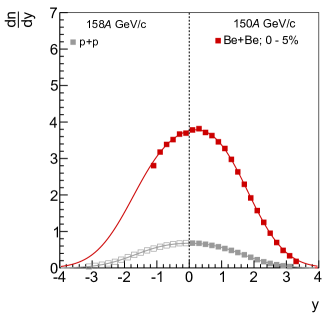
Spectra of transverse mass at mid-rapidity () are shown in Fig. 13 for the 5% most central Be+Be collisions and for inelastic p+p interactions [12] as well as central Pb+Pb collisions [2, 3]. The p+p data follow exponential distributions as shown by the lines fitted in the range using Eq. 4 expressed in . Interestingly, relative to the exponential fits the spectra from nucleus-nucleus interactions develop enhancements at low and high transverse mass which increase with the size of the collision system. To compare in more detail the transverse mass spectra between systems, each spectrum was normalized to the integral of the spectrum in the range of . The normalized Be+Be spectra were then divided by the corresponding p+p and Pb+Pb spectra used as a reference. The resulting ratios of the normalised spectra are presented in Fig. 14.
The shape of spectra in central Be+Be collisions is significantly different from the one observed in inelastic p+p interactions (Fig. 14 left). However, it is important to note that the Be+Be system is isospin symmetric whereas p+p has . Comparing Be+Be to Pb+Pb (Fig. 14 right) reveals that both shapes are similar. Note that Pb+Pb is to a large extent isospin symmetric.
-
■
150
-
▲
75
-
✚
40
-
▼
30
-
●
19
4.3 Rapidity spectra and mean multiplicities
To extract one-dimensional rapidity spectra from the two-dimensional - spectra the contribution from the missing high acceptance has to be accounted for. The transverse momentum spectrum for each rapidity bin was parametrized with Eq. 4. An additional constraint was added to the fit to ensure that the integral of the fitted function agrees with the integral (sum) of the measurements over the interval where data are available. The extrapolation increases the value of the summed measurements by . Only for the extrapolation effect rises to around 1%.
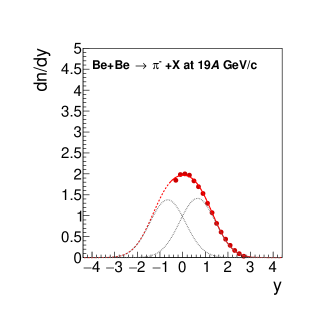
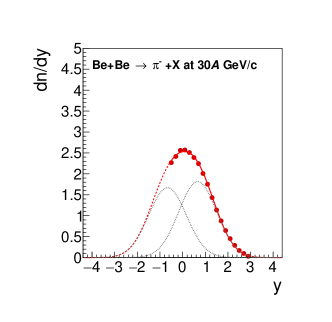
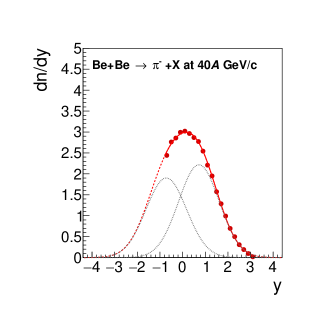
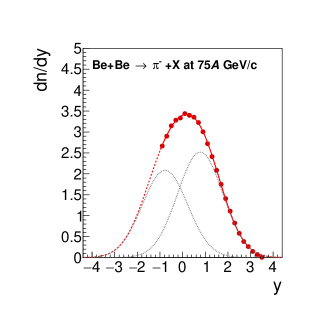
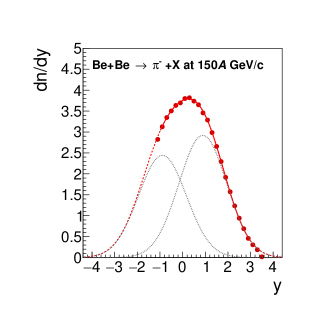
The rapidity spectra are plotted in Fig. 15. A closer look reveals an asymmetry of the spectra with respect to mid-rapidity. To quantify the amount of asymmetry the spectra were parametrized with the sum of two Gaussian functions with the same width and mean value displaced from mid-rapidity by the same amount:
| (5) |
where is the normalization parameter, is the relative amplitude of the Gaussian distributions, is the common width and is the displacement from mid-rapidity. Results for the fitted functions are presented in Fig. 15. Numerical values of the fitted parameters , as well as the RMS width of the rapidity distribution calculated from
| (6) |
are listed in Table 4.
| Momentum () | 19 | 30 | 40 | 75 | 150 |
|---|---|---|---|---|---|
The relative amplitude of the Gaussian distributions decreases slowly with increasing beam momentum, i.e the asymmetry increases. This deviation of from unity signals a forward-backward asymmetry of the rapidity distribution which may be explained by the asymmetry of the collision system and the event selection procedure:
-
(i)
Asymmetric collisions of a 7Be beam with a larger mass 9Be target may lead to enhanced particle production at backward rapidity,
-
(ii)
a larger number of neutrons in the 9Be target nuclei might result in a difference in the ratio of to in the backward and forward rapidity regions,
-
(iii)
selection of central collisions by requiring the forward energy below a cut value.
The asymmetry was studied using the Wounded Nucleon Model (WNM) [22], where production of particles in the backward hemisphere is proportional to the number of wounded nucleons in the target and production of particles in the forward hemisphere is proportional to the number of wounded nucleons in the projectile. In the WNM the effect of the asymmetric system leads to a small enhancement of of the particle yield below mid-rapidity, which is opposite to what is seen in the data. On the other hand, the effect of the centrality selection based only on the forward energy is enhancing particle production at forward rapidity. The data show that the latter effect dominates.
Rapidity spectra in central Be+Be collisions are compared to results from inelastic p+p interactions [12] in Fig. 16. Mean negative pion multiplicities were obtained by summing the measured data points and adding a contribution from the fitted function Eq. 5 for the unmeasured region. Half of the contribution added based on the fit is added to systematic uncertainty. The results are listed in Table 5.
| Momentum () | 19 | 30 | 40 | 75 | 150 |
|---|---|---|---|---|---|
| / | 1.66 | 2.39 | 2.69 | 3.70 | 4.48 |
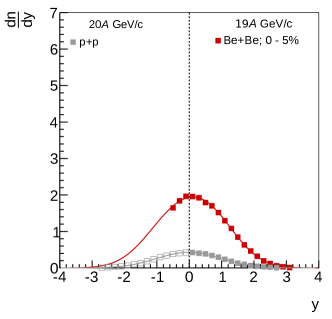
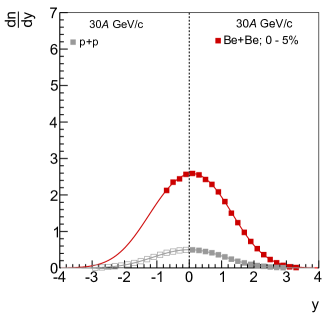
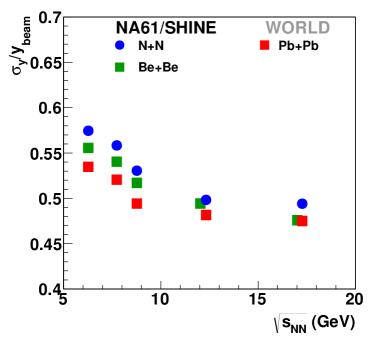
The widths of the rapidity distributions were calculated from Eq.6 and are listed in Table 4. The beam energy dependence of the width of the rapidity distribution divided by the beam rapidity is presented in Fig. 17. For Be+Be and Pb+Pb interactions the ratio was calculated for mesons. Since the p+p collision system is not isospin symmetric the isospin average ( + )/2 was plotted for comparison. These results are referred to as results for nucleon-nucleon (N+N) collisions [18]. For all system sizes the relative width decreases monotonically with beam energy and system size.
5 Discussion
Several features of meson production were predicted to be sensitive to the onset of deconfinement, namely the energy dependence of the transverse mass distribution, the width of the rapidity distribution - both due to the softening of the equation of state [27, 28, 29] - and the mean multiplicity due to the increasing entropy during the transition from the hadronic to the partonic phase [30]. The data presented in this paper are discussed in the context of these predictions in the following.
In the collision energy range in which the mixed hadron and parton matter is created a stalling of the expansion of the system is expected [31]. This results in a slowing of the increase of radial flow of the produced particles and in a step-like structure in the energy dependence of the inverse slope parameter of the transverse mass spectra [4]. This feature was clearly observed for mesons in central Pb+Pb collisions and was interpreted as one of the indications of the onset of deconfinement [2, 3].
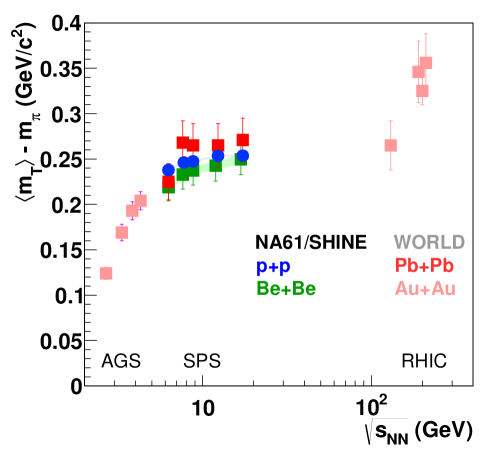
Pion transverse mass spectra deviate significantly from the exponential function Eq. 4 used to fit the inverse slope parameter. This is attributed to a large contribution of pions from resonance decays and possible effect of transverse collective flow [31]. Thus in order to avoid model-dependence of results transverse mass spectra are characterize by the mean transverse mass . Figure 18 shows the "step" plot for in central Be+Be collisions compared to central Pb+Pb interactions and inelastic p+p reactions. The values and energy dependence measured in Be+Be collisions are surprisingly similar to those in inelastic p+p interactions and there is only a small increase towards central Pb+Pb collisions. This suggests that the average transverse mass of mesons is only weakly sensitive to the transverse flow and thus it is not a discriminating observable for the onset of deconfinement.
The Landau hydrodynamical model of high energy collisions [35, 36] predicts rapidity distributions of Gaussian shapes. In fact this prediction is approximately confirmed by the experimental data, see Ref. [37] and references therein. Moreover, the collision energy dependence of the width was derived by Shuryak [38] from the same model under simplifying assumptions and reads:
| (7) |
where denotes the speed of sound, and for an ideal gas of massless particles.
The above prediction is compared with the experimental data on the width of the rapidity distributions of mesons produced in central nucleus-nucleus collisions and inelastic nucleon-nucleon interactions in Fig. 19 (left)111For p+p interactions the figure shows isospin symmetrised values denoted as N+N [12]. The model calculations are close to the measured dependence on the beam rapidity . However, linear increase with provides a better fit to the measurements as shown by the straight line fit. The deviations were attributed to the changes in the equation of state [39, 40], which can be effectively parametrised by allowing the speed of sound to be dependent on collision energy. Clearly the measured values of differ very little between the studied reactions in the SPS energy range.
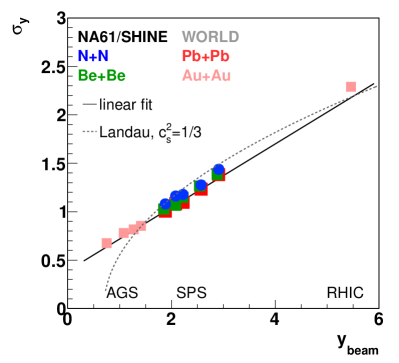
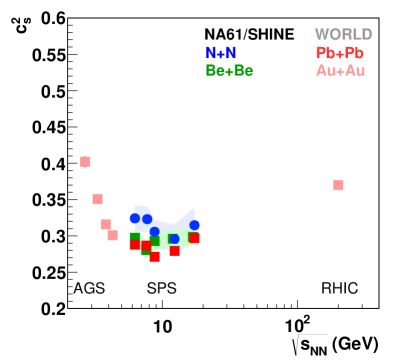
By inverting Eq. 7 one can express in the medium as a function of the measured width of the rapidity distribution. The energy dependence of the sound velocities extracted from the data are presented in Fig. 19 (right). The energy range for results from Be+Be collisions and inelastic p+p reactions is too limited and the fluctuations in the data too large to allow a significant conclusion about a possible minimum. Data on central Pb+Pb collisions, in combination with results from AGS and RHIC on central Au+Au collisions, cover a much wider energy range. Here the sound velocity exhibits a clear minimum (usually called the softest point) at GeV consistent with the reported onset of deconfinement [2, 3].
Pions are the most copiously produced hadrons () in collisions of nucleons and nuclei at SPS energies. Their multiplicity is closely related to the entropy produced in such interactions [41]. Within the Fermi and Landau models the entropy is expected to increase as
| (8) |
where the Fermi collision energy measure is defined as
| (9) |
Since the number of degrees of freedom is higher for the quark-gluon plasma than for confined matter, it is also expected that the entropy density of the produced final state at given energy density should also be higher in the first case. The following simple relation describes the expected dependence [30]:
| (10) |
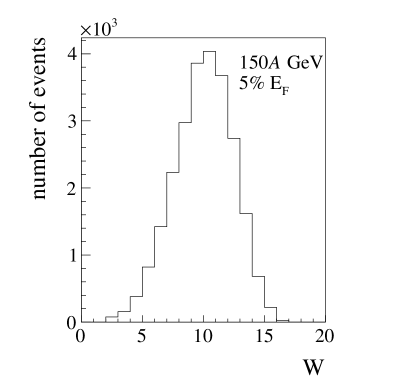
Therefore, the entropy and information regarding the state of matter formed in the early stage of a collision should be reflected in the number of produced pions normalized to the volume of the system. This intuitive argument was quantified in the Statistical Model of the Early Stage (SMES) [4]. The increase with collision energy of the mean number of produced pions , normalized to the number of wounded nucleons [22] is expected to be linear when plotted against . The rate of increase is related to the number of degrees of freedom as given by Eq. 10. This simple prediction is modified at low collision energies when absorption of pions in the hadronic matter is expected to significantly decrease the final pion yield [4].
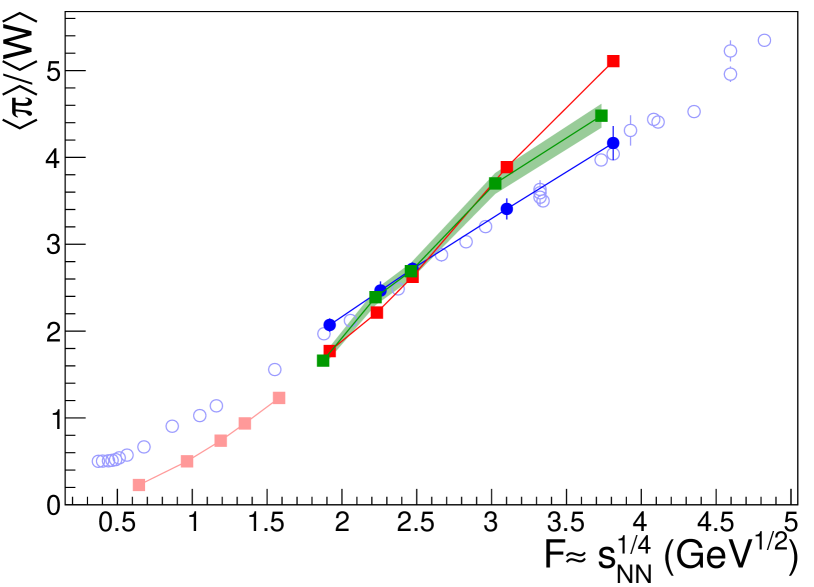
Figure 20 displays the ratio of mean pion multiplicitys222The mean number of produced pions is calculated as for nucleus-nucleus collisions and for N+N interactions to the number of wounded nucleon as a function of .
The new measurements of the ratio in central Be+Be collisions are compared to a compilation of results from central Pb+Pb (Au+Au) collisions and inelastic nucleon-nucleon interactions. Above GeV 1/2 the slope of the Pb+Pb dependence is about a factor 1.3 higher than for nucleon-nucleon interactions. The ratio in central Be+Be collisions follows the ratio for central Pb+Pb collisions up to GeV 1/2. Thus in this energy range the Be+Be slope is also by a factor 1.3 higher than in N+N collisions. However this behaviour seems to change at the top SPS energy where the slope for the Be+Be ratio decreases to the one observed in N+N interactions. Note, that is not a measured quantity, but has to be derived from models. Here the Epos model was used (see Sec. 3.1.3). Therefore the ratio is directly model dependent and this dependence increases with decreasing nuclear mass number of colliding nuclei. For Be+Be collisions using different models leads to variation of the ratio of up to 10%, which is comparable to the difference between results on Be+Be and Pb+Pb collisions.
New results on Ar+Sc and Xe+La collisions from NA61/SHINE will be available soon and are expected to clarify the energy and system size dependence of which is a measure of the entropy of the produced fireball.
6 Summary and conclusions
The NA61/SHINE experiment at the CERN SPS measured spectra and multiplicities of mesons produced in the 5% most central 7Be+9Be collisions at beam energies of 19, 30, 40, 75 and 150 using the so-called method. This is the first step in the systematic study of the phase diagram of hadronic matter and the first such measurement in Be+Be collisions.
The normalized width of the rapidity distribution decreases with increasing collision energy and the values lie between the results for inelastic nucleon-nucleon and central Pb+Pb collisions. The average transverse mass versus collision energy shows a plateau in the SPS energy range at a similar level like in inelastic nucleon-nucleon and central Pb+Pb collisions. The mean multiplicity of pions per wounded nucleon in central 7Be+9Be collisions rises linearly with the Fermi energy variable and is close to the one in central Pb+Pb collisions expect for the top SPS energy, where it is closer to the N+N ratio.
The results are discussed in the context of predictions for the onset of deconfinement at the CERN SPS collision energies.
Acknowledgments
We would like to thank the CERN EP, BE, HSE and EN Departments for the strong support of NA61/SHINE. We thank A. Kubala-Kukuś and D. Banaś from the Institute of Physics, Jan Kochanowski University for the target purity measurements with the WDXRF technique.
This work was supported by the Hungarian Scientific Research Fund (grant NKFIH 123842/123959), the Polish Ministry of Science and Higher Education (grants 667/N-CERN/2010/0, NN 202 48 4339, NN 202 23 1837 and DIR/WK/2016/2017/10-1), the National Science Centre Poland (grants 2014/14/E/ST2/00018, 2014/15/B/ST2 / 02537 and 2015/18/M/ST2/00125, 2015/19/N/ST2 /01689, 2016/23/B/ST2/00692, 2017/ 25/N/ ST2/ 02575, 2018/30/A/ST2/00226, 2018/31/G/ST2/03910), the Russian Science Foundation, grant 16-12-10176 and 17-72-20045, the Russian Academy of Science and the Russian Foundation for Basic Research (grants 08-02-00018, 09-02-00664 and 12-02-91503-CERN), the Russian Foundation for Basic Research (RFBR) funding within the research project no. 18-02-00086, the National Research Nuclear University MEPhI in the framework of the Russian Academic Excellence Project (contract No. 02.a03.21.0005, 27.08.2013), the Ministry of Science and Higher Education of the Russian Federation, Project "Fundamental properties of elementary particles and cosmology" No 0723-2020-0041, the European Union’s Horizon 2020 research and innovation programme under grant agreement No. 871072, the Ministry of Education, Culture, Sports, Science and Technology, Japan, Grant-in-Aid for Scientific Research (grants 18071005, 19034011, 19740162, 20740160 and 20039012), the German Research Foundation (grant GA 1480/8-1), the Bulgarian Nuclear Regulatory Agency and the Joint Institute for Nuclear Research, Dubna (bilateral contract No. 4799-1-18/20), Bulgarian National Science Fund (grant DN08/11), Ministry of Education and Science of the Republic of Serbia (grant OI171002), Swiss Nationalfonds Foundation (grant 200020117913/1), ETH Research Grant TH-01 07-3 and the Fermi National Accelerator Laboratory (Fermilab), a U.S. Department of Energy, Office of Science, HEP User Facility managed by Fermi Research Alliance, LLC (FRA), acting under Contract No. DE-AC02-07CH11359 and the IN2P3-CNRS (France).
References
- [1] N. Antoniou et al., [NA61/SHINE Collab.], “Study of hadron production in hadron nucleus and nucleus nucleus collisions at the CERN SPS,” 2006. CERN-SPSC-2006-034.
- [2] S. Afanasiev et al., [NA49 Collab.] Phys. Rev. C66 (2002) 054902.
- [3] C. Alt et al., [NA49 Collab.] Phys. Rev. C77 (2008) 024903.
- [4] M. Gazdzicki and M. I. Gorenstein Acta Phys.Polon. B30 (1999) 2705, arXiv:hep-ph/9803462 [hep-ph].
- [5] M. Gazdzicki, M. Gorenstein, and P. Seyboth Acta Phys.Polon. B42 (2011) 307–351, arXiv:1006.1765 [hep-ph].
- [6] L. Adamczyk et al. Phys.Rev. C96 (2017) 044904, arXiv:1701.07065 [nucl-ex].
- [7] A. Rustamov Central Eur.J.Phys. 10 (2012) 1267–1270, arXiv:1201.4520 [nucl-ex].
- [8] F. Becattini, J. Manninen, and M. Gazdzicki Phys.Rev. C73 (2006) 044905, arXiv:hep-ph/0511092 [hep-ph].
- [9] C. Alt et al., [NA49 Collab.] Phys. Rev. C 77 (2008) 064908, arXiv:0709.4507 [nucl-ex].
- [10] V. Vovchenko, V. Begun, and M. Gorenstein Phys. Rev. C 93 no. 6, (2016) 064906, arXiv:1512.08025 [nucl-th].
- [11] A. Aduszkiewicz, [NA61/SHINE Collaboration Collab.], “Beam momentum scan with Pb+Pb collisions,” Tech. Rep. CERN-SPSC-2015-038. SPSC-P-330-ADD-8, CERN, Geneva, Oct, 2015. https://cds.cern.ch/record/2059811.
- [12] N. Abgrall et al., [NA61/SHINE Collab.] Eur.Phys.J. C74 (2014) 2794, arXiv:1310.2417 [hep-ex].
- [13] A. Aduszkiewicz et al., [NA61/SHINE Collab.] Eur. Phys. J. C77 no. 10, (2017) 671, arXiv:1705.02467 [nucl-ex].
- [14] A. Aduszkiewicz et al., [NA61/SHINE Collab.] Phys. Rev. C 102 (2020) 011901, arXiv:1912.10871 [hep-ex].
- [15] O. Berrig et al., [CERN and NA61/SHINE Collab.], “The 2010 test of secondary light ion beams,” tech. rep., 2011. CERN-SPSC-2011-005.
- [16] R. Poberezhnyuk, M. Gazdzicki, and M. Gorenstein Acta Phys. Polon. B 46 no. 10, (2015) 1991, arXiv:1502.05650 [nucl-th].
- [17] A. Motornenko, V. Begun, V. Vovchenko, M. Gorenstein, and H. Stoecker Phys. Rev. C 99 no. 3, (2019) 034909, arXiv:1811.10645 [nucl-th].
- [18] M. Gazdzicki and O. Hansen Nucl. Phys. A 528 (1991) 754–770.
- [19] N. Abgrall et al., [NA61 Collab.] JINST 9 (2014) P06005, arXiv:1401.4699 [physics.ins-det].
- [20] D. Banas, A. Kubala-Kukus, M. Rybczynski, I. Stabrawa, and G. Stefanek Eur. Phys. J. Plus 134 no. 1, (2019) 44, arXiv:1808.10377 [nucl-ex].
- [21] A. Seryakov, [NA61/SHINE Collab.], “PSD acceptance maps used in the paper: pi- in BeBe.” https://edms.cern.ch/document/2368899/1, 2020. CERN EDMS.
- [22] A. Bialas, M. Bleszynski, and W. Czyz Nucl. Phys. B111 (1976) 461.
- [23] E. Kaptur, [NA61/SHINE Collaboration Collab.]. https://edms.cern.ch/document/2004086/1.
- [24] T. Pierog, 2018. private communication.
- [25] K. Werner, F.-M. Liu, and T. Pierog Phys.Rev. C74 (2006) 044902.
- [26] S. Pulawski, [NA61/SHINE Collab.] PoS CPOD2017 (2018) 017.
- [27] C. Hung and E. V. Shuryak Phys. Rev. Lett. 75 (1995) 4003–4006, arXiv:hep-ph/9412360.
- [28] D. H. Rischke, Y. Pursun, J. A. Maruhn, H. Stoecker, and W. Greiner Acta Phys. Hung. A 1 (1995) 309–322, arXiv:nucl-th/9505014.
- [29] J. Brachmann, A. Dumitru, H. Stoecker, and W. Greiner Eur. Phys. J. A 8 (2000) 549–552, arXiv:nucl-th/9912014.
- [30] M. Gazdzicki Z. Phys. C 66 (1995) 659–662.
- [31] M. I. Gorenstein, M. Gazdzicki, and K. Bugaev Phys. Lett. B 567 (2003) 175–178, arXiv:hep-ph/0303041.
- [32] J. Klay et al., [E895 Collab.] Phys. Rev. C68 (2003) 054905.
- [33] I. Bearden et al., [BRAHMS Collab.] Phys. Rev. Lett. 94 (2005) 162301.
- [34] N. Abgrall et al., [NA61/SHINE Collab.] in Eur.Phys.J. [12], p. 2794, arXiv:1310.2417 [hep-ex].
- [35] L. Landau Izv.Akad.Nauk SSSR no. Ser.Fiz. 17, (1953) 51.
- [36] S. Belenkij and L. Landau Nuovo Cim. Suppl. 3S10 (1956) 15.
- [37] C. Blume J. Phys. G 31 (2005) S57–S68.
- [38] E. V. Shuryak Yad. Fiz. 16 (1972) 395–405.
- [39] M. Bleicher arXiv:hep-ph/0509314.
- [40] H. Petersen and M. Bleicher PoS CPOD2006 (2006) 025, arXiv:nucl-th/0611001.
- [41] E. Fermi Prog. Theor. Phys. 5 (1950) 570–583.
- [42] M. Gazdzicki Acta Phys. Hung. A 4 (1996) 33–44, arXiv:hep-ph/9606473.