Shock–Cloud Interaction in the Southwestern Rim of RX J1713.73946 Evidenced by Chandra X-ray Observations
Abstract
We report on results of Chandra X-ray observations of the southwestern part of the supernova remnant (SNR) RX J1713.73946. We measure proper motions of two X-ray bright blobs, named Blobs A and B, in regions presumably corresponding to the forward shock of the SNR. The measured velocities are and for Blobs A and B, respectively. Since a dense molecular clump is located close to Blob B, its slower velocity is attributed to shock deceleration as a result of a shock–cloud interaction. This result provides solid evidence that the forward shock of RX J1713.73946 is indeed colliding with dense gas discovered through radio observations reported in the literature. The locations and velocity differences of the two blobs lead to an estimate that the shock encountered with the dense gas ago. The shock velocities, together with cutoff energies of the synchrotron X-ray spectra of the blobs, indicate that particle acceleration in these regions is close to the Bohm limit. Blob B, in particular, is almost at the limit, accelerating particles at the fastest possible rate. We discuss possible influence of the shock–cloud interaction on the efficiency of particle acceleration.
1 Introduction
Supernova remnants (SNRs) have been attracting attention as one of the promising candidates for accelerators of Galactic cosmic rays (e.g., Berezhko, 2014). Nonthermal emissions in the X-ray and gamma-ray domains have been serving as observational probes of particles accelerated in expanding shocks of SNRs. Nonthermal X-rays detected in SNRs are almost exclusively attributed to synchrotron radiation from electrons (e.g., Koyama et al., 1995) except for a few exceptions claimed as nonthermal bremsstrahlung from sub-relativistic particles (e.g., Tanaka et al., 2018). Gamma-rays from a handful of SNRs are firmly confirmed as emission due to decay of mesons produced by interactions between accelerated protons and ambient gas (e.g., Giuliani et al., 2011; Ackermann et al., 2013). However, gamma-ray emissions detected in SNRs, including the target of the present work, RX J1713.73946, can generally be explained also by inverse Compton scattering or bremsstrahlung from accelerated electrons, which makes their emission mechanisms still controversial (e.g., Tanaka et al., 2011).
RX J1713.73946 has been regarded as one of the most important SNRs for studies on particle acceleration because of its bright X-ray and gamma-ray nonthermal radiation. The X-ray emission is dominated by synchrotron radiation (e.g., Koyama et al., 1997; Tanaka et al., 2008; Acero et al., 2009; Okuno et al., 2018) with barely detected thermal emission ascribed to reverse-shocked ejecta (Katsuda et al., 2015). The gamma-ray emission is detected in the GeV range with the Large Area Telescope onboard the Fermi Gamma-ray Space Telescope (Abdo et al., 2011; H.E.S.S. Collaboration et al., 2018) and in the TeV range with the High Energy Stereoscopic System (H.E.S.S.) (Aharonian et al., 2004, 2006, 2007; H.E.S.S. Collaboration et al., 2018). The SNR is often associated with the Chinese “guest star” in AD 393 (Wang et al., 1997) although the association is questioned by Fesen et al. (2012). From the X-ray expansion measurements of the northwestern (NW) and southeastern (SE) rims, the age is independently estimated to be , which is roughly consistent with the supernova explosion in AD 393 (Tsuji & Uchiyama, 2016; Acero et al., 2017). The mostly accepted distance to RX J1713.73946 is , deduced based on the X-ray absorption column density measured by Koyama et al. (1997) and on the distance to the molecular cloud associated with the SNR discovered by Fukui et al. (2003) in CO line data.
Fukui et al. (2012) claimed that the shock wave of RX J1713.73946 recently collided with a inhomogeneous dense gas wall created by stellar wind from the progenitor. Such dense gas serves as targets for accelerated protons in production of mesons. The TeV gamma-ray distribution in fact traces well that of molecular and atomic gas as reported by Fukui et al. (2012). Shock–cloud interaction can play another role if the cloud is not uniform but clumpy. As revealed by Inoue et al. (2012) using magnetohydrodynamic (MHD) simulations, interactions with clumpy gas deform the shock front and leave turbulent eddies behind the shock, resulting in magnetic field amplification up to . The amplified magnetic field makes the timescales for particle acceleration and synchrotron cooling shorter, probably causing the short-timescale variability of synchrotron X-rays found by Uchiyama et al. (2007). The amplified magnetic field also enhances synchrotron radiation around the clump. Sano et al. (2013) indeed showed such synchrotron X-ray enhancement, supporting the prediction by Inoue et al. (2012).
We here report on results from Chandra X-ray observations of the southwestern (SW) rim of the SNR RX J1713.73946, where dense molecular clumps are located (Fukui et al., 2012). We perform expansion measurements of the SNR shell using Chandra data taken in 2005 and 2020 in order to obtain a clear signatures of a shock–cloud interaction. Performing spectral analysis, we then discuss the effect of the interaction on particle acceleration in terms of acceleration efficiency. Quoted uncertainties indicate confidence intervals throughout the Letter.
2 Observations and Data Reduction
The first Chandra observation of the SW part of RX J1713.73946 was performed in 2005 July (Obs ID: 5561) with ACIS-I. We performed another Chandra observation of almost the same region in 2020 May after a time interval of again with ACIS-I (Obs ID: 21339). Examining the light curves, we found no significant background flares during both observations. The effective exposure times are 29.0 ks and 29.7 ks for the observations in 2005 and 2020, respectively. We reprocessed the data using the Chandra Interactive Analysis of Observations (CIAO) version 4.12 and Chandra Calibration Database (CALDB) version 4.9.1.
We aligned the data taken in 2020 to the coordinate of the data from the 2005 observation to make our expansion measurements as accurate as possible. We detected point sources in the field-of-views of the observations with the wavdetect tool in CIAO. Cross-matching nine sources detected, we computed a transformation matrix describing translation, rotation, and scaling with wcs_match in CIAO. We then reprojected the events file from 2005 using wcs_update.

3 Analysis and Results
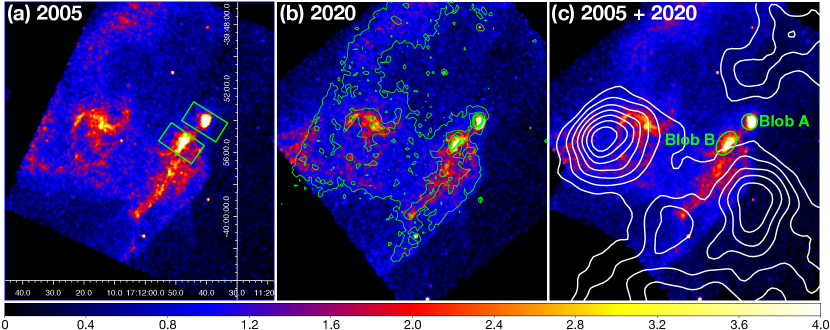
Figure 1 presents 0.7–7 keV exposure-corrected images of the SW region of RX J1713.73946 as observed with Chandra ACIS-I in 2005 and 2020. Also shown is the sum of the two images. Comparing the two images from 2005 and 2020, one can clearly see the expansion of the shell during the 15-yr time interval. As illustrated in Figure 1(c), a molecular clump is detected through CO, CS, HC3N, and SiO line observations just outside the western edge (Fukui et al., 2003; Moriguchi et al., 2005; Sano et al., 2010, 2013, 2015; Fukui et al., 2012; Maxted et al., 2012). If the shock is actually interacting with the molecular gas, the shock velocity would be substantially lower than those measured in other locations of the SNR by Tsuji & Uchiyama (2016) and Acero et al. (2017).
In what follows, we focus on the two bright blobs, Blobs A and B (Figure 1(c)), at the western edge of the shell. In Figure 2(a) and (b), we plot projected profiles of the blobs along the regions shown in Figure 1(a). The rotation angles of the regions were selected so that they roughly accord with the directions of the proper motions. The expansion is again visible for both blobs. Blob B appears to have a lower shock velocity than Blob A. We quantified the velocities by comparing the profiles obtained in the two epochs. We artificially shifted the profile in 2020 and searched for a shift that gives the best match with the profile in 2005 in terms of defined as
| (1) |
where in the index for bins of the profile histograms, and are fluxes in bin , and and are their statistical errors. We did not limit the shift to an integer multiple of the bin width, . We rebinned the shifted profile with the same bins as the histogram for the profile in 2005 assuming that the profile is uniform inside each bin. Figure 2(c) is the profiles obtained for the blobs. We fitted it with a quadratic function and obtained a velocity that gives the minimum . A velocity range that satisfies is quoted as a confidence region. The resultant angular velocities are and for Blobs A and B, respectively. If the distance to RX J1713.73946 is , they are translated to velocities of and . The velocity of Blob B is indeed significantly slower than that of Blob A.
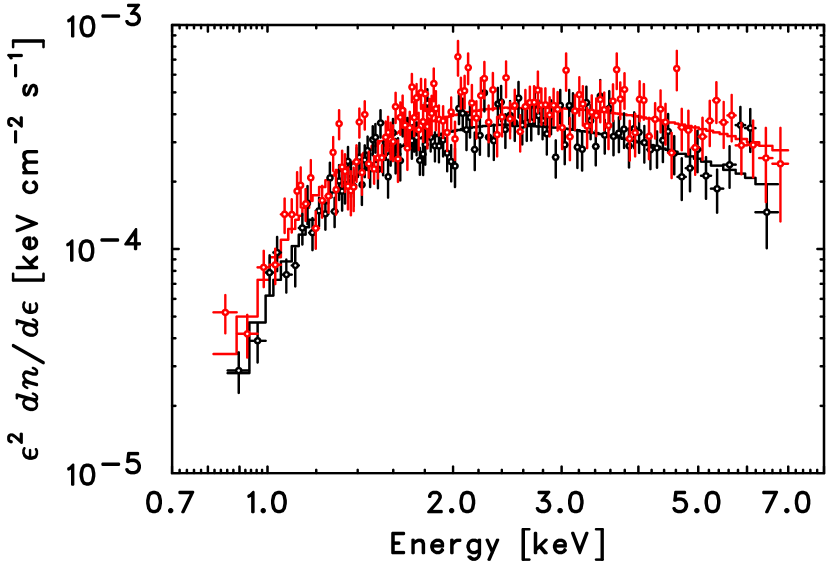
We also analyzed spectra of the two blobs extracted from the regions indicated in Figure 1(c). Since we did not see any significant differences between the spectra from 2005 and 2020, we combined those from the two epochs for each blob. The background spectra were extracted from off-source regions in the same field-of-views. We plot the background-subtracted spectra in Figure 3. In the following spectral fittings, we used XSPEC version 12.10.0 (Arnaud, 1996) with the solar abundance table based on the result by Wilms et al. (2000). We modeled the interstellar absorption with the Tuebingen-Boulder model (TBabs; Wilms et al. 2000) implemented in XSPEC. The minimum statistic was used for the spectral fittings. The spectra were binned so that each bin has at least 30 counts.
We first fitted the spectra with a phenomenological model, a power law modified by interstellar absorption, which we refer to as PL. Table 1 summarizes the results, which agree well with those by Okuno et al. (2018) analyzing the data from 2005. We tried another set of spectral fittings by replacing the power law with a more physically oriented model taken from Zirakashvili & Aharonian (2007), who gave analytical descriptions of synchrotron radiation spectra under the assumption that electron energy losses are dominated by synchrotron cooling. We adopt here their formula for synchrotron spectra produced downstream of the shock with the downstream magnetic field stronger than upstream by a factor of , namely,
| (2) |
where denotes the photon energy and is the cutoff energy. Note that the actual cutoff is located at as pointed out by Zirakashvili & Aharonian (2007). The results with this model are again summarized in Table 1, where we call the model ZA07. Blob B has a higher cutoff energy as is expected from its harder spectrum.
| Region | Model | aaEquivalent hydrogen column density. | bbPhoton index. | ccfootnotemark: | d.o.f | ||
|---|---|---|---|---|---|---|---|
| () | (keV) | () | |||||
| Blob A | PL | 109.7 | 109 | ||||
| Blob B | PL | 141.0 | 117 | ||||
| Blob A | ZA07 | 107.7 | 109 | ||||
| Blob B | ZA07 | 138.7 | 117 |
4 Discussion
We measured the proper motions of the two bright blobs in the SW rim of RX J1713.73946. The proper motion velocities cannot necessarily be regarded as shock velocities because of possible line-of-sight velocities. Blob A is at the very edge of the SNR, and thus the measured velocity of would safely be taken as the shock velocity () of the region. Blob B, on the other hand, appears located inward from the edge of the faint diffuse emission extending beyond the bright structures (Figure 1). Given the radius of the remnant , (see, e.g., Acero et al. 2009 for an X-ray image of the whole SNR), we can infer that the actual shock velocity of Blob B would be a factor of larger than the proper motion, or , assuming a spherical expansion. Since this projection effect is small and the relevant assumptions should have some uncertainties, we treat the measured velocity as also for Blob B. Note that this does not substantially affect the following discussion.
The two regions we studied have significantly different shock velocities in spite of their proximity. A clue to understanding it can be found in the distribution of the interstellar gas shown in Figure 1(c). Blob A has no noticeable cloud nearby while the shell structure including Blob B seems in contact with the molecular clump. A plausible explanation of the velocity difference is that Blob B collided with the clump at some point of the SNR evolution and was decelerated. Further supporting this scenario is the morphology in which Blob B is trailing Blob A. Then, the present work has provided the most direct evidence ever that the shock of RX J1713.73946 is indeed interacting with the cloud found in radio observations (Fukui et al., 2003; Moriguchi et al., 2005; Sano et al., 2010, 2013, 2015; Fukui et al., 2012; Maxted et al., 2012).
From the shock velocities, we can estimate when the shock started to interact with the molecular cloud. Blob A was running ahead of Blob B by , corresponding to at a distance of , at the point of the observation in 2020 (Figure 1). Since the velocity difference between the two blobs is , the two blobs were located at the same radius of the SNR under an assumption that the velocities have been almost constant during the time interval. This would give the first-order estimate of the epoch when the shock in the Blob-B region encountered the molecular clump. Our estimate is roughly consistent with the suggestion by Fukui et al. (2012) that the forward shock of RX J1713.73946 expanded almost freely in a cavity in the early phase of its evolution and collided with a dense gas wall swept up by the stellar wind from the progenitor a few ago.
When the shock collided with the gas wall ago, the distance between the central compact object 1WGA J1713.43946 and the blobs would have been (at a distance of 1 kpc), which would correspond to the radius of the wind-blown bubble. According to Chevalier (1999), a star with a main-sequence mass of is capable of creating a bubble with such a radius. The mass agrees well with the estimate based on elemental abundances of the supernova ejecta by Katsuda et al. (2015). From an interacting shock, one may expect forbidden lines from low ionized ions in the optical and infrared bands. However, these lines become bright only after the shock enters the radiative phase (Lee et al., 2015), and thus we cannot expect them in the present case where the shock collided with dense gas recently.
It would be worth pointing out that the velocity of Blob A (), which does not seem to be interacting with dense gas, is comparable to in the NW reported by Tsuji & Uchiyama (2016) and also to in the SE measured by Acero et al. (2017). Using the shock velocities in the NW and SE, the authors performed hydrodynamical analysis of the SNR evolution and reached conclusions that the age of the SNR is within a range of . The present result supports their conclusions about the age with a similar velocity measured for Blob A. A question here is why only the shock velocity in the Blob B is significantly decelerated although the shocks in NW and SE are suggested to be interacting with dense gas as well (e.g., Fukui et al., 2012; Sano et al., 2013, 2015). One of the possible answers would be that the shock in the Blob-B region is interacting with denser gas than the shocks in other regions. The gas distribution map by Fukui et al. (2012) in fact indicates a higher gas density in the SW, supporting our hypothesis.
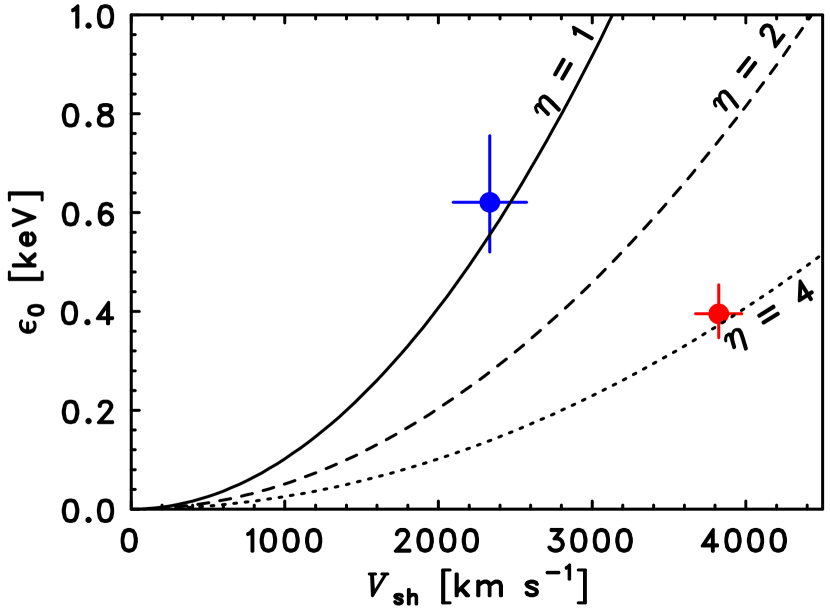
An interesting finding in our spectral analysis is that Blob B has a harder spectrum than Blob A despite the slower shock velocity. The X-ray band corresponds to the cutoff region of the synchrotron spectrum. Thus, a harder spectrum implies a higher cutoff energy as demonstrated in the results from the spectral fittings with the ZA07 model (Table 1). When the electron maximum energy is limited by synchrotron cooling, the cutoff appears at an energy where the synchrotron cooling timescale is equal to the acceleration timescale. According to Zirakashvili & Aharonian (2007), the synchrotron cutoff energy is expressed as
| (3) |
where is the gyrofactor. The equation is for , the same as Equation (2). We can compute in the two blobs by substituting and of Equation (3) with the values obtained in §3. We obtain and for Blobs A and B, respectively. In Figure 4, we plot against together with equi- curves. Particle acceleration in both blobs is close to the Bohm limit (), similarly to the results based on spectra extracted from much larger regions (Uchiyama et al., 2007; Tanaka et al., 2008) and from another location of the SNR, NW (Tsuji et al., 2019). Blob B has a gyrofactor almost at the limit, with which particle acceleration proceeds at the fastest possible rate.
It is often supposed that a higher shock velocity makes diffusive shock acceleration more efficient. On the contrary, our result implies that Blob B, which is interacting with the dense molecular clump and has a lower shock velocity, has a smaller and thus is accelerating particles more efficiently. The gyrofactor is related to the turbulence in the magnetic field as , where is the strength of the static magnetic field and is the turbulence level. It seems that magnetic turbulence is somehow induced by the shock–cloud interaction in Blob B. The MHD simulations by Inoue et al. (2012) indicate that, when a shock interacts with clumpy gas, turbulence is generated and the magnetic field is amplified around clumps. This is also supported by the results from MHD simulations by Celli et al. (2019). Sano et al. (2013) and Sano et al. (2015) compared distribution of synchrotron X-rays of RX J1713.73946 with gas distribution and claimed that the mechanism proposed by Inoue et al. (2012) is at work in this SNR. The same mechanism may be able to explain the efficient particle acceleration in Blob B.
Although we so far assumed implicitly that particles are accelerated at the forward shock, it would be possible that particles are reaccelerated at reflected shocks generated due to the shock–cloud interaction. In the downstream region where reflected shocks propagate, magnetic turbulence is enhanced by the mechanism mentioned above. Therefore, fast particle acceleration is possible in reflected shocks (Inoue et al., 2012). It would be possible that at least a part of the synchrotron X-rays from Blob B is emitted by electrons in reflected shocks. To further discuss the possibility of such a scenario, it would be essential to reveal the distribution of the gas in this region with superior angular resolution through observations by, e.g, the Atacama Large Millimeter/submillimeter Array.
References
- Abdo et al. (2011) Abdo, A. A., Ackermann, M., Ajello, M., et al. 2011, ApJ, 734, 28
- Acero et al. (2017) Acero, F., Katsuda, S., Ballet, J., et al. 2017, A&A, 597, A106
- Acero et al. (2009) Acero, F., Ballet, J., Decourchelle, A., et al. 2009, A&A, 505, 157
- Ackermann et al. (2013) Ackermann, M., Ajello, M., Allafort, A., et al. 2013, Science, 339, 807
- Aharonian et al. (2007) Aharonian, F., Akhperjanian, A. G., Bazer-Bachi, A. R., et al. 2007, A&A, 464, 235
- Aharonian et al. (2006) Aharonian, F., Akhperjanian, A. G., Bazer-Bachi, A. R., et al. 2006, A&A, 449, 223
- Aharonian et al. (2004) Aharonian, F. A., Akhperjanian, A. G., Aye, K.-M., et al. 2004, Nature, 432, 75
- Arnaud (1996) Arnaud, K. A. 1996, adass V, 101, 17
- Berezhko (2014) Berezhko, E. G. 2014, Nuclear Physics B Proceedings Supplements, 256, 23
- Celli et al. (2019) Celli, S., Morlino, G., Gabici, S., et al. 2019, MNRAS, 487, 3199
- Chevalier (1999) Chevalier, R. A. 1999, ApJ, 511, 798
- Fesen et al. (2012) Fesen, R. A., Kremer, R., Patnaude, D., et al. 2012, AJ, 143, 27
- Fukui et al. (2012) Fukui, Y., Sano, H., Sato, J., et al. 2012, ApJ, 746, 82
- Fukui et al. (2003) Fukui, Y., Moriguchi, Y., Tamura, K., et al. 2003, PASJ, 55, L61
- Giuliani et al. (2011) Giuliani, A., Cardillo, M., Tavani, M., et al. 2011, ApJ, 742, L30
- H.E.S.S. Collaboration et al. (2018) H.E.S.S. Collaboration, Abdalla, H., Abramowski, A., et al. 2018, A&A, 612, A6
- Inoue et al. (2012) Inoue, T., Yamazaki, R., Inutsuka, S., et al. 2012, ApJ, 744, 71
- Katsuda et al. (2015) Katsuda, S., Acero, F., Tominaga, N., et al. 2015, ApJ, 814, 29
- Koyama et al. (1997) Koyama, K., Kinugasa, K., Matsuzaki, K., et al. 1997, PASJ, 49, L7
- Koyama et al. (1995) Koyama, K., Petre, R., Gotthelf, E. V., et al. 1995, Nature, 378, 255
- Lee et al. (2015) Lee, S.-H., Patnaude, D. J., Raymond, J. C., et al. 2015, ApJ, 806, 71
- Maxted et al. (2012) Maxted, N. I., Rowell, G. P., Dawson, B. R., et al. 2012, MNRAS, 422, 2230
- Moriguchi et al. (2005) Moriguchi, Y., Tamura, K., Tawara, Y., et al. 2005, ApJ, 631, 947
- Okuno et al. (2018) Okuno, T., Tanaka, T., Uchida, H., et al. 2018, PASJ, 70, 77
- Sano et al. (2015) Sano, H., Fukuda, T., Yoshiike, S., et al. 2015, ApJ, 799, 175
- Sano et al. (2013) Sano, H., Tanaka, T., Torii, K., et al. 2013, ApJ, 778, 59
- Sano et al. (2010) Sano, H., Sato, J., Horachi, H., et al. 2010, ApJ, 724, 59
- Tanaka et al. (2018) Tanaka, T., Yamaguchi, H., Wik, D. R., et al. 2018, ApJ, 866, L26
- Tanaka et al. (2011) Tanaka, T., Allafort, A., Ballet, J., et al. 2011, ApJ, 740, L51
- Tanaka et al. (2008) Tanaka, T., Uchiyama, Y., Aharonian, F. A., et al. 2008, ApJ, 685, 988
- Tsuji et al. (2019) Tsuji, N., Uchiyama, Y., Aharonian, F., et al. 2019, ApJ, 877, 96
- Tsuji & Uchiyama (2016) Tsuji, N., & Uchiyama, Y. 2016, PASJ, 68, 108
- Uchiyama et al. (2007) Uchiyama, Y., Aharonian, F. A., Tanaka, T., et al. 2007, Nature, 449, 576
- Wang et al. (1997) Wang, Z. R., Qu, Q.-Y., & Chen, Y. 1997, A&A, 318, L59
- Wilms et al. (2000) Wilms, J., Allen, A., & McCray, R. 2000, ApJ, 542, 914
- Zirakashvili & Aharonian (2007) Zirakashvili, V. N., & Aharonian, F. 2007, A&A, 465, 695