Modelling the Impact of Screening Men for Chlamydia Trachomatis on the Prevalence in Women
Abstract
Background
Chlamydia trachomatis is the most commonly reported infectious disease in the United States and causes important reproductive morbidity in women. The Centers for Disease Control and Prevention have recommended routine screening of sexually active women under age 25 but have not recommended screening among men. Consequently, untested and untreated men may serve as a reservoir of infection in women. Despite three decades of screening women, the chlamydia prevalence has continued to increase. Moreover, chlamydia is five times more common in African American (AA) youth compared to Whites, constituting an important health disparity.
Methods
The Check It program is a bundled Ct intervention targeting AA men aged 15-24 who have sex with women. We created an individual-based network model to simulate a realistic chlamydia epidemic on sexual contact networks for the target population. Based on the practice in Check It, we quantified the impact of screening young AA men on the chlamydia prevalence in women.
Findings
We used sensitivity analysis to quantify the relative importance of each Check It intervention component, and the significance ranked from high to low was venue-based screening, expedited index treatment, expedited partner treatment, rescreening. We estimated that by annually screening of the target male population, the chlamydia prevalence would be reduced by and in men and women, respectively.
Interpretation
The findings suggested that male-screening has the potential to significantly reduce the prevalence among women.
Funding
National Institutes of Health, National Institute of Child Health and Human Development, Tulane University.
Research in context
Evidence before this study
Chlamydia trachomatis is the most commonly reported infectious disease in the US. Women more commonly experience severe sequelae, such as infertility, pelvic inflammatory disease, and ectopic pregnancy. For three decades, the Centers for Disease Control and Prevention (CDC) have recommended routine screening of sexually active women years old, together with providing her and her partner(s) with treatment and rescreening, as part of preventive healthcare. However, the prevalence has continued to rise. In 2018, there were about million cases reported to the CDC, and the rate has increased by 19% since 2014. Recommendations of routine screening don’t exist for men in the US, who may serve as a reservoir of infection in women, and few efforts have been made to evaluate the potential impact of male-screening on prevalence in women.
Most chlamydia simulation studies use differential equation-based compartmental models. These models cannot capture the complex assortative mixing in sexual partnership networks. The structure of the sexual network affects the spread of the infection and the effectiveness of the mitigation efforts.
Added value of this study
Our stochastic, heterosexual, and individual-based model provided a framework for a public health team to answer “what if” questions that are hard to address in the field. Our model simulated the spread of chlamydia through dynamic sexual networks that were embedded in a social contact network. The sexual networks were generated from survey data sets and captured the sexual behaviour among an assortative mixing population in New Orleans. We first simulated the current chlamydia epidemic under the baseline healthcare interventions, including routine screening in women and treatment for symptomatic cases in men and women during clinic visits. We then assessed the impact of a new male-screening bundled strategy, including expedited index treatment, expedited partner treatment, and rescreening, on the current chlamydia prevalence in women. To our knowledge, our study is the first modelling analysis to investigate this intervention strategy in this population cohort.
Implications of all the available evidence
Our modelling study confirmed that the present screening activities for women alone cannot control the current chlamydia epidemic. The results suggested that adding the male-screening with the expedited index and partner treatment has the potential to significantly reduce the chlamydia prevalence among women. Our findings also show that expedited partner treatment becomes more effective in reducing the chlamydia prevalence in women as the coverage of male-screening increases.
1 Introduction
1.1 Chlamydia and current screening policy
Chlamydia trachomatis (Ct) is the most commonly reported infectious disease in the US, with about million cases each year 1. It is a major cause of infertility, pelvic inflammatory disease, and ectopic pregnancy among women 2 and has been associated with increased HIV acquisition 3. Because women experience the most severe sequelae, the focus of Ct prevention in the US has been on screening sexually active women 25 years old, providing her and her partner(s) with treatment and rescreening.
There is no recommendation for Ct screening among men in the US. In 2007, an expert panel at the Centers for Disease Control and Prevention (CDC) concluded that the evidence is not sufficient to recommend routine screening for Ct in sexually active young men 4. The conclusion was based on the Ct prevalence in 2007 and the feasibility, efficacy, and cost-effectiveness of screening men. However, since then, evidence of the benefit of screening young men for Ct in high prevalence areas has been mounting. More recent studies show that screening men can be cost-effective 5 and significantly reduce Ct prevalence in women 6.
1.2 Check It program and intervention strategies
The community-based program “Check It” 7 targets African American (AA) men aged 15-24 in New Orleans. The core of this intervention is Ct screening for men, and we hypothesise that men are an important reservoir of infection for women and need to be targeted for intervention 7. The Check It program bundles several key Ct prevention strategies:
-
-
Venue-based screening (VBS) by recruiting participants at non-clinical community venues, such as barbershops, colleges, and universities, in high-prevalence neighbourhoods characterised by similar demographic and geographic factors. This venue-based enrolment is enhanced with marketing strategies, such as the distribution of flyers, web education, social media, and informational cards.
-
-
Expedited treatment by providing treatments for the Ct+ men (or index) (expedited index treatment or EIT) and his sexual partner(s) (EPT) via partnering community pharmacies without a medical examination to speed up treating his sexual partners and reduce reinfection rates in the index.
-
-
Rescreening, where Ct+ men are retested for infection three months after treatment.
-
-
Social network peer referral (SNPR) that encourages men to refer young AA men in their social network to Check It via flyers, social media, or text messages to promote the program and increase the total enrolment.
1.3 Mathematical modelling
Mathematical models create frameworks for understanding the underlying epidemiology of disease and help test the potential effectiveness of different approaches to bring the epidemic under control. Our modelling effort created a detailed simulation to model the specific practices implemented by Check It program. The model predicted the impact of Check It on mitigating the Ct epidemic among AA women by screening young AA men at different intervention intensities.
2 Methods
We used a stochastic agent-based model to simulate the transmission of Ct among the 15-24-year-old AA New Orleans population and quantify the impact of the Check It program on the Ct prevalence in women.
We first generated dynamic heterosexual networks of a synthetic population, which were embedded in a grand social contact network (section 2.1). We then modelled the Ct transmission pathways through these sexual networks (section 2.2). The model kept track of the infection status and sexual behaviour for each individual in the population. The generated dynamic sexual networks are based on the data from two survey studies 7, 8 that investigated the sexual behaviour of the men and women targeted for the study.
We then modelled the intervention strategies, including both the standard preventive healthcare for women and the Check It intervention (section 2.3), for each individual to study the impact of male-screening on the Ct prevalence in women.
2.1 Generation of a synthetic population over dynamic sexual networks
Similar to the approach in Azizi et al. 9, we constructed a closed 5000-member synthetic population, where the heterosexual partnerships were represented by bipartite sexual networks. The heterosexual networks reflected the assortative mixing pattern among our targeted population by matching the population-level quantities from two surveys in New Orleans: the ongoing Check It study 7 and the “You Geaux Girl!” (YGG) study 8, which enrolled 1318 AA men (as of April 2019, age-range 15-24) and 649 AA women (age range 18-19), respectively.
We categorised one’s partner into either a primary partner or a casual partner. The distributions of primary and casual partnerships were based on the survey answers (detailed criteria in section A.1.2). These heterosexual partnerships can be asymmetric: A is B’s primary partner, but B may be A’s casual partner. Thus, this approach results in three types of partnerships: primary-primary, primary-casual, and casual-casual partnership.
When modelling the epidemics over a long time, we updated the sexual partner(s) every two months (the time-frame covered by the Check It survey). This created a series of dynamic sexual networks. To simulate a realistic partner updating behaviour, these sexual networks are embedded in a grand social contact network for 150,000 people in New Orleans generated by the Simfrastructure agent-based modelling and simulation system 10. During the updating process, the primary-primary partnerships were preserved throughout the simulations, and we updated one’s casual sexual partner(s) through his/her social connections in the closed 5000 synthetic population. Specifically, half of the primary-casual and all the casual-casual partnerships are replaced by one’s social contacts from the background social network every two months. Overall, we maintained the same 5000 population, and approximately 80% of the partnerships were from one’s heterosexual social network, in agreement with the Check It data.
We give additional details on the generation of the dynamic sexual networks embedded in the social network in section A.1.
2.2 Chlamydia epidemic on dynamic sexual networks
We modelled the infection status of each individual using the Susceptible-Infectious-Susceptible (SIS) framework. All uninfected individuals are susceptible to being infected, and all infected people recover to this susceptible state after either spontaneous recovery or treatment. A susceptible individual can be infected by his/her infectious partner. The force of infection is the probability (per day) that a susceptible will be infected. This probability was estimated by considering risk factors of how many partners the person has, the type of partnership with each partner, the probability of having sexual contact per partner per day, and the probability of using a condom.
We estimated the sexual contact rates for the primary and casual partnerships from the datasets (table A.3). We observed that the contact rate was higher for primary partnerships than for casual partnerships, and there was a decreasing trend in the per partner contact rate when the number of partners increases. Moreover, the datasets gave a higher probability of using a condom with a casual partner than with the primary one (table 2.1). We introduced a condom failure rate to include cases when the condom is not used properly.
The details on the model configuration are fully described in section A.2.
2.3 Modelling the intervention strategies
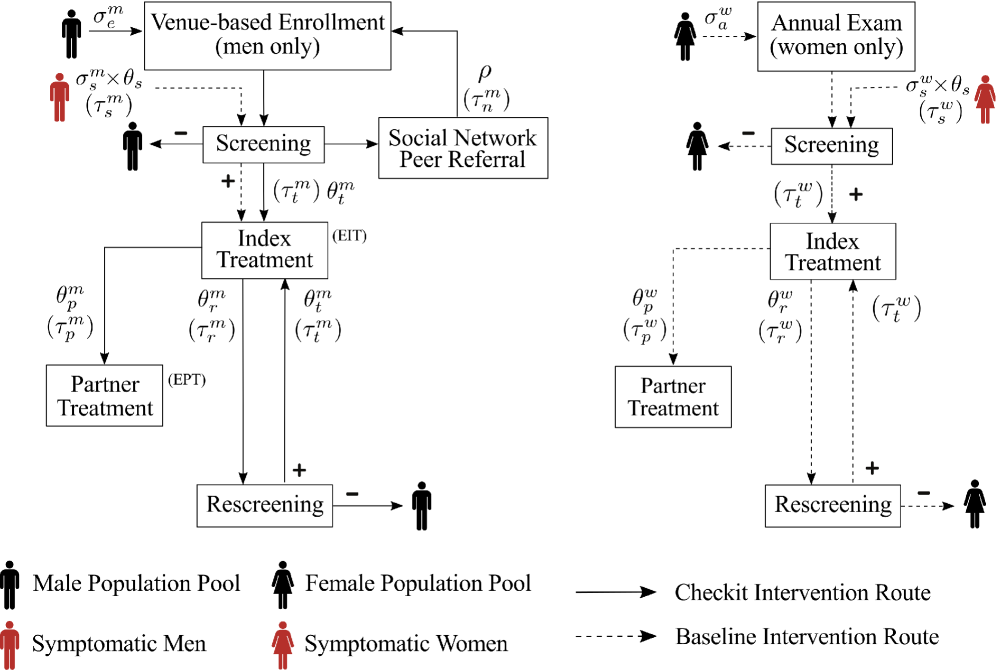
Our goal is to investigate the net impact of screening men through the Check It program given the existing screening policy for women and the ongoing endemic Ct epidemic. To this end, we outlined the intervention strategies for both women and men in separate flow charts in fig. 2.1. We used solid lines to illustrate the Check It intervention approaches and the dashed lines to represent the current healthcare interventions. The baseline scenario accounts for the Ct screenings completed at women’s annual exams as part of regular preventive healthcare. We also included the Ct screenings prompted by symptomatic infections (clinical visits) in the baseline scenario for both men and women.
2.3.1 Existing intervention strategies
The current (baseline) Ct mitigation efforts for women (the right side of fig. 2.1) include Ct screening during the routine annual exams and clinical visits for symptomatic infections. The model assumed that the same fraction () of women return for a physical exam each year. Symptoms can appear in a small fraction of infected women (), and we assumed that a fraction of these women get medical care within an average of days, including incubation period and appointment scheduling process, after infection 11. After the diagnostic test, we assumed that all the positive cases get index treatment in an average of days. Moreover, the CDC recommends doing EPT for the infected women by providing treatment to the patient to bring to her partner(s) without first examining the partner(s) 12. We assumed that a fraction of the partners are treated with an average delay of days. The EPT fraction is the product of (1) the fraction of the physicians practising the EPT as recommended and (2) the fraction of compliance from the notified partners. Last, women diagnosed with the Ct infection should be retested after the initial treatment 13. Thus, we assumed a fraction of treated women are retested for infection days after the initial treatment.
Since routine male-screening is not recommended and is rarely practiced 14, we only account for screenings prompted from symptomatic infections. Similar to the process in women, we assumed that there are a small fraction () of infected men that develop symptomatic Ct infections, and, with a delay of days, a fraction of them get screening and treatment. Moreover, follow-up interventions, such as partner treatment or rescreening after the index treatment, are hardly implemented in clinics for men 14. Therefore, follow-up interventions for men were not included in the model.
2.3.2 Check It intervention strategies
The Check It program recruited participants in community venues, including community colleges, historically black colleges and universities, barbershops, and other community-based organisations. This venue-based enrolment is enhanced with the marketing strategies (distribution of flyers, web education, social media, and informational cards) and enrols a fraction of the target male population for Ct screenings.
Among this venue-based enrolment, some participants learn about the program through their social networks, such as text messages and information cards sent by friends or word-of-mouth. We combined such peer impact as an SNPR and included it as a source of enrolment. On average, the proportion between the non-peer enrolled men and peer-recruited men is , and we assumed that peer-referred men are enrolled in the program with an average delay of days.
We modelled the non-peer enrolment process as a random sampling from the entire male population. Meanwhile, we modelled the peer-referred enrolment (SNPR) by searching the background social network of each non-peer enrolled man and randomly sampling among the eligible candidates.
The rest of the intervention practice was modelled similarly to women’s case: a fraction of the screened and infected men receive EIT after a delay of days. A fraction of these men’s partners receive EPT with a delay of days. Finally, a fraction of the index men return for rescreening days after the initial infection. If the rescreened men are infected with Ct, then they are treated as index cases, and the intervention process is repeated.
The section A.2 and section A.4 provide more details on the modelling.
2.4 Model calibration and parameters
We distributed the initial infections in the population consistent with the distribution of an emerging epidemic. We obtained this quasi-steady-state balanced initial condition by starting a small epidemic in the past and letting it grow to the current (pre-Check It) Ct endemic state (see section A.3). This initialization process considered the existing (baseline) combination of Ct interventions (dashed routes in fig. 2.1) to give a comprehensive approximation of the current Ct control before the launch of Check It.
The model parameters used in the simulations (table 2.1) represent our best knowledge of the current epidemic. The parameters for the Ct transmission probabilities per sexual contact between men and women ( and ) are only known with large uncertainty. We used these as tuning parameters to calibrate the model so that the initial balanced condition matched the current Ct prevalence in New Orleans among the target population ( in men and in women among 15-24-year-old AA young adults 15).
Approximately half of the Ct infections are cleared naturally by the first year after being infected and are cleared after two years. We fitted an exponential distribution for the average time of natural recovery days to the data from Molano et al. 16. We assumed the recovery time with treatment also follows an exponential distribution in days.
2.5 Sensitivity analysis
The model parameters in table 2.1 represent the best-guess estimates for practical scenarios, and we used sensitivity analysis to quantify the most significant model parameters 17. To check the impact of each component of the Check It intervention bundle one-at-a-time, we varied each intervention parameter (the parameter of interest or POI), while fixing the other parameters. We then checked its corresponding impact on the Ct prevalence for women, men, and the overall population (the quantities of interest or QOIs).
We defined the normalised relative sensitivity index (SI) of a QOI, , with respect to the POI, p, as = . This SI, , measures the percentage change in the QOI given the percentage change in an input POI. If parameter changes by , then quantity changes by .
To further investigate the synergistic effect of the intervention components beyond the current levels, which could be limited by the protocols and available resources of Check It, we conducted the global sensitivity analysis by varying two intervention parameters together while fixing all other parameters. We then predicted the impact under different combinations of intervention parameters.
2.6 Role of the funding source
The funders had no role in study design, data collection, data analysis, data interpretation, or writing of the report. The corresponding author had full access to all the data in the study and had final responsibility for the decision to submit for publication.
| Description | Base. | Range | Reference | |
| Transmissibility from men to women per contact | - * |
Kretzschmar et al. 18,
Turner et al. 19 |
||
| Transmissibility from women to men per contact | - * |
Kretzschmar et al. 18,
Turner et al. 19 |
||
| Average time to recovery without treatment (years) | exponential | Molano et al. 16 | ||
| Average time to recovery after treatment (days) | 7 | exponential | Martin et al. 20 | |
| Fraction of condom use for primary partners | Check It 7 | |||
| Fraction of condom use for casual partners | Check It 7 | |||
| Condom failure rate | Trussell 21 | |||
| Fraction of symptomatic infections screened | - | Farley et al. 11 | ||
| Time lag in screening for symptomatic infection (days) | 21 | 14 - 28 | CDC22 | |
| Women’s intervention parameters | ||||
| Fraction of the target women who are screened annually | - |
Wiehe et al. 23,
Hoover et al. 24 |
||
| Fraction of symptomatic infection in women | Farley et al. 11 | |||
| Fraction of partner treatment for index women | Derived | |||
| - Fraction of physicians practicing partner treatment | - | Hogben et al. 25 | ||
| - Fraction of compliance for partner treatment | - |
Golden et al. 26,
Schillinger et al. 27 |
||
| Fraction of treated women who are rescreened | - | Xu et al. 28 | ||
| Time lag in treatment for screened women (days) | 2 | RelayHealth 29 | ||
| Time lag in partner treatment for treated women (days) | 6 | 0 - 15 | Golden et al. 26 | |
| Time lag in rescreening for treated women (days) | 105 | 80 - 130 | CDC13, Xu et al. 28 | |
| Men’s intervention parameters | ||||
| Fraction of target population enrolled per year | Check It 7 | |||
| - Fraction of non-peer VBS-enrolment | Check It 7 | |||
| - Fraction of SNPR enrolment | Check It 7 | |||
| Number of peer-recruited men per VBS-enrolled man | Derived | |||
| Fraction of symptomatic Ct infection in men | Farley et al. 11 | |||
| Fraction of screened positive men treated (EIT) | - | Check It 7 | ||
| Fraction of partner treatment for index men (EPT) | - | Check It 7 | ||
| Fraction of treated men with rescreening (%) | - | Check It 7 | ||
| Time lag in treatment for screened men (days) | 12 | Check It 7 | ||
| Time lag in screening for men enrolled via SNPR (days) | 7 | Assume | ||
| Time lag in partner treatment for treated men (days) | 2 | Check It 7 | ||
| Time lag in rescreening for treated men (days) | 102 | Check It 7 |
-
*
Values come from mathematical modelling papers where the transmission rates were estimated by least square fitting to the corresponding Ct prevalence data (% in men, % in women).
3 Results
3.1 Impact of Check It at existing intervention level
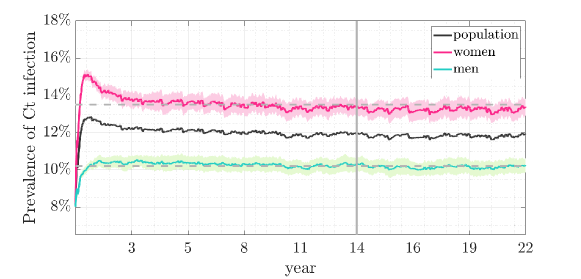
We quantified the impact of Check It mitigation at the current level of intervention intensity (shown in table 2.1). Figure 3.2 shows the change in Ct prevalence in both men and women after the launch of the Check It screening for men at year zero with a balanced initial condition (section A.3). With the male-screening Check It intervention, the Ct epidemic is controlled at a much lower prevalence.
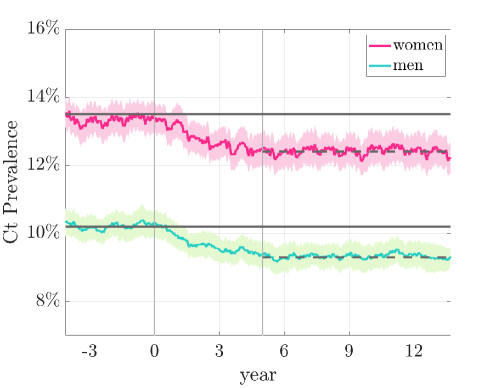
In fact, near the quasi-steady state (around year five in fig. 3.2), our model predicts the following annual statistics from the program. Here shown with modelling scale followed by the target population in New Orleans in parentheses. The modelling scale is 5000 people, including 2304 men and 2696 women, and the target population (age range 15-24, sexually active) in New Orleans is 29,600 people, including 16,181 men and 13,419 women:
-
-
Each year, the program conducts in total 175 (1229) screenings, including 42 (295) from peer-recruited participants, and achieves 12 (84) treatments for index men (EIT) and 8 (56) treatment for partners of men (EPT).
-
-
Among all the screened men found to be Ct+, the average number of partners within the past two months is (median = 2).
-
-
Compared to the scenario without Check It, the program prevents 13 (91) cases in men and 41 (204) cases in women per year.
-
-
Roughly, for each man screened, it could prevent case in men and case in women.
3.2 Significance of the components of the intervention
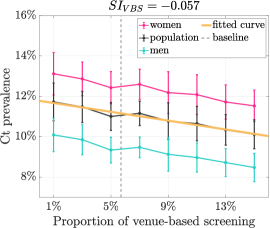
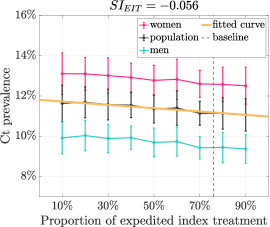
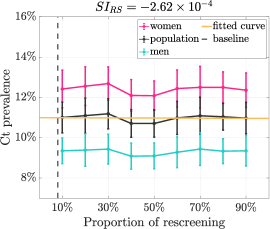
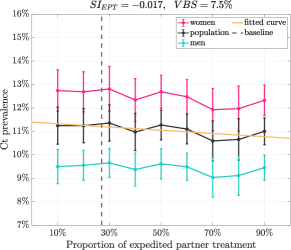
The sensitivity analysis identified the significant components in the intervention program. In the results presented below, we have considered the QOI to be Ct prevalence and omit the upper index for the simplicity of the presentation.
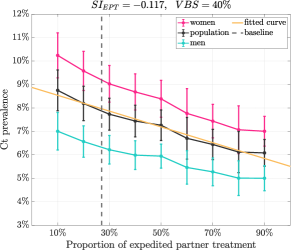
From fig. 3.3 and fig. 3.4 (left), the Ct prevalence have an almost linear response to the intervention parameters, and the sensitivity at the current level of Check It intensity is ranked as VBS EIT EPT rescreening. Moreover, when increasing the coverage of VBS from to (fig. 3.4), the magnitude of the corresponding SI for EPT becomes times larger ( vs. ), which suggests that EPT would be more effective in reducing the prevalence when having a high male-screening coverage.
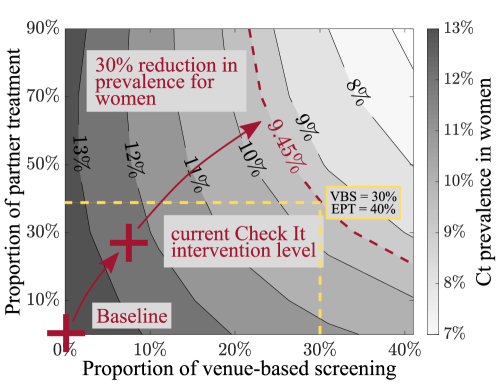
We then conducted the global sensitivity analysis using the two most significant parameters from the local sensitivity analysis: VBS and EPT. The response plot for women’s Ct prevalence (fig. 3.5) shows that the male-screening strategy has the potential to reduce the Ct prevalence in women substantially, and it predicts the effectiveness under different combinations of intervention intensities. For example, the model estimates the combination of VBS of the target men and EPT of their partners will give a reduction in Ct prevalence among women.
4 Discussion
Our model provided a framework for a public health team to ask “what if” questions that are hard to evaluate in the field. Findings of our analysis suggest that, in addition to the current female-screening intervention, the male-screening intervention, in conjunction with the EPT and rescreening, has the potential to mitigate the Ct prevalence among women. We estimated that by annually screening of the target male population (AA, sexually active young men, ageing 15 - 24), under the current implementation of Check It program, the Ct prevalence is reduced by and in men and women, respectively. Our findings also show that as the coverage of male-screening increases, the EPT becomes more effective in reducing the Ct prevalence in women.
We aimed to consider a comprehensive picture of the current Ct epidemic and control scenario, but we also recognised that mathematical models are a simplistic representation of the real world. The uncertainty and bias in the model parameters and model assumptions can affect the reliability of the quantitative predictions. Still, in our investigations, we found that the relative ranking of the responses in the sensitivity analysis and the trend in prediction pattern is robust and insensitive.
Many of our model limitations are associated with the scope of the survey data sets collected from the target population. We described the sexual behaviour in this particular population through the sexual networks that are generated based on the survey data of Check It and YGG in New Orleans. As detailed in section A.1.1, we matched the degree distribution and degree-degree distribution in the obtained sexual networks, which corresponds to a highly sexually active and high-risk population. We also considered the assortative mixing of partnerships on demographic traits, such as age, ethnicity, social groups, economic status, and geographic location, by embedding all the sexual networks in a grand social network, which describes the daily activities of residents in New Orleans.
Although these data sets are from New Orleans, in many ways, they represent similar cities that have high Ct rates (urban, southern, and largely impoverished AA community). The same model could be applied for Ct transmission in other populations by adjusting sexual network and model parameters. The quantitative results obtained in this study can only be interpreted for other cities after carefully examining the differences between sexual behaviour and assortative mixing patterns in two populations.
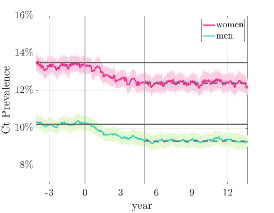
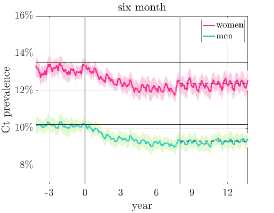
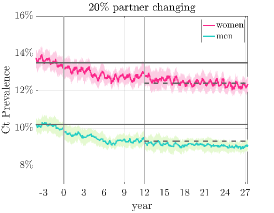
Moreover, we implemented the dynamic sexual networks for simulating the epidemic over a long time. Every two months, we updated the sexual partnerships by replacing of the causal partner(s) by people from the same social contact network (details in section A.1.3). We chose a period of two months since it’s the time frame covered by our Check It survey data. Replacing of the casual partners every two months is a modelling assumption. Because of the lack of further data for the time between changing casual partners, we quantified how sensitive our results are to this assumption and compared the simulation results using different sets of parameters (section A.1.3). The numerical simulations show that the lower sexual mixing (longer dynamic period or lower fraction in partner update) can slow down the progress of the intervention, which leads to a longer time for Ct prevalence to settle into a new and lower quasi-steady state. However, the final (asymptotic) reduction in prevalence is relatively insensitive across different configurations that reflect different the level of sexual mixing in the population.
The model didn’t consider the detailed immune responses for each individual during the infection process. Instead, the model was fit to the prevalence using the transmissibility parameters on the population level ( and ). This gives the averaged and constant population-level approximations of the immunity levels for men and women. Also, we didn’t incorporate the change in one’s susceptibility to infection after the natural recovery, where partial protective immunity of some degree may develop from a genital infection 30.
Another limitation is that our model assumed no sexual behaviour change, that is the dynamic partnership updating process preserved the total number of partnerships within each two-month time frame. We also assumed that the frequency of sexual contacts remains unchanged for the individuals before and after the Check It intervention program. We will investigate the impact of behaviour change in future studies. These restrictions can be adjusted to predict the impact of behavior changes, such as reducing the number of partners, would have on Ct prevalence.
We have modelled the epidemics and control on a closed population with no migration in/out of the network. That is, we did not consider the movement of people in/out the studying area, and no ageing effect: the same people stay in the age range 15-24, meaning they will not become too old and be removed from the eligible age range, and no young people will become 15 years old and come into the population. Thus, the model will only be a good approximation for a limited time, and it is not suitable for simulations over a long period. Our future research will improve the model by considering the ageing process in the population and migration, so we can better quantify the impact of a male-screening program in a more realistic setting.
Contributors
ZQ contributed to the design of the mathematical model and data analysis, undertook numerical simulations and visualisation, and interpreted results. NS and MCC contributed to data collection and analysis and reviewed model design and interpretation. AA and CS reviewed the model design and interpretation. JH and PK contributed to the study, reviewed the model, data analysis and results interpretations, and oversaw and coordinated the investigation. ZQ wrote the first draft of the article. All authors contributed to the writing and review of the draft and approved final manuscripts.
Declaration of interests
We declare no competing interests.
Acknowledgments
This work was supported by the grants from the National Institutes of Health National Institute of Child Health and Human Development (R01HD086794) and the endowment for the Evelyn and John G. Phillips Distinguished Chair in Mathematics at Tulane University. The content is solely the responsibility of the authors and does not necessarily represent the official views of the National Institutes of Health.
Appendix: Numerical implementations
A.1 Generation of dynamic sexual network
We modelled the sexual behaviour of the target population through a series of simulated sexual networks, which were embedded in a grand social network. We characterised the sexual network by using the data inputs from two studies in New Orleans: “You Geaux Girl!” (YGG) and “Check It”, where African-American women and men were enrolled to survey their sexual behaviour and complete an intervention process. The social network was generated using Simfrastructure agent-based modelling and simulation system, which simulated a population of 150,000 in New Orleans.
A.1.1 Degree and joint-degree distributions
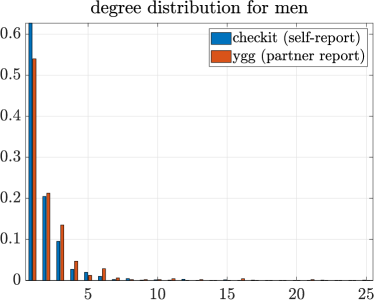
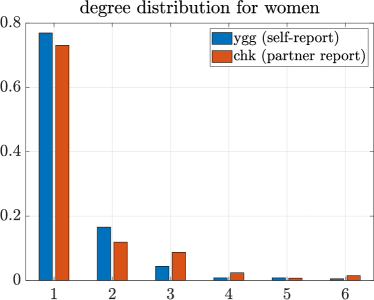
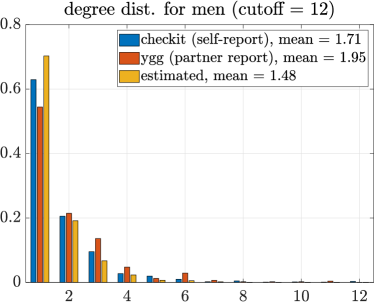
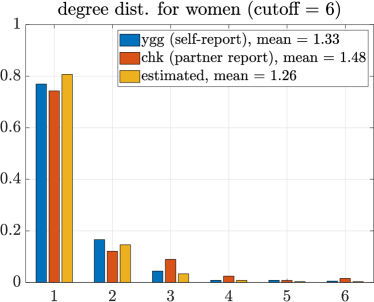
We extracted the information of degree distributions (number of partners one reports) and joint-degree distributions (number of partners one thinks his/her partner has) for women and men from the YGG and Check It data sets. These distributions were then used to generate sexual networks.
Based on the degree distributions from the self-reported data (see fig. A.1 first row), we truncated the distribution at a maximum degree = 12 for men and max degree = 6 for women. We then smoothed the extracted joint-degree distribution using LOESS with second degree polynomials, which was implemented by fit (method = ‘loess’, span = ) in MATLAB. Lastly, we normalised the distribution to unity. Table A.1 shows the estimate of the joint-degree table on a 5000 population size, where the entry in the table gives the total number of partnerships that exist between degree women and degree men on the sexual network. Figure in table A.1 shows the smoothed surface of the two-dimensional joint-degree distribution.
We then recalculated the estimated degree distributions from the updated joint-degree distribution, and we compared it with the reported ones in the second row of fig. A.1. Overall, the estimated degree distributions still in good agreement with the ones from the self-report data.
| # of partners for men (degree of men) | |||||||||||||
| 1 | 2 | 3 | 4 | 5 | 6 | 7 | 8 | 9 | 10 | 11 | 12 | ||
| women degree | 1 | 1102 | 608 | 273 | 109 | 42 | 29 | 15 | 6 | 5 | 4 | 6 | 6 |
| 2 | 425 | 163 | 100 | 34 | 14 | 14 | 2 | 1 | 1 | 3 | 3 | 3 | |
| 3 | 77 | 57 | 52 | 32 | 17 | 6 | 2 | 1 | 2 | 2 | 0 | 1 | |
| 4 | 17 | 16 | 20 | 13 | 2 | 2 | 0 | 0 | 1 | 0 | 0 | 1 | |
| 5 | 0 | 3 | 14 | 0 | 3 | 7 | 2 | 0 | 0 | 0 | 0 | 1 | |
| 6 | 6 | 13 | 15 | 8 | 2 | 2 | 0 | 0 | 0 | 0 | 2 | 0 | |
![[Uncaptioned image]](/html/2008.05579/assets/x13.png)
A.1.2 Primary and casual partnership
We categorised the partnership into primary (long-term) and casual (short-term), where the casual partners may be replaced every two months, which is the time frame that the Check It survey asks about recent sexual behaviour, and the primary partners stay in the sexual network.
For women, the YGG survey reported partner type as “main” and “casual”, thus, we considered the main partner is our primary partner class. For men, the Check It survey has several questions that characterise the relationship from different perspectives, including the duration of partnership, where they met (school, neighbourhood, club, dating site, etc), the best description of the relationship (girlfriend, wife, close friend, one-night stand), feeling committed or not and level of closeness. For Check It data, there are in total 2052 partners for 1318 men, and the partnership types were assigned using the following ordered criteria:
-
1.
If the relationship is best described by an ex-girlfriend (n=234), someone who I might want to have a relationship with (n=70), one-night stand (n=136), someone I paid to have sex with (n=10), internet hook up (n=14), or other (such as stranger, coworker and random answers, n=55), refuse to answer, or don’t know on relationship type (n=137) casual partner.
-
2.
If the relationship is best described by: girlfriend (n=596), wife (n=65) primary partner.
-
3.
For other relationship types, including a good friend of mine, a friend with benefits, someone I have sex with but not necessarily a friend:
-
(a)
if consider oneself committed (n=54) primary partner
-
(b)
If reporting refuse to answer or don’t know on the duration of the sexual relationship (n=64), or times of vaginal sex in the past 2 months (n=15) casual partner.
-
(c)
If times of vaginal sex (n=133) primary partner.
-
(d)
If times of vaginal sex (n=236) casual partner.
-
(e)
If times of vaginal sex :
-
i.
If the duration of sexual relationship greater than six months (n=54) primary partner.
-
ii.
In the remaining undefined partners: if the level of closeness or strength of your relationship (on a scale 1-10, 1 being not close or strong at all and 10 being extremely close) is greater than six (n=88) primary partner.
-
iii.
In the remaining undefined partners: if meeting with the partner before first had sex with her at a club or other event and didn’t know her before (n=3), meet her online through a dating site or social media (n=1) and other (party, work, college, etc, n=3) casual partner.
-
i.
-
(a)
-
4.
Among all the remaining undefined partnerships, if the man
-
(a)
already has exactly one primary partner (25 men have exactly one primary partner following the rules above), then consider all other partner(s) (n=26) casual partner;
-
(b)
already has exactly two primary partners (four men have exactly two primary partners following the rules above), then consider all other partner(s) (n=6) casual partner;
-
(c)
(no more than two primary partners defined for all the men in Check It data)
-
(d)
has exactly one partner, who is undefined (n=3), both the level of closeness is less than two casual partner;
-
(a)
-
5.
all other undefined partners (n=49) casual partner.
We used our best guess to categorise each partnership based on the process described above, and we summarised the resulting distributions in table A.2, which is not sensitive to the perturbation of the classification criteria. For each table, the entry gives the fraction of degree person who has exactly primary partner(s), and the last column is the accumulative probability for having at least one primary partner.
| # of primary partners | ||||||
|---|---|---|---|---|---|---|
| 1 | 2 | 3 | 4 | 1 | ||
| degree of men | 1 | 0 | 0 | 0 | ||
| 2 | 0 | 0 | ||||
| 3 | 0 | |||||
| 4 | ||||||
| 5 | ||||||
| 6 | 0 | |||||
| 7 | 0 | 0 | 0 | |||
| 8 | 0 | 0 | ||||
| 9 | 1 | 0 | 0 | 0 | 1 | |
| 10 | 0 | 0 | 0 | 0 | 0 | |
| 11 | 1 | 0 | 0 | 0 | 1 | |
| 12 | 0 | 0 | 1 | |||
| # of primary partners | |||||
|---|---|---|---|---|---|
| 1 | 2 | 3 | 1 | ||
| degree of women | 1 | 0 | 0 | ||
| 2 | 0 | ||||
| 3 | 0 | ||||
| 4 | 0 | 1 | 0 | 1 | |
| 5 | 1 | 0 | 0 | 1 | |
| 6 | 1 | 0 | 0 | 1 | |
A.1.3 Dynamic sexual networks
Given the distributions estimated in section A.1.1 and section A.1.2, we could generate a sexual network embedded in the social network, that is on average, the individual has a fraction of the casual partners from his/her connected social network, and a fraction are chosen randomly from the rest of the 5000 population. Moreover, to simulate the partner changing process in the population, we implemented dynamic sexual networks: every two months, with probability, the casual partners were replaced by either individuals from his/her social network or the rest of the population. The fraction was estimated from the Check It survey data, which is .
We used two months for the partnership updates, since this is the time frame covered by the Check It survey. The fraction is an assumption, not backed by survey data. To investigate the impact of these two parameters on the prediction, we ran simulations using two sets of different parameters, as shown in fig. A.2. For all the simulations, we have calibrated the model using transmission parameters and to the current Ct prevalence in men and women, as described in section A.3. By increasing the dynamic period and decreasing the fraction of causal partner replacement, the sexual mixing in the population is lowered. This also results in higher calibrated transmission parameters to match the same baseline Ct prevalence. Also, due to the lower sexual mixing level, it takes much longer for the program intervention to bring the epidemic down to a lower quasi-steady state. Overall, the effectiveness of the intervention, measured by the amount of (asymptotic) reduction in prevalence, is comparable to the baseline configuration and is relatively insensitive across different levels of sexual mixing in the population.
A.2 Chlamydia transmission SIS model over a dynamic sexual network
We updated the changes of infection statuses for the individuals daily, following the SIS framework, where each individual is either susceptible (S) or infected (I).
A.2.1 Force of infection:
On each day, we modelled the force of infection, the ability for the infected individuals to spread Ct to their susceptible partners as follows:
|
|
where each bracket gives a zero or one value with the specified probability contained inside.
From the datasets, we summarised the probability of having a sexual contact per day per partner for men and women with different degrees in table A.3. This probability depends on both how many partners the individual has (degree of men/women) and the type of the partnership (primary or casual). In general, the probability of having contact with the primary partner is higher than with the casual one.
| Type of partnership | ||||
|---|---|---|---|---|
| Primary | Casual | Mix-type | ||
| degree of men (Check It) | 1 | |||
| 2 | ||||
| 3 | ||||
| 4 | ||||
| 5 | ||||
| 6 | ||||
| 7 | ||||
| 8 | ||||
| 10 | ||||
| 11 | ||||
| 12 | ||||
| Type of partnership | ||||
|---|---|---|---|---|
| Primary | Casual | Mix-type | ||
| degree of women (YGG) | 1 | |||
| 2 | ||||
| 3 | ||||
| 4 | ||||
| 5 | ||||
| 6 | ||||
The probability of effective condom use depends on two factors, the probability of condom use and the probability of condom-use failure. From the data sets, we estimated that the values for condom use for primary and casual partners are and , respectively. The condom use failure rate was fixed as .
In the case of asymmetric primary-casual relationship, we modelled both the condom use probability and the contact frequency as a compromise between the couple, and we took the harmonic average of the values from two sides.
Lastly, the probability of transmission per contact ( and ) can have a wide range in different scenarios. We considered the maximum likelihood estimates by solving a nonlinear least square optimisation problem and matching the Ct prevalence to the current prevalence in New Orleans (% in men and % in women).
A.2.2 Temporary immunity:
Meanwhile, the infected individual could recover (without lasting immunity) and become susceptible again. The recovery could be due to either the natural clearance of the pathogen or medical treatment. We modelled the time to recovery as exponential distributions with different means (see the baseline values in table 2.1). We also assumed that no one recovers naturally within the first three months of infection, which was incorporated as a shift in the corresponding distribution.
Moreover, both natural and treated recovering process could be interrupted and start over again if the individual has an infectious contact with the partner before fully recovered. The natural recovery process could be updated as a treated recovery process once the individual gets treatment, either from the enrolment in the Check It program (men), annual screening (women), or screening due to symptomatic infection.
A.3 Model initialisation - balanced initial condition
We initiated the model to represent the current baseline Ct epidemic in New Orleans. Since the distribution of the current infected population depends on the history of the Ct epidemic, the initial infections are distributed across the sexual network as they would be as part of an emerging epidemic (fig. A.3). To identify a physically relevant initial condition, we started by an epidemic infecting a small fraction of the population at , and let the infection be internally redistributed in time until a quasi-steady-state is achieved. We started with of infections, and for most situations, the simulations took about fourteen years. We then reset the time to be zero and use this infection status as the initial condition for the rest of the simulations. We have infected 8% of the men and women with most sexual partners initially to speed up the process, as they are more likely to be infected in a balanced scenario.
A.4 Modelling annual screening for women
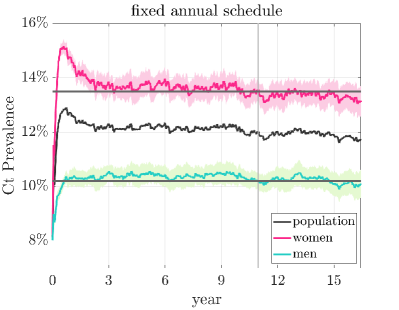
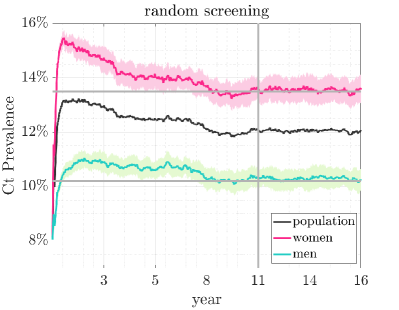
The Centers for Disease Control and Prevention recommends annual Ct screening for all sexually active women younger than 25 as well as older women with risk factors, which is a standard preventive strategy to identify most of the asymptomatic infections in women. We considered this intervention strategy as part of the baseline scenario and implemented a simple model to simulate the women’s annual screening process in practice.
We assumed that a fraction of the women in the target population receives annual Ct screening. In reality, most women return for screening following an annual routine schedule (regular annual screening), and there is also a small fraction of women receive screening on a casual basis (opportunistic screening). For the former case, we pre-generated an annual screening schedule for the regular screening group. For the latter case, we randomly sampled the opportunistic screening group from the rest of the women.
Figure A.4 presents the simulations at the initial calibration stage for two extreme scenarios: all the screened population belongs to one group: either the regular screening group (left plot) or the opportunistic screening group (right plot). Two cases show similar trends and prevalence at the quasi-steady state. We observed that the random screening case has a significantly slower convergence to the quasi-steady state. The slower convergence is a result of random screening targets different populations from year to year rather than a fixed population and, therefore, it takes a longer time to converge to a stable status. In our model, since there is no further information on the proportion of the population within each group, we assumed that all the screenings belong to the regular screening group. Moreover, since we only studied the Ct scenario after the quasi-steady state is achieved, the difference at the initial convergence speed does not affect our conclusion.
References
- Centers for Disease Control and Prevention 2019 Centers for Disease Control and Prevention. Sexually Transmitted Disease Surveillance 2018. Atlanta: US Department of Health and Human Services. 2019;DOI:10.15620/cdc.79370.
- Hillis and Wasserheit 1996 Hillis SD, Wasserheit JN. Screening for chlamydia – a key to the prevention of pelvic inflammatory disease. N Engl J Med. 1996;334(21):1399–1401.
- Ward and Rönn 2010 Ward H, Rönn M. Contribution of sexually transmitted infections to the sexual transmission of HIV. Curr Opin HIV AIDS. 2010 Jul;5(4):305–310.
- Centers for Disease Control and Prevention 2007 Centers for Disease Control and Prevention. Male Chlamydia screening consultation, Atlanta, Georgia, March 28-29, 2006, Meeting report. National Center for HIV/AIDS, Viral Hepatitis, STD, and TB Prevention. 2007;Available from: https://www.cdc.gov/std/chlamydia/chlamydiascreening-males.pdf.
- Gift et al. 2008 Gift TL, Gaydos CA, Kent CK, Marrazzo JM, Rietmeijer CA, Schillinger JA, et al. The program cost and cost-effectiveness of screening men for chlamydia to prevent pelvic inflammatory disease in women. Sex Transm Dis. 2008 Nov;35(11 Suppl):S66–75.
- Gopalappa et al. 2013 Gopalappa C, Huang YA, Gift TL, Owusu-Edusei K, Taylor M, Gales V. Cost-effectiveness of screening men in Maricopa County jails for chlamydia and gonorrhea to avert infections in women. Sex Transm Dis. 2013 Oct;40(10):776–783.
- Kissinger et al. 2019 Kissinger P, Schmidt N, Gomes G, Craig-Kuhn MC, Scott G, Watson S, et al. O14.2 Can community Chlamydia trachomatis screening of young heterosexual men help identify infected networks? Sex Transm Infect. 2019;95(Suppl 1):A71–A71. Available from: https://sti.bmj.com/content/95/Suppl˙1/A71.1. DOI:10.1136/sextrans-2019-sti.183.
- Green et al. 2014 Green J, Schmidt N, Latimer J, Johnson T, Aktaruzzaman U, Flanigan E, et al. WP 58 The influence of partnership type and characteristics on condom use among young African American women. Sex Transm Dis. 2014 Jun;41(Suppl 1):S111–S111. Available from: https://www.cdc.gov/stdconference/2014/2014-std-prevention-conference-abstracts.pdf. DOI:10.1097/01.olq.0000451608.27700.9f.
- Azizi et al. 2019 Azizi A, Qu Z, Lewis B, Hyman JM. Generating a heterosexual bipartite network embedded in social network. Submitted. 2019;.
- Network Dynamics and Simulation and Science Laboratory 2008 Network Dynamics and Simulation and Science Laboratory. Synthetic data products for societal infrastructures and protopopulations: Data set 2.0. Virginia Polytechnic Institute and State University; 2008. NDSSL-TR-07-003. Available from: http://ndssl.vbi.vt.edu/Publications/ndssl-tr-07-003.pdf.
- Farley et al. 2003 Farley TA, Cohen DA, Elkins W. Asymptomatic sexually transmitted diseases: the case for screening. Prev Med. 2003 Apr;36(4):502–509.
- Centers for Disease Control and Prevention ????a Centers for Disease Control and Prevention. Sexually Transmitted Diseases (STDs), Expedited Partner Therapy; [updated 2019 Aug 26; cited 2020 Jan 4]. Available from: https://www.cdc.gov/std/ept/default.htm.
- Centers for Disease Control and Prevention ????b Centers for Disease Control and Prevention. Chlamydia Treatment and Care; [updated 2016 Dec 9; cited 2020 Jan 4]. Available from: https://www.cdc.gov/std/chlamydia/treatment.htm.
- St. Lawrence et al. 2002 St Lawrence JS, Montaño DE, Kasprzyk D, Phillips WR, Armstrong K, Leichliter JS. STD screening, testing, case reporting, and clinical and partner notification practices: a national survey of US physicians. Am J Public Health. 2002 Nov;92(11):1784–1788.
- Torrone et al. 2014 Torrone E, Papp J, Weinstock H. Prevalence of Chlamydia trachomatis genital infection among persons aged 14-39 years–United States, 2007-2012. MMWR Morb Mortal Wkly Rep. 2014 Sep;63(38):834–838.
- Molano et al. 2005 Molano M, Meijer CJLM, Weiderpass E, Arslan A, Posso H, Franceschi S, et al. The natural course of Chlamydia trachomatis infection in asymptomatic Colombian women: a 5-year follow-up study. J Infect Dis. 2005 Mar;191(6):907–916.
- Chitnis et al. 2008 Chitnis N, Hyman JM, Cushing JM. Determining important parameters in the spread of malaria through the sensitivity analysis of a mathematical model. Bull Math Biol. 2008 Feb;70(5):1272–1296.
- Kretzschmar et al. 1996 Kretzschmar M, van Duynhoven YTHP, Severijnen AJ. Modeling prevention strategies for gonorrhea and chlamydia using stochastic network simulations. Am J Epidemiol. 1996 Aug;144(3):306–317.
- Turner et al. 2006 Turner K, Adams E, Gay N, Ghani A, Mercer C, Edmunds WJ. Developing a realistic sexual network model of chlamydia transmission in Britain. Theor Biol Med Model. 2006 Jan;3(1):3.
- Martin et al. 1992 Martin DH, Mroczkowski TF, Dalu Z, McCarty J, Jones RB, Hopkins SJ, et al. A controlled trial of a single dose of azithromycin for the treatment of Chlamydial urethritis and cervicitis. N Engl J Med. 1992 Sep;327(13):921–925.
- Trussell 2002 Trussell J. Choosing a contraceptive: efficacy, safety, and personal considerations. In: Hatcher R, Trussell J, Nelson A, Cates W, Stewart F, Kowal D, editors. Contraceptive technology. 19th ed. New York: Ardent Media, Inc; 2002. p. 19–47.
- Centers for Disease Control and Prevention ???? Centers for Disease Control and Prevention. Chlamydia, Detailed Fact Sheet; [updated 2016 Oct 4; cited 2020 Jan 4]. Available from: https://www.cdc.gov/std/chlamydia/stdfact-chlamydia-detailed.htm.
- Wiehe et al. 2011 Wiehe SE, Rosenman MB, Wang J, Katz BP, Fortenberry JD. Chlamydia screening among young women: individual- and provider-level differences in testing. Pediatrics. 2011 Feb;127(2):e336–e344.
- Hoover et al. 2014 Hoover KW, Leichliter JS, Torrone EA, Loosier PS, Gift TL, Tao G. Chlamydia screening among females aged 15 - 21 years – multiple data sources, United States, 1999 - 2010. Morb Mortal Wkly Rep. 2014 Sep;63(Suppl 2):80–88.
- Hogben et al. 2005 Hogben M, McCree DH, Golden MR. Patient-delivered partner therapy for sexually transmitted diseases as practiced by U.S. physicians. Sex Transm Dis. 2005 Feb;32(2):101–105.
- Golden et al. 2005 Golden MR, Whittington WLH, Handsfield HH, Hughes JP, Stamm WE, Hogben M, et al. Effect of expedited treatment of sex partners on recurrent or persistent gonorrhea or chlamydial infection. N Engl J Med. 2005 Feb;352(7):676–685.
- Schillinger et al. 2003 Schillinger JA, Kissinger P, Calvet H, Whittington WLH, Ransom RL, Sternberg MR, et al. Patient-delivered partner treatment with azithromycin to prevent repeated Chlamydia trachomatis infection among women: a randomized, controlled trial. Sex Transm Dis. 2003 Jan;30(1):49–56.
- Xu et al. 2011 Xu F, Stoner BP, Taylor SN, Mena L, Tian LH, Papp J, et al. Use of home-obtained vaginal swabs to facilitate rescreening for Chlamydia trachomatis infections: two randomized controlled trials. Obstet Gynecol. 2011 Aug;118(2):231–239.
- RelayHealth ???? RelayHealth. Gonorrhea and Chlamydia Tests; [updated 2014 Jan 01; cited 2020 Feb 2]. Available from: https://www.summitmedicalgroup.com/library/adult˙health/aha˙gonorrhea˙and˙chlamydia˙tests.
- Batteiger et al. 2010 Batteiger BE, Xu F, Johnson RE, Rekart ML. Protective immunity to Chlamydia trachomatis genital infection: evidence from human studies. J Infect Dis. 2010 Jun;201(S2):178–189.