∎
Department of Astronomy, University of Maryland, College Park, MD 20742 33institutetext: T. Holoien 44institutetext: The Observatories of the Carnegie Institution for Science, 813 Santa Barbara St., Pasadena, CA 91101, USA
Carnegie Fellow 55institutetext: F. Onori 66institutetext: Istituto di Astrofisica e Planetologia Spaziali (INAF), via del Fosso del Cavaliere 100, Roma, I-00133, Italy 77institutetext: T. Hung 88institutetext: Department of Astronomy and Astrophysics, University of California, Santa Cruz, California, CA 95064, USA 99institutetext: I. Arcavi (chapter coordinator) 1010institutetext: The School of Physics and Astronomy, Tel Aviv University, Tel Aviv 69978, Israel
CIFAR Azrieli Global Scholars program, CIFAR, Toronto, Canada
1010email: arcavi@tauex.tau.ac.il
Optical-Ultraviolet Tidal Disruption Events
Abstract
The existence of optical-ultraviolet Tidal Disruption Events (TDEs) could be considered surprising because their electromagnetic output was originally predicted to be dominated by X-ray emission from an accretion disk. Yet over the last decade, the growth of optical transient surveys has led to the identification of a new class of optical transients occurring exclusively in galaxy centers, many of which are considered to be TDEs. Here we review the observed properties of these events, identified based on a shared set of both photometric and spectroscopic properties. We present a homogeneous analysis of 33 sources that we classify as robust TDEs, and which we divide into classes. The criteria used here to classify TDEs will possibly get updated as new samples are collected and potential additional diversity of TDEs is revealed. We also summarize current measurements of the optical-ultraviolet TDE rate, as well as the mass function and luminosity function. Many open questions exist regarding the current sample of events. We anticipate that the search for answers will unlock new insights in a variety of fields, from accretion physics to galaxy evolution.
Keywords:
Tidal Disruption Events: Optical Tidal Disruption Events: Ultraviolet, Bowen Fluorescence1 Introduction
The first predictions for TDE observables considered direct emission from an accretion disk. Therefore, it was expected that TDEs be seen mainly in the X-rays. Indeed, the first TDEs were detected during the ROSAT all sky survey as luminous, soft X-ray flares from the nuclei of otherwise quiescent galaxies (Bade et al., 1996; Komossa and Greiner, 1999; Grupe et al., 1999; Greiner et al., 2000). Subsequently, similar X-ray events were discovered through dedicated searches or serendipitous discoveries with Chandra and XMM-Newton Esquej et al. (2007, 2008); Lin et al. (2011); Saxton et al. (2012). Swift has been extremely useful in providing rapid follow-up observations for many of these events, and for discovering a new class of higher energy gamma-ray events. A detailed description of TDE characteristics in the X-rays and gamma-rays can be found in the X-ray Chapter and the Gamma-ray Chapter in this book, respectively.
In the last decade, several transients discovered in optical and ultraviolet wavelengths have been attributed to TDEs. The source of TDE emission at these wavelengths is currently debated to be either reprocessing of the X-ray emission from the accretion disk by optically thick material surrounding the disk (e.g. Guillochon and Ramirez-Ruiz, 2013; Roth et al., 2016), or as emission from outer shocks between the debris streams as they collide (e.g. Piran et al., 2015), or perhaps some combination of both (e.g. Jiang et al., 2016; Lu and Bonnerot, 2020). A detailed discussion of these emission mechanisms is presented in the Emission Mechanisms Chapter in this book. Here we focus on the observational properties of the main classes of optical and ultraviolet transients suggested in the literature to be TDEs. Additional one-of-a-kind events, whose nature is less clear, are discussed in the One-off Events and Imposters Chapter.
The main class of optical-ultraviolet TDEs contains approximately 30 events (Table 5) and is identified mainly by broad ( km s-1) H and/or He lines in their spectra (with some events showing additional features), blue-continuum (few K) emission lasting for several months, and a month-long rise to a peak optical absolute magnitude of approximately . A diversity within this class does exist, and a full unbiased view of the population is not yet available. This class of events show a surprising and still unexplained strong preference for rare post-starburst (or E+A) host galaxies (see Host Galaxies Chapter), while almost none have been found in active galactic nuclei (AGN)111A notable candidate exception is PS16dtm (Blanchard et al., 2017) which is discussed in the One-off Events and Imposters Chapter.. There are obvious observational difficulties in finding TDE flares embedded in AGN light, and also in discerning TDEs from rare AGN flares (e.g. Trakhtenbrot et al., 2019a, b). Chan et al. (2019) recently suggested that TDEs in AGN will look different than those in non-active galaxies due to the interaction of the stellar debris with the pre-existing accretion disk. Distinguishing TDEs from AGN is discussed in more detail in the One-off Events and Imposters Chapter.
Here we present a current picture of the main class of established events. However, it’s important to keep in mind that with new events being discovered regularly, the map of optical-ultraviolet TDEs is still being drawn. While we refer to all of the events discussed here as TDEs, some might still be considered “TDE candidates” until a better picture of the population of real events and their imposters emerges.
In the next section, we begin with a brief review of the history of optical-ultraviolet TDE discoveries in order to provide a picture of the different biases affecting the current sample of events. We then focus on the photometric (Section 3) and spectroscopic (Section 4) properties of this sample and discuss how a robust sample of optical-ultraviolet TDEs can be constructed (Section 5). We then discuss rate measurements and the luminosity function of optical-ultraviolet TDEs (Section 6), and end with some concluding remarks (Section 7).
2 A Brief History of TDE Detections in Optical and Ultraviolet Surveys
The first optical-ultraviolet TDE candidate to be discovered was GALEX-D3-13 (Gezari et al., 2006); two more events (D1-9 and D23-H1) were reported in Gezari et al. (2008, 2009). These three events were all found using multi-epoch ultraviolet images from the Galaxy Evolution Explorer (GALEX; Martin et al., 2005) which were selected to have a rich set of archival data (e.g., the Groth field). Using this archival data, recurring AGN flares could be removed.
Simultaneous optical imaging is available for two of the GALEX flares, allowing for an accurate estimate of the blackbody temperature. All three TDEs found in GALEX data have relatively high blackbody temperatures ( K). Since GALEX imaging is relatively deep (limiting magnitude 23 in the near-ultraviolet band), the GALEX search for TDEs has the greatest depth of all imaging searches to date (see Table 3 in van Velzen, 2018). However this search was not done in real-time, hence spectroscopy of the flares was never obtained.
The GALEX transient search (Gezari et al., 2013) remains the only ulraviolet-based TDE search to date. Below we provide an overview of the optical surveys that have led to the discovery of TDEs that can be classified based on their spectral properties (as listed in Table 5).
2.1 SDSS
The Sloan Digital Sky Survey (SDSS; York et al., 2000) provided two types of TDE candidates. First, the SDSS catalog of galaxy spectra (Strauss et al., 2002) enabled the discovery of coronal-line TDEs (e.g. Komossa et al., 2008; Wang et al., 2011, 2012; Yang et al., 2013). For these sources, the TDE is not observed directly, but rather transient narrow high-ionization emission lines222such as a strong Fe X 6376 to O III 5007 ratio, and strong Fe X 6376, Fe XI 7894, Fe XIV 5304, Ar XIV 4414, and S XII 7612 lines. are seen, and are interpreted as an “echo” of a soft X-ray flare (required to produce the coronal lines) originating in a TDE. These events, as well as echoes showing broad emission lines (e.g. Komossa et al., 2008), are discussed in more detail the Echo Chapter of this book. Here we note that due to the lack of multi-epoch imaging observations that cover the flare itself, our knowledge of the photometric properties of these events (e.g., timescales, location in the host galaxy, and blackbody temperature) is limited.
Second, SDSS provided the first TDEs selected directly using optical imaging observations (van Velzen et al., 2011). These were discovered in Stripe 82 (Frieman et al., 2008), a region of deg2 that was observed with a cadence of few days for three months form 2005 to 2007 (lower cadence observation date back to 2000). A systematic search for nuclear flares from all galaxies in Stripe 82 yielded two events (dubbed SDSS-TDE1 and SDSS-TDE2) from otherwise quiescent galaxies. The key property distinguishing these flares from normal supernovae and AGN is a high blackbody temperature (as measured using SDSS photometry) that remained constant for at least three months (this property later became a basis for the photometric selection of TDEs). Both events also show transient ultraviolet emission, detected in GALEX more than one year after peak. For one of the two flares, SDSS-TDE2, an optical spectrum was obtained near peak. The spectrum displays broad emission features around H, and H and He II 4686.
2.2 Pan-STARRS
Two TDEs (from non-AGN galaxies) were discovered by the Pan-STARRS medium-deep survey (Chambers, 2007): PS1-10jh (Gezari et al., 2012) and PS1-11af (Chornock et al., 2014). Both were identified via spectroscopic follow-up of photometric transients in the medium-deep fields (Chambers et al., 2016), a set of fields that were targeted with a three-day cadence to a typical single-epoch depth of (though the effective flux limit of the TDE search is likely to be shallower due to the requirement for spectroscopic classification).
Both PS1-10jh and PS1-11af show transient ultraviolet emission (detected by GALEX) and long-term high blackbody temperatures, but display different spectral properties. PS1-10jh displays a broad He II emission feature in its optical spectrum, while PS1-11af shows two transient absorption features in the rest-frame ultraviolet, possibly attributed to Mg II. PS1-10jh is the first TDE with multiple pre-peak detections and multiple spectroscopic observations, making it the archetype for the main optical-ultraviolet class of TDEs.
While the medium-deep survey has concluded, the Pan-STARSS telescope continued to search for transients (Huber et al., 2015) and later discovered the TDEs PS17dhz (AT 2017eqx; Nicholl et al., 2019) and PS18kh (AT 2018zr; Holoien et al., 2019a). Another TDE candidate from the Pan-STARRS survey was discovered in a narrow-line Seyfert 1 galaxy (PS16dtm; Blanchard et al., 2017). This event, and others like it, for which an association with a TDE or enhanced AGN activity is not decisive, are discussed in the One-off Events and Imposters Chapter.
2.3 PTF
Three TDEs were discovered in Palomar Transient Factory (PTF: Law et al., 2009) data by searching for spectroscopically-observed nuclear flares with an -band absolute magnitude in the range (Arcavi et al., 2014). The three events discovered (PTF09ge, PTF09djl, and PTF09axc) all display relatively high blackbody temperatures, and have similar spectroscopic signatures as PS1-10jh and SDSS-TDE2, namely broad He and/or H emission lines. The discovery of the events established the spectroscopic sequence of TDEs (see Section 4), and also identified the peculiar nature of the host galaxies of such events (see Host Galaxies Chapter). For the PTF TDEs, no ultraviolet observations were obtained near peak, but two sources were detected in HST far-ultraviolet imaging observations, five years after peak (van Velzen et al., 2019a).
2.4 iPTF
The iPTF search for TDEs (Hung et al., 2018) used the properties of previous TDEs to identify new candidates in real time, hence more follow-up data (in particular with HST and Swift) of promising TDEs could be obtained in real time. The typical single-epoch magnitude limit of iPTF data is . No selection on the absolute magnitude was made, but instead a blue color for the flare () was required to reduce the background of supernovae. Follow-up spectroscopy and Swift-UVOT observations were used to confirm the TDE nature. Three TDEs were found: iPTF15af (Blagorodnova et al., 2019), iPTF16fnl (Blagorodnova et al., 2017), and iPTF16axa (Hung et al., 2017). iPTF16fnl is an outlier in terms of its low luminosity and rapid decline rate. It raises the question of how many more such TDEs might have been missed due to an observational bias against finding rapidly evolving events.
2.5 ASAS-SN
To date, the All Sky Automated Survey for supernovae (ASAS-SN; Shappee et al., 2014) discovered eight TDEs: ASASSN-14ae (Holoien et al., 2014), ASASSN-14li (Holoien et al., 2016b), ASASSN-15oi (Holoien et al., 2016a), ASASSN-18pg (AT 2018dyb; Leloudas et al., 2019; Holoien et al., 2020), ASASSN-18ul (AT 2018fyk), ASASSN-18zj (AT 2018hyz; Short et al., 2020; Gomez et al., 2020; Hung et al., 2020), ASASSN-19bt (AT 2019ahk; Holoien et al., 2019c), and ASASSN-19dj (AT 2019azh). The ASAS-SN discoveries come from an all-sky search using single-band observations (either - or -band) with a typical limiting magnitude of 17. The TDE identification is established via spectroscopic follow-up. This shallow and wide nature of ASAS-SN means that the survey is sensitive to the lowest-redshift TDEs (), making them ideal for intensive followup observations. Ultraviolet detections from Swift have been obtained for all ASAS-SN TDEs.
2.6 ATLAS
The Asteroid Terrestrial-impact Last Alert System (ATLAS; Tonry et al., 2018) is a survey primarily designed for discovering potentially hazardous asteroids. However, it regularly discovers transients from its two-day cadence search down to a limiting magnitude of 19–20. ATLAS has discovered three TDEs so far (van Velzen et al., 2020a): ATLAS18way (AT 2018hco), ATLAS18yzs (AT 2018iih) and ATLAS19qqu (AT 2019mha).
2.7 OGLE
The Optical Gravitational Lensing Experiment (OGLE; Udalski et al., 2015) also runs a transient search (Wyrzykowski et al., 2014). The survey is focused on an area of the sky around the Magellanic Clouds, but this includes many background galaxies. Each field is observed roughly every four days with a limiting magnitude of in the -band. OGLE has discovered one TDE (OGLE16aaa, Wyrzykowski et al., 2017; Kajava et al., 2020).
2.8 ZTF
The Zwicky Transient Facility (ZTF; Bellm et al., 2019) started in early 2018 and is still running. The single-epoch depth and filters are similar to iPTF, but the field of view is eight times larger. The source PS18kh was detected during the ZTF commissioning phase (van Velzen et al., 2019b), and sixteen more TDEs have been detected in ZTF data since (van Velzen et al., 2020a), signaling a large increase of the TDE discovery rate.
3 Light Curves
Optical-ultraviolet TDEs typically rise to a peak blackbody luminosity of 1043.5-44.5 erg s-1 on timescales of weeks-months with a decay broadly consistent with t-5/3. This is the expected decline rate of the post-disruption mass return flow (Rees 1988; Phinney 1989), though the density profile of the disrupted star may influence this rate (Lodato et al., 2009; Gezari et al., 2012), as will relativistic effects (Kesden, 2012a). It is also important to keep in mind that fitting a power law to TDE light curves introduces a large uncertainty on the inferred power-law index, due to the freedom in setting the time of disruption.
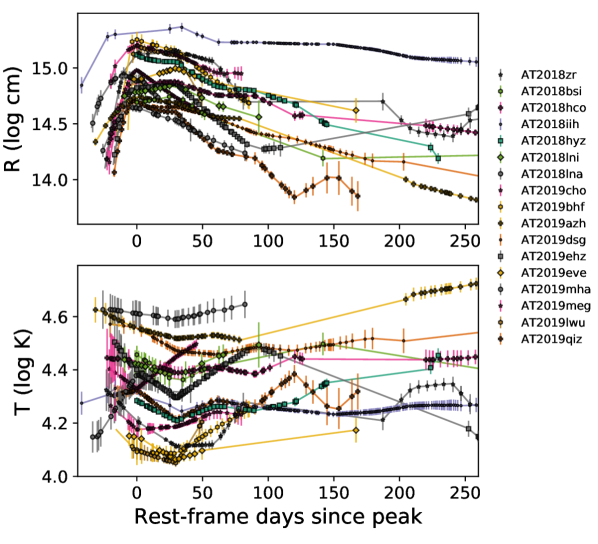
Peak luminosities and time scales vary between events (Fig. 1). What does not seem to vary between events is the lack of cooling of the post-peak blackbody temperature (Fig. 2), though some of this homogeneity may be artificially enhanced by the use of the non-evolving temperature as a selection criterion to discriminate TDEs from supernovae.
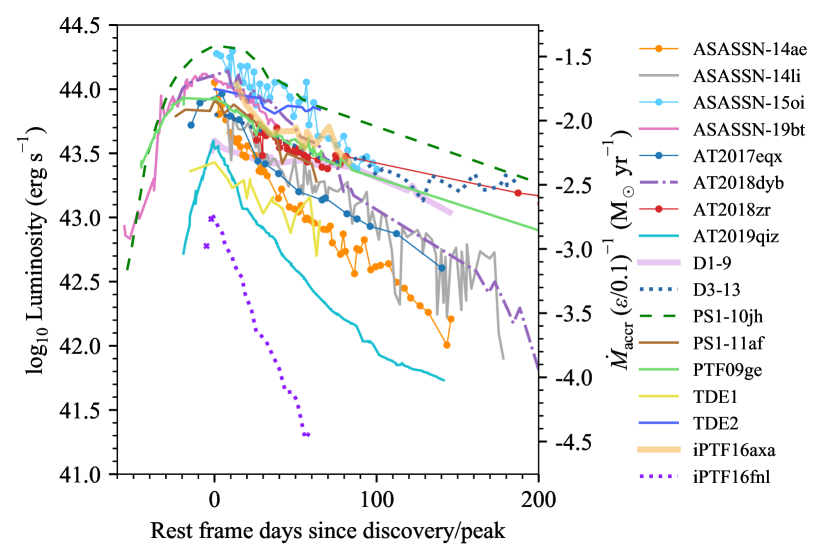
Perhaps the first notable outlier in its photometric properties (being still “normal” spectroscopically) is iPTF16fnl, displaying a fainter and faster light-curve evolution than the rest of the class (Fig. 1; Blagorodnova et al., 2017; Onori et al., 2019). This raised the question as to whether many more such events exist but are missed due to observational biases. Indeed, recently, more rapidly-decaying events have been found in the ZTF survey (see Table 5 and the analysis of AT 2019qiz by Nicholl et al. 2020).
Another photometric outlier is ASASSN-15lh (Leloudas et al., 2016), which displayed a double peak in the bluer bands of its light curve. This event is an outlier also spectroscopically, and its identification as a TDE is contended (Dong et al., 2016; Godoy-Rivera et al., 2017b). For this reason we do not include it in Table 5. ASASSN-15lh is discussed in more detail in the One-off Events and Imposters Chapter.
Recently, van Velzen et al. (2020a) doubled the sample of known TDE light curves, and found a correlation between photometric properties and the spectroscopic types (this spectroscopic classification is introduced in the next section). Namely, that TDEs showing Bowen features have smaller blackbody radii compared to the rest of the population, while events showing only He in their spectra have the longest rise times. For the overall population, the rise timescale and fade timescale show no clear correlation, while a strong correlation would be expected if rise and fade timescales were both determined by the fallback rate. van Velzen et al. (2020a) conclude that this might be an indication that the rise time of TDE light curves is not related to the fallback time but rather to a diffusion time through some extended material (which may be the source of the spectral differences as well).
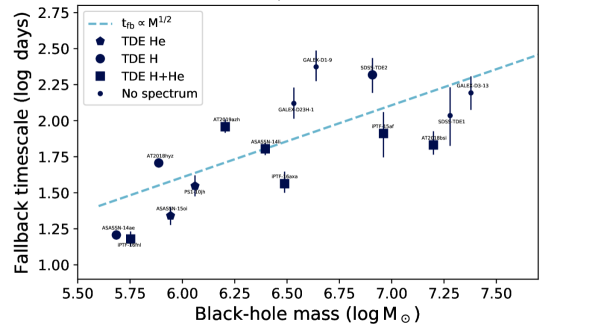
Several authors have reported a (potential) correlation between the decay rate of the light curve and black-hole mass (Blagorodnova et al., 2017; Wevers et al., 2017) or total host galaxy mass (van Velzen et al., 2020a). In Figure 3 we reproduce this result using our homogeneous lightcurve analysis (see Section 5). Here we estimate the black-hole mass from the - relation (Gültekin et al., 2009), using the velocity dispersion measurement of Wevers et al. (2017, 2019c) or SDSS (Thomas et al., 2013). The fallback timescale is estimated by fitting a power-law decay to the observed optical-ultraviolet blackbody emission, with the power-law index fixed to . We find a statistically significant correlation between the black-hole mass and decay rate ( for a Kendall’s Tau test). This correlation could indicate that the early-time decay rate of the optical-ultraviolet emission is indeed determined by the fallback rate.
X-ray detections are rare in the case of optically-discovered TDEs, and there are only a few cases showing both optical-ultraviolet and X-ray emission: ASASSN-14li (Miller et al., 2015; Holoien et al., 2016c; van Velzen et al., 2016, Fig. 4), AT 2018fyk Wevers et al. (2019a) AT 2018zr, van Velzen et al. (2019b), and most recently, AT 2019azh, AT 2019dsg, and AT 2019ehz (van Velzen et al., 2020a).
The existence of an observational dichotomy between optical-ultraviolet and X-ray TDEs has been a topic of study. Loeb and Ulmer (1997), Strubbe and Quataert (2009), Guillochon et al. (2014), Roth et al. (2016) and Auchettl et al. (2017) invoke material surrounding the accretion disk as responsible for reprocessing of the X-ray photons from the disk into optical and ultraviolet photons. Dai et al. (2018) expand on this picture by proposing that the reprocessing material is concentrated in the equatorial direction, concluding that the observed dichotomy is a viewing angle effect: the optical and ultraviolet emission are seen from the equatorial direction, while a polar viewing angle will not cross the reprocessing material and provide a line of sight directly into the X-ray emitting accretion disk. These models are further discussed in the Emission Mechanisms Chapter of this book.
Many optical-ultraviolet TDEs with observations more than 100 days post-peak show a flattening of the light curve to almost constant luminosity. A clear example is ASASSN-14li (Brown et al., 2017a). Using both HST and Swift/UVOT observations, van Velzen et al. (2019a) find a flattening of the ultraviolet light curve for 10 out of 12 TDEs with late-time observations. They show that this plateau phase can be explained by emission from an accretion disk that forms after the disruption (Cannizzo et al., 1990). Mummery and Balbus (2020) show that both the late-time ultraviolet plateau emission and the early-time X-ray emission of ASASSN-14li can be explained using an evolving accretion disk.
4 Spectra
Spectra are crucial for distinguishing TDEs from other nuclear activity due to AGN variability, or other transients such as supernovae. They can also provide insights into the sources of TDE emission and dynamics. The increasing sample of TDEs monitored by dense spectroscopic follow-up campaigns has revealed a set of spectroscopic classes differing in their line species, profiles and evolution.
4.1 Optical
Spectra of the first optical-ultraviolet TDEs identified were dominated by a strong and consistent blue continuum with broad (FWHM104 km s-1) emission lines superimposed on it. The most common and prominent spectral feature is a broad and intense He II 4686 line (e.g. Gezari et al., 2012, 2015), which is not seen at these widths, intensities and durations in spectra of other known transients. In some cases, broad H and H lines are also identified (e.g. Arcavi et al., 2014). This led to an initial map of TDE spectral diversity as a continuum of H-rich to He-rich events (Fig. 5). van Velzen et al. (2020b) divided the current TDE population into three spectroscopic types and showed that TDEs in these classes have significantly different photometric properties. Following their approach, in Table 5 we label events showing only He II lines as “TDE He”, those showing only hydrogen lines as “TDE H” and those showing both He II and H lines as “TDE H+He”.
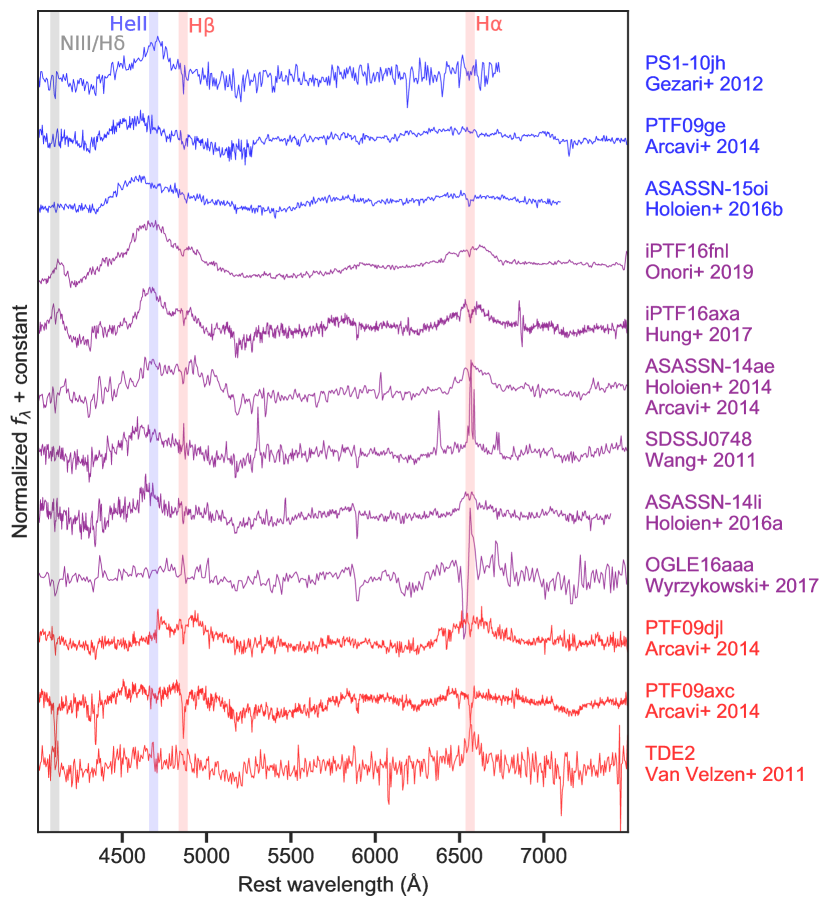
The lack of any hydrogen signatures in the spectra of PS1-10jh was initially interpreted as evidence for the disruption of a rare helium star (Gezari et al., 2012). However, with the discovery of additional events with hydrogen-free spectra, this hypothesis became harder to justify. Guillochon et al. (2014), using hydrodynamical simulations, was able to explain the PS1-10jh spectra as produced by the disruption of a main sequence star. In this scenario, an optically thick reprocessing envelope determines the location of the line-forming region, and the lack of hydrogen lines is attributed to the conditions for forming the lines in the envelope, rather than the presence or absence of hydrogen. Roth et al. (2016) showed that varying the radius of the reprocessing layer (given some composition and ionizing flux) can suppress the hydrogen lines while keeping the He II lines strong, thus reproducing the observed spectral sequence displayed in Figure 5.
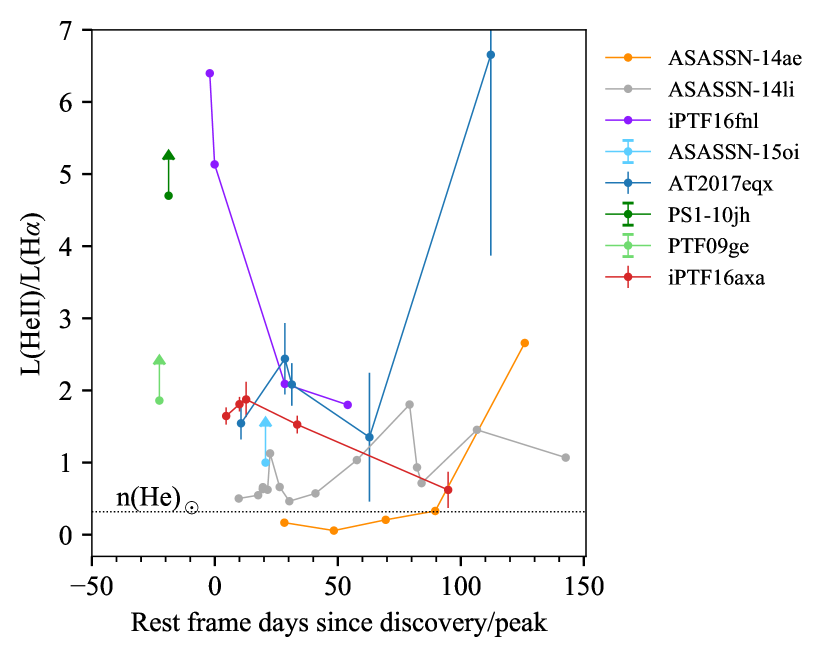
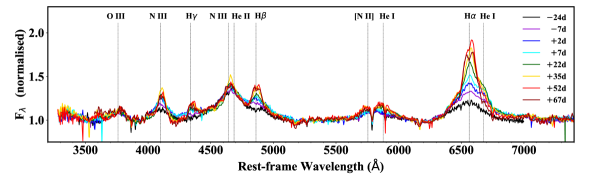
In some events, the relative hydrogen to helium line intensity is seen to change with time. For instance, the early optical spectra of ASASSN-14ae (Holoien et al., 2014) are characterized by an intense and broad H emission line and a weak signature of a broad component in the He II 4686 line, which developed only later. An even more extreme He II to H line-ratio evolution is seen in AT 2017eqx (Figure 6) and interpreted, following Roth et al. (2016), as evidence for contraction of the reprocessing layer (Nicholl et al., 2019).
In Figure 6 we show the time evolution of the He II / H luminosity ratio for a number of optical-ultraviolet TDEs with well-sampled spectroscopic sequences. The time evolution of this line ratio varies from event to event. Yet, in most, the He II / H luminosity ratio is above the expected value for a nebular environment with solar abundance (Hung et al., 2017, dotted line in Figure 6). This helium enhancement has been explained as the result of the suppression of the Balmer lines (which are optically thick) by high gas densities (1010 cm-3) in the emitting region. This scenario was first proposed by Bogdanović et al. (2004) and further investigated using CLOUDY calculations by Gaskell and Rojas Lobos (2014) and Strubbe and Murray (2015), as well as with radiative transfer calculations by Roth et al. (2016).
The broad features observed in TDEs are, in general, pure emission line profiles, with no signs of absorption or P-cygni features. We present the line-profile evolution of H and He II for several TDEs in Figures 7 and 8 respectively. Some events display evolving asymmetric profiles. For example, ASASSN-14ae Holoien et al. (2014) shows a broad and asymmetric H line, with a prominent red wing and a blue-shifted centroid at early times. Later, the H line becomes symmetric and centered around the host rest-frame wavelength. Similar evolution is seen in the He II line of ASASSN–15oi Holoien et al. (2016a).
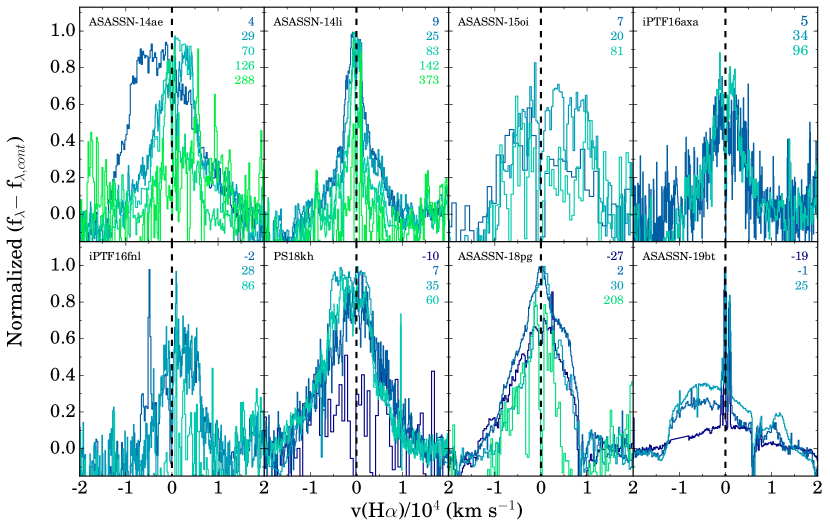
for eight optical-ultraviolet TDEs. Colors correspond to rest-frame days from peak or discovery as indicated. ASASSN-14ae can be seen to have an asymmetric profile at early times which later becomes symmetric. Data from Holoien et al. (2014, 2016b, 2016a); Brown et al. (2016, 2017b); Hung et al. (2017); Blagorodnova et al. (2017); Holoien et al. (2019c, b, 2020).
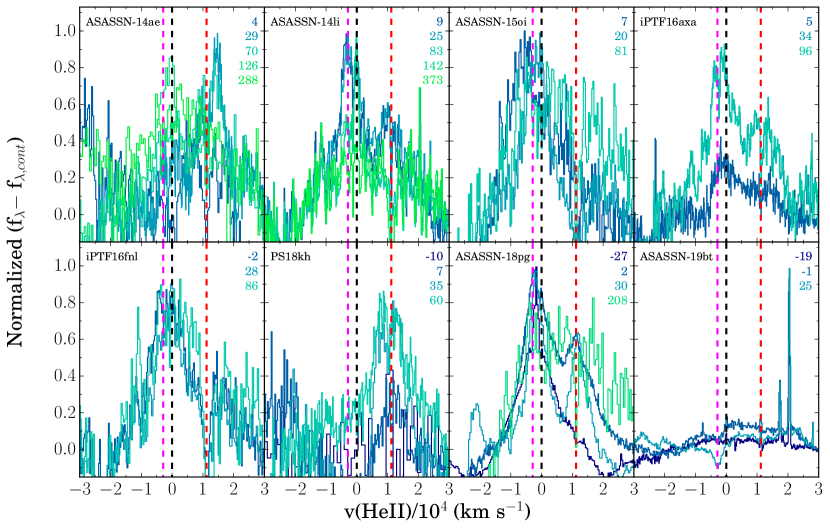
and H (red dashed line) for eight optical-ultraviolet TDEs. Colors correspond to rest-frame days from peak or discovery as indicated. ASASSN-15oi can be seen to have an asymmetric He II line profile at early times which later becomes symmetric. Data sources are the same as in Figure 7.
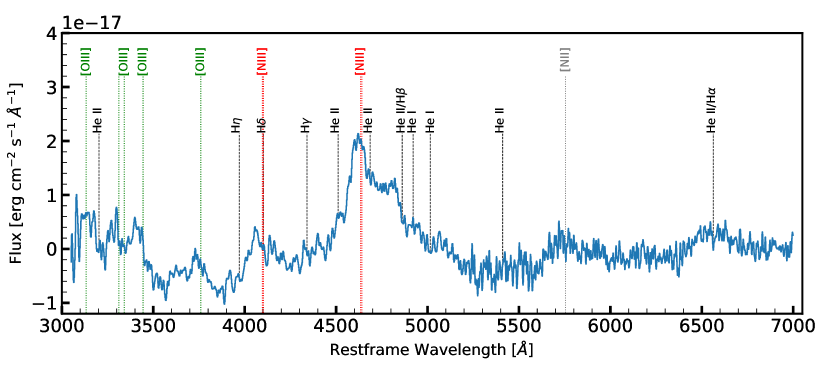
Optically-thick outflows have been proposed to explain such line profiles and their evolution, especially in the case of H Roth and Kasen (2018). However, in some cases, the blue-shifted component in the He II 4686 line has been attributed to a blend with possible N III/C III lines Gezari et al. (2015); Brown et al. (2018). Leloudas et al. (2019) found a rich set of line species in the spectra of the TDE AT 2018dyb (Fig. 9). In addition to the Balmer series and He II, they identify also He I, O III 3760, and, indeed, N III 4100, 4640 (the latter blended with He II). This event demonstrates the richness of optical-ultraviolet TDE spectral diversity beyond the hydrogen to helium sequence seen initially (see also Holoien et al., 2020). Leloudas et al. (2019) identify possible N III lines also in the TDEs ASASSN-14li and iPTF16axa. Together with iPTF15af (Blagorodnova et al., 2019) and iPTF16fnl (Onori et al., 2019), they form a N-rich class of TDEs.
In addition to N III, Blagorodnova et al. (2019) identify several Bowen fluorescence lines in the optical and ultraviolet spectra of iPTF15af (Fig. 10). Bowen fluorescence (Bowen, 1928; Weymann and Williams, 1969) is a process by which extreme-ultraviolet and X-ray photons ionize He II, which later recombines, emitting Ly- photons. These then excite certain O III and N III transitions with similar wavelengths, launching a cascade of transitions observed in the optical and ultraviolet regimes. In particular, strong O III 3133, N III 4640, and He II 4686 have been observed in some planetary nebulae and X-ray binaries (Schachter et al., 1989; Kastner and Bhatia, 1996). Such emission was predicted to occur around active supermassive black holes decades ago (Netzer et al., 1985), but was only recently observed for the first time in an extreme outburst of an AGN (Trakhtenbrot et al., 2019b). Its detection also in TDEs (Blagorodnova et al., 2019) may indicate the presence of similar conditions involving extreme-ultraviolet photons hitting high-density and high-optical-depth material, in both TDEs and some AGN outbursts. In Table 5 we denote both the N-rich TDEs and those with Bowen lines with a “Bowen” label (it is not yet clear whether these two spectral classes are distinct). We adopt the criterion of Leloudas et al. (2019) that use the presence of either N III 4640 or 4100, or O III 3760 to identify an event as “Bowen”. As first pointed out by Leloudas et al. (2019), evidence for these Bowen lines is (so far) detected only in spectra of TDEs that show both He and Balmer emission lines (i.e. TDE H+He’s). In fact, almost all TDEs typed as “H+He” show one or more emission lines that might be associated with the Bowen mechanism (van Velzen et al., 2020b).
Wevers et al. (2019b) identified the Fe II 37,38 multiplet in narrow emission lines in the the late-time spectra of AT 2018fyk (we add a ”Fe” label to this event in Table 5) and suggest similar lines might be present in SDSS J0748, PTF09ge, and ASASSN–15oi. These low-ionization lines are also found in narrow-line Seyfert 1 AGN, in some coronal-line emitters, and in flares or TDEs in active galaxies such as PS16dtm Blanchard et al. (2017), AT 2018bcb (Neustadt et al., 2020), and AT 2018dyk (Frederick et al., 2019).
The combination of the TDE spectral features (species, line profiles and intensity) discussed so far are distinct from those of all known transients, including all types of supernovae.
In many TDEs, the widths of the lines evolve with time, starting at 104 km s-1 at early times and becoming narrower on time scales of months. The narrowing of the lines with time, as the luminosity of the event declines, is the opposite behaviour observed in the case of reverberation mapping in AGN (e.g. as noted by Holoien et al., 2016a). While the width of broad spectral lines is usually associated with the kinematics of the emitting gas, in some cases, it can be strongly affected by electron scattering instead. This can lead to an overestimation of the emitting region bulk velocity, and a mistaken interpretation of its evolution.
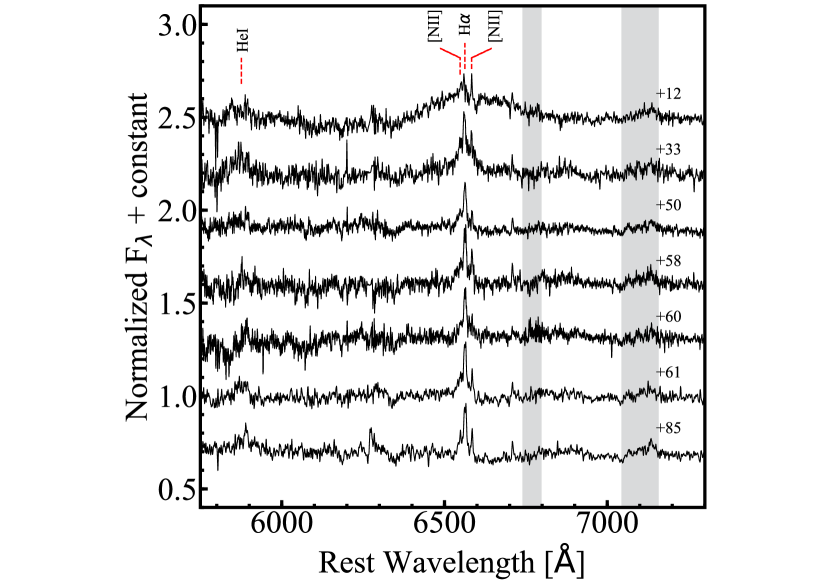
Roth and Kasen (2018) investigate spectral line formation due to electron scattering in an outflowing optically-thick gas. Using radiative transfer calculations they show that, indeed, non-coherent scattering of hot electrons can play a primary role in the broadening of the lines in a high-density emitting region. In this case, the line profiles are characterized by the presence of a narrow line core superimposed on a broad component at the base of the line. The broad line ‘wings’ are produced by photons scattered off of high-velocity electrons in the gas. The contribution of the wing to the line profiles becomes more prominent with increasing optical depth. In some cases, the broad wings may dominate the line profile completely, with the narrow core becoming visible only later as the optical depth decreases. This is seen very clearly in the case of the H line of iPTF16fnl (Fig. 11; Onori et al., 2019). In this scenario, the observed line profile evolution, in which a broad component becomes narrower and a central, narrow core emerges, reflects a decline in the emitting region’s density, rather than a drop in its bulk velocity.
Among the current sample of optical-ultraviolet TDEs, four events exhibit broad emission lines with boxy or double-peaked profiles, which have been associated with a line-emitting disk: PTF09ge (Arcavi et al., 2014), ASASSN-14li (Liu et al., 2017), AT 2018zr (Holoien et al., 2019a), and AT 2018hyz (Short et al., 2020; Hung et al., 2020). In particular, for AT 2018zr and AT 2018hyz, the double-peaked line profile was seen to develop gradually with time, and has been interpreted as the revealing of an accretion disk through the thinning reprocessing material. Hung et al. (2020) deduce a disk-formation time scale of about a month for AT 2018hyz, implying rapid circularization of the stellar debris after disruption. Hung et al. (2020) further model the H emission line in AT 2018hyz as a combination of a double-peaked disk profile and a Gaussian component, which is likely produced in the outflowing gas. The Gaussian component becomes stronger over time and dominates the H line shape at late times. This competition with a non-disk component, and the requirement of a high inclination angle (close to edge-on) to see a disk profile may explain why double-peaked line profiles are rare in TDEs.
4.2 Ultraviolet
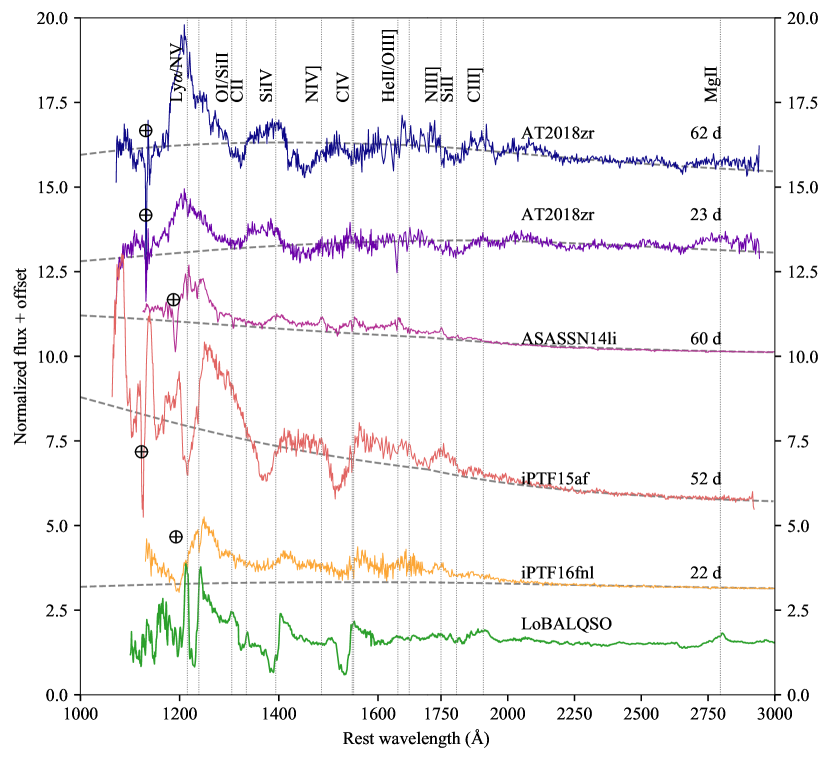
To date, ultraviolet spectroscopy has been obtained for five TDEs – ASASSN-14li Cenko et al. (2016), iPTF16fnl Brown et al. (2018), PS16dtm Blanchard et al. (2017), iPTF15af Yang et al. (2017); Blagorodnova et al. (2019), and AT 2018zr Hung et al. (2019), all of which have near-ultraviolet coverage (Fig. 12). Far-ultraviolet spectra have been obtained for all but PS16dtm. While a single blackbody spectrum extrapolated from optical and near-ultraviolet photometric observations captures the overall shape of the ultraviolet spectra, the continuum often appears to be more luminous than what the blackbody predicts at the far-ultraviolet range.
Ultraviolet spectra have revealed the presence of collisionally excited broad emission lines, such as Ly, C IV, N V and Si IV (Cenko et al., 2016; Brown et al., 2018; Blagorodnova et al., 2019), similar to those seen in QSOs. On the other hand, the nitrogen-to-carbon ratios in these TDEs are anomalously high compared to typical QSOs, thus connections of TDEs with nitrogen-rich QSOs have been suggested (Cenko et al., 2016; Kochanek, 2016).
All of these TDEs, except PS16dtm, also lack the Mg ii emission that is commonly seen in QSOs. Mg ii has an ionization potential of 15 eV. The Mg ii emission arises from low ionization regions where the gas is at least partially neutral. If a hard continuum is present, the majority of the Mg atoms may be photoionized to Mg iii or higher states and thus lead to the weakening or absence of Mg ii features. The same hard spectrum may also be responsible for the production of Bowen fluorescence emission. However, as noted by Leloudas et al. (2019), this hard ionizing source cannot be accounted for entirely by the near ultraviolet and optical blackbody with a temperature on the order of K, as it provides too few photons at high energies.
Unlike in the optical spectra, absorption features have been identified in ultraviolet spectra. These are seen as broad ( km s-1) features in iPTF16fnl, iPTF15af, PS16dtm, and AT 2018zr and as narrow (few 100 km s-1) ones in ASASSN-14li. The broad absorption features are seen in the high-ionization lines C IV, N V, and Si IV, similar to what is seen in Broad Absorption Line Quasars (BALQSOs), and tend to be blueshifted by – km s-1. The absorption troughs can either be attached (e.g. iPTF16fnl and iPTF15af) or detached (e.g. AT 2018zr) from their emission peaks, which might be due to a viewing angle difference. The broad blueshifted absorption lines are interpreted as evidence for fast outflows of material accelerated by radiation. Although the driving mechanism for these outflows in the broad absorption-line TDEs is still unclear, it has been suggested that super-Eddington accretion (e.g. Strubbe and Quataert, 2009; Strubbe and Quataert, 2011), which might be common in TDEs around supermassive black holes with mass , could be capable of driving outflows to such high velocities ( km s-1).
A sequence of ultraviolet spectra was obtained for two TDEs, iPTF16fnl and AT 2018zr, revealing evolution in the absorption features. In iPTF16fnl, the ultraviolet emission features are found to be redshifted relative to the systematic velocity from the earlier spectra. This apparent redshift has been interpreted as a result of fast outflows Brown et al. (2018), where blueshifted broad absorption troughs eclipsed the bluer portion of the emission line profiles. In AT 2018zr, Hung et al. (2019) found that the high-ionization broad absorption lines only appeared 2 months after maximum light (Fig. 12). Expanding the sample of TDEs with multi-epoch ultraviolet spectroscopy will test whether this timescale is linked to the timescale of super-Eddington outflows, and whether outflows are ubiquitous among TDEs.
In AT 2018zr, absorption features are also seen in the Balmer series and the metastable helium lines He i and He i at optical wavelengths, with a FWHM of 3000 km s-1 and displaced by the same velocity () as the ultraviolet absorption features (Hung et al., 2019). Such optical absorption features are rarely detected even in BALQSOs. Photoionization models indicate both high density () and high column density () requirements must be met in order to produce the observed hydrogen and helium absorption lines (Hamann et al., 2019). Recent work on radiative transfer modelling of TDE outflows suggests that the column densities in TDE winds are as high as cm-2, depending on the inclination angle of the disk (Parkinson et al., 2020). This result is in agreement with the lower limit derived from the observed ultraviolet absorption lines.
5 TDE Selection: Building a Sample of Events
We now distill the discussion of the previous sections on the photometric and spectroscopic properties into a set of selection criteria to define a sample of “secure” optical-ultraviolet TDEs (Table 5). Due to the lack of a consistent theory that explains all optical-ultraviolet TDE emission properties, our selection criteria are primarily motivated by observations. We realize that there is a somewhat circular logic here, identifying new events as optical-ultraviolet TDEs based on those previously claimed to be such. There are likely additional TDEs that do not match these criteria, and therefore, in order to truly map the population of events, we must keep an open mind regarding newly discovered types of flares (yet, we must also be cautious of calling every new type of transient a TDE). Once a large enough sample is available we can revisit the criteria. That being said, after almost one decade of collecting optical-ultraviolet data of transients found in galaxy centers, some clear patterns have emerged. Below we summarize four key properties that we use to compile the events in Table 5, which we consider to be a robust sample of optical-ultraviolet TDEs. These criteria have been applied to events claimed to be TDEs in the literature.
-
•
Nuclear. That is, a small offset () between the host centroid and the flare. This criterion is motivated by the assumptions that SMBHs in quiescent galaxies reside at the gravitational center of their host galaxy. For the purpose of populating Table 5 we use a cut of ”, which is sufficient to establish a nuclear detection for the surveys summarised in section 2.
-
•
Spectroscopic. As discussed in Section 4, nuclear flares that have blue colors, all have similar spectroscopic properties: broad helium and/or hydrogen on an otherwise predominantly featureless spectrum. In Table 5 we include also PS1-11af even though it showed no obvious features in its optical spectrum.
-
•
Photometric. As discussed in Section 3, events that satisfy the above criteria share two key photometric properties: a high blackbody temperature and no signs of cooling after peak luminosity. For the purpose of populating Table 5 we require K near peak. We note that for almost all TDEs in Table 5, the temperature measurements include ultraviolet photometry (from Swift or GALEX) and in most cases multiple ultraviolet observations allow a measurement of temperature evolution (see Table 5). The three TDEs from PTF are an exception, their blackbody temperatures are measured from the optical spectrum obtained near the peak of the flare (see Arcavi et al. 2014).
-
•
Quiescent galaxy / not AGN. This requirement is the most controversial because TDEs can also happen in AGN. Perhaps the TDE rate is even enhanced in AGN (Stone et al., 2018), and they might manifest themselves with distinct observational characteristics (Chan et al., 2019; Trakhtenbrot et al., 2019a). Unfortunately, the origin of large amplitude AGN variability is poorly understood and such flares can masquerade as TDEs (see the One-off Events and Imposters Chapter). For the purpose of populating Table 5 we define an event to be in an AGN if one of the following three properties is observed: (i) there is statistically-significant variability before the main flare, (ii) the signature of a dusty torus is detected using WISE colors (Stern et al., 2012), or (iii) the host is classified as a Seyfert galaxy using the BPT diagram (Baldwin et al., 1981). These criteria select a relatively pure AGN sample. We do not reject events based on observational signs that indicate recent (but not on-going) activity of the supermassive black hole, such as a LINER spectrum (Heckman, 1980) or relic radio lobes.
The above selection criteria yield 33 sources presented in Table 5.
A few key photometric properties of our optical-ultraviolet TDE sample are presented in Table 5. For all sources, these features have been measured using the method presented in van Velzen et al. (2019b); van Velzen et al. (2020a). Central to this approach is the use of a model that includes both the blackbody light curve shape and temperature evolution. As such, the free parameters in this model can be measured simultaneously using all available photometric observations. The blackbody temperature can be kept constant in the model in order to obtain the mean temperature (). Alternatively, a linear temperature change with time () can also be extracted. For the majority of the TDEs in our sample this approach is sufficient because the measured values of are consistent with zero (Table 5). However to allow for more flexibility (e.g., a relatively rapid temperature increase as observed for AT 2018zr), the light curve properties reported in Table 5 are obtained using a linear interpolation of the temperature on a grid with a spacing of 30 days (see van Velzen et al. 2020a for details and Fig. 2 for examples of the resulting temperature curves). In Table 5 we report both the exponential decay rate measured for the first 100 days of post-peak observations () and the timescale measured from a power-law decay as applied to the first year of post-peak observations (). For the power-law decay, we report both the results for a fixed power-law index (at the canonical value ), as well as the results obtained when this index is left as a free parameter.
| Discovery | IAU | R.A. / Decl. | Peaka | Redshift | Peakb | Spectroscopic | Host massd | Discovery |
|---|---|---|---|---|---|---|---|---|
| Name | Name | Date | Type (Subtype)c | (log ) | Ref.e | |||
| SDSS-TDE2 | 23:23:48.61 01:08:10.2 | 2007-06-15∗ | 0.2515 | H | 1 | |||
| PTF-09ge | 14:57:03.18 49:36:40.9 | 2009-06-10 | 0.064 | He (Fe?) | 2 | |||
| PTF-09axc | 14:53:13.07 22:14:32.2 | 2009-07-04 | 0.1146 | H | 2 | |||
| PTF-09djl | 16:33:55.97 30:14:16.6 | 2009-08-05 | 0.184 | H | 2 | |||
| PS1-10jh | 16:09:28.27 53:40:23.9 | 2010-07-16 | 0.1696 | He | 3 | |||
| PS1-11af | 09:57:26.81 03:14:00.9 | 2011-01-17 | 0.4046 | Unknown | 4 | |||
| ASASSN-14ae | 11:08:40.11 34:05:52.2 | 2014-01-27∗ | 0.0436 | H H+He | 5 | |||
| ASASSN-14li | 12:48:15.23 17:46:26.4 | 2014-11-28∗ | 0.02058 | H+He (N) | 6 | |||
| iPTF-15af | 08:48:28.13 22:03:33.4 | 2015-02-08 | 0.07897 | H+He (N+O) | 7 | |||
| ASASSN-15oi | 20:39:09.14 30:45:20.6 | 2015-08-13∗ | 0.0484 | He (Fe?+O?) | 8 | |||
| OGLE16aaa | 01:07:20.76 64:16:20.4 | 2016-01-27 | 0.1655 | H+He | 9 | |||
| iPTF-16axa | 17:03:34.34 30:35:36.6 | 2016-05-15∗ | 0.108 | H+He (N+O?) | 10 | |||
| iPTF-16fnl | 00:29:57.05 32:53:37.2 | 2016-08-26 | 0.0163 | H+He (N) | 11 | |||
| PS17dhz | AT 2017eqx | 22:26:48.37 17:08:52.3 | 2017-06-06 | 0.1089 | H+He He (N+Fe?) | 12 | ||
| PS18kh | AT 2018zr | 07:56:54.54 34:15:43.6 | 2018-03-03 | 0.071 | H | 13 | ||
| ZTF18aahqkbt | AT 2018bsi | 08:15:26.63 45:35:32.0 | 2018-04-09∗ | 0.051 | H+He (N) | 14 | ||
| ASASSN-18ul | AT 2018fyk | 22:50:16.09 44:51:53.5 | 2018-07-18∗ | 0.059 | H+He (O+Fe) | 15 | ||
| ASASSN-18pg | AT 2018dyb | 16:10:58.87 60:55:24.3 | 2018-08-16 | 0.018 | H+He (N+O) | 16 | ||
| ATLAS18way | AT 2018hco | 01:07:33.63 23:28:34.2 | 2018-10-10 | 0.088 | H | 14 | ||
| ASASSN-18zj | AT 2018hyz | 10:06:50.88 01:41:33.9 | 2018-11-05∗ | 0.04573 | H | 14 | ||
| ATLAS18yzs | AT 2018iih | 17:28:03.92 30:41:31.5 | 2018-11-20 | 0.212 | He | 14 | ||
| ZTF18actaqdw | AT 2018lni | 04:09:37.65 73:53:41.6 | 2018-12-08 | 0.138 | H+He (N+O) | 14 | ||
| ZTF19aabbnzo | AT 2018lna | 07:03:18.64 23:01:44.6 | 2019-01-25 | 0.091 | H+He (N?) | 14 | ||
| ZTF19aakswrb | AT 2019bhf | 15:09:15.97 16:14:22.5 | 2019-02-25 | 0.1206 | H | 14 | ||
| ASASSN-19bt | AT 2019ahk | 07:00:11.39 66:02:24.7 | 2019-03-06 | 0.0262 | H | 17 | ||
| ZTF19aakiwze | AT 2019cho | 12:55:09.20 49:31:09.9 | 2019-02-21 | 0.193 | H+He (N) | 14 | ||
| ASASSN-19dj | AT 2019azh | 08:13:16.95 22:38:53.8 | 2019-03-16 | 0.0222 | H+He | 18 | ||
| ZTF19aapreis | AT 2019dsg | 20:57:02.97 14:12:16.2 | 2019-04-27 | 0.0512 | H+He (N+O) | 14 | ||
| Gaia19bpt | AT 2019ehz | 14:09:41.90 55:29:27.7 | 2019-05-08 | 0.074 | H | 14 | ||
| ZTF19abidbya | AT 2019lwu | 23:11:12.30 01:00:10.8 | 2019-07-26 | 0.117 | H | 14 | ||
| ZTF19abhhjcc | AT 2019meg | 18:45:16.19 44:26:18.9 | 2019-08-01 | 0.152 | H | 14 | ||
| ATLAS19qqu | AT 2019mha | 16:16:27.78 56:25:56.3 | 2019-08-09 | 0.148 | H | 14 | ||
| ZTF19abzrhgq | AT 2019qiz | 04:46:37.88 10:13:34.8 | 2019-10-05 | 0.0151 | H+He (N) | 14 |
aThe peak date is obtained using a light curve model to interpolate between gaps in the data (see van Velzen et al. 2020a). The sources that are only detected post-peak are indicated with an asterisk - for these we provide the date of the first detection. bThe maximum observed optical luminosity, k-corrected to the -band in the rest-frame of the TDE using the best-fit blackbody temperature to make the spectral correction. cArrows denote a change that occurred in the spectral type with time. dThe host stellar mass as estimated from archival optical photometry, obtained before the TDE occurred (see van Velzen et al. 2020a). eThe discovery paper for this source (first journal article to present a classification and observed properties): 1: van Velzen et al. (2011), 2: Arcavi et al. (2014), 3: Gezari et al. (2012), 4: Chornock et al. (2014), 5: Holoien et al. (2014), 6: Miller (2015), 7: Blagorodnova et al. (2019), 8: Holoien et al. (2016a), 9: Wyrzykowski et al. (2017), 10: Hung et al. (2017), 11: Blagorodnova et al. (2017), 12:(Nicholl et al., 2019), 13: Holoien et al. (2019a), 14: van Velzen et al. (2020a), 15: Wevers et al. (2019b), 16: Leloudas et al. (2019), 17: Holoien et al. (2019c), 18: Liu et al. (2019)
Notes — Light curve features are derived using the method presented in van Velzen et al. (2020a). The column lists the peak blackbody luminosity and is the mean blackbody temperature measured during the first 100 days post maximum light. A measurement of a linear temperature change during the first year of observations is listed as (only estimated for sources with sufficient light curve coverage). lists the best-fit time of peak, or, when no pre-peak detections are available, the time of the first detection. The parameters and list the result of fitting a Gaussian rise and exponential decay, respectively, to the light curve, while and are the free parameters of a power-law decay (). The last column lists the decay timescale obtained when the power-law index is fixed at .
6 Rate and Luminosity Function
Measurements of the TDE rate have the potential to reveal how stars are fed to the loss cone (see the Rates Chapter in this book), which in turn can teach us about stellar dynamics in galaxy centers. This measurement, however, is not trivial, because it requires both a clear set of criteria for identifying TDEs and an understanding of the selection efficiency and biases of each search.
The first comprehensive estimate of disruption rates was based on the TDE search in SDSS imaging data (van Velzen et al., 2011) and is presented by van Velzen and Farrar (2014). Since the SDSS search was based solely on photometry, the selection function was relatively straightforward. The SDSS-selected TDEs were not detected pre-peak. However, by using a light curve model based on the well-sampled TDE PS1-10jh (Gezari et al., 2012) this limitation can be addressed. The remaining systematic uncertainty due to the uncertainty of the TDE light curve was found to be a factor .
The approach of van Velzen and Farrar (2014) is to compute the detection efficiency of the two TDEs separately, and report the mean rate based on the mean efficiency :
| (1) |
Here is the number of galaxies that were observed in the survey duration . This approach yields a rate of galaxy-1 year-1 (the sub/super scripts denote the statistical uncertainty while the range in parentheses approximates the systematic uncertainty due to the assumption of a light curve model).
Based on two TDEs detected by the ASAS-SN survey (ASASSN-14ae and ASASSN-14l), Holoien et al. (2016b) reported a rate of galaxy-1 year-1 (here the range in parentheses denotes the 90% confidence level statistical uncertainty). The authors used a similar approach to Eq. 1 and computed the efficiency under the assumption that the TDE absolute -band peak magnitudes are uniformly distributed between and . This assumption might be why Holoien et al. (2016b) obtained a slightly higher rate compared to van Velzen and Farrar (2014), who included SDSS-TDE2, an event that is brighter at peak (; Table 5) than the range assumed by Holoien et al. (2016b), although we note that the two estimates are consistent within their Poisson uncertainty.
Samples based on luminous events produce a lower inferred rate according to Eq. 1, since more luminous events have a higher efficiency (they can be detected to larger distance). Even when combining more luminous and less luminous events, the more luminous ones dominate the mean efficiency , thus Eq. 1, in general, always yields a rate that is weighted more strongly toward more luminous events. To solve this issue we have to consider the TDE luminosity function.
The fact that the small flux-limited samples of TDEs span a wide range of luminosities (for e.g. the two TDEs found in the SDSS search had a luminosity difference of almost an order of magnitude), informs us that the luminosity function can not be flat: faint events must be more common than luminous ones. This effect is quantified in van Velzen (2018), who combine events from different surveys under the assumption that each survey samples the same TDE population. This approach yields a measure of the shape of the luminosity function: (with the rest-frame g-band peak luminosity). Since the faint events dominate, van Velzen (2018) find that extrapolating the observed absolute rate from SDSS to the faintest observed TDEs increases the inferred mean rate to about galaxy-1 year-1. Hung et al. (2018) find a similar result of galaxy-1 year-1 by applying the van Velzen (2018) luminosity function to compute the rate from the three TDEs discovered by the iPTF survey.
Since the -band approaches the Rayleigh-Jeans tail of the SED, the steep luminosity function does not translate directly into a steep bolometric luminosity function. For example, van Velzen et al. (2020a) find that the TDE H+He and TDE H have a similar peak bolometric luminosity and occur at a similar rate in flux-limited samples, but since TDE H+He have a higher mean temperature, their optical luminosity is lower and their intrinsic rate is higher. Therefore, the temperature or radius of the optical-ultraviolet photosphere plays an important role for determining the shape of the optical luminosity function.
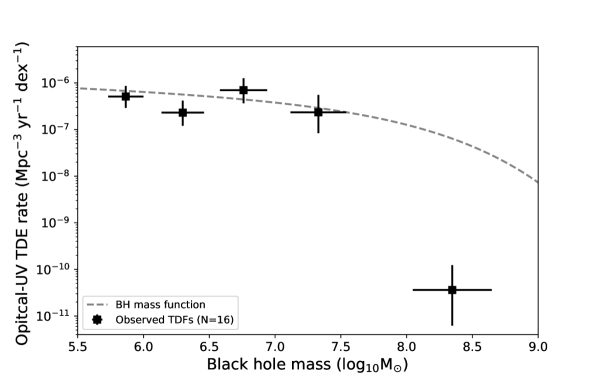
The work by van Velzen (2018) also enables the first measurement of the TDE black-hole mass function. Figure 13 show the TDE rate as a function of black-hole mass, as estimated based on the – relation with velocity dispersion measurement from Wevers et al. (2017, 2019b). The lack of TDEs from high mass black holes is consistent with the suppression of the TDE rate by the “direct capture” of stars due to the black-hole event horizon (Hills, 1975).
7 Concluding Remarks
While the set of known optical-ultraviolet TDEs is rapidly growing, many questions remain open regarding their nature, emission properties, and true diversity. Most prominent is the question of their emission source—is the emission coming entirely from outer shocks, entirely from reprocessed accretion emission, or some combination of both? Answering this question could help explain the observed emission properties and perhaps their expected diversity, thus helping to identify more events correctly.
Observationally, the origin in the diversity of TDE spectral features, such as the species seen, the line profiles measured and their evolution, and the differences between the optical and ultraviolet spectra, will likely continue to be topics of study. In addition, the scale of the photometric diversity is tied to the question of how many rapidly declining events are being missed, affecting our ability to accurately estimate TDE rates and learn about stellar dynamics in galaxy centers.
As more events are found, we will be able to continue to explore the classes of transients occurring in galaxy centers—increasing our sensitivity to new types of TDEs, mapping the diversity of the known types, and learning to distinguish between them and galaxy-central events that are not related to TDEs. Hopefully, this will help inform theoretical models on which disruption, accretion and emission mechanisms are realized in nature. In turn, such models could help find more events, and focus observational resources on the most critical phases and wavelengths.
One of the main motivations for studying TDEs has been to reveal the population of otherwise quiescent SMBHs. Some of the questions above are still hindering the realization of the full potential of TDEs on that front. However, in the mean time, optical-ultraviolet TDEs are teaching us a lot about accretion physics, emission mechanisms, galaxy dynamics, and more. Given the increasing detection rate of (optical) transients, combined with added attention and followup resources invested in transients found in galaxy centers, we will learn more about all of these topics and likely make new and unexpected discoveries along the way.
Acknowledgements.
We thank the International Space Science Institute for hosting us on several occasions to discuss the content and structure of this chapter, and its coordination with other chapters in this book. We are grateful to the two anonymous referees for their insightful comments and helpful suggestions. We thank Thomas Wevers for useful comments. S. van Velzen is supported by the James Arthur Postdoctoral Fellowship. F. Onori acknowledges the support of the H2020 Hemera program, grant agreement No 730970, and the support from European Research Council Consolidator Grant 647208. I. Arcavi is a CIFAR Azrieli Global Scholar in the Gravity and the Extreme Universe Program and acknowledges support from that program, from the European Research Council (ERC) under the European Union’s Horizon 2020 research and innovation program (grant agreement number 852097), from the Israel Science Foundation (grant numbers 2108/18 and 2752/19), from the United States - Israel Binational Science Foundation (BSF), and from the Israeli Council for Higher Education Alon Fellowship.References
- Alexander et al. (2016) K.D. Alexander, E. Berger, J. Guillochon, B.A. Zauderer, P.K.G. Williams, Discovery of an Outflow from Radio Observations of the Tidal Disruption Event ASASSN-14li. Astrophys. J. Lett. 819, 25 (2016). doi:10.3847/2041-8205/819/2/L25
- Arcavi et al. (2014) I. Arcavi, A. Gal-Yam, M. Sullivan, Y.-C. Pan, S.B. Cenko, A. Horesh, E.O. Ofek, A. De Cia, L. Yan, C.-W. Yang, D.A. Howell, D. Tal, S.R. Kulkarni, S.P. Tendulkar, S. Tang, D. Xu, A. Sternberg, J.G. Cohen, J.S. Bloom, P.E. Nugent, M.M. Kasliwal, D.A. Perley, R.M. Quimby, A.A. Miller, C.A. Theissen, R.R. Laher, A Continuum of H- to He-rich Tidal Disruption Candidates With a Preference for E+A Galaxies. Astrophys. J. 793, 38 (2014). doi:10.1088/0004-637X/793/1/38
- Auchettl et al. (2017) K. Auchettl, J. Guillochon, E. Ramirez-Ruiz, New Physical Insights about Tidal Disruption Events from a Comprehensive Observational Inventory at X-Ray Wavelengths. Astrophys. J. 838, 149 (2017). doi:10.3847/1538-4357/aa633b
- Bade et al. (1996) N. Bade, S. Komossa, M. Dahlem, Detection of an extremely soft X-ray outburst in the HII-like nucleus of NGC 5905. Astron. & Astrophys. 309, 35–38 (1996)
- Baldwin et al. (1981) J.A. Baldwin, M.M. Phillips, R. Terlevich, Classification parameters for the emission-line spectra of extragalactic objects. Publ. Astron. Soc. Pac. 93, 5–19 (1981). doi:10.1086/130766
- Bellm et al. (2019) E.C. Bellm, S.R. Kulkarni, M.J. Graham, R. Dekany, R.M. Smith, R. Riddle, F.J. Masci, G. Helou, T.A. Prince, S.M. Adams, C. Barbarino, T. Barlow, J. Bauer, R. Beck, J. Belicki, R. Biswas, N. Blagorodnova, D. Bodewits, B. Bolin, V. Brinnel, T. Brooke, B. Bue, M. Bulla, R. Burruss, S.B. Cenko, C.-K. Chang, A. Connolly, M. Coughlin, J. Cromer, V. Cunningham, K. De, A. Delacroix, V. Desai, D.A. Duev, G. Eadie, T.L. Farnham, M. Feeney, U. Feindt, D. Flynn, A. Franckowiak, S. Frederick, C. Fremling, A. Gal-Yam, S. Gezari, M. Giomi, D.A. Goldstein, V.Z. Golkhou, A. Goobar, S. Groom, E. Hacopians, D. Hale, J. Henning, A.Y.Q. Ho, D. Hover, J. Howell, T. Hung, D. Huppenkothen, D. Imel, W.-H. Ip, Ž. Ivezić, E. Jackson, L. Jones, M. Juric, M.M. Kasliwal, S. Kaspi, S. Kaye, M.S.P. Kelley, M. Kowalski, E. Kramer, T. Kupfer, W. Landry, R.R. Laher, C.-D. Lee, H.W. Lin, Z.-Y. Lin, R. Lunnan, M. Giomi, A. Mahabal, P. Mao, A.A. Miller, S. Monkewitz, P. Murphy, C.-C. Ngeow, J. Nordin, P. Nugent, E. Ofek, M.T. Patterson, B. Penprase, M. Porter, L. Rauch, U. Rebbapragada, D. Reiley, M. Rigault, H. Rodriguez, J. van Roestel, B. Rusholme, J. van Santen, S. Schulze, D.L. Shupe, L.P. Singer, M.T. Soumagnac, R. Stein, J. Surace, J. Sollerman, P. Szkody, F. Taddia, S. Terek, A. Van Sistine, S. van Velzen, W.T. Vestrand, R. Walters, C. Ward, Q.-Z. Ye, P.-C. Yu, L. Yan, J. Zolkower, The Zwicky Transient Facility: System Overview, Performance, and First Results. Publ. Astron. Soc. Pac. 131(1), 018002 (2019). doi:10.1088/1538-3873/aaecbe
- Blagorodnova et al. (2017) N. Blagorodnova, S. Gezari, T. Hung, S.R. Kulkarni, S.B. Cenko, D.R. Pasham, L. Yan, I. Arcavi, S. Ben-Ami, B.D. Bue, T. Cantwell, Y. Cao, A.J. Castro-Tirado, R. Fender, C. Fremling, A. Gal-Yam, A.Y.Q. Ho, A. Horesh, G. Hosseinzadeh, M.M. Kasliwal, A.K.H. Kong, R.R. Laher, G. Leloudas, R. Lunnan, F.J. Masci, K. Mooley, J.D. Neill, P. Nugent, M. Powell, A.F. Valeev, P.M. Vreeswijk, R. Walters, P. Wozniak, iPTF16fnl: A Faint and Fast Tidal Disruption Event in an E+A Galaxy. Astrophys. J. 844, 46 (2017). doi:10.3847/1538-4357/aa7579
- Blagorodnova et al. (2019) N. Blagorodnova, S.B. Cenko, S.R. Kulkarni, I. Arcavi, J.S. Bloom, G. Duggan, A.V. Filippenko, C. Fremling, A. Horesh, G. Hosseinzadeh, E. Karamehmetoglu, A. Levan, F.J. Masci, P.E. Nugent, D.R. Pasham, S. Veilleux, R. Walters, L. Yan, W. Zheng, The Broad Absorption Line Tidal Disruption Event iPTF15af: Optical and Ultraviolet Evolution. Astrophys. J. 873(1), 92 (2019). doi:10.3847/1538-4357/ab04b0
- Blanchard et al. (2017) P.K. Blanchard, M. Nicholl, E. Berger, J. Guillochon, R. Margutti, R. Chornock, K.D. Alexander, J. Leja, M.R. Drout, PS16dtm: A Tidal Disruption Event in a Narrow-line Seyfert 1 Galaxy. Astrophys. J. 843, 106 (2017). doi:10.3847/1538-4357/aa77f7
- Bogdanović et al. (2004) T. Bogdanović, M. Eracleous, S. Mahadevan, S. Sigurdsson, P. Laguna, Tidal Disruption of a Star by a Black Hole: Observational Signature. Astrophys. J. 610, 707–721 (2004). doi:10.1086/421758
- Bowen (1928) I.S. Bowen, The origin of the nebular lines and the structure of the planetary nebulae. Astrophys. J. 67, 1–15 (1928). doi:10.1086/143091
- Brotherton et al. (2001) M.S. Brotherton, H.D. Tran, R.H. Becker, M.D. Gregg, S.A. Laurent-Muehleisen, R.L. White, Composite Spectra from the FIRST Bright Quasar Survey. Astrophys. J. 546, 775–781 (2001). doi:10.1086/318309
- Brown et al. (2016) J.S. Brown, B.J. Shappee, T. W.-S Holoien, K.Z. Stanek, C.S. Kochanek, J.L. Prieto, Hello Darkness My Old Friend: The Fading of the Nearby TDE ASASSN-14ae. Mon. Not. R. Astron. Soc. 462, 3993–4000 (2016). doi:10.1093/mnras/stw1928
- Brown et al. (2017a) J.S. Brown, T.W.-S. Holoien, K. Auchettl, K.Z. Stanek, C.S. Kochanek, B.J. Shappee, J.L. Prieto, D. Grupe, The Long Term Evolution of ASASSN-14li. Mon. Not. R. Astron. Soc. 466(4), 4904–4916 (2017a). doi:10.1093/mnras/stx033
- Brown et al. (2017b) J.S. Brown, T.W.-S. Holoien, K. Auchettl, K.Z. Stanek, C.S. Kochanek, B.J. Shappee, J.L. Prieto, D. Grupe, The Long Term Evolution of ASASSN-14li. Mon. Not. R. Astron. Soc. 466, 4904–4916 (2017b). doi:10.1093/mnras/stx033
- Brown et al. (2018) J.S. Brown, C.S. Kochanek, T.W.-S. Holoien, K.Z. Stanek, K. Auchettl, B.J. Shappee, J.L. Prieto, N. Morrell, E. Falco, J. Strader, L. Chomiuk, R. Post, S. Villanueva Jr., S. Mathur, S. Dong, P. Chen, S. Bose, The ultraviolet spectroscopic evolution of the low-luminosity tidal disruption event iPTF16fnl. Mon. Not. R. Astron. Soc. 473, 1130–1144 (2018). doi:10.1093/mnras/stx2372
- Cannizzo et al. (1990) J.K. Cannizzo, H.M. Lee, J. Goodman, The disk accretion of a tidally disrupted star onto a massive black hole. Astrophys. J. 351, 38–46 (1990). doi:10.1086/168442
- Cenko et al. (2016) S.B. Cenko, A. Cucchiara, N. Roth, S. Veilleux, J.X. Prochaska, L. Yan, J. Guillochon, W.P. Maksym, I. Arcavi, N.R. Butler, A.V. Filippenko, A.S. Fruchter, S. Gezari, D. Kasen, A.J. Levan, J.M. Miller, D.R. Pasham, E. Ramirez-Ruiz, L.E. Strubbe, N.R. Tanvir, F. Tombesi, An Ultraviolet Spectrum of the Tidal Disruption Flare ASASSN-14li. Astrophys. J. Lett. 818, 32 (2016). doi:10.3847/2041-8205/818/2/L32
- Chambers (2007) K.C. Chambers, The PS1 System and Science Mission, in Bulletin of the AAS, vol. 38, 2007, p. 995
- Chambers et al. (2016) K.C. Chambers, E.A. Magnier, N. Metcalfe, H.A. Flewelling, M.E. Huber, C.Z. Waters, L. Denneau, P.W. Draper, D. Farrow, D.P. Finkbeiner, C. Holmberg, J. Koppenhoefer, P.A. Price, R.P. Saglia, E.F. Schlafly, S.J. Smartt, W. Sweeney, R.J. Wainscoat, W.S. Burgett, T. Grav, J.N. Heasley, K.W. Hodapp, R. Jedicke, N. Kaiser, R.-P. Kudritzki, G.A. Luppino, R.H. Lupton, D.G. Monet, J.S. Morgan, P.M. Onaka, C.W. Stubbs, J.L. Tonry, E. Banados, E.F. Bell, R. Bender, E.J. Bernard, M.T. Botticella, S. Casertano, S. Chastel, W.-P. Chen, X. Chen, S. Cole, N. Deacon, C. Frenk, A. Fitzsimmons, S. Gezari, C. Goessl, T. Goggia, B. Goldman, E.K. Grebel, N.C. Hambly, G. Hasinger, A.F. Heavens, T.M. Heckman, R. Henderson, T. Henning, M. Holman, U. Hopp, W.-H. Ip, S. Isani, C.D. Keyes, A. Koekemoer, R. Kotak, K.S. Long, J.R. Lucey, M. Liu, N.F. Martin, B. McLean, E. Morganson, D.N.A. Murphy, M.A. Nieto-Santisteban, P. Norberg, J.A. Peacock, E.A. Pier, M. Postman, N. Primak, C. Rae, A. Rest, A. Riess, A. Riffeser, H.W. Rix, S. Roser, E. Schilbach, A.S.B. Schultz, D. Scolnic, A. Szalay, S. Seitz, B. Shiao, E. Small, K.W. Smith, D. Soderblom, A.N. Taylor, A.R. Thakar, J. Thiel, D. Thilker, Y. Urata, J. Valenti, F. Walter, S.P. Watters, S. Werner, R. White, W.M. Wood-Vasey, R. Wyse, The Pan-STARRS1 Surveys. ArXiv e-prints (2016)
- Chan et al. (2019) C.-H. Chan, T. Piran, J.H. Krolik, D. Saban, Tidal Disruption Events in Active Galactic Nuclei. Astrophys. J. 881(2), 113 (2019). doi:10.3847/1538-4357/ab2b40
- Chornock et al. (2014) R. Chornock, E. Berger, S. Gezari, B.A. Zauderer, A. Rest, L. Chomiuk, A. Kamble, A.M. Soderberg, I. Czekala, J. Dittmann, M. Drout, R.J. Foley, W. Fong, M.E. Huber, R.P. Kirshner, A. Lawrence, R. Lunnan, G.H. Marion, G. Narayan, A.G. Riess, K.C. Roth, N.E. Sanders, D. Scolnic, S.J. Smartt, K. Smith, C.W. Stubbs, J.L. Tonry, W.S. Burgett, K.C. Chambers, H. Flewelling, K.W. Hodapp, N. Kaiser, E.A. Magnier, D.C. Martin, J.D. Neill, P.A. Price, R. Wainscoat, The Ultraviolet-bright, Slowly Declining Transient PS1-11af as a Partial Tidal Disruption Event. Astrophys. J. 780, 44 (2014). doi:10.1088/0004-637X/780/1/44
- Dai et al. (2018) L. Dai, J.C. McKinney, N. Roth, E. Ramirez-Ruiz, M.C. Miller, A Unified Model for Tidal Disruption Events. Astrophys. J. 859, 20 (2018). doi:10.3847/2041-8213/aab429
- Dong et al. (2016) S. Dong, B.J. Shappee, J.L. Prieto, S.W. Jha, K.Z. Stanek, T.W.-S. Holoien, C.S. Kochanek, T.A. Thompson, N. Morrell, I.B. Thompson, U. Basu, J.F. Beacom, D. Bersier, J. Brimacombe, J.S. Brown, F. Bufano, P. Chen, E. Conseil, A.B. Danilet, E. Falco, D. Grupe, S. Kiyota, G. Masi, B. Nicholls, F. Olivares E., G. Pignata, G. Pojmanski, G.V. Simonian, D.M. Szczygiel, P.R. Woźniak, ASASSN-15lh: A highly super-luminous supernova. Science 351, 257–260 (2016). doi:10.1126/science.aac9613
- Esquej et al. (2007) P. Esquej, R.D. Saxton, M.J. Freyberg, A.M. Read, B. Altieri, M. Sanchez-Portal, G. Hasinger, Candidate tidal disruption events from the XMM-Newton slew survey. Astron. & Astrophys. 462, 49–52 (2007). doi:10.1051/0004-6361:20066072
- Esquej et al. (2008) P. Esquej, R.D. Saxton, S. Komossa, A.M. Read, M.J. Freyberg, G. Hasinger, D.A. García-Hernández, H. Lu, J.R. Zaurín, M. Sánchez-Portal, H. Zhou, Evolution of tidal disruption candidates discovered by XMM-Newton. Astron. & Astrophys. 489, 543–554 (2008). doi:10.1051/0004-6361:200810110
- Frederick et al. (2019) S. Frederick, S. Gezari, M.J. Graham, S.B. Cenko, S. van Velzen, D. Stern, N. Blagorodnova, S.R. Kulkarni, L. Yan, K. De, U.C. Fremling, T. Hung, E. Kara, D.L. Shupe, C. Ward, E.C. Bellm, R. Dekany, D.A. Duev, U. Feindt, M. Giomi, T. Kupfer, R.R. Laher, F.J. Masci, A.A. Miller, J.D. Neill, C.-C. Ngeow, M.T. Patterson, M. Porter, B. Rusholme, J. Sollerman, R. Walters, A New Class of Changing-look LINERs. Astrophys. J. 883(1), 31 (2019). doi:10.3847/1538-4357/ab3a38
- Frieman et al. (2008) J.A. Frieman, B. Bassett, A. Becker, C. Choi, D. Cinabro, F. DeJongh, D.L. Depoy, B. Dilday, M. Doi, P.M. Garnavich, C.J. Hogan, J. Holtzman, M. Im, S. Jha, R. Kessler, K. Konishi, H. Lampeitl, J. Marriner, J.L. Marshall, D. McGinnis, G. Miknaitis, R.C. Nichol, J.L. Prieto, A.G. Riess, M.W. Richmond, R. Romani, M. Sako, D.P. Schneider, M. Smith, N. Takanashi, K. Tokita, K. van der Heyden, N. Yasuda, C. Zheng, J. Adelman-McCarthy, J. Annis, R.J. Assef, J. Barentine, R. Bender, R.D. Blandford, W.N. Boroski, M. Bremer, H. Brewington, C.A. Collins, A. Crotts, J. Dembicky, J. Eastman, A. Edge, E. Edmondson, E. Elson, M.E. Eyler, A.V. Filippenko, R.J. Foley, S. Frank, A. Goobar, T. Gueth, J.E. Gunn, M. Harvanek, U. Hopp, Y. Ihara, Ž. Ivezić, S. Kahn, J. Kaplan, S. Kent, W. Ketzeback, S.J. Kleinman, W. Kollatschny, R.G. Kron, J. Krzesiński, D. Lamenti, G. Leloudas, H. Lin, D.C. Long, J. Lucey, R.H. Lupton, E. Malanushenko, V. Malanushenko, R.J. McMillan, J. Mendez, C.W. Morgan, T. Morokuma, A. Nitta, L. Ostman, K. Pan, C.M. Rockosi, A.K. Romer, P. Ruiz-Lapuente, G. Saurage, K. Schlesinger, S.A. Snedden, J. Sollerman, C. Stoughton, M. Stritzinger, M. Subba Rao, D. Tucker, P. Vaisanen, L.C. Watson, S. Watters, J.C. Wheeler, B. Yanny, D. York, The Sloan Digital Sky Survey-II Supernova Survey: Technical Summary. Astron. J. 135, 338–347 (2008). doi:10.1088/0004-6256/135/1/338
- Gaskell and Rojas Lobos (2014) C.M. Gaskell, P.A. Rojas Lobos, The production of strong, broad He II emission after the tidal disruption of a main-sequence star by a supermassive black hole. Mon. Not. R. Astron. Soc. 438, 36–40 (2014). doi:10.1093/mnrasl/slt154
- Gezari et al. (2006) S. Gezari, D.C. Martin, B. Milliard, S. Basa, J.P. Halpern, K. Forster, P.G. Friedman, P. Morrissey, S.G. Neff, D. Schiminovich, M. Seibert, T. Small, T.K. Wyder, Ultraviolet Detection of the Tidal Disruption of a Star by a Supermassive Black Hole. Astrophys. J. Lett. 653, 25–28 (2006). doi:10.1086/509918
- Gezari et al. (2008) S. Gezari, S. Basa, D.C. Martin, G. Bazin, K. Forster, B. Milliard, J.P. Halpern, P.G. Friedman, P. Morrissey, S.G. Neff, D. Schiminovich, M. Seibert, T. Small, T.K. Wyder, UV/Optical Detections of Candidate Tidal Disruption Events by GALEX and CFHTLS. Astrophys. J. 676, 944–969 (2008). doi:10.1086/529008
- Gezari et al. (2009) S. Gezari, T. Heckman, S.B. Cenko, M. Eracleous, K. Forster, T.S. Gonçalves, D.C. Martin, P. Morrissey, S.G. Neff, M. Seibert, D. Schiminovich, T.K. Wyder, Luminous Thermal Flares from Quiescent Supermassive Black Holes. Astrophys. J. 698, 1367–1379 (2009). doi:10.1088/0004-637X/698/2/1367
- Gezari et al. (2012) S. Gezari, R. Chornock, A. Rest, M.E. Huber, K. Forster, E. Berger, P.J. Challis, J.D. Neill, D.C. Martin, T. Heckman, A. Lawrence, C. Norman, G. Narayan, R.J. Foley, G.H. Marion, D. Scolnic, L. Chomiuk, A. Soderberg, K. Smith, R.P. Kirshner, A.G. Riess, S.J. Smartt, C.W. Stubbs, J.L. Tonry, W.M. Wood-Vasey, W.S. Burgett, K.C. Chambers, T. Grav, J.N. Heasley, N. Kaiser, R.-P. Kudritzki, E.A. Magnier, J.S. Morgan, P.A. Price, An ultraviolet-optical flare from the tidal disruption of a helium-rich stellar core. Nature 485, 217–220 (2012). doi:10.1038/nature10990
- Gezari et al. (2013) S. Gezari, D.C. Martin, K. Forster, J.D. Neill, M. Huber, T. Heckman, L. Bianchi, P. Morrissey, S.G. Neff, M. Seibert, D. Schiminovich, T.K. Wyder, W.S. Burgett, K.C. Chambers, N. Kaiser, E.A. Magnier, P.A. Price, J.L. Tonry, The GALEX Time Domain Survey. I. Selection and Classification of Over a Thousand Ultraviolet Variable Sources. Astrophys. J. 766, 60 (2013). doi:10.1088/0004-637X/766/1/60
- Gezari et al. (2015) S. Gezari, R. Chornock, A. Lawrence, A. Rest, D.O. Jones, E. Berger, P.M. Challis, G. Narayan, PS1-10jh Continues to Follow the Fallback Accretion Rate of a Tidally Disrupted Star. Astrophys. J. Lett. 815, 5 (2015). doi:10.1088/2041-8205/815/1/L5
- Godoy-Rivera et al. (2017a) D. Godoy-Rivera, K.Z. Stanek, C.S. Kochanek, P. Chen, S. Dong, J.L. Prieto, B.J. Shappee, S.W. Jha, R.J. Foley, Y.-C. Pan, T.W.-S. Holoien, T.A. Thompson, D. Grupe, J.F. Beacom, The unexpected, long-lasting, UV rebrightening of the superluminous supernova ASASSN-15lh. Mon. Not. R. Astron. Soc. 466, 1428–1443 (2017a). doi:10.1093/mnras/stw3237
- Godoy-Rivera et al. (2017b) D. Godoy-Rivera, K.Z. Stanek, C.S. Kochanek, P. Chen, S. Dong, J.L. Prieto, B.J. Shappee, S.W. Jha, R.J. Foley, Y.-C. Pan, T.W.-S. Holoien, T.A. Thompson, D. Grupe, J.F. Beacom, The unexpected, long-lasting, UV rebrightening of the superluminous supernova ASASSN-15lh. Mon. Not. R. Astron. Soc. 466(2), 1428–1443 (2017b). doi:10.1093/mnras/stw3237
- Gomez et al. (2020) S. Gomez, M. Nicholl, P. Short, R. Margutti, K.D. Alexander, P.K. Blanchard, E. Berger, T. Eftekhari, S. Schulze, J. Anderson, I. Arcavi, R. Chornock, P.S. Cowperthwaite, L. Galbany, L.J. Herzog, D. Hiramatsu, G. Hosseinzadeh, T. Laskar, T.E. Müller Bravo, L. Patton, G. Terreran, The Tidal Disruption Event AT 2018hyz II: Light Curve Modeling of a Partially Disrupted Star. arXiv e-prints, 2003–05469 (2020)
- Greiner et al. (2000) J. Greiner, R. Schwarz, S. Zharikov, M. Orio, RX J1420.4+5334 - another tidal disruption event? Astron. & Astrophys. 362, 25–28 (2000)
- Grupe et al. (1999) D. Grupe, H.-C. Thomas, K.M. Leighly, RX J1624.9+7554: a new X-ray transient AGN. Astron. & Astrophys. 350, 31–34 (1999)
- Guillochon and Ramirez-Ruiz (2013) J. Guillochon, E. Ramirez-Ruiz, Hydrodynamical Simulations to Determine the Feeding Rate of Black Holes by the Tidal Disruption of Stars: The Importance of the Impact Parameter and Stellar Structure. Astrophys. J. 767, 25 (2013). doi:10.1088/0004-637X/767/1/25
- Guillochon et al. (2014) J. Guillochon, H. Manukian, E. Ramirez-Ruiz, PS1-10jh: The Disruption of a Main-sequence Star of Near-solar Composition. Astrophys. J. 783, 23 (2014). doi:10.1088/0004-637X/783/1/23
- Gültekin et al. (2009) K. Gültekin, D.O. Richstone, K. Gebhardt, T.R. Lauer, S. Tremaine, M.C. Aller, R. Bender, A. Dressler, S.M. Faber, A.V. Filippenko, R. Green, L.C. Ho, J. Kormendy, J. Magorrian, J. Pinkney, C. Siopis, The M- and M-L Relations in Galactic Bulges, and Determinations of Their Intrinsic Scatter. Astrophys. J. 698, 198–221 (2009). doi:10.1088/0004-637X/698/1/198
- Hamann et al. (2019) F. Hamann, T.M. Tripp, D. Rupke, S. Veilleux, On the emergence of THOUSANDS of absorption lines in the quasar PG 1411+442: a clumpy high-column density outflow from the broad emission-line region? Mon. Not. R. Astron. Soc. 487(4), 5041–5061 (2019). doi:10.1093/mnras/stz1408
- Heckman (1980) T.M. Heckman, An optical and radio survey of the nuclei of bright galaxies - Activity in normal galactic nuclei. Astron. & Astrophys. 87, 152–164 (1980)
- Hills (1975) J.G. Hills, Possible power source of Seyfert galaxies and QSOs. Nature 254, 295–298 (1975). doi:10.1038/254295a0
- Holoien et al. (2014) T.W.-S. Holoien, J.L. Prieto, D. Bersier, C.S. Kochanek, K.Z. Stanek, B.J. Shappee, D. Grupe, U. Basu, J.F. Beacom, J. Brimacombe, J.S. Brown, A.B. Davis, J. Jencson, G. Pojmanski, D.M. Szczygieł, ASASSN-14ae: a tidal disruption event at 200 Mpc. Mon. Not. R. Astron. Soc. 445, 3263–3277 (2014). doi:10.1093/mnras/stu1922
- Holoien et al. (2016a) T.W.-S. Holoien, C.S. Kochanek, J.L. Prieto, D. Grupe, P. Chen, D. Godoy-Rivera, K.Z. Stanek, B.J. Shappee, S. Dong, J.S. Brown, U. Basu, J.F. Beacom, D. Bersier, J. Brimacombe, E.K. Carlson, E. Falco, E. Johnston, B.F. Madore, G. Pojmanski, M. Seibert, ASASSN-15oi: a rapidly evolving, luminous tidal disruption event at 216 Mpc. Mon. Not. R. Astron. Soc. 463, 3813–3828 (2016a). doi:10.1093/mnras/stw2272
- Holoien et al. (2016b) T.W.-S. Holoien, C.S. Kochanek, J.L. Prieto, K.Z. Stanek, S. Dong, B.J. Shappee, D. Grupe, J.S. Brown, U. Basu, J.F. Beacom, D. Bersier, J. Brimacombe, A.B. Danilet, E. Falco, Z. Guo, J. Jose, G.J. Herczeg, F. Long, G. Pojmanski, G.V. Simonian, D.M. Szczygieł, T.A. Thompson, J.R. Thorstensen, R.M. Wagner, P.R. Woźniak, Six months of multiwavelength follow-up of the tidal disruption candidate ASASSN-14li and implied TDE rates from ASAS-SN. Mon. Not. R. Astron. Soc. 455, 2918–2935 (2016b). doi:10.1093/mnras/stv2486
- Holoien et al. (2016c) T.W.-S. Holoien, C.S. Kochanek, J.L. Prieto, K.Z. Stanek, S. Dong, B.J. Shappee, D. Grupe, J.S. Brown, U. Basu, J.F. Beacom, D. Bersier, J. Brimacombe, A.B. Danilet, E. Falco, Z. Guo, J. Jose, G.J. Herczeg, F. Long, G. Pojmanski, G.V. Simonian, D.M. Szczygieł, T.A. Thompson, J.R. Thorstensen, R.M. Wagner, P.R. Woźniak, Six months of multiwavelength follow-up of the tidal disruption candidate ASASSN-14li and implied TDE rates from ASAS-SN. Mon. Not. R. Astron. Soc. 455, 2918–2935 (2016c). doi:10.1093/mnras/stv2486
- Holoien et al. (2019a) T.W.-S. Holoien, M.E. Huber, B.J. Shappee, M. Eracleous, K. Auchettl, J.S. Brown, M.A. Tucker, K.C. Chambers, C.S. Kochanek, K.Z. Stanek, A. Rest, D. Bersier, R.S. Post, G. Aldering, K.A. Ponder, J.D. Simon, E. Kankare, D. Dong, G. Hallinan, N.A. Reddy, R.L. Sanders, M.W. Topping, Pan-STARRS, J. Bulger, T.B. Lowe, E.A. Magnier, A.S.B. Schultz, C.Z. Waters, M. Willman, D. Wright, D.R. Young, ASAS-SN, S. Dong, J.L. Prieto, T.A. Thompson, ATLAS, L. Denneau, H. Flewelling, A.N. Heinze, S.J. Smartt, K.W. Smith, B. Stalder, J.L. Tonry, H. Weiland, PS18kh: A New Tidal Disruption Event with a Non-axisymmetric Accretion Disk. Astrophys. J. 880(2), 120 (2019a). doi:10.3847/1538-4357/ab2ae1
- Holoien et al. (2019b) T.W.-S. Holoien, M.E. Huber, B.J. Shappee, M. Eracleous, K. Auchettl, J.S. Brown, M.A. Tucker, K.C. Chambers, C.S. Kochanek, K.Z. Stanek, A. Rest, D. Bersier, R.S. Post, G. Aldering, K.A. Ponder, J.D. Simon, E. Kankare, D. Dong, G. Hallinan, N.A. Reddy, R.L. Sanders, M.W. Topping, Pan-STARRS, J. Bulger, T.B. Lowe, E.A. Magnier, A.S.B. Schultz, C.Z. Waters, M. Willman, D. Wright, D.R. Young, ASAS-SN, S. Dong, J.L. Prieto, T.A. Thompson, ATLAS, L. Denneau, H. Flewelling, A.N. Heinze, S.J. Smartt, K.W. Smith, B. Stalder, J.L. Tonry, H. Weiland, PS18kh: A New Tidal Disruption Event with a Non-axisymmetric Accretion Disk. Astrophys. J. 880(2), 120 (2019b). doi:10.3847/1538-4357/ab2ae1
- Holoien et al. (2019c) T.W.-S. Holoien, P.J. Vallely, K. Auchettl, K.Z. Stanek, C.S. Kochanek, K.D. French, J.L. Prieto, B.J. Shappee, J.S. Brown, M.M. Fausnaugh, S. Dong, T.A. Thompson, S. Bose, J.M.M. Neustadt, P. Cacella, J. Brimacombe, M.R. Kendurkar, R.L. Beaton, K. Boutsia, L. Chomiuk, T. Connor, N. Morrell, A.B. Newman, G.C. Rudie, L. Shishkovksy, J. Strader, Discovery and Early Evolution of ASASSN-19bt, the First TDE Detected by TESS. Astrophys. J. 883(2), 111 (2019c). doi:10.3847/1538-4357/ab3c66
- Holoien et al. (2020) T.W.-S. Holoien, K. Auchettl, M.A. Tucker, B.J. Shappee, S.G. Patel, J.C.A. Miller-Jones, B. Mockler, D.N. Groenewald, J.S. Brown, C.S. Kochanek, K.Z. Stanek, P. Chen, S. Dong, J.L. Prieto, T.A. Thompson, R.L. Beaton, T. Connor, P.S. Cowperthwaite, L. Dahmen, K.D. French, N. Morrell, D.A.H. Buckley, M. Gromadzki, R. Roy, D.A. Coulter, G. Dimitriadis, R.J. Foley, C.D. Kilpatrick, A.L. Piro, C. Rojas-Bravo, M.R. Siebert, S. van Velzen, The Rise and Fall of ASASSN-18pg: Following a TDE from Early To Late Times. arXiv e-prints, 2003–13693 (2020)
- Huber et al. (2015) M. Huber, K.C. Chambers, H. Flewelling, M. Willman, N. Primak, A. Schultz, B. Gibson, E. Magnier, C. Waters, J. Tonry, R.J. Wainscoat, K.W. Smith, D. Wright, S.J. Smartt, R.J. Foley, S.W. Jha, A. Rest, D. Scolnic, The Pan-STARRS Survey for Transients (PSST) - first announcement and public release. The Astronomer’s Telegram 7153, 1 (2015)
- Hung et al. (2017) T. Hung, S. Gezari, N. Blagorodnova, N. Roth, S.B. Cenko, S.R. Kulkarni, A. Horesh, I. Arcavi, C. McCully, L. Yan, R. Lunnan, C. Fremling, Y. Cao, P.E. Nugent, P. Wozniak, Revisiting Optical Tidal Disruption Events with iPTF16axa. Astrophys. J. 842, 29 (2017). doi:10.3847/1538-4357/aa7337
- Hung et al. (2018) T. Hung, S. Gezari, S.B. Cenko, S. van Velzen, N. Blagorodnova, L. Yan, S.R. Kulkarni, R. Lunnan, T. Kupfer, G. Leloudas, A.K.H. Kong, P.E. Nugent, C. Fremling, R.R. Laher, F.J. Masci, Y. Cao, R. Roy, T. Petrushevska, Sifting for Sapphires: Systematic Selection of Tidal Disruption Events in iPTF. The Astrophysical Journal Supplement Series 238, 15 (2018). doi:10.3847/1538-4365/aad8b1
- Hung et al. (2019) T. Hung, S.B. Cenko, N. Roth, S. Gezari, S. Veilleux, S. van Velzen, C.M. Gaskell, R.J. Foley, N. Blagorodnova, L. Yan, M.J. Graham, J.S. Brown, M.R. Siebert, S. Frederick, C. Ward, P. Gatkine, A. Gal-Yam, Y. Yang, S. Schulze, G. Dimitriadis, T. Kupfer, D.L. Shupe, B. Rusholme, F.J. Masci, R. Riddle, M.T. Soumagnac, J. van Roestel, R. Dekany, Discovery of Highly Blueshifted Broad Balmer and Metastable Helium Absorption Lines in a Tidal Disruption Event. Astrophys. J. 879(2), 119 (2019). doi:10.3847/1538-4357/ab24de
- Hung et al. (2020) T. Hung, R.J. Foley, E. Ramirez-Ruiz, J.L. Dai, K. Auchettl, C.D. Kilpatrick, B. Mockler, J. Brown, D.A. Coulter, G. Dimitriadis, T. Holoien, J. Law-Smith, A.L. Piro, A. Rest, C. Rojas-Bravo, M.R. Siebert, Prompt Accretion Disk Formation in an X-Ray Faint Tidal Disruption Event. arXiv e-prints, 2003–09427 (2020)
- Jiang et al. (2016) N. Jiang, L. Dou, T. Wang, C. Yang, J. Lyu, H. Zhou, The WISE Detection of an Infrared Echo in Tidal Disruption Event ASASSN-14li. Astrophys. J. Lett. 828, 14 (2016). doi:10.3847/2041-8205/828/1/L14
- Kajava et al. (2020) J.J.E. Kajava, M. Giustini, R.D. Saxton, G. Miniutti, Rapid late-time X-ray brightening of the tidal disruption event OGLE16aaa. arXiv e-prints, 2006–11179 (2020)
- Kastner and Bhatia (1996) S.O. Kastner, A.K. Bhatia, The Bowen fluorescence lines: overview and re-analysis of the observations. Mon. Not. R. Astron. Soc. 279(4), 1137–1156 (1996). doi:10.1093/mnras/279.4.1137
- Kesden (2012a) M. Kesden, Black-hole spin dependence in the light curves of tidal disruption events. Phys. Rev. D 86(6), 064026 (2012a). doi:10.1103/PhysRevD.86.064026
- Kesden (2012b) M. Kesden, Tidal-disruption rate of stars by spinning supermassive black holes. Phys. Rev. D 85(2), 024037 (2012b). doi:10.1103/PhysRevD.85.024037
- Kochanek (2016) C.S. Kochanek, Tidal disruption event demographics. Mon. Not. R. Astron. Soc. 461, 371–384 (2016). doi:10.1093/mnras/stw1290
- Komossa and Greiner (1999) S. Komossa, J. Greiner, Discovery of a giant and luminous X-ray outburst from the optically inactive galaxy pair RX J1242.6-1119. Astron. & Astrophys. 349, 45–48 (1999)
- Komossa et al. (2008) S. Komossa, H. Zhou, T. Wang, M. Ajello, J. Ge, J. Greiner, H. Lu, M. Salvato, R. Saxton, H. Shan, D. Xu, W. Yuan, Discovery of Superstrong, Fading, Iron Line Emission and Double-peaked Balmer Lines of the Galaxy SDSS J095209.56+214313.3: The Light Echo of a Huge Flare. Astrophys. J. Lett. 678(1), 13 (2008). doi:10.1086/588281
- Krühler et al. (2018) T. Krühler, M. Fraser, G. Leloudas, S. Schulze, N.C. Stone, S. van Velzen, R. Amorin, J. Hjorth, P.G. Jonker, D.A. Kann, S. Kim, H. Kuncarayakti, A. Mehner, A. Nicuesa Guelbenzu, The supermassive black hole coincident with the luminous transient ASASSN-15lh. Astron. & Astrophys. 610, 14 (2018). doi:10.1051/0004-6361/201731773
- Law et al. (2009) N.M. Law, S.R. Kulkarni, R.G. Dekany, E.O. Ofek, R.M. Quimby, P.E. Nugent, J. Surace, C.C. Grillmair, J.S. Bloom, M.M. Kasliwal, L. Bildsten, T. Brown, S.B. Cenko, D. Ciardi, E. Croner, S.G. Djorgovski, J. van Eyken, A.V. Filippenko, D.B. Fox, A. Gal-Yam, D. Hale, N. Hamam, G. Helou, J. Henning, D.A. Howell, J. Jacobsen, R. Laher, S. Mattingly, D. McKenna, A. Pickles, D. Poznanski, G. Rahmer, A. Rau, W. Rosing, M. Shara, R. Smith, D. Starr, M. Sullivan, V. Velur, R. Walters, J. Zolkower, The Palomar Transient Factory: System Overview, Performance, and First Results. Publ. Astron. Soc. Pac. 121, 1395–1408 (2009). doi:10.1086/648598
- Leloudas et al. (2016) G. Leloudas, M. Fraser, N.C. Stone, S. van Velzen, P.G. Jonker, I. Arcavi, C. Fremling, J.R. Maund, S.J. Smartt, T. Krìhler, J.C.A. Miller-Jones, P.M. Vreeswijk, A. Gal-Yam, P.A. Mazzali, A. De Cia, D.A. Howell, C. Inserra, F. Patat, A. de Ugarte Postigo, O. Yaron, C. Ashall, I. Bar, H. Campbell, T.-W. Chen, M. Childress, N. Elias-Rosa, J. Harmanen, G. Hosseinzadeh, J. Johansson, T. Kangas, E. Kankare, S. Kim, H. Kuncarayakti, J. Lyman, M.R. Magee, K. Maguire, D. Malesani, S. Mattila, C.V. McCully, M. Nicholl, S. Prentice, C. Romero-Cañizales, S. Schulze, K.W. Smith, J. Sollerman, M. Sullivan, B.E. Tucker, S. Valenti, J.C. Wheeler, D.R. Young, The superluminous transient ASASSN-15lh as a tidal disruption event from a Kerr black hole. Nature Astronomy 1, 0002 (2016). doi:10.1038/s41550-016-0002
- Leloudas et al. (2019) G. Leloudas, L. Dai, I. Arcavi, P.M. Vreeswijk, B. Mockler, R. Roy, D.B. Malesani, S. Schulze, T. Wevers, M. Fraser, E. Ramirez-Ruiz, K. Auchettl, J. Burke, G. Cannizzaro, P. Charalampopoulos, T.-W. Chen, A.a. Cikota, M. Della Valle, L. Galbany, M. Gromadzki, K.E. Heintz, D. Hiramatsu, P.G. Jonker, Z. Kostrzewa-Rutkowska, K. Maguire, I. Mandel, M. Nicholl, F. Onori, N. Roth, S.J. Smartt, L. Wyrzykowski, D.R. Young, The Spectral Evolution of AT 2018dyb and the Presence of Metal Lines in Tidal Disruption Events. Astrophys. J. 887(2), 218 (2019). doi:10.3847/1538-4357/ab5792
- Lin et al. (2011) D. Lin, E.R. Carrasco, D. Grupe, N.A. Webb, D. Barret, S.A. Farrell, Discovery of an Ultrasoft X-Ray Transient Source in the 2XMM Catalog: A Tidal Disruption Event Candidate. Astrophys. J. 738, 52 (2011). doi:10.1088/0004-637X/738/1/52
- Liu et al. (2017) F.K. Liu, Z.Q. Zhou, R. Cao, L.C. Ho, S. Komossa, Disc origin of broad optical emission lines of the TDE candidate PTF09djl. Mon. Not. R. Astron. Soc. 472(1), 99–103 (2017). doi:10.1093/mnrasl/slx147
- Liu et al. (2019) X.-L. Liu, L.-M. Dou, R.-F. Shen, J.-H. Chen, The UV/optical peak and X-ray brightening in TDE candidate AT2019azh: A case of stream-stream collision and delayed accretion. arXiv e-prints, 1912–06081 (2019)
- Lodato et al. (2009) G. Lodato, A.R. King, J.E. Pringle, Stellar disruption by a supermassive black hole: is the light curve really proportional to ? Mon. Not. R. Astron. Soc. 392, 332–340 (2009). doi:10.1111/j.1365-2966.2008.14049.x
- Loeb and Ulmer (1997) A. Loeb, A. Ulmer, Optical Appearance of the Debris of a Star Disrupted by a Massive Black Hole. Astrophys. J. 489, 573–578 (1997). doi:10.1086/304814
- Lu and Bonnerot (2020) W. Lu, C. Bonnerot, Self-intersection of the fallback stream in tidal disruption events. Mon. Not. R. Astron. Soc. 492(1), 686–707 (2020). doi:10.1093/mnras/stz3405
- Margutti et al. (2017) R. Margutti, B.D. Metzger, R. Chornock, D. Milisavljevic, E. Berger, P.K. Blanchard, C. Guidorzi, G. Migliori, A. Kamble, R. Lunnan, M. Nicholl, D.L. Coppejans, S. Dall’Osso, M.R. Drout, R. Perna, B. Sbarufatti, X-Rays from the Location of the Double-humped Transient ASASSN-15lh. Astrophys. J. 836, 25 (2017). doi:10.3847/1538-4357/836/1/25
- Martin et al. (2005) D.C. Martin, J. Fanson, D. Schiminovich, P. Morrissey, P.G. Friedman, T.A. Barlow, T. Conrow, R. Grange, P.N. Jelinsky, B. Milliard, O.H.W. Siegmund, L. Bianchi, Y.-I. Byun, J. Donas, K. Forster, T.M. Heckman, Y.-W. Lee, B.F. Madore, R.F. Malina, S.G. Neff, R.M. Rich, T. Small, F. Surber, A.S. Szalay, B. Welsh, T.K. Wyder, The Galaxy Evolution Explorer: A Space Ultraviolet Survey Mission. Astrophys. J. Lett. 619, 1–6 (2005). doi:10.1086/426387
- Miller et al. (2015) J.M. Miller, J.S. Kaastra, M.C. Miller, M.T. Reynolds, G. Brown, S.B. Cenko, J.J. Drake, S. Gezari, J. Guillochon, K. Gultekin, J. Irwin, A. Levan, D. Maitra, W.P. Maksym, R. Mushotzky, P. O’Brien, F. Paerels, J. de Plaa, E. Ramirez-Ruiz, T. Strohmayer, N. Tanvir, Flows of X-ray gas reveal the disruption of a star by a massive black hole. Nature 526, 542–545 (2015). doi:10.1038/nature15708
- Miller (2015) M.C. Miller, Disk Winds as an Explanation for Slowly Evolving Temperatures in Tidal Disruption Events. Astrophys. J. 805, 83 (2015). doi:10.1088/0004-637X/805/1/83
- Mummery and Balbus (2020) A. Mummery, S.A. Balbus, The spectral evolution of disc dominated tidal disruption events. Mon. Not. R. Astron. Soc. 492(4), 5655–5674 (2020). doi:10.1093/mnras/staa192
- Netzer et al. (1985) H. Netzer, M. Elitzur, G.J. Ferland, Bowen fluoresence and He II lines in active galaxies and gaseous nebulae. Astrophys. J. 299, 752–762 (1985). doi:10.1086/163741
- Neustadt et al. (2020) J.M.M. Neustadt, T.W.-S. Holoien, C.S. Kochanek, K. Auchettl, J.S. Brown, B.J. Shappee, R.W. Pogge, S. Dong, K.Z. Stanek, M.A. Tucker, S. Bose, P. Chen, C. Ricci, P.J. Vallely, J.L. Prieto, T.A. Thompson, D.A. Coulter, M.R. Drout, R.J. Foley, C.D. Kilpatrick, A.L. Piro, C. Rojas-Bravo, D.A.H. Buckley, M. Gromadzki, G. Dimitriadis, M.R. Siebert, A. Do, M.E. Huber, A.V. Payne, To TDE or not to TDE: the luminous transient ASASSN-18jd with TDE-like and AGN-like qualities. Mon. Not. R. Astron. Soc. 494(2), 2538–2560 (2020). doi:10.1093/mnras/staa859
- Nicholl et al. (2019) M. Nicholl, P.K. Blanchard, E. Berger, S. Gomez, R. Margutti, K.D. Alexander, J. Guillochon, J. Leja, R. Chornock, B. Snios, K. Auchettl, A.G. Bruce, P. Challis, D.J. D’Orazio, M.R. Drout, T. Eftekhari, R.J. Foley, O. Graur, C.D. Kilpatrick, A. Lawrence, A.L. Piro, C. Rojas-Bravo, N.P. Ross, P. Short, S.J. Smartt, K.W. Smith, B. Stalder, The tidal disruption event AT2017eqx: spectroscopic evolution from hydrogen rich to poor suggests an atmosphere and outflow. Mon. Not. R. Astron. Soc. 488(2), 1878–1893 (2019). doi:10.1093/mnras/stz1837
- Nicholl et al. (2020) M. Nicholl, T. Wevers, S.R. Oates, K.D. Alexand er, G. Leloudas, F. Onori, A. Jerkstrand, S. Gomez, S. Campana, I. Arcavi, P. Charalampopoulos, M. Gromadzki, N. Ihanec, P.G. Jonker, A. Lawrence, I. Mandel, P. Short, J. Burke, D. Hiramatsu, D.A. Howell, C. Pellegrino, H. Abbot, J.P. Anderson, E. Berger, P.K. Blanchard, G. Cannizzaro, T.-W. Chen, M. Dennefeld, L. Galbany, S. Gonzalez-Gaitan, G. Hosseinzadeh, C. Inserra, I. Irani, P. Kuin, T. Muller-Bravo, J. Pineda, N.P. Ross, R. Roy, B. Tucker, L. Wyrzykowski, D.R. Young, An outflow powers the optical rise of the nearby, fast-evolving tidal disruption event AT2019qiz. arXiv e-prints, 2006–02454 (2020)
- Onori et al. (2019) F. Onori, G. Cannizzaro, P.G. Jonker, M. Fraser, Z. Kostrzewa-Rutkowska, A. Martin-Carrillo, S. Benetti, N. Elias-Rosa, M. Gromadzki, J. Harmanen, S. Mattila, M.D. Strizinger, G. Terreran, T. Wevers, Optical follow-up of the tidal disruption event iPTF16fnl: new insights from X-shooter observations. Mon. Not. R. Astron. Soc. 489(1), 1463–1480 (2019). doi:10.1093/mnras/stz2053
- Parkinson et al. (2020) E.J. Parkinson, C. Knigge, K.S. Long, J.H. Matthews, N. Higginbottom, S.A. Sim, H.A. Hewitt, Accretion disc winds in tidal disruption events: ultraviolet spectral lines as orientation indicators. Mon. Not. R. Astron. Soc. 494(4), 4914–4929 (2020). doi:10.1093/mnras/staa1060
- Phinney (1989) E.S. Phinney, Manifestations of a Massive Black Hole in the Galactic Center, in The Center of the Galaxy, ed. by M. Morris IAU Symposium, vol. 136 (Dordrecht: Kluwer, ???, 1989), p. 543
- Piran et al. (2015) T. Piran, G. Svirski, J. Krolik, R.M. Cheng, H. Shiokawa, Disk Formation Versus Disk Accretion: What Powers Tidal Disruption Events? Astrophys. J. 806, 164 (2015). doi:10.1088/0004-637X/806/2/164
- Rees (1988) M.J. Rees, Tidal disruption of stars by black holes of 10 to the 6th-10 to the 8th solar masses in nearby galaxies. Nature 333, 523–528 (1988). doi:10.1038/333523a0
- Roth and Kasen (2018) N. Roth, D. Kasen, What Sets the Line Profiles in Tidal Disruption Events? Astrophys. J. 855, 54 (2018). doi:10.3847/1538-4357/aaaec6
- Roth et al. (2016) N. Roth, D. Kasen, J. Guillochon, E. Ramirez-Ruiz, The X-Ray through Optical Fluxes and Line Strengths of Tidal Disruption Events. Astrophys. J. 827(1), 3 (2016). doi:10.3847/0004-637X/827/1/3
- Saxton et al. (2012) R.D. Saxton, A.M. Read, P. Esquej, S. Komossa, S. Dougherty, P. Rodriguez-Pascual, D. Barrado, A tidal disruption-like X-ray flare from the quiescent galaxy SDSS J120136.02+300305.5. Astron. & Astrophys. 541, 106 (2012). doi:10.1051/0004-6361/201118367
- Schachter et al. (1989) J. Schachter, A.V. Filippenko, S.M. Kahn, Bowen Fluorescence in Scorpius X-1. Astrophys. J. 340, 1049 (1989). doi:10.1086/167457
- Shankar et al. (2004) F. Shankar, P. Salucci, G.L. Granato, G. De Zotti, L. Danese, Supermassive black hole demography: the match between the local and accreted mass functions. Mon. Not. R. Astron. Soc. 354, 1020–1030 (2004). doi:10.1111/j.1365-2966.2004.08261.x
- Shappee et al. (2014) B.J. Shappee, J.L. Prieto, D. Grupe, C.S. Kochanek, K.Z. Stanek, G. De Rosa, S. Mathur, Y. Zu, B.M. Peterson, R.W. Pogge, S. Komossa, M. Im, J. Jencson, T.W.-S. Holoien, U. Basu, J.F. Beacom, D.M. Szczygieł, J. Brimacombe, S. Adams, A. Campillay, C. Choi, C. Contreras, M. Dietrich, M. Dubberley, M. Elphick, S. Foale, M. Giustini, C. Gonzalez, E. Hawkins, D.A. Howell, E.Y. Hsiao, M. Koss, K.M. Leighly, N. Morrell, D. Mudd, D. Mullins, J.M. Nugent, J. Parrent, M.M. Phillips, G. Pojmanski, W. Rosing, R. Ross, D. Sand, D.M. Terndrup, S. Valenti, Z. Walker, Y. Yoon, The Man behind the Curtain: X-Rays Drive the UV through NIR Variability in the 2013 Active Galactic Nucleus Outburst in NGC 2617. Astrophys. J. 788, 48 (2014). doi:10.1088/0004-637X/788/1/48
- Short et al. (2020) P. Short, M. Nicholl, A. Lawrence, S. Gomez, I. Arcavi, T. Wevers, G. Leloudas, S. Schulze, J.P. Anderson, E. Berger, P.K. Blanchard, J. Burke, P. Charalampopoulos, R. Chornock, L. Galbany, M. Gromadzki, L.J. Herzog, D. Hiramatsu, K. Horne, G. Hosseinzadeh, D.A. Howell, N. Ihanec, C. Inserra, E. Kankare, K. Maguire, C. McCully, T.E. Müller Bravo, F. Onori, J. Sollerman, D.R. Young, The Tidal Disruption Event AT 2018hyz I: Double-peaked emission lines and a flat Balmer decrement. arXiv e-prints, 2003–05470 (2020)
- Stern et al. (2012) D. Stern, R.J. Assef, D.J. Benford, A. Blain, R. Cutri, A. Dey, P. Eisenhardt, R.L. Griffith, T.H. Jarrett, S. Lake, F. Masci, S. Petty, S.A. Stanford, C.-W. Tsai, E.L. Wright, L. Yan, F. Harrison, K. Madsen, Mid-infrared Selection of Active Galactic Nuclei with the Wide-Field Infrared Survey Explorer. I. Characterizing WISE-selected Active Galactic Nuclei in COSMOS. Astrophys. J. 753, 30 (2012). doi:10.1088/0004-637X/753/1/30
- Stone et al. (2013) N. Stone, R. Sari, A. Loeb, Consequences of strong compression in tidal disruption events. Mon. Not. R. Astron. Soc. 435, 1809–1824 (2013). doi:10.1093/mnras/stt1270
- Stone et al. (2018) N.C. Stone, A. Generozov, E. Vasiliev, B.D. Metzger, The delay time distribution of tidal disruption flares. Mon. Not. R. Astron. Soc. 480, 5060–5077 (2018). doi:10.1093/mnras/sty2045
- Strauss et al. (2002) M.A. Strauss, D.H. Weinberg, R.H. Lupton, V.K. Narayanan, J. Annis, M. Bernardi, M. Blanton, S. Burles, A.J. Connolly, J. Dalcanton, M. Doi, D. Eisenstein, J.A. Frieman, M. Fukugita, J.E. Gunn, Ž. Ivezić, S. Kent, R.S.J. Kim, G.R. Knapp, R.G. Kron, J.A. Munn, H.J. Newberg, R.C. Nichol, S. Okamura, T.R. Quinn, M.W. Richmond, D.J. Schlegel, K. Shimasaku, M. SubbaRao, A.S. Szalay, D. Vanden Berk, M.S. Vogeley, B. Yanny, N. Yasuda, D.G. York, I. Zehavi, Spectroscopic Target Selection in the Sloan Digital Sky Survey: The Main Galaxy Sample. Astron. J. 124, 1810–1824 (2002). doi:10.1086/342343
- Strubbe and Murray (2015) L.E. Strubbe, N. Murray, Insights into tidal disruption of stars from PS1-10jh. Mon. Not. R. Astron. Soc. 454, 2321–2343 (2015). doi:10.1093/mnras/stv2081
- Strubbe and Quataert (2009) L.E. Strubbe, E. Quataert, Optical flares from the tidal disruption of stars by massive black holes. Mon. Not. R. Astron. Soc. 400, 2070–2084 (2009). doi:10.1111/j.1365-2966.2009.15599.x
- Strubbe and Quataert (2011) L.E. Strubbe, E. Quataert, Spectroscopic signatures of the tidal disruption of stars by massive black holes. Mon. Not. R. Astron. Soc. 415, 168–180 (2011). doi:10.1111/j.1365-2966.2011.18686.x
- Thomas et al. (2013) D. Thomas, O. Steele, C. Maraston, J. Johansson, A. Beifiori, J. Pforr, G. Strömbäck, C.A. Tremonti, D. Wake, D. Bizyaev, A. Bolton, H. Brewington, J.R. Brownstein, J. Comparat, J.-P. Kneib, E. Malanushenko, V. Malanushenko, D. Oravetz, K. Pan, J.K. Parejko, D.P. Schneider, A. Shelden, A. Simmons, S. Snedden, M. Tanaka, B.A. Weaver, R. Yan, Stellar velocity dispersions and emission line properties of SDSS-III/BOSS galaxies. Mon. Not. R. Astron. Soc. 431(2), 1383–1397 (2013). doi:10.1093/mnras/stt261
- Tonry et al. (2018) J.L. Tonry, L. Denneau, A.N. Heinze, B. Stalder, K.W. Smith, S.J. Smartt, C.W. Stubbs, H.J. Weiland , A. Rest, ATLAS: A High-cadence All-sky Survey System. Publ. Astron. Soc. Pac. 130(988), 064505 (2018). doi:10.1088/1538-3873/aabadf
- Trakhtenbrot et al. (2019a) B. Trakhtenbrot, I. Arcavi, C.L. MacLeod, C. Ricci, E. Kara, M.L. Graham, D. Stern, F.A. Harrison, J. Burke, D. Hiramatsu, G. Hosseinzadeh, D.A. Howell, S.J. Smartt, A. Rest, J.L. Prieto, B.J. Shappee, T.W.-S. Holoien, D. Bersier, A.V. Filippenko, T.G. Brink, W. Zheng, R. Li, R.A. Remillard, M. Loewenstein, 1ES 1927+654: An AGN Caught Changing Look on a Timescale of Months. Astrophys. J. 883(1), 94 (2019a). doi:10.3847/1538-4357/ab39e4
- Trakhtenbrot et al. (2019b) B. Trakhtenbrot, I. Arcavi, C. Ricci, S. Tacchella, D. Stern, H. Netzer, P.G. Jonker, A. Horesh, J.E. Mejía-Restrepo, G. Hosseinzadeh, V. Hallefors, D.A. Howell, C. McCully, M. Baloković, M. Heida, N. Kamraj, G.B. Lansbury, Ł. Wyrzykowski, M. Gromadzki, A. Hamanowicz, S.B. Cenko, D.J. Sand, E.Y. Hsiao, M.M. Phillips, T.R. Diamond, E. Kara, K.C. Gendreau, Z. Arzoumanian, R. Remillard, A new class of flares from accreting supermassive black holes. Nature Astronomy 3, 242–250 (2019b). doi:10.1038/s41550-018-0661-3
- Udalski et al. (2015) A. Udalski, M.K. Szymański, G. Szymański, OGLE-IV: Fourth Phase of the Optical Gravitational Lensing Experiment. Acta Astronomica 65(1), 1–38 (2015)
- van Velzen (2018) S. van Velzen, On the Mass and Luminosity Functions of Tidal Disruption Flares: Rate Suppression due to Black Hole Event Horizons. Astrophys. J. 852, 72 (2018). doi:10.3847/1538-4357/aa998e
- van Velzen and Farrar (2014) S. van Velzen, G.R. Farrar, Measurement of the Rate of Stellar Tidal Disruption Flares. Astrophys. J. 792, 53 (2014). doi:10.1088/0004-637X/792/1/53
- van Velzen et al. (2011) S. van Velzen, G.R. Farrar, S. Gezari, N. Morrell, D. Zaritsky, L. Östman, M. Smith, J. Gelfand, A.J. Drake, Optical Discovery of Probable Stellar Tidal Disruption Flares. Astrophys. J. 741, 73 (2011). doi:10.1088/0004-637X/741/2/73
- van Velzen et al. (2016) S. van Velzen, G.E. Anderson, N.C. Stone, M. Fraser, T. Wevers, B.D. Metzger, P.G. Jonker, A.J. van der Horst, T.D. Staley, A.J. Mendez, J.C.A. Miller-Jones, S.T. Hodgkin, H.C. Campbell, R.P. Fender, A radio jet from the optical and x-ray bright stellar tidal disruption flare ASASSN-14li. Science 351, 62–65 (2016). doi:10.1126/science.aad1182
- van Velzen et al. (2019a) S. van Velzen, N.C. Stone, B.D. Metzger, S. Gezari, T.M. Brown, A.S. Fruchter, Late-time UV Observations of Tidal Disruption Flares Reveal Unobscured, Compact Accretion Disks. Astrophys. J. 878(2), 82 (2019a). doi:10.3847/1538-4357/ab1844
- van Velzen et al. (2019b) S. van Velzen, S. Gezari, S.B. Cenko, E. Kara, J.C.A. Miller-Jones, T. Hung, J. Bright, N. Roth, N. Blagorodnova, D. Huppenkothen, L. Yan, E. Ofek, J. Sollerman, S. Frederick, C. Ward, M.J. Graham, R. Fender, M.M. Kasliwal, C. Canella, R. Stein, M. Giomi, V. Brinnel, J. van Santen, J. Nordin, E.C. Bellm, R. Dekany, C. Fremling, V.Z. Golkhou, T. Kupfer, S.R. Kulkarni, R.R. Laher, A. Mahabal, F.J. Masci, A.A. Miller, J.D. Neill, R. Riddle, M. Rigault, B. Rusholme, M.T. Soumagnac, Y. Tachibana, The First Tidal Disruption Flare in ZTF: From Photometric Selection to Multi-wavelength Characterization. Astrophys. J. 872, 198 (2019b). doi:10.3847/1538-4357/aafe0c
- van Velzen et al. (2020a) S. van Velzen, S. Gezari, E. Hammerstein, N. Roth, S. Frederick, C. Ward, T. Hung, S.B. Cenko, R. Stein, D.A. Perley, K. Taggart, J. Sollerman, I. Andreoni, E.C. Bellm, V. Brinnel, K. De, R. Dekany, M. Feeney, R.J. Foley, C. Fremling, M. Giomi, V.Z. Golkhou, A.Y.Q. Ho, M.M. Kasliwal, C.D. Kilpatrick, S.R. Kulkarni, T. Kupfer, R.R. Laher, A. Mahabal, F.J. Masci, J. Nordin, R. Riddle, B. Rusholme, Y. Sharma, J. van Santen, D.L. Shupe, M.T. Soumagnac, Seventeen Tidal Disruption Events from the First Half of ZTF Survey Observations: Entering a New Era of Population Studies. arXiv e-prints, 2001–01409 (2020a)
- van Velzen et al. (2020b) S. van Velzen, S. Gezari, E. Hammerstein, N. Roth, S. Frederick, C. Ward, T. Hung, S.B. Cenko, R. Stein, D.A. Perley, K. Taggart, J. Sollerman, I. Andreoni, E.C. Bellm, V. Brinnel, K. De, R. Dekany, M. Feeney, R.J. Foley, C. Fremling, M. Giomi, V.Z. Golkhou, A.Y.Q. Ho, M.M. Kasliwal, C.D. Kilpatrick, S.R. Kulkarni, T. Kupfer, R.R. Laher, A. Mahabal, F.J. Masci, J. Nordin, R. Riddle, B. Rusholme, Y. Sharma, J. van Santen, D.L. Shupe, M.T. Soumagnac, Seventeen Tidal Disruption Events from the First Half of ZTF Survey Observations: Entering a New Era of Population Studies. arXiv e-prints, 2001–01409 (2020b)
- Wang et al. (2011) T.-G. Wang, H.-Y. Zhou, L.-F. Wang, H.-L. Lu, D. Xu, Transient Superstrong Coronal Lines and Broad Bumps in the Galaxy SDSS J074820.67+471214.3. Astrophys. J. 740(2), 85 (2011). doi:10.1088/0004-637X/740/2/85
- Wang et al. (2012) T.-G. Wang, H.-Y. Zhou, S. Komossa, H.-Y. Wang, W. Yuan, C. Yang, Extreme Coronal Line Emitters: Tidal Disruption of Stars by Massive Black Holes in Galactic Nuclei? Astrophys. J. 749(2), 115 (2012). doi:10.1088/0004-637X/749/2/115
- Wevers et al. (2017) T. Wevers, S. van Velzen, P.G. Jonker, N.C. Stone, T. Hung, F. Onori, S. Gezari, N. Blagorodnova, Black hole masses of tidal disruption event host galaxies. Mon. Not. R. Astron. Soc. 471, 1694–1708 (2017). doi:10.1093/mnras/stx1703
- Wevers et al. (2019a) T. Wevers, D.R. Pasham, S. van Velzen, G. Leloudas, S. Schulze, J.C.A. Miller-Jones, P.G. Jonker, M. Gromadzki, E. Kankare, S.T. Hodgkin, Ł. Wyrzykowski, Z. Kostrzewa-Rutkowska, S. Moran, M. Berton, K. Maguire, F. Onori, S. Mattila, M. Nicholl, Evidence for rapid disc formation and reprocessing in the X-ray bright tidal disruption event candidate AT 2018fyk. Mon. Not. R. Astron. Soc. 488(4), 4816–4830 (2019a). doi:10.1093/mnras/stz1976
- Wevers et al. (2019b) T. Wevers, D.R. Pasham, S. van Velzen, G. Leloudas, S. Schulze, J.C.A. Miller-Jones, P.G. Jonker, M. Gromadzki, E. Kankare, S.T. Hodgkin, L. . Wyrzykowski, Z. Kostrzewa-Rutkowska, S. Moran, M. Berton, K. Maguire, F. Onori, S. Matilla, M. Nicholl, Evidence for rapid disk formation and reprocessing in the X-ray bright tidal disruption event AT 2018fyk. arXiv e-prints, 1903–12203 (2019b)
- Wevers et al. (2019c) T. Wevers, N.C. Stone, S. van Velzen, P.G. Jonker, T. Hung, K. Auchettl, S. Gezari, F. Onori, D. Mata Sánchez, Z. Kostrzewa-Rutkowska, J. Casares, Black hole masses of tidal disruption event host galaxies II. Mon. Not. R. Astron. Soc. 487(3), 4136–4152 (2019c). doi:10.1093/mnras/stz1602
- Weymann and Williams (1969) R.J. Weymann, R.E. Williams, The Bowen Fluorescence Mechanism in Planetary Nebulae and the Nuclei of Seyfert Galaxies. Astrophys. J. 157, 1201 (1969). doi:10.1086/150147
- Wyrzykowski et al. (2014) Ł. Wyrzykowski, Z. Kostrzewa-Rutkowska, S. Kozłowski, A. Udalski, R. Poleski, J. Skowron, N. Blagorodnova, M. Kubiak, M.K. Szymański, G. Pietrzyński, I. Soszyński, K. Ulaczyk, P. Pietrukowicz, P. Mróz, OGLE-IV Real-Time Transient Search. Acta Astronomica 64(3), 197–232 (2014)
- Wyrzykowski et al. (2017) Ł. Wyrzykowski, M. Zieliński, Z. Kostrzewa-Rutkowska, A. Hamanowicz, P.G. Jonker, I. Arcavi, J. Guillochon, P.J. Brown, S. Kozłowski, A. Udalski, M.K. Szymański, I. Soszyński, R. Poleski, P. Pietrukowicz, J. Skowron, P. Mróz, K. Ulaczyk, M. Pawlak, K.A. Rybicki, J. Greiner, T. Krühler, J. Bolmer, S.J. Smartt, K. Maguire, K. Smith, OGLE16aaa - a signature of a hungry supermassive black hole. Mon. Not. R. Astron. Soc. 465, 114–118 (2017). doi:10.1093/mnrasl/slw213
- Yang et al. (2013) C.-W. Yang, T.-G. Wang, G. Ferland, W. Yuan, H.-Y. Zhou, P. Jiang, Long-term Spectral Evolution of Tidal Disruption Candidates Selected by Strong Coronal Lines. Astrophys. J. 774(1), 46 (2013). doi:10.1088/0004-637X/774/1/46
- Yang et al. (2017) C. Yang, T. Wang, G.J. Ferland, L. Dou, H. Zhou, N. Jiang, Z. Sheng, The Carbon and Nitrogen Abundance Ratio in the Broad Line Region of Tidal Disruption Events. Astrophys. J. 846(2), 150 (2017). doi:10.3847/1538-4357/aa8598
- York et al. (2000) D.G. York, J. Adelman, J.E. Anderson Jr., S.F. Anderson, J. Annis, N.A. Bahcall, J.A. Bakken, R. Barkhouser, S. Bastian, E. Berman, W.N. Boroski, S. Bracker, C. Briegel, J.W. Briggs, J. Brinkmann, R. Brunner, S. Burles, L. Carey, M.A. Carr, F.J. Castander, B. Chen, P.L. Colestock, A.J. Connolly, J.H. Crocker, I. Csabai, P.C. Czarapata, J.E. Davis, M. Doi, T. Dombeck, D. Eisenstein, N. Ellman, B.R. Elms, M.L. Evans, X. Fan, G.R. Federwitz, L. Fiscelli, S. Friedman, J.A. Frieman, M. Fukugita, B. Gillespie, J.E. Gunn, V.K. Gurbani, E. de Haas, M. Haldeman, F.H. Harris, J. Hayes, T.M. Heckman, G.S. Hennessy, R.B. Hindsley, S. Holm, D.J. Holmgren, C. Huang, C. Hull, D. Husby, S. Ichikawa, T. Ichikawa, Ž. Ivezić, S. Kent, R.S.J. Kim, E. Kinney, M. Klaene, A.N. Kleinman, S. Kleinman, G.R. Knapp, J. Korienek, R.G. Kron, P.Z. Kunszt, D.Q. Lamb, B. Lee, R.F. Leger, S. Limmongkol, C. Lindenmeyer, D.C. Long, C. Loomis, J. Loveday, R. Lucinio, R.H. Lupton, B. MacKinnon, E.J. Mannery, P.M. Mantsch, B. Margon, P. McGehee, T.A. McKay, A. Meiksin, A. Merelli, D.G. Monet, J.A. Munn, V.K. Narayanan, T. Nash, E. Neilsen, R. Neswold, H.J. Newberg, R.C. Nichol, T. Nicinski, M. Nonino, N. Okada, S. Okamura, J.P. Ostriker, R. Owen, A.G. Pauls, J. Peoples, R.L. Peterson, D. Petravick, J.R. Pier, A. Pope, R. Pordes, A. Prosapio, R. Rechenmacher, T.R. Quinn, G.T. Richards, M.W. Richmond, C.H. Rivetta, C.M. Rockosi, K. Ruthmansdorfer, D. Sandford, D.J. Schlegel, D.P. Schneider, M. Sekiguchi, G. Sergey, K. Shimasaku, W.A. Siegmund, S. Smee, J.A. Smith, S. Snedden, R. Stone, C. Stoughton, M.A. Strauss, C. Stubbs, M. SubbaRao, A.S. Szalay, I. Szapudi, G.P. Szokoly, A.R. Thakar, C. Tremonti, D.L. Tucker, A. Uomoto, D. Vanden Berk, M.S. Vogeley, P. Waddell, S. Wang, M. Watanabe, D.H. Weinberg, B. Yanny, N. Yasuda, The Sloan Digital Sky Survey: Technical Summary. Astron. J. 120, 1579–1587 (2000). doi:10.1086/301513