Discovery of a New WZ Sagittae Type Cataclysmic Variable in the Kepler/K2 Data
Abstract
We identify a new, bright transient in the K2/Kepler Campaign 11 field. Its light curve rises over seven magnitudes in a day and then declines three magnitudes over a month before quickly fading another two magnitudes. The transient was still detectable at the end of the campaign. The light curve is consistent with a WZ Sge type dwarf nova outburst. Early superhumps with a period of 82 minutes are seen in the first 10 days and suggest that this is the orbital period of the binary which is typical for the WZ Sge class. Strong superhump oscillations develop ten days after peak brightness with periods ranging between 83 and 84 minutes. At 25 days after the peak brightness a bump in the light curve appears to signal a subtle rebrightening phase implying that this was an unusual type-A outburst. This is the only WZ Sge type system observed by K2/Kepler during an outburst. The early rise of this outburst is well-fit with a broken power law. In first 10 hours the system brightened linearly and then transitioned to a steep rise with a power law index of 4.8. Looking at archival K2/Kepler data and new TESS observations, a linear rise in the first several hours at the initiation of a superoutburst appears to be common in SU UMa stars.
keywords:
stars: dwarf novae – catalogues – editorials, notices1 Introduction
Cataclysmic variable stars (CVs) consist of a white dwarf star accreting material from a companion star. These accreting binary systems show a rich array of physical processes that are displayed over many different timescales (for a review, see Warner, 1986). Mass transfer from the companion star is often facilitated through an accretion disk around the white dwarf star. Thermal instability in the disk drives outbursts known as dwarf novae (DN; Osaki, 1974; Hōshi, 1979). The character of these DN outbursts depends on the binary orbital period.
Accretion disks in systems with orbital periods less than two hours can experience periodic “superoutbursts” that are more luminous and last longer than normal outbursts. This class of DN are named for their prototype, SU Ursa Majoris (SU UMa). During a superoutburst, the disk can be excited by a 3:1 orbital resonance with the binary orbit that generates strong optical oscillations known as “superhumps” (SHs) (Whitehurst, 1988; Osaki, 1989; Lubow, 1991a, b). The frequency and amplitude of the SHs evolve over the outburst in specific ways that are good diagnostics of the physics in the disk and binary system.
SU UMa DN are thought to be evolving to shorter orbital periods through energy loss by gravitational radiation. As the orbital periods shorten, the secondary mass decreases and the mass ratio of the systems become extreme. At periods around 80 minutes, the separation between the components begins to increase in what is known as the period bounce (Kolb & Baraffe, 1999; Knigge et al., 2011, and references therin). CVs near the bounce period have mass ratios less than 0.1 and these are known as WZ Sge type DN. Kato (2015) presents an extensive review of these binaries. WZ Sge stars have a number of distinctive properties, such as very large amplitude outbursts, brightening by 7 or 8 magnitudes. The time between outbursts can be many years to decades, meaning that catching a particular system in a bright state is rare. Unlike other SU UMa DN, WZ Sge DN feature double-peak variations in their light curves known as “early superhumps”. These early superhumps are a result of the high mass ratio of WZ Sge systems, that allows the accretion disk to reach the 2:1 orbital resonance (Osaki & Meyer, 2002). Early superhumps are a valuable diagnostic tool, featuring periods that correspond closely with the orbital period (Kato, 2002; Ishioka et al., 2002).
Another feature common to WZ Sge DN is a late time rebrightening event at the end of a superoutburst. As described in Kato (2015), these events have been classified into 5 categories: type–A/B outbursts, long duration or multiple rebrightenings; type–C outbursts, single rebrightening; and type–D outbursts, no rebrightening, all identified by (Imada et al., 2006); and type–E, double superoutburst, identified by Kato et al. (2014). Using the rebrightening types Kato (2015) constructs an evolutionary sequence that can be used to identify the age of the system and the configuration, with the evolutionary sequence type C D A B E. Type–A outbursts were found to be close to the period minimum, making them good period bouncing candidates.
The Kepler space telescope has proven to be a valuable instrument in detecting and understanding DN. With the 1 minute short cadence, and 30 minute long cadence data, Kepler has obtained exquisite light curves of known and previously unknown DN. Kato & Osaki (2013b) presents the analysis of three SU UMa DN, V585 Lyr and V516 Lyr and the serendipidously discovered KIC 4378554 presented in Barclay et al. (2012). With the high photometric precision of Kepler data and long baseline afforded by the Kepler prime mission, Kato & Osaki (2013b) presented evidence that supported the thermal–tidal instability theory as the origin of superoutbursts.
Like Kepler, K2 data offers the unparalleled high cadence, 30 minute observations of thousands of targets (Borucki et al., 2010; Koch et al., 2010; Howell et al., 2014). K2 differs from Kepler in that each science target is allocated a larger detector area to compensate for telescope drift, as a result fewer science targets were observed. Although drift reduces the photometric precision of K2, the increase in contiguous background pixels improves the chances that transients can be detected.
Here, we present observations of a new WZ Sge type CV discovered as part of a systematic search for new transients in the K2/Kepler campaigns, known as the K2: Background Survey (K2:BS). Our new CV is the first WZ Sge type system to be observed with the high cadence and continuous monitoring of Kepler. In Sec. 2 we describe the detection method used to discover KSN:BS-C11a. Furthermore, we outline the K2/Kepler light curve processing and spectroscopy of the system. In Sec. 3 we analyse the K2/Kepler light curve and the unique high cadence coverage of the rise to peak brightness. Finally in Sec. 4 we compare the light curve of KSN:BS-C11a with other WZ Sge stars to derive fundamental parameters of the binary system.
2 Data
2.1 Search for Transients in K2/Kepler
Through the K2/Kepler Extra-Galactic Survey (KEGS), K2/Kepler observed thousands of galaxies and provided a wealth of information on transients that were detected in scheduled galaxy targets (e.g. Garnavich et al., 2016; Rest et al., 2018; Dimitriadis et al., 2019). Although many transients were detected in the directed search, there are more transients hidden in the K2/Kepler data. Each science target in K2/Kepler has numerous background pixels that are observed at high cadence. During a campaign these background pixels may serendipitously collected transient signals, which have gone previously undetected.
Ridden-Harper et al. (2020) presents the K2: Background Survey (K2:BS), which conducts a systematic search for transients in K2/Kepler background pixels. K2:BS independently analyses each pixel to detect abnormal behaviour. This is done by searching for pixels that rise above a brightness threshold set from the median brightness and standard deviation through a campaign. Telescope motion presents a challenge in candidate detection as science targets may drift into background pixel, triggering false events. False triggers are screened by vetting of events that last day, chosen for candidates with the 6 hourly telescope resets. Coincident pixels that pass the vetting procedure are grouped into an event mask. All candidate events are checked against the NASA/IPAC Extragalactic Database (NED)111The NASA/IPAC Extragalactic Database (NED) is operated by the Jet Propulsion Laboratory, California Institute of Technology, under contract with the National Aeronautics and Space Administration. and the SIMBAD database (Wenger et al., 2000) to identify potential hosts. K2:BS produces event figures, videos and relevant detector information, which are used for manual vetting.
2.2 Discovery of KSN:BS-C11a
A bright transient, KSN:BS-C11a, was detected in the K2/Kepler archived target pixel file (TPF) for EPIC 203830112 Campaign 11 (C11). The science target EPIC 203830112 was proposed for observation by several programs in C02 and C11 shown in Table 1. The science target is a F-type dwarf that was selected for magnitude limited surveys of FGK dwarf stars with the objective of understanding the occurrence rate and properties of near-Earth sized planets. The location of KSN:BS-C11a was observed in both C02 and C11, however, it was in quiescence in C02.
KSN:BS-C11a was discovered in K2/Kepler C11 galactic pointing campaign, during a preliminary search of K2:BS. This event went undetected as transient surveys (e.g. Rest et al., 2018) avoided the crowded galactic fields. Furthermore, KSN:BS-C11a was unlikely to be detected from ground based surveys as Kepler was “backward facing” during C11, meaning that the target field appeared in the evening twilight as viewed from the Earth. The discovery of KSN:BS-C11a shows the capability of K2:BS to rapidly analyse K2/Kepler data for transients, even in galactic pointing fields.
2.3 Full Frame Images
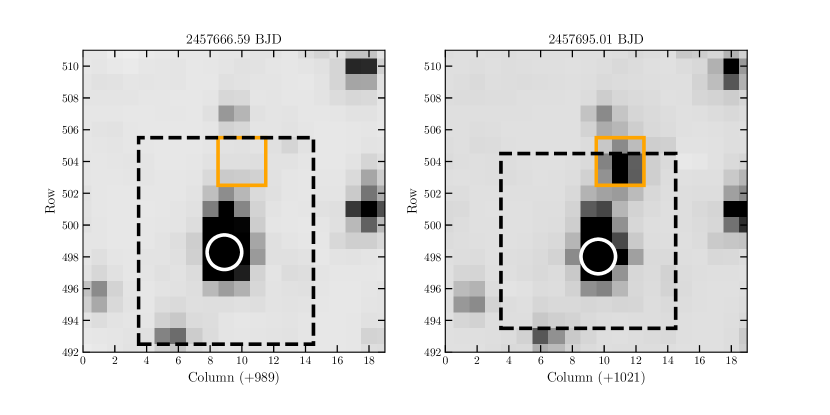
In each K2/Kepler campaign, at least one full frame image (FFI) is taken. Many campaigns, such as C11, have two FFIs: one at the start, and one midway through the campaign. In rare cases when a transient occurs during an FFI, it can be shown in relation to all other objects in the region. Such occurrences are useful to establish the reality of the transient and determine its total brightness.
The two FFIs for C11 were taken at 2457666.59 BJD and 2457695.01 BJD, where the second FFI occurs 3 days after KSN:BS-C11a reached peak brightness. As shown in Fig. 1 the event is well separated from the science target, by pixels, or . The presence of KSN:BS-C11a in the FFI is strong confirmation that KSN:BS-C11a is not an artefact of the data.
Because the transient is at the edge of the TPF, the wings of the point-spread-function (PSF) are cutoff in the individual images. We can use the FFIs to estimate the fraction of event flux that the TPF missed. Aperture photometry was preformed with the event apertures shown in Fig. 1 with the C111 sub-campaign aperture for background subtraction. The FFI counts were , while the event light curve recorded lower counts of . Thus, the TPF received 96% of the total event flux. As noted below, we find that there is little spacecraft motion that would move KSN:BS-C11a off the TPF, so it likely that a high level of flux was captured for the entire event.
2.4 K2/Kepler Light Curve
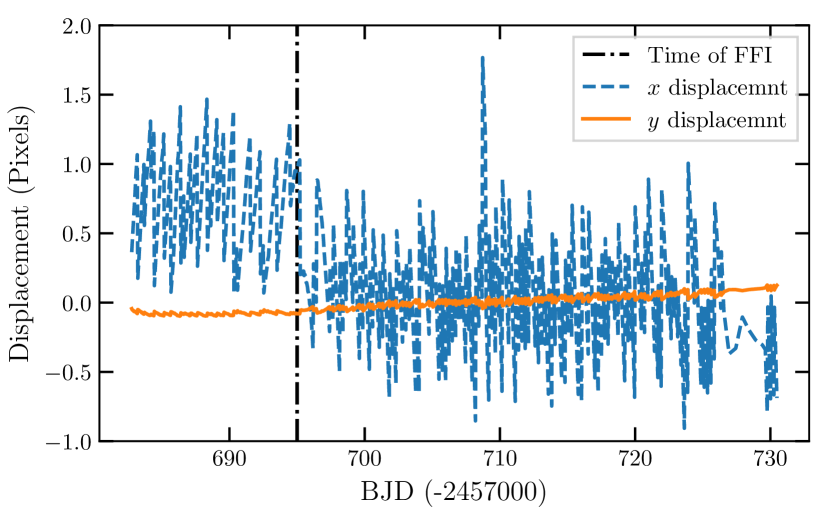
The light curve for KSN:BS-C11a was constructed through simple aperture photometry. Due to telescope motion across the TPF, as seen in Fig. 2, the custom aperture was chosen to extend across many columns, to encapsulate all flux. Although a larger mask introduced larger background noise, this was inconsequential due to the high event count rate, and a quiescent period at the beginning of sub-campaign C112, which is ideal for background subtraction.
A less successful method of data reduction was attempted using Point Response Function (PRF) model fitting photometry. This data reduction method is available though the Lightkurve python package
(Lightkurve Collaboration et al., 2018), in which a PRF is fit to each frame to determine telescope properties and recover the flux, free from telescope effects. Although this method proved successful in accounting for telescope motion, it was unable to recover the total counts of the event, thus the aperture photometry method was favoured.
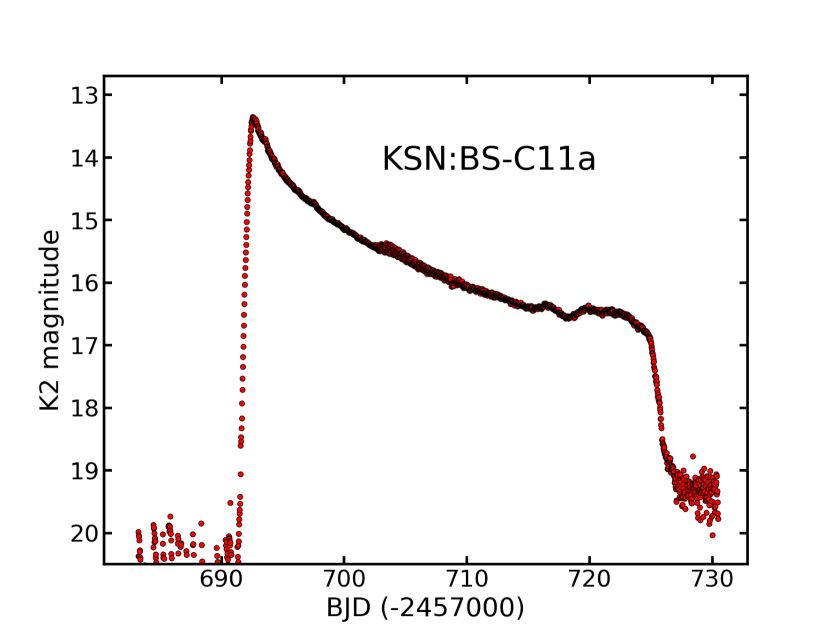
The light curve from the K2/Kepler data is shown in Fig. 3. Due to the high count rate of this event, and the rapid cadence of K2/Kepler data, the light curve of the event is extremely well defined. The event had a rapid rise of mag over 1 day, followed by a slow decay lasting about a month. Large amplitude oscillations began about 10 days after maximum light. Overall, the light curve appears to be that of a short period CV in superoutburst. In particular, its characteristics are similar to outbursts of GW Librae (Vican et al., 2011), a WZ Sge type CV.
2.5 Gemini Spectra
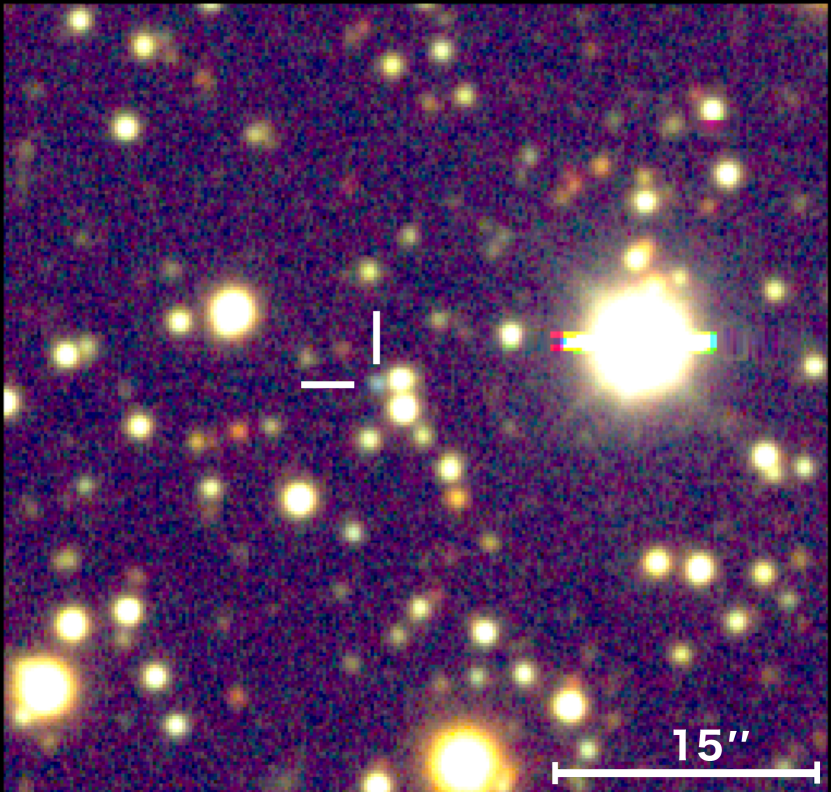
Following the discovery of KSN:BS-C11a, Pan-STARRS1 (PS1) images of the field were searched to identify the system in quiescence. Given the 4” pixel-scale of the K2/Kepler data, however, there were several possible progenitors within the uncertainty ellipse. Spectra of the first candidate was obtained on 2018 July 20 (UT), the remaining two candidates were observed on 2018 July 25 (UT) (MJD58324.3) with Gemini Multi-Object Spectrograph North (GMOS-N), using the R400 grating with a wavelength range of 3960–8687 Åand a 1” longslit. The data were processed using standard routines within the Gemini IRAF package. The faintest candidate revealed a blue continuum with a broad, double-peaked Hα emission feature which confirmed this source as the dwarf nova.
Using positions for nearby stars from the USNO-B1.0 catalog, we measure the astrometric position of the progenitor to be (J2000) with an uncertainty of 0.24 arcsec. The location of the star in the quiescent state is shown in Fig. 4.
2.6 DECam images
Following spectroscopic confirmation with Gemini, deep images were taken with CTIO 4-meter telescope and the DECam instrument on 2018 September 1 (UT) (MJD58363.0). KSN:BS-C11a was imaged in four SDSS filters, with exposure times of 120 s for and , and 90 s for and . The images were reduced following standard procedure with the DECam pipeline.
Photometry in the crowded field was performed by point-spread-function (PSF) fitting with DAOPHOT implemented in IRAF222IRAF is distributed by the National Optical Astronomy Observatory, which is operated by the Association of Universities for Research in Astronomy (AURA) under a cooperative agreement with the National Science Foundation.. An average PSF was constructed from isolated stars in the field and this function was scaled to match the brightness of the two stars just west of the variable. After subtracting these stars, aperture photometry was performed on KSN:BS-C11a and on nearby stars calibrated in the PS1 Survey DR1 catalogue (Chambers et al., 2016). We find the quiescent brightness of KSN:BS-C11a is and . From these estimates we approximate the magnitude in the Kepler system as . Given that the Kepler brightness at the peak of the outburst was , the full amplitude of the outburst was 8.1 mag.
3 Analysis
3.1 Power Spectrum
During a superoutburst, oscillations occur in the light curve caused by orbital resonances so that the power spectrum of an outburst can probe the physics of the disk. The high cadence observations of K2/Kepler are capable of identifying the short scale superhump oscillations and measure their time evolution (Barclay et al., 2012; Kato & Osaki, 2013c, a; Brown et al., 2015). To study the oscillations during the outburst we have removed the slow decline from maximum by subtracting a median-filtered light curve with using a 36 hour wide kernel. The resulting residual light curve is shown in Fig. 5.
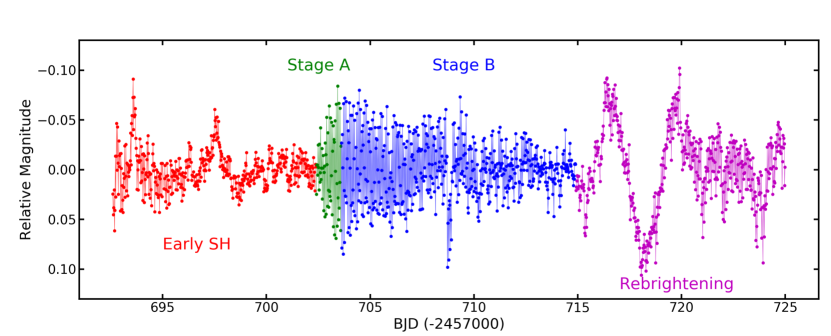
The evolution of a WZ Sge outburst begins with “early” superhumps that tend to have a low amplitude and a period close to the orbital period of the system. An increasing amplitude signals the Stage A superhumps that rapidly transition to the Stage B. The outburst finally shows variations on the time scale of a few days that we associate with the rebrightening phase (Kato, 2015).
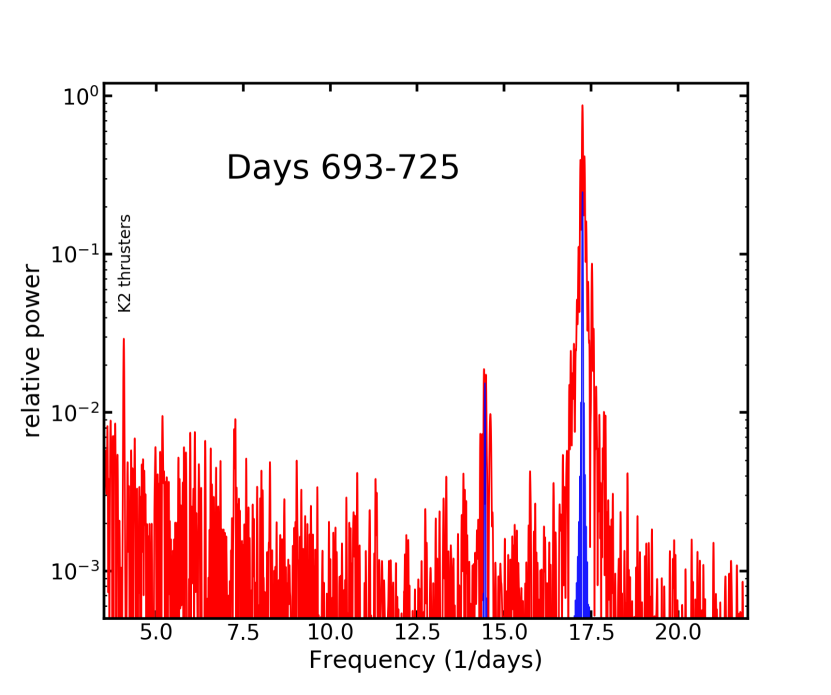
The power spectrum of KSN:BS-C11a over the outburst is seen in Fig. 6, and reveals two broad peaks at frequencies around 17.2 day-1 and 14.4 day-1. A narrow peak at 4 day-1 is due to the regular 6 hour spacecraft drift plus thruster correction cycle.
The power at 14.4 day-1 is likely the second harmonic of the primary peak sampled beyond the Kepler long cadence Nyquist frequency (Barclay et al., 2012). This results in a folded alias of that harmonic and this is not a true periodicity in the light curve. To test this, we took a power spectrum of a periodic function with a frequency of 17.25 day-1. The power spectrum of the periodic function had significant harmonics at 34.5 day-1 when sampled at a fast cadence. When re-sampled at the K2/Kepler cadence a folded alias appeared at 14.4 day-1, and this alias plus the true power peak are shown in blue in Fig. 6.
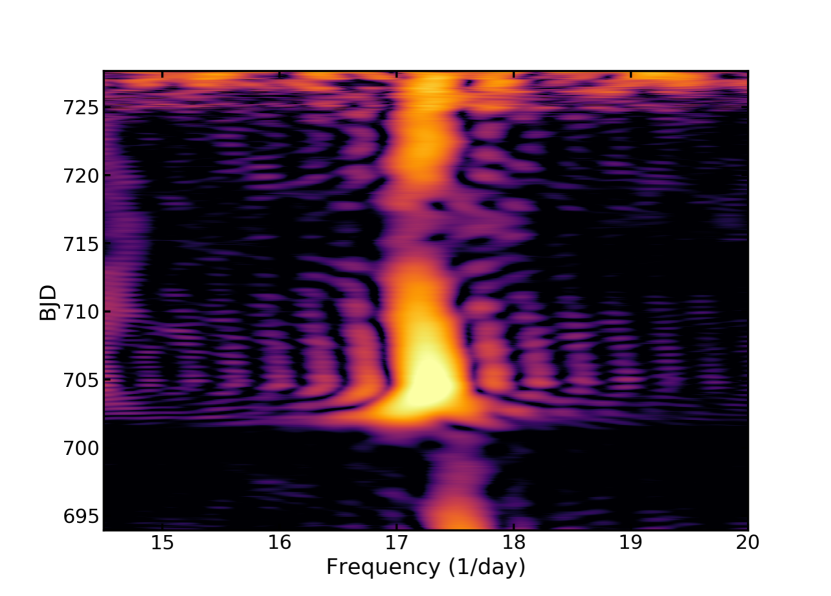
The variation in the superhump frequencies can be seen time-resolved power spectrum shown in Fig. 7. Here the early superhumps are seen to have a nearly constant frequency before the transition to Stage A around day 702. The Stage B superhumps drift to lower frequencies before fading in amplitude around day 715.
3.2 Early Rise
The photometric cadence of K2/Kepler permits the study of the earliest phases in DN outbursts. K2/Kepler has observed only a handful of DN superoutbursts and no outbursts of a WZ Sge star until now.
The fixed aperture K2/Kepler photometry of KSN:BS-C11a shows sawtooth pattern with an amplitude of e/s. The sawtooth before the outburst is due to the drifting motion of spacecraft bringing the wings of nearby stars into the aperture. For this target the K2/Kepler motion results in image movement mainly along the lines of the CCD (see Fig. 2). So there is an excellent correlation between the flux variations in the aperture and the -direction image displacement. We fit the correlation with a third order polynomial and subtract the fit from the light curve. After removing a slow trend in the flux, the corrected light curve has a standard deviation about zero of over the seven days before the outburst.
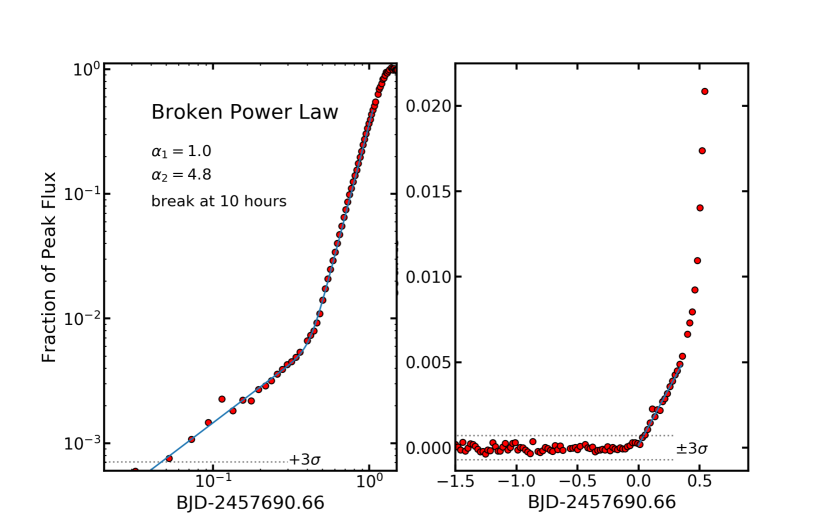
First light of the outburst is detected at BJD2457690.71 when the flux within the aperture rises above three standard deviations of the background. As shown in Fig. 8, the brightness rises slowly over the initial 10 hours after detection. When the system has reached about 0.5% of peak luminosity the rate of brightening dramatically increases and it takes just 23 hours to brighten by the remaining 99.5%.
A two-component or “broken” power law fit provides an excellent description of the rising light curve up to 50% of the peak flux. As expected, the initial linear phase corresponds to a power law with index followed by a quick transition to a steeper index of after 10 hours. The rate of brightening begins to slow and deviate from the steepest power law rise after 25 hours.
This initial linear rise has never been observed in a WZ Sge type star before. The transition to the steep rise occurs around 5.7 magnitudes fainter than the peak, or approximately a Kepler magnitude of 19.1 mag. For a quiescent magnitude, the star rose by a factor of 10 in brightness during the slow linear segment.
3.3 Optical Spectrum
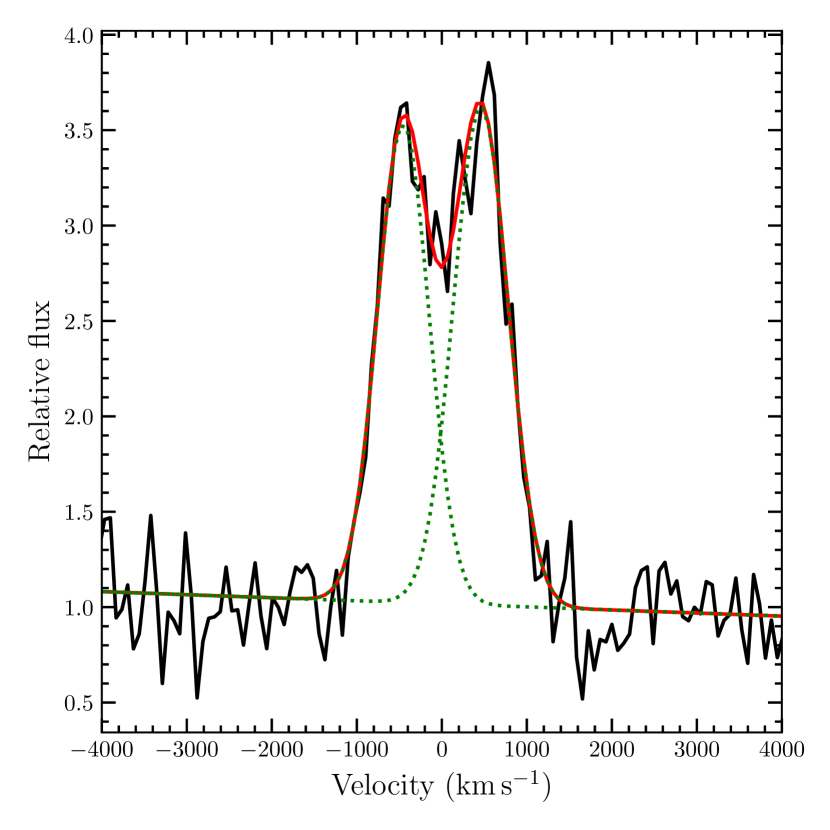
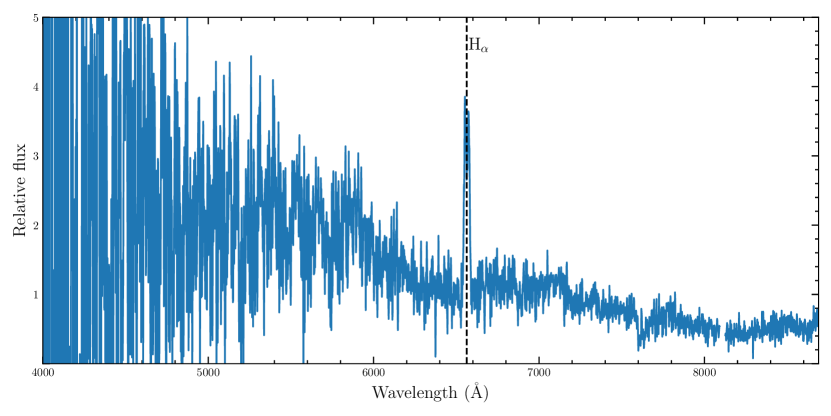
The GMOS spectra revealed a double-peaked Hα emission line, as seen in Fig. 9. Other spectral features could not be recovered from the GMOS-N spectrum (see Fig. 14). The double-peaked Hα emission line is produced by orbiting gas in the accretion disk seen at a significant inclination to our line of sight. To recover the observed disk velocity, we fit the data using minimisation with a model consisting of a double Gaussian added to a linearly varying continuum. As the 900s integration time is only a fraction of the expected minute orbital period, we can not separate the systemic velocity of the binary from the orbital motion of the WD. As seen in Fig. 9 the redshifted Hα component was found to peak at and the blue at relative to the centre of the emission. The full width at half maximum (FWHM) of each of the Gaussian components was found to be .
From the spectrum, we can roughly constrain system properties, such as inclination and WD mass. As discussed in Warner (1986), the equivalent width (EW) of the emission line is inclination dependent. Expanding on this, Casares (2015) has calibrated the EW and FWHM of the emission line in CVs and X-ray transients to permit the estimate of inclination and mass. To first order, Casares (2015) make the following approximation:
| (1) |
where is the equivalent width, Å, and is the inclination. The value of the parameter is calibrated from a set of well-observed CVs. From our spectrum, we find the , which leads to an inclination . We conclude that the inclination is fairly high, although it must be on the low side of this range as the system is not eclipsing.
4 Discussion
4.1 Orbital Period and Mass Ratio
Early superhumps are known to have a period within 0.1% of the binary orbital period (Kato, 2015). The power spectrum starting from the peak of the light curve to day 702.4 (the onset of Stage A superhumps) provides a good estimate of the orbital period of 82.13 minutes (Fig. 10). As compiled by Kato (2015), the median orbital period of WZ Sge stars is 81.94 minutes.
Ordinary superhumps are seen to develop at day 702 as the amplitude of oscillations rises from a few percent up to 8% on day 703. The delay in the start of true superhumps is days, which is typical for WZ Sge stars with an 82 minute period. Stage A superhumps last only 20 to 30 cycles and are difficult to measure due to our 30 minute cadence. We apply a power spectrum analysis to the data between day 702.4 and 703.6 (20 cycles) and find a peak centred at minutes. Although, it is clear from the time-resolved power spectrum shown in Fig. 7, that the Stage A superhumps evolve rapidly from lower frequencies toward the Stage B frequencies. Fig. 10 also shows that the early superhumps and the Stage A oscillations are present simultaneously in the system just before the onset of Stage B.
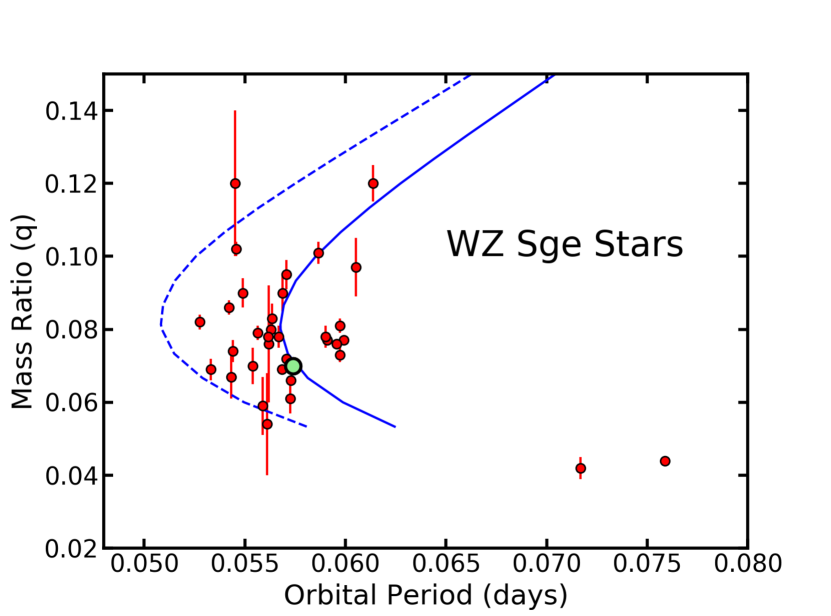
The difference in period between the Stage A superhumps and the orbital period is related to the binary mass ratio through the superhump excess parameter , where . We do not have an independent measurement of the orbital period, so we use the frequency of the early superhumps to estimate . From minutes and minutes we find , meaning the precession rate of the disk is . Kato & Osaki (2013b) determined a relation between the superhump excess and the components mass ratio and from their Table 1 the mass ratio for KSN:BS-C11a is . The orbital period and mass ratio places KSN:BS-C11a very close to the period bounce (Fig. 11).
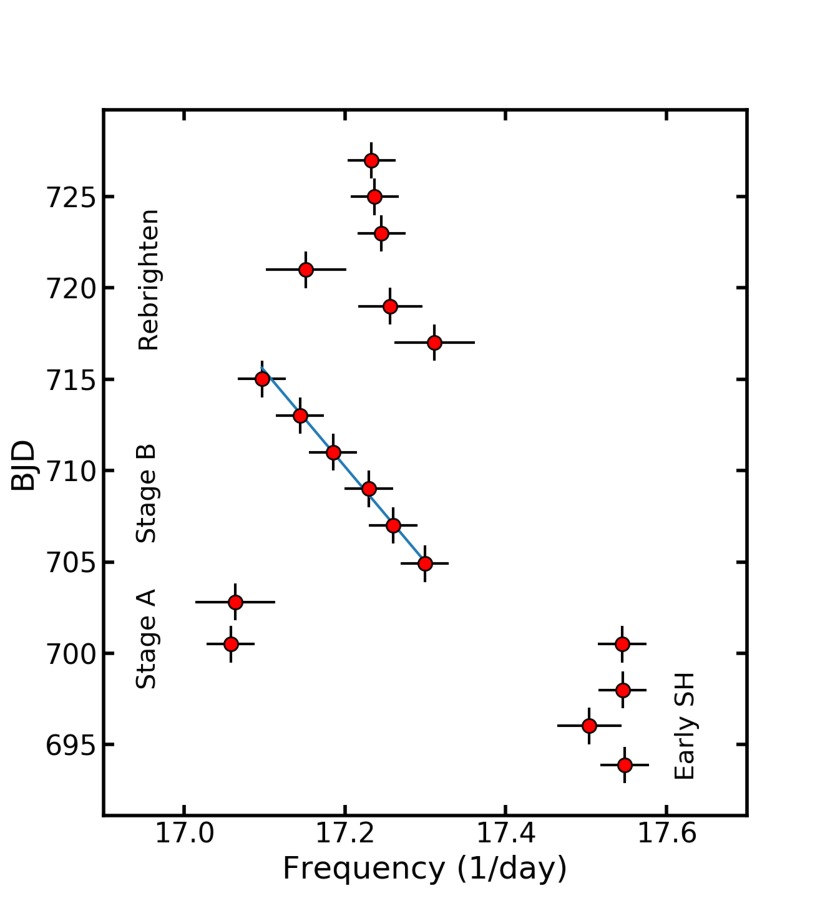
The rate that the oscillation period changes with time during Stage B superhumps is also a key diagnostic of the binary parameters. Fig. 10 shows how the power peak trends to lower frequencies during Stage B superhumps. We estimate the rate at which the superhump power spectrum peak shifts to lower frequencies to be day-2 corresponding to a period change rate of . For a collection of WZ Sge stars with mass ratios between the measured period derivative ranges between with a mean of 4 (Kato, 2015).
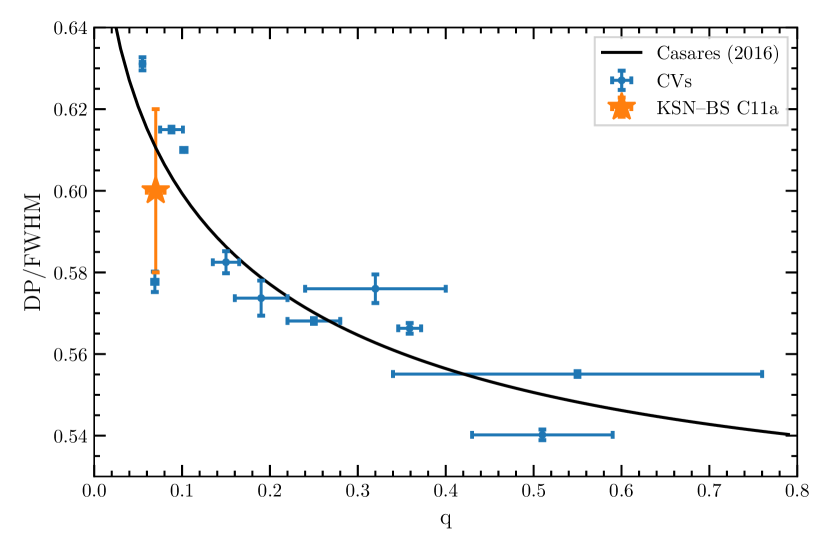
Casares (2016) has identified a relation between the quiescent Hα emission line properties and the binary mass ratio for systems with . These extremely low mass ratios are found in black hole X-ray binaries as well as CVs near the period bounce. Casares (2016) showed that the ratio between the separation in the double peaked emission () and the full width at half maximum (FWHM) of the two components is independent of the inclination of the disk, but sensitive to the mass ratio. The model predicts the relation,
| (2) | |||||
| (3) |
where and are free parameters. Casares (2016) estimated that and by fitting Equation 3 to a set of known CVs.
From our Gemini spectrum of KSN:BS-C11a we measure , consistent with a mass ratio of . Using our estimated mass ratio of , we can plot KSN:BS-C11a on the Casares (2016) relation for CVs as shown in Fig. 12. The small mass ratio we have estimated for KSN:BS-C11a is consistent with this analysis, although, the scatter in the CV relation is large.
4.2 Rebrightening Phase
WZ Sge stars show a variety of behaviours toward the end of a superoutburst and are generally referred to as “rebrightening”. These behaviours have been divided into classes by Imada et al. (2006) and reviewed by Kato (2015). The rebrightening phase for KSN:BS-C11a begins with a slight rise followed by a shallow dip and then keeps a nearly constant brightness over five days before a final fade. The lack of large oscillations rules out the rebrightening classes of Type B and C. KSN:BS-C11a also does not fit the Type D rebrightening class characterised by GW Lib. The behaviour of KSN:BS-C11a at the end of its outburst is probably closest to the Type A class, like AL Com, but with only a shallow dip before the plateau phase. The slight rise around day 717 suggests the rebrightening may have started before fading from the superoutburst began. This odd situation suggests that the fading begins in a different part of the disk than the rebrightening. Superhumps are seen to reform and intensify during the rebrightening phase.
4.3 Early Rise
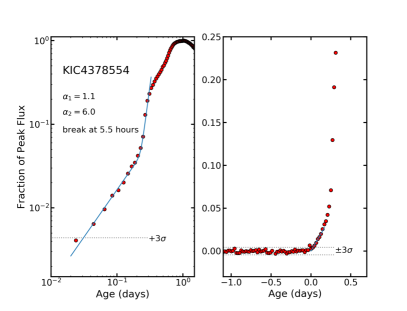
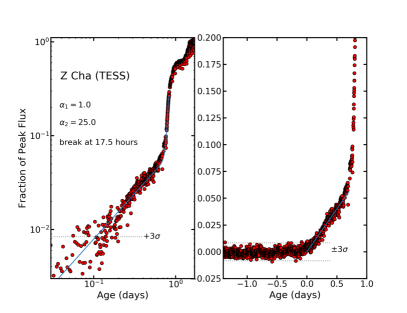
The continuous monitoring and fast cadence of the K2/Kepler and TESS missions allows us to study the earliest phases of the superoutburst in SU UMa stars. We see in Fig. 8 that KSN:BS-C11a shows a nearly linear precursor before the very fast rise to maximum light begins. This prompted us to look at other short period systems for evidence of precursor behaviour. We found slow linear precursors are seen in the serendipitiously discovered system KIC 4378554 (Barclay et al., 2012) as seen in Fig. 13. We find a similar broken rise in and Z Cha from TESS (Court et al., 2019). The detection of slow, linear precursors in these three objects suggests that such rises may be a common feature of SU UMa outbursts.
The linear precursor in KSN:BS-C11a transitions to the fast rise at only 0.5% of the peak flux of its outburst and lasts for 10 hours, or only 7 binary orbits. The linear phase of KIC 4378554 reaches 4% of the peak flux but lasts for only 5.5 hours. The linear precursor in Z Cha is most impressive as it reaches to 5% of peak and lasts for 17.5 hours.
If we assume the Kepler bandpass captured most of the emission during the rise (bolometric flux), then the linear rise might suggest the temperature increased with time as . A temperature increase of less than a factor of two could explain the factor of ten increase in flux during the early phase, pushing the disk to the critical ionization temperature for the neutral hydrogen. The temperature of quiescent disks vary with radius, but typical estimates range between 3000 K to 5600 K (Rutkowski et al., 2016). So a rise of a factor of two in temperature is reasonable at the onset of an outburst.
4.4 Distance
The typical luminosity of WZ Sge stars in quiescence is not well determined because these objects are so intrinsically faint and only a handful have apparent magnitude brighter than 19 in quiescence. The physical origin of the ordinary superhumps suggests a fairly uniform disk luminosity for WZ Sge systems when these oscillations begin (Kato, 2015). Patterson (2011) estimates the absolute magnitude for SU UMa stars near the time of superhump onset to be mag, so we can use this as an indicator of the distance to KSN:BS-C11a.
The apparent Kepler magnitude at superhump appearance is . The quiescent mag was 21.5, so the amplitude at the time at the onset of ordinary superhumps is 6.1 mag, typical of WZ Sge stars (Kato, 2015). We do not know a precise inclination for KSN:BS-C11a, but it is not an eclipsing system so we will assume no significant inclination correction is required. The distance modulus to KSN:BS-C11a is mag, or pc. The Galactic coordinates KSN:BS-C11a are and , extremely close to the Galactic center. The total dust extinction in the direction of KSN:BS-C11a is a substantial (Schlafly & Finkbeiner, 2011), arguing for a distance as close as 600 pc. Given the relatively blue colour of the star in quiescence, we suspect that much of the extinction lies beyond KSN:BS-C11a, and the true distance is closer to 900 pc.
5 Conclusion
Searching through the K2/Kepler pixels files as part of the K2:Background Survey, we have identified a bright transient. The continuous monitoring and rapid cadence of K2/Kepler showed that the transient increased in brightness by 8 mag in about one day and faded slowly over a month. Oscillations with varying frequencies strongly suggest that the transient is a WZ Sge type dwarf nova with a binary orbital period of 82 minutes. This type of close binary lose energy by emitting gravitational radiation. The stars get closer together driving continued mass transfer mass to the WD. But mass transfer forces the secondary out of thermal equilibrium and around a period of 80 min the period “bounces” so that evolution continues with an increasing period (Knigge et al., 2011).
We identify the progenitor system in quiescence using spectroscopy and deep DECam imaging. The spectra reveal a double-peaked Hα emission line coming from the quiescent accretion disk. Its equivalent width suggests a high inclination system, although, eclipses are not seen in the outbursting light curve. The line properties are consistent with a very low mass ratio as expected for a WZ Sge system.
We also find that SU-UMa DN superoutbursts exhibit a broken power law rise. This phenomena has been observed in KSN:BS-C11a, KIC4378554, and Z Cha. The mechanism behind this broken rise is unknown, however, we expect it indicates new physics behind DN superoutbursts.
Acknowledgements
This research weas supported by an Australian Government Research Training Program (RTP) Scholarship. This paper includes data collected by the K2 mission. Funding for the K2 mission is provided by the NASA Science Mission directorate. Based on observations obtained at the Gemini Observatory, as part of the GN-2018A-LP-14 program, which is operated by the Association of Universities for Research in Astronomy, Inc., under a cooperative agreement with the NSF on behalf of the Gemini partnership: the National Science Foundation (United States), National Research Council (Canada), CONICYT (Chile), Ministerio de Ciencia, Tecnología e Innovación Productiva (Argentina), Ministèrio da Ciência, Tecnologia e Inovação (Brazil), and Korea Astronomy and Space Science Institute (Republic of Korea).
| Proposal ID | Campaign | PI |
|---|---|---|
| GO2054 | C02 | Sanchis-Ojeda et al. |
| GO2104 | C02 | Petigura et al. |
| GO11071 | C11 | Charbonneau et al. |
| GO11122 | C11 | Howard et al. |
| GO11902 | C11 | GO Office, K2 |
| Parameter | Value | Uncertainty | Units |
| Outburst type | A | ||
| RA | 16:53:50.67 | 0.24” | J2000 |
| DEC | -24:46:26.50 | 0.24” | J2000 |
| Time of outburst | 2457690.66 | 0.01 | BJD |
| Break in rise | 10.0 | 0.2 | hours |
| Full Outburst Amplitude | 0.2 | mag | |
| Orbital Perioda | 0.05704 | 0.1% | days |
| Stage A Period | 0.0586 | 0.2% | days |
| Stage B, | 2.6% | day-2 | |
| SH Excess, | 0.0276 | 1.8% | |
| Mass Ratio, | 0.070 | 0.01 | |
| Disk velocity, | 460 | 70 | |
| Orbital inclination, | 84 | 5 | deg |
| Distance | pc | ||
| a From Early Superhumps | |||
Appendix A GMOS-N spectrum
The full range of the GMOS-N spectrum is shown in Fig. 14. As the spectrum was taken while KSN:BS-C11a was in quiescence, the source is faint, with only the Hα emission clearly resolved. The A band telluric absorption line is seen from 7600–7650 Å.
References
- Barclay et al. (2012) Barclay T., Still M., Jenkins J. M., Howell S. B., Roettenbacher R. M., 2012, MNRAS, 422, 1219
- Borucki et al. (2010) Borucki W. J., et al., 2010, Science, 327, 977
- Brown et al. (2015) Brown A., et al., 2015, AJ, 149, 67
- Casares (2015) Casares J., 2015, ApJ, 808, 80
- Casares (2016) Casares J., 2016, ApJ, 822, 99
- Chambers et al. (2016) Chambers K. C., et al., 2016, arXiv e-prints, p. arXiv:1612.05560
- Court et al. (2019) Court J. M. C., et al., 2019, MNRAS, 488, 4149
- Dimitriadis et al. (2019) Dimitriadis G., et al., 2019, ApJ, 870, L1
- Garnavich et al. (2016) Garnavich P. M., Tucker B. E., Rest A., Shaya E. J., Olling R. P., Kasen D., Villar A., 2016, ApJ, 820, 23
- Hōshi (1979) Hōshi R., 1979, Progress of Theoretical Physics, 61, 1307
- Howell et al. (2014) Howell S. B., et al., 2014, PASP, 126, 398
- Imada et al. (2006) Imada A., Kato T., Monard L. A. G., Retter A., Liu A., Nogami D., 2006, PASJ, 58, 383
- Ishioka et al. (2002) Ishioka R., et al., 2002, A&A, 381, L41
- Kato (2002) Kato T., 2002, PASJ, 54, L11
- Kato (2015) Kato T., 2015, PASJ, 67, 108
- Kato & Osaki (2013a) Kato T., Osaki Y., 2013a, PASJ, 65, 97
- Kato & Osaki (2013b) Kato T., Osaki Y., 2013b, PASJ, 65, 115
- Kato & Osaki (2013c) Kato T., Osaki Y., 2013c, PASJ, 65, L13
- Kato et al. (2014) Kato T., et al., 2014, PASJ, 66, 90
- Knigge et al. (2011) Knigge C., Baraffe I., Patterson J., 2011, ApJS, 194, 28
- Koch et al. (2010) Koch D. G., et al., 2010, ApJ, 713, L79
- Kolb & Baraffe (1999) Kolb U., Baraffe I., 1999, MNRAS, 309, 1034
- Lightkurve Collaboration et al. (2018) Lightkurve Collaboration et al., 2018, Lightkurve: Kepler and TESS time series analysis in Python, Astrophysics Source Code Library (ascl:1812.013)
- Lubow (1991a) Lubow S. H., 1991a, ApJ, 381, 259
- Lubow (1991b) Lubow S. H., 1991b, ApJ, 381, 268
- Osaki (1974) Osaki Y., 1974, PASJ, 26, 429
- Osaki (1989) Osaki Y., 1989, Publications of the Astronomical Society of Japan, 41, 1005
- Osaki & Meyer (2002) Osaki Y., Meyer F., 2002, A&A, 383, 574
- Patterson (2011) Patterson J., 2011, MNRAS, 411, 2695
- Rest et al. (2018) Rest A., et al., 2018, Nature Astronomy, 2, 307
- Ridden-Harper et al. (2020) Ridden-Harper R., Tucker B. E., Gully-Santiago M., Barentsen G., Rest A., Garnavich P., Shaya E., 2020, MNRAS, 12, 1
- Rutkowski et al. (2016) Rutkowski A., Waniak W., Preston G., Pych W., 2016, MNRAS, 463, 3290
- Schlafly & Finkbeiner (2011) Schlafly E. F., Finkbeiner D. P., 2011, ApJ, 737, 103
- Vican et al. (2011) Vican L., et al., 2011, PASP, 123, 1156
- Warner (1986) Warner B., 1986, MNRAS, 222, 11
- Wenger et al. (2000) Wenger M., et al., 2000, A&AS, 143, 9
- Whitehurst (1988) Whitehurst R., 1988, MNRAS, 232, 35