Study of charged-particle multiplicity fluctuations in collisions with Monte Carlo event generators at the LHC
Abstract
Proton-Proton () collisions at the Large Hadron Collider (LHC) are simulated in order to study events with a high local density of charged particles produced in narrow pseudorapidty windows of = 0.1, 0.2, and 0.5. The collisions are generated at center of mass energies of , , , and TeV, i.e. the energies at which the LHC has operated so far, using PYTHIA and HERWIG event generators. We have also studied the average of the maximum charged-particle density versus the event multiplicity for all events, using the different pseudorapidity windows. This study prepares for the multi-particle production background expected in a future search for anomalous high-density multiplicity fluctuations using the LHC data.
keywords:
PYTHIA, HERWIG, Collisions, Minimum Bias, High Multiplicity, Particle Density Fluctuations, Quark-Gluon Plasma.1 Introduction
The advent of the Large Hadron Collider (LHC) on the scientific scene offers a plethora of opportunities for searches for new physics phenomena beyond those produced in the current models and theories. While searching for physics beyond the Standard Model have been an intense study area using the LHC data, during the last 10 years, for hunting new particles or interactions, here we are interested in the potential to search for the production of anomalous high-density “spikes” of the number of particles produced in narrow pseudorapidity intervals. Events producing such anomalous particle clusters are called ring-like or spike events[1], since the particles typically tend to be emitted with nearly equal polar angle but extend in the full azimuthal angular phase space region, hence they can form a ring of particles in a plane perpendicular to the axis of collision.
First results on the observation of such multiplicity fluctuations were reported by cosmic rays experiments, see e.g. [2, 3, 4], and these somewhat unexpected results have led to the suggestion that such spikes of particles could result from the formation of “hot-spots” of matter, particularly in heavy ion collisions[5] and possibly in the form of a Quark-Gluon Plasma (QGP)[6], i.e. a dense state of quarks and gluons, where these gluons and quarks are no longer confined inside well-separated hadrons. Such new state of matter has been observed meanwhile at heavy ion experiments at the Relativistic Heavy Ion Collider (RHIC) and the LHC.
The UA5 collaboration [7] used a sample of so-called minimum bias events in proton-antiproton () collisions to search for signs of very high particle density fluctuations as a potential signal for new physics [8]. They observed events with 15 charged particles or more in a pseudorapidity window ( 0.5, in collisions at center of mass (C.M.) energy of 540 GeV. Here, is the difference in pseudorapidity () between two charged particles and , with the polar angle with respect to the beam axis.
In and collisions such formation of a new state of matter would however be highly unexpected, but other possible ideas for the origin of such effect in terms of coherent Quantum Chromodynamics (QCD) hadron production [4, 9, 10], analogous to well known Quantum Electrodynamics (QED) Cherenkov radiation, or Mach waves [11] have been proposed as well.
Inspired by the UA5 observation, the NA22 collaboration [12] at the CERN’s Super Proton Synchrotron (SPS) accelerator conducted a search for such spike events in , , and collisions at GeV. They studied the distribution of events versus the maximum charged-particle density () found in a rapidity window () = 0.1, and reported that the number of events () decreases with increasing of , following an approximate exponential dependence . In addition to the smooth exponential decrease of the data, they observed a single outlying anomalous event with 10 charged particles within a very narrow rapidity window of , corresponding to a density of about 100 particles per unit of rapidity. This is a higher density than what was observed by the UA5 experiment, despite that the C.M. energy for the collisions at the UA5 is about 25 times larger. The anomalous event is reported to have an expectation probability of which calculated from the exponential fit to the data, and the cluster of tracks is located very centrally in the event, near rapidity (y) = 0. The 10 particles are very uniformly distributed in the azimuthal angle (), and hence they don’t show the typical characteristics of a mini-jet formation.
J.B. Singh and J.M. Kohli [13] have studied the distribution of events with maximum charged () and total () particle density located within = 0.1 in collisions at GeV, based on the data recorded by the NA23 experiment. They observed events with a high local particle density of about 100 particles per unit rapidity but only when both charged and neutral particles are included. The exponential behavior was observed but no outlying anomalous events were reported, based on the total event statistics of NA23 which is a factor of four smaller than the one of NA22.
The NA22 collaboration further studied the average of the maximum number of charged particles , in 0.1 and 0.5, as a function of the full event multiplicity, i.e. the total number of charged particles produced in the collision. The result for 0.5 at GeV for was compared with the UA5 data[14] at 540 GeV for the same pseudorapidity window. The distribution has an approximate linear dependence on multiplicity and was found to be almost independent on the energy between 200 GeV to 900 GeV. The NA22 data support this observation and extended the range from 900 GeV down to 22 GeV. Several more studies were done on this topic at different C.M. energies [13, 16, 15], leading to similar findings.
As mentioned, one possible interpretation to explain such large density fluctuations and the production of events with anomalously high-density, as has been proposed, is the formation of the so-called hot-spots in a new state of matter, would not be that this is, really, only expected in nucleus-nucleus collisions and not in more simple , , or meson-proton collisions. Interestingly, in 2010, at the startup of the LHC at CERN, Geneva, Switzerland, when the first collisions at C.M. energy of 7 TeV were produced, the highest energy produced in the laboratory at that time, unexpected correlations were observed in minimum bias and high multiplicity events by the CMS experiment which were until then thought to be only produced in nucleus-nucleus collisions [17] and until then had been linked to the possible formation of QGP. The same intriguing phenomenon was subsequently observed by all LHC central detectors and with data at a higher energy of 13 TeV (e.g. for CMS see Ref. [18]). This was a very surprising result and so far has not been fully understood. This observation revived the interest in studying further potential QGP sensitive variables in nucleon-nucleon collisions, i.e. in a much simpler collision systems.
In that context, it is of interest to have a fresh look if the aforementioned multiplicity density fluctuations using the high energy and high rate LHC data and search for events with anomalous high particle density spikes. Observing such events can help to shed light on the origin of both the lower energy observations and the unexpected correlations measured in high energy collisions.
This short paper reports on the preparation for such a multiplicity fluctuations study using the LHC data, deploying the most general Monte Carlo event generators presently used for generating minimum bias collisions at the LHC. A minimum bias events is a technical term for a class of selected (triggered) collisions with an experimental on-line trigger that has a minimal selection bias on the collected data samples. Typically more than 95% of all produced inelastic events pass a minimum bias trigger at the LHC, but due to the extremely high production rate, only a very small fraction of these can be recorded and stored for off-line analysis, using the so-called trigger pre-scale factors. The special interest are on events with a very high charged-particle multiplicity, typically multiplicities larger than 100, which have a much lower production rate, and can be recorded without such pre-scale factors by the experiments.
The studies reported in this paper intend to show the characteristics of the data expected at the LHC, as predicted by the Monte Carlo event generators. These Monte Carlo generators are based on phenomenological models containing both soft low- (transverse momentum) peripheral scattering collisions, as well as Standard Model QCD and electro-weak hard scattering processes. They do not contain a new physics component that leads to anomalous high-density events and can, therefore, be treated as a baseline estimate of the expected data in the absence of any such new effects.
In this paper, we studied events with a high-density of charged particles within pseudorapidity windows of different widths taken as , 0.2, and 0.5. The resolution in for e.g. the central tracking detector of the CMS experiment is much better, by a factor of 3-5 than the most narrow interval we consider for the analysis here.
The multiplicity dependence of the average of the maximum number of charged particles inside the selected window has been studied as well. The PYTHIA and HERWIG Monte Carlo programs have been used to simulate the collisions in a wide range of energies at the LHC. Two samples are considered, a full minimum bias sample and a selected high multiplicity sample. Note that, the central experiments at the LHC, such as ATLAS and CMS, do not have full coverage of the particle production but, for charged tracks, only cover the central part , which will be emulated in the study.
2 Analysis
2.1 PYTHIA and HERWIG event generators
PYTHIA [19] and HERWIG [20] are general-purpose Monte Carlo event generators that are actively used at the LHC. These generators have undergone decades of development and tuning to collider and other data.
The event generation for both generators consists of several steps starting typically from a hard scattering process, followed by initial- and final-state parton showering, multi-parton interactions, and the final hadronization process. HERWIG and PYTHIA use different model approaches for these steps, e.g. PYTHIA uses a -ordered approach [21] for modeling of parton shower while HERWIG deploys angular-ordered showers [22]. Multi-parton scattering in PYTHIA uses the original impact parameter model [23] while HERWIG applies the eikonal multiple partonic scattering model [24]. The last step is the hadronization (fragmentation) of partons into hadrons; this process is performed in PYTHIA with the Lund string fragmentation model [25, 26] and an alternative model used by HERWIG is based on cluster fragmentation [27]. Both Monte Carlo programs include a model to generate soft hadronic collisions which make up the largest part of a sample of minimum bias events. Note also that, the minimum bias events contain not only soft events but a mix of all event classes produced in the interactions according to their relative cross-sections.
The proton-proton collisions are generated using the HERWIG 7.1.5 [28] and the PYTHIA 8.186 [29] versions of the programs. The collisions are generated at , , , and TeV corresponding to the energies at which the LHC was operated from 2010 till 2018. About 5.106 events were generated for both HERWIG and PYTHIA at each C.M. energy using the minimum bias generation settings of the generators.
For PYTHIA, the inelastic (diffractive and non-diffractive) proton-proton collisions were simulated by using the PYTHIA Monash 2013 tune [30]. The Monash parameters are tuned in such a way that these provide a good description of the experimental data at the LHC energies e.g. the minimum bias charged multiplicity and other event characteristics.
For HERWIG the minimum bias events were simulated by using the baryonic reconnection tune which is a set of parameters recommended for usage when running the baryonic color reconnection model for LHC energies. It was tuned to generate minimum bias LHC data at 7 TeV and 13 TeV, and provides a good description of charged-particle multiplicities and particle flavor observables in collisions [31]. The values of baryonic reconnection parameters are available in Ref.[32].
The events and particles are selected for this analysis according to the following criteria. For the minimum bias selection, each event must have at least one charged particle in the final-state which emitted within the pseudorapidity range 2.5 (in the full acceptance of the azimuthal angle ) and with minimum of 100 MeV. Experiments such as UA5 (no magnetic field) and NA22/23 (bubble chambers) have negligible particle losses at low momenta, but in an experiment such as CMS, with a very strong magnetic field, the lower limit on the of a particle to be reconstructed with sufficient quality is about 100 MeV[33]. The effect on this measurement is however very small, as will be shown later.
Furthermore, the high multiplicity event samples were selected with a multiplicity cut on the charged particles, depending on the center of mass energy of the collisions: events with a minimum number of produced charged particles larger than 100 for 13 TeV, larger than 80 for 7-8 TeV and larger than 70 for 2.36 TeV. These selections correspond to realistic multiplicity thresholds as have been applied at the trigger level in the CMS experiment. The number of events used, which pass the multiplicity cuts, are given in table 1.
| \toprule | Multiplicity Cut | HERWIG | PYTHIA |
|---|---|---|---|
| 13 | 163787 | 297427 | |
| 8 | 237936 | 364641 | |
| 7 | 211851 | 320381 | |
| 2.36 | 93735 | 136225 |
2.2 Maximum particle density method and the relation between its average and multiplicity
For each event, the maximum number of charged particles within a window of pseudorapidity, of say = 0.1, was calculated by sliding this window over the full pseudorapidity range, each time the window is starting at an value of a particle in the event and ending at . The sliding window found with the maximum number of particles is used for filling the histograms.
The same distribution was made for = 0.2 and = 0.5 windows and for all different collision energies. This method was employed both with the full minimum bias event sample and with the high multiplicity selected events.
The average of the maximum density of the emitted charged particles as a function of the event multiplicity measured within the pseudorapidity range is reported as well.
3 Results and Discussion
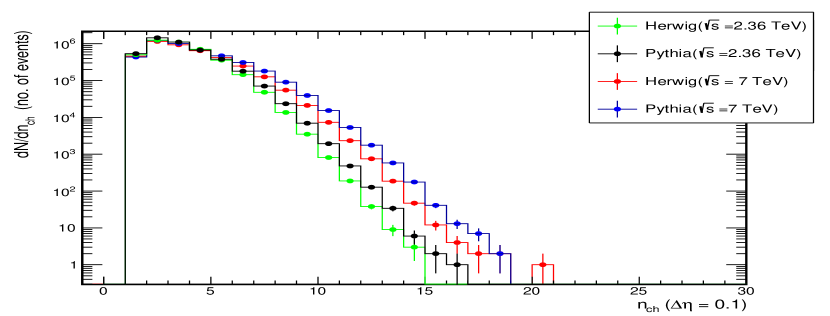
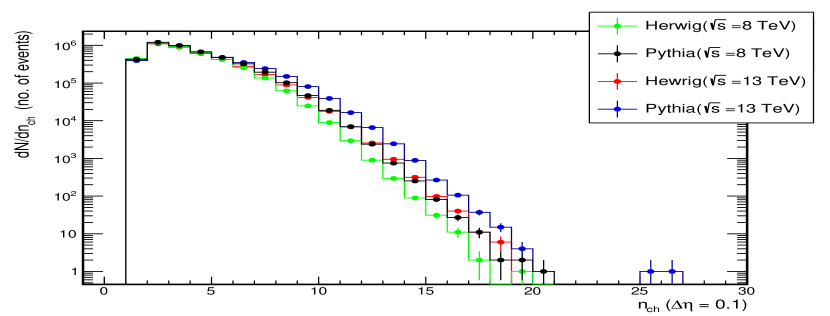
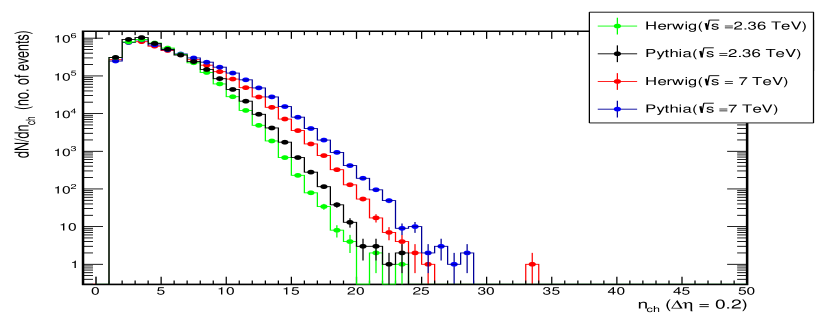
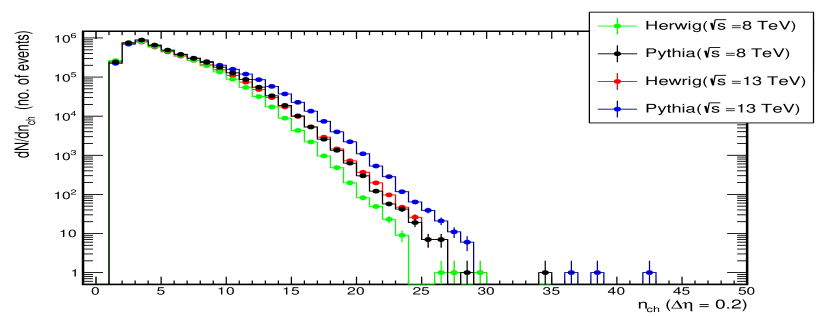
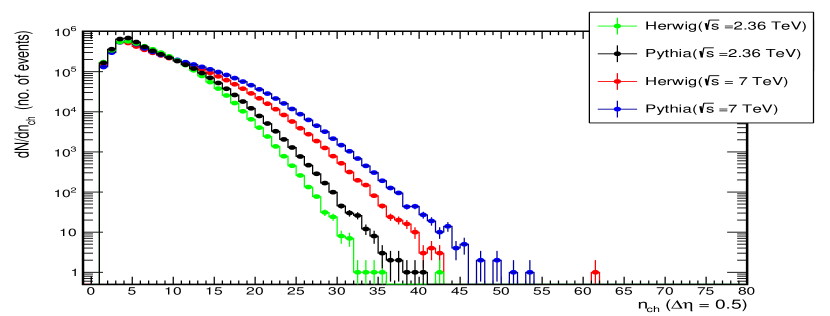
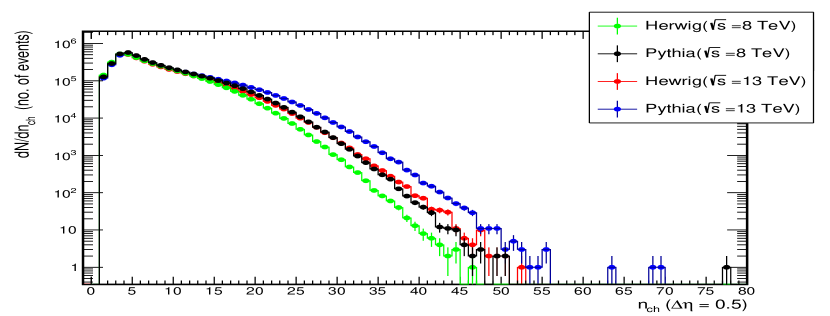
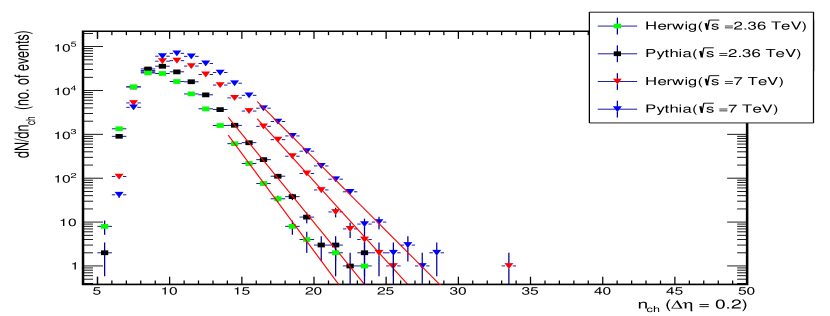
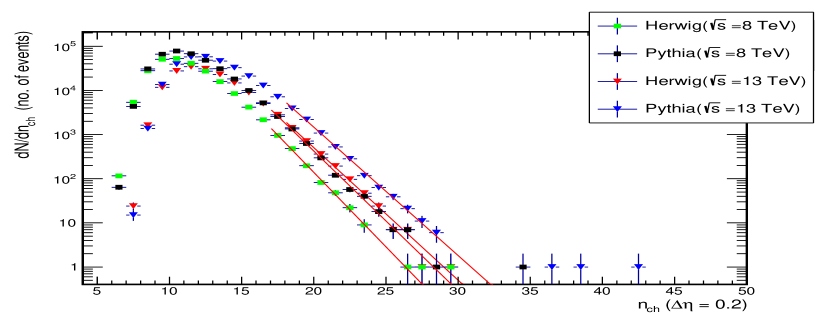
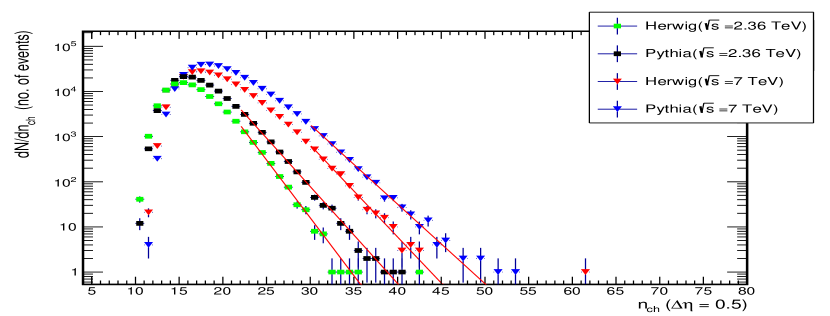
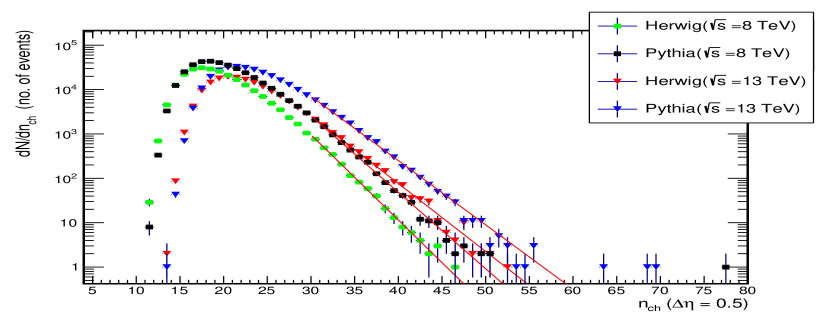
Figs. 1.(a,c,e) show the distribution for minimum bias events of the maximum charged-particle density found within = 0.1, 0.2 and 0.5, calculated with PYTHIA and HERWIG for collisions at C.M. energies of 2.36 and 7 TeV. Figs. 1.(b,d,f) show the same distributions for collision energies 8 and 13 TeV. All figures show, for a minimum of two particles, the expected number of events is decreasing with increasing of for 5, and the width of the distributions increases with increasing of the C.M. energy: for higher energies larger values of are reached, as expected. For all energies, the relative number of events with large density produced by PYTHIA is slightly higher than the events produced by HERWIG. In fact, the ratio of the PYTHIA to HERWIG distribution shows that the ratio is fairly constant up to is 5 (10) for the search with = 0.1 (0.5) but rises to a value of 2-4 at the highest densities. This is not unexpected and, in most part, due to the different hadronization model used in these two Monte Carlo programs.
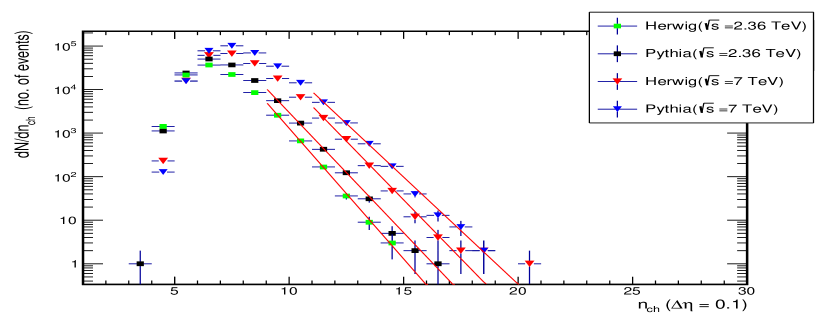
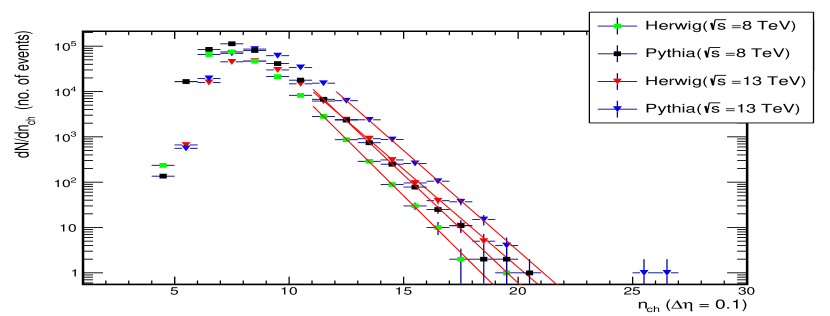
Similar distributions for high multiplicity selected events are shown in Figs. 2.(a,c,e) for PYTHIA and HERWIG at 2.36 and 7 TeV respectively, and Figs. 2.(b,d,f) are for 8 and 13 TeV.
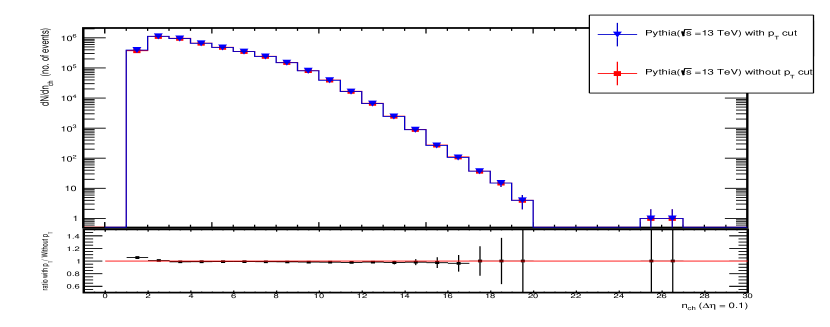
It is interesting to notice that the effect of the 100 MeV cut-off in the collider experiments does not have a significant impact on this measurement as expected by PYTHIA and still small but slightly larger as expected by HERWIG. The influence of the cut predicted by PYTHIA is shown in Fig. 3, which compares the distributions with and without the 100 MeV cut, at C.M. energy of 13 TeV and 0.1.
The rate of events with a large density of charged particles inside a small window decreased exponentially with increasing of the maximum number of charged particles inside the same window size , according to the relation as suggested also by the measurements in earlier experiments. Fitted values of the parameters and are given in table 2.
Generally, this gives good fits of the data, with a /NDF around one, showing a smooth single component for the shape of these distributions. The b-parameter is physics-wise the most significant one and allows e.g. to compare with measurements from earlier experiments. It is interesting to note that we find the value of the b-parameter for the search with , is around one and essentially identical to the values found and reported in [12] for similar fits. Exponential fits were also made on the minimum bias distributions. The b-parameters were found to be very similar, generally larger by a few % compared to those derived from the high multiplicity distributions hence showing that the bias for the high multiplicity selection is very small, and will give a representative account for the anomaly search.
Clearly, and as expected, we observe a few events at high values where less than one event would be expected based on these fits, due to statistical fluctuations in the data, but we do not observe a significant tail. These fluctuations can lead to single events that can pass the maximum expected value from the fits, extending the range by approximately 20-30%. Hence, the conclusions of future real measurements made with the LHC data cannot be based just on a few events outside the expected region.
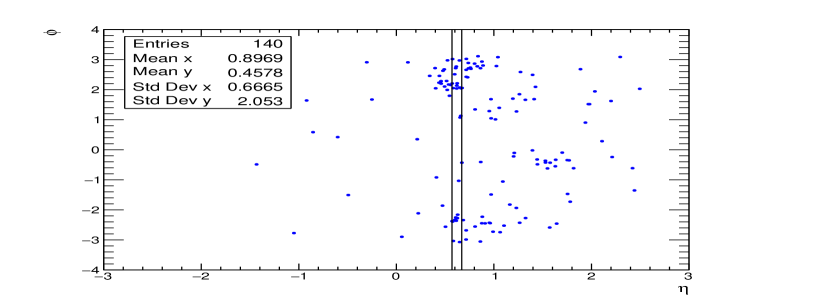
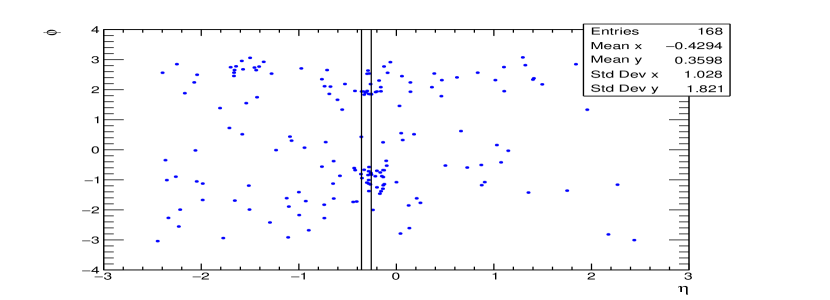
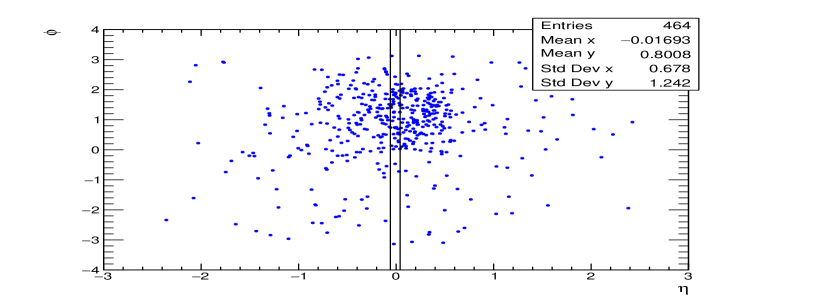
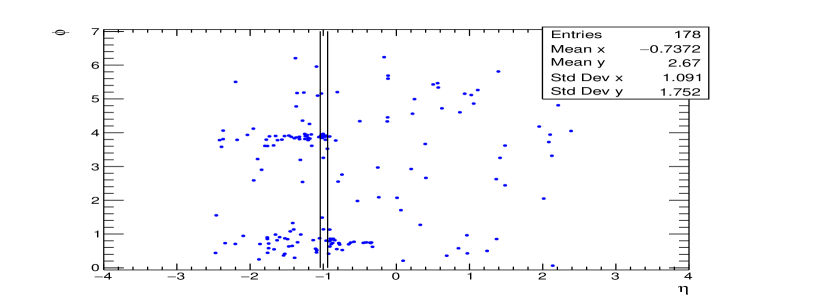
For the analysis of the selection, we find four outlying events. Three of these events are visible in Figs. 1 (a,b) with 20, 25, and 26 particles in this small pseudo-rapidity interval. This corresponds to an expectation probability to observe such an event of 0.01-0.005 calculated using the exponential fit predictions given in table 2. One very anomalous event -not shown in the figures- was produced in the PYTHIA generation at a C.M. energy of 8 TeV, and gave as much as 48 charged particles in an interval ! This event has a total charged multiplicity of 464 which is exceptionally high. It was analyzed in detail and found to be a QCD multi-jet event with the characteristic of having four multi-parton interactions (MPIs). This demonstrates again that a low number of observed anomalous events will always be difficult to be conclusive.
If we further specifically search for signals of models related to a QCD Cherenkov radiation, a relative uniform distribution of the particles in the variable is expected. We show for the four “anomalous events” discussed above an event display of the particle distribution in the plane and indicate on the figure the interval found with the highest density of particles, see Fig. 4. We, clearly, observe that the particles strongly cluster in the plane, likely caused by QCD radiation and jetiness, unlike what would be expected from such a new QCD Cherenkov effect. Hence the simultaneous analysis of the outlying events with high densities and the plane analysis should help to establish the genuine anomalous nature of the events.
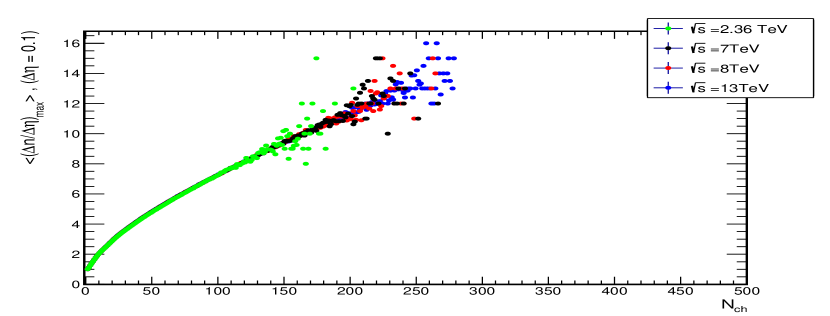
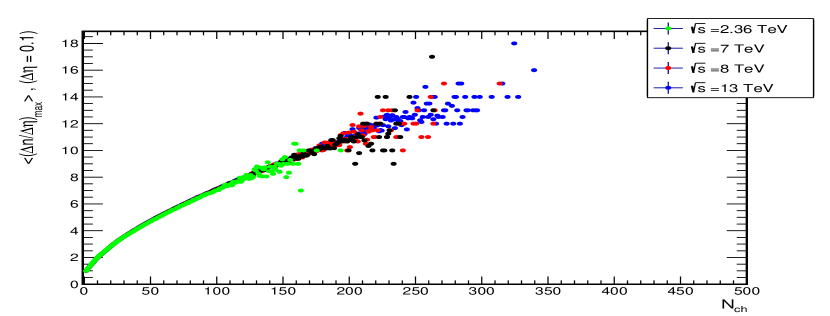
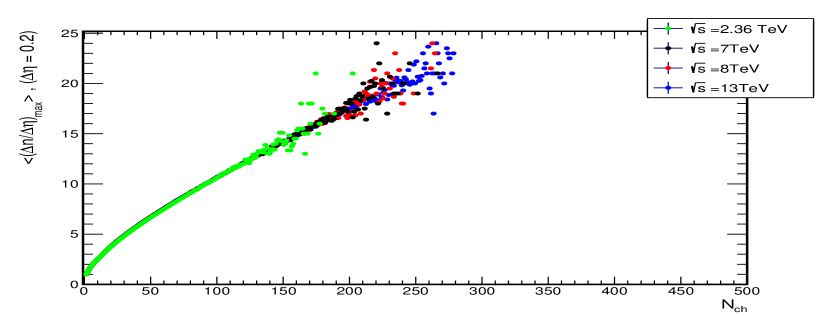
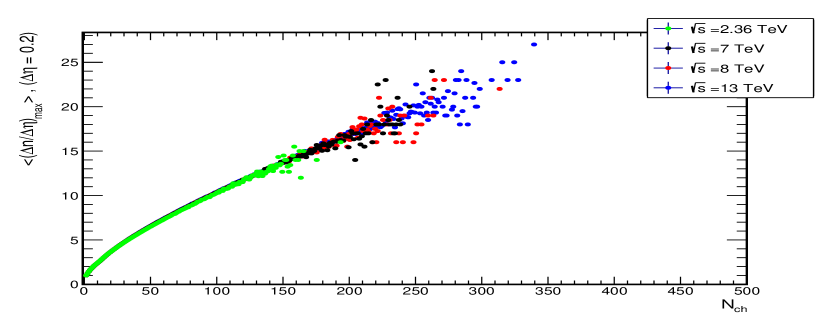
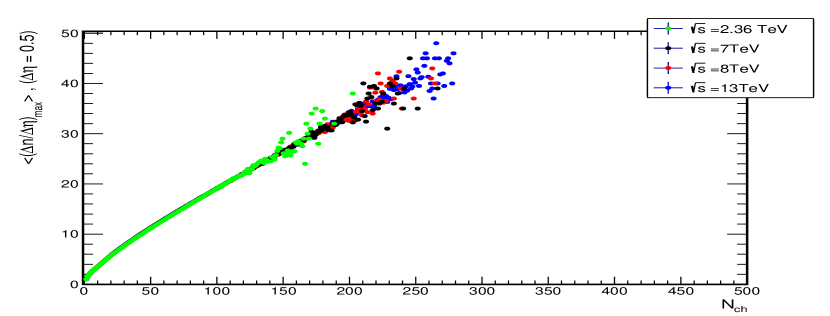
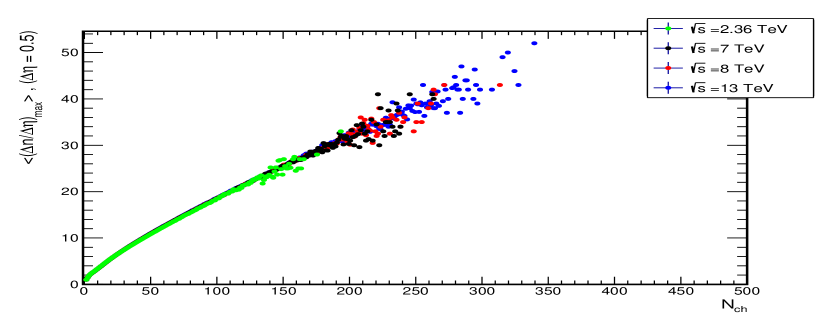
The relation between and the total charged-particle multiplicity in the region of is represented in Figs. 5.(a,c,e) for PYTHIA and Figs. 5.(b,d,f) for HERWIG. Fig. 5 shows an almost linear dependence of on the multiplicity for all pseudorapidity window sizes and all energies. This relation is also independent on the energy up to a multiplicity of 120 which was also observed by the UA5 and NA22 results. For larger values than 120, the fluctuations are increased, due to the small number of produced events with a large multiplicity.
| Fitting Range | |||
|---|---|---|---|
| PYTHIA at =0.1 | |||
| 13 TeV | 12-23 | ||
| 8 TeV | 11-21 | ||
| 7 TeV | 11-21 | ||
| 2.36 TeV | 9-18 | ||
| HERWIG at =0.1 | |||
| 13 TeV | 11-23 | ||
| 8 TeV | 11-21 | ||
| 7 TeV | 11-21 | ||
| 2.36 TeV | 9-18 | ||
| PYTHIA at =0.2 | |||
| 13 TeV | 18-36 | ||
| 8 TeV | 17-30 | ||
| 7 TeV | 16-30 | ||
| 2.36 TeV | 14-26 | ||
| HERWIG at =0.2 | |||
| 13 TeV | 18-36 | ||
| 8 TeV | 17-30 | ||
| 7 TeV | 16-30 | ||
| 2.36 TeV | 14-26 | ||
| PYTHIA at =0.5 | |||
| 13 TeV | 30-60 | ||
| 8 TeV | 30-54 | ||
| 7 TeV | 30-52 | ||
| 2.36 TeV | 22-42 | ||
| HERWIG at =0.5 | |||
| 13 TeV | 30-60 | ||
| 8 TeV | 30-54 | ||
| 7 TeV | 30-52 | ||
| 2.36 TeV | 22-42 |
4 Conclusion
In hadron-hadron collisions, events with a large number of charged particles within very narrow pseudorapidity windows have been observed by previous experiments. Such analysis should be conducted at the LHC in particular due to the availability of a large minimum bias data sets selected at the trigger level with high total charged-particle multiplicities. These trigger selection cuts will not significantly affect such a study.
In this paper, we show the baseline expectation, as predicted by two phenomenological models( PYTHIA and HERWIG), for such a typical analysis. The models predict that the exponential behavior of the will be expected for multi-particle production in the high energy regime of the LHC, and can be used as a monitor of the shape of the distribution to define a search region for anomalous events.
However establishing any new effects based on one or just a few events, as often done in previous experiments, will not be an option. But we expect the maximum track density method to be an effective technique in searching for anomalous events in the LHC data when complemented with an analysis in the dimension. Also, the average of the maximum number of charged particles has an almost linear dependence on the total multiplicity and approximately independent on the energy up to multiplicities of 120, and will extend the previous work from a center of mass energy of 22 GeV up to 13-14 TeV.
References
- [1] I.M. Dremin and A.M. Orlov, “Ring events in high-energy hadron processes”, JETP Lett. 40 (1984) 1115.
- [2] N. Arata, “A cosmic-ray nuclear event of abnormally high multiplicity and large transverse momenta”, Il Nuovo Cimento A (1965-1970) 43 (1978) 455.
- [3] T.H. Burnett et al., “Extremely high multiplicities in high-energy nucleus-nucleus collisions”, Phys. Rev. Lett. 50 (1983) 2062.
- [4] A.V. Apanasenko et al., “New interpretation of some“ anomalous” events in cosmic rays”, JETP Lett. 30 (1979) 145.
- [5] R. Hwa, “A Proposed Analysis of Multiplicity Fluctuations in High-energy Heavy Ion Collisions”, Phys. Lett. B 201 (1988) 165.
- [6] M. Gyulassy, “Nuclear collisions from AMeV to ATeV: From nuclear to quark matter”, Nuc. Phys. A 400 (1983) 31.
- [7] P. Carlson, “New results from UA5: strange particle (, , ) production and large fluctuations in multiplicities”, CERN-PRE-84-013 (1984).
- [8] L. Van Hove, “Hadronization Model for Quark-Gluon Plasma in Ultra-Relativistic Collisions”, Zeitschrift für Physik C Particles and Fields 27 (1985) 135.
- [9] I. M. Dremin, “Coherent hadron radiation at extremely high energies”, JETP Lett. 30 (1979) 140.
- [10] I.M. Dremin, L.I. Sarycheva and K.Yu. Teplov, “High energy Cerenkov gluons at RHIC and LHC”, Eur. Phys. J. C 46 (2006) 429.
- [11] I.M. Dremin, “Ring-like events: Cherenkov gluons or Mach waves?”, Nuc. Phys. A 767 (2006) 233.
- [12] M. Adamus and et al., “Maximum particle densities in rapidity space of p, p and collisions at 250 GeV/c”, Phys. Lett. B 185 (1987) 200.
- [13] J.B. Singh and J.M. Kohli, “A study of particle densities in rapidity space in collisions at 360 GeV/c”, Phys. Lett. B 261 (1991) 155.
- [14] C. Geich-Gimbel, “New results from the UA5/2 experiment”, CERN-PRE-85-093 (1985).
- [15] F. Fabbri, “Maximum charged particle densities in small intervals of rapidity at ISR energies”, CM-P00052034 (1988) 197.
- [16] N.M. Agababyan et al., “Comparison of spike production in and p/ p interactions at 205–360 GeV/c”, Phys. Lett. B 389 (1996) 397.
- [17] V. Khachatryan et al., “Observation of long-range, near-side angular correlations in proton-proton collisions at the LHC”, JHEP 2010 (2010) 91.
- [18] V. Khachatryan et al., “Measurement of Long-Range Near-Side Two-Particle Angular Correlations in Collisions at 13 TeV”, Phys. Rev. Lett. 116 (2016) 172302.
- [19] T. Sjöstrand, S. Mrenna and P. Skands, “PYTHIA 6.4 physics and manual”, JHEP 2006 (2006) 026.
- [20] M. Bähr et al., “Herwig++ physics and manual”, Eur. Phys. J. C 58 (2008) 639.
- [21] T. Sjöstrand and P. Z. Skands, “Transverse-momentum-ordered showers and interleaved multiple interactions”, Eur. Phys. J. C Part. Fields 39 (2005) 129.
- [22] S. Gieseke, P. Stephens and B. Webber, “New formalism for QCD parton showers”, JHEP 12 (2003) 045.
- [23] T. Sjöstrand and M. van Zijl, “A multiple-interaction model for the event structure in hadron collisions”, Phys. Rev. D 36 (1987) 2019.
- [24] M. Bähr, S. Gieseke and M. H. Seymour, “Simulation of multiple partonic interactions in Herwig++”, J. High Energy Phys. 07 (2008) 076.
- [25] B. Andersson, G. Gustafson, G. Ingelman and T. Sjöstrand, “Parton fragmentation and string dynamics”, Phys. Rep. 97 (1983) 31.
- [26] T. Sjöstrand, “Jet fragmentation of multiparton configurations in a string framework”, Nuc. Phys. B 248 (1984) 469.
- [27] B.R. Webber, “A QCD model for jet fragmentation including soft gluon interference”, Nuc. Phys. B 238 (1984) 492.
- [28] https://herwig.hepforge.org
- [29] http://home.thep.lu.se/~torbjorn/Pythia.html
- [30] P. Skands, S. Carrazza and J. Rojo, “Tuning PYTHIA 8.1: the Monash 2013 tune”, Eur. Phys. J. C 74 (2014) 3024.
- [31] S. Gieseke, P. Kirchgaeßer and S. Plätzer, “Baryon production from cluster hadronisation”, Eur. Phys. J. C 78 (2018) 99.
- [32] https://herwig.hepforge.org/tutorials/mpi/tunes.html
- [33] V. Khachatryan et al., “Charged Particle Multiplicities in Interactions at , 2.36, and 7 TeV”, JHEP 01 (2011) 079.