A quantitative explanation of the type-B QPOs in GX 339–4
Abstract
Context. Type-B quasi periodic oscillations (QPOs) in black-hole X-ray binaries (BHXRBs) are a class of low-frequency QPOs that are observed in the soft intermediate state in the rising and the declining phases of an outburst. They are suspected to result from the precession of the jet that is ejected from the source.
Aims. The objective of the present work is to investigate in detail the emissivity of the jet in hard X-rays and to see whether the type-B QPOs from GX 339-4, which is the best studied black-hole transient, can be explained quantitatively with a precessing jet.
Methods. We used our simple jet model, which invokes Comptonization in the jet, and examined the angular dependence of the upscattered photons that emerge from the jet and their energy distribution, which is a power law.
Results. Due to the elongation of the jet, assisted by the bulk motion of the electrons, the angular distribution of the emerging hard X-ray photons from the jet is not isotropic. More importantly, the photon-number spectral index, is an increasing function of the polar angle, with respect to the axis of the jet. If the jet is fixed, then an observer at infinity sees the photon index, which corresponds to this specific observational direction. However, if the jet is precessing, then the observer sees a periodic variation of with the precession period. Such a periodic variation of has been observed in GX 339-4 and in this work, we reproduce it quantitatively, using our model.
Conclusions. Our jet model nicely explains through quantitative means the type-B QPOs seen in GX 339-4 as originating from a precessing jet. The given model has previously explained several observed correlations thus far.
Key Words.:
accretion, accretion disks – X-ray binaries: black holes – jets – X-ray spectra – QPOs1 Introduction
During their outbursts, black-hole X-ray binaries (BHXRBs) exhibit a characteristic hysteresis curve in a hardness-luminosity diagram (Miyamoto et al., 1995; Homan et al., 2001; Belloni et al., 2005; Homan & Belloni, 2005; Gierliński & Newton, 2006; Remillard & McClintock, 2006; Fender et al., 2009; Motta et al., 2009; Belloni, 2010; Muñoz-Darias et al., 2011; Stiele et al., 2011). As the luminosity increases during an outburst, the sources exhibit a range of characteristic states, which, in the classification of Belloni et al. (2005), are referred to as: quiescent, hard, hard-intermediate, soft-intermediate, and soft. As the luminosity decreases over the decline of an outburst, the states are traced back in the opposite order.
During the rise of an outburst, a compact jet is always seen in the first three states. By the soft intermediate state, a jet had previously been suspected to be present but it is confirmed that it has been observed (Russell et al., 2020). In the soft state, the jet disappears.
As the luminosity decreases, the jet is suspected to have been re-established in the soft intermediate state, while it is detected in the hard intermediate state (Corbel et al., 2013). Near the end of the hard intermediate state, the jet becomes compact and stays so in the hard and the quiescent states.
These BHXRBs exhibit three types of low-frequency quasi periodic oscillations (QPOs), A, B, and C (Wijnands et al., 1999; Casella et al., 2005; Motta et al., 2012). Here, we concentrate on the type-B QPOs, which are seen only in the soft intermediate state. The characteristic frequency of the type-B QPOs is in the relatively narrow range of 1 - 6 Hz (Motta et al., 2011), while at high-flux intervals, the range becomes even narrower (4 - 6 Hz) (Casella et al., 2004; Motta et al., 2011).
Kylafis & Belloni (2015) speculated that Type-B QPOs are associated with the last ”gasps” of the jet in the rising part of an outburst and with the re-establishment of the jet in the declining part. This idea was supported by the observational fact that the type-B QPOs are stronger in low-inclination sources (Motta et al., 2015).
Stevens & Uttley (2016) performed phase-resolved spectroscopy of the type-B QPOs in GX 339-4. They found that the photon-number spectral index varies sinusoidally from to with the QPO frequency, Hz. They suggested that these variations can be explained with a precessing jet.
It is generally assumed that the hard X-ray power law with photon index in BHXRBs is produced by Compton upscattering of soft photons. The soft photons come from the thin disk (Shakura & Sunyaev, 1973, hereafter SS-disk) and they are Comptonized in the corona (Esin et al., 1997; Done et al., 2007). The corona is naturally taken to be the hot inner flow, that is, the flow inside the SS-disk, which is geometrically thick and optically thin (Narayan & Yi, 1994, 1995).
This picture, however, neglects the fact that the jet is fed from the hot inner flow and there is no boundary between the two. Thus, soft photons from the SS-disk may initially be scattered in the corona, but most of them cannot escape without entering the jet and being scattered there. Since photons forget their past history after a few scatterings, it is the Comptonization in the jet that determines the observed (Reig et al., 2003; Giannios et al., 2004; Giannios, 2005; Kylafis et al., 2008; Reig & Kylafis, 2015; Kylafis & Reig, 2018; Reig et al., 2018).
In Reig & Kylafis (2019), we showed that the observed photon index depends on the inclination angle of the source. If we could see the same source from different directions, the spectra would become softer (i.e., with larger ) as the inclination angle increases (see Fig. 6 in Reig & Kylafis, 2019). But this is exactly what would also happen for a source, with a fixed viewing angle, if the hard X-rays come from the jet and the jet is precessing. For this reason, we examine in this letter how depends on the viewing angle and we quantitatively explain the periodic variation of found by Stevens & Uttley (2016). In § 2 we briefly discuss our model, in § 3 we present the results of our calculations, in § 4 we discuss our work, and in § 5 we give our conclusions.
2 Jet model
For our calculations, we used a simple jet model, which was previously presented in Reig & Kylafis (2019). Here we describe it briefly.
The model assumes a parabolic jet, as the observations suggest (Asada & Nakamura, 2012; Kovalev et al., 2020), with an acceleration zone near its base and constant flow beyond it. The parabolic shape of the jet implies that the radius of the jet as a function of distance from the black hole is given by , where and denote the distance of the base of the jet from the black hole and the radius of the jet, respectively. As in our previous work, the acceleration zone is taken to be between and , where is the gravitational radius. The flow speed in the jet is again taken to be , for , and for . The electron density in the jet is determined from the continuity equation and for , it falls to . The distribution of the electrons in Lorentz in the jet is assumed to be a steep power law, thus, most of the electrons have , where is the perpendicular component of the electron velocity in the jet.
We parametrize our models either with the Thomson optical depth, , along the axis of the jet or with the radius at the base of the jet. The rest of the parameters are kept at the constant values given above. Since the jet in the soft intermediate state is very weak, the values of are relatively small. The perpendicular Thomson optical depth in the jet at height, is , where is the electron number density at a height, in the jet, which can be determined from the continuity equation if is given.
Soft blackbody photons ( keV) from the SS-disk enter the jet at its base and their random walk in the jet is followed by a Monte Carlo code. The model and the code have been used for many years with many successes. In particular, the model explains the spectra of BHXRBs from radio to hard X-rays (Giannios, 2005), the time lag versus Fourier frequency (Reig et al., 2003), the narrowing of the autocorrelation function with photon energy (Giannios et al., 2004), the correlation between time lag and photon index (Kylafis et al., 2008; Kylafis & Reig, 2018; Reig et al., 2018), the correlation between cutoff energy and phase lag (Reig & Kylafis, 2015), and the inclination dependence of the correlation between time lag and Reig & Kylafis (2019).
3 Results
We performed Monte Carlo calculations for the radiative transfer of blackbody photons in the jet and computed the emergent spectra as a function of the angle between the line of sight and the jet axis.
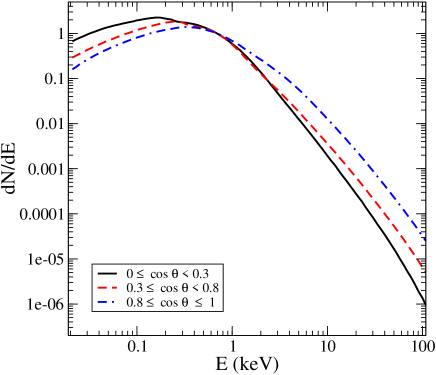
The spectra are power laws with photon index and have a high-energy cutoff. In Fig. 1, we show a representative example of the emergent spectra from the jet (), in three direction bins: (dot-dashed line), (dashed line), and (solid line). We have normalized the spectra by the flux at 0.7 keV to emphasize the change in the slope at high energies. It is clear from this figure that the photon index of the power law depends on the direction of observation.
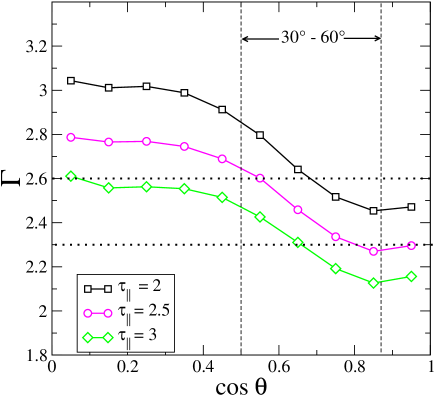
In Fig. 2, we show model results of versus for various values of and a fixed value of . We see more quantitatively than in Fig. 1 that the photon index has a strong dependence on the viewing angle . The spectra have s that range from to , consistent with the observations in the soft intermediate state. For low values of (i.e., for sources seen face-on), the spectra are relatively hard (). For values of near , the spectra are significantly softer and ranges from to . This requires a qualitative explanation.
Let us consider a ”static” Comptonizing spherical cloud of optical depth of equaling a few units, and seed photons coming in from outside, along the diameter. The first scattering occurs, on average, one mean-free path into the cloud, that is, optical depth equal to one from the surface. There, they scatter isotropically, but after that, the photons see an optical depth of in the forward direction (the direction of entrance), in the backward direction, and intermediate optical depths at intermediate directions. Given the velocity distribution of the electrons, the photon index produced by Comptonization depends only on the optical depth. Therefore, photons that emerge in the forward direction would have scattered more times than those in the backward direction. As a result, the spectra are harder (smaller ) in the forward direction and they soften monotonically from the forward to the backward direction. Thus, even if the jet had no bulk velocity, the emergent spectra would be harder in the forward direction because the seed photons enter at the base of the jet. This effect is enhanced if there is significant bulk motion because the photons are “pushed” in the forward direction by the flow. We have found, based on our jet model, that the photons that have scattered the largest number of times in the jet come out preferentially in the forward direction.
Another result shown in Fig. 2 is that as the radius increases, the spectra become harder (smaller ). This is because the perpendicular optical depth increases and as a result, the soft photons are trapped in the jet and scatter more times.

The two horizontal dotted lines give the range of as seen by Stevens & Uttley (2016) in GX 339-4 in the periodic variation of with the type-B QPO frequency. The inclination angle of GX 339-4 is believed to be degrees (Shidatsu et al., 2011; Fürst et al., 2015). Thus, the two vertical dotted lines allow for a precession angle of 15 degrees. The bounds in and place significant constraints on the models. For and the fixed values of the other parameters discussed in § 2, precessing jets with may explain the periodic variation of with the type-B QPO frequency.
In Fig. 3, we show model results of versus for various values of and . The curves have the same morphology as in Fig. 2. As increases, so does , and the spectra become harder. Not surprisingly, the bounds in and select models close to the ones selected in Fig. 2, namely and .
4 Discussion
Their X-ray spectra and time variability are the two main observational quantities in BHXRBs. A lot of effort has been put into explaining these quantities and building models that reproduce them satisfactorily.
The spectra alone do not place significant constraints on the models, either on the geometry or on the type of electrons, whether thermal or non-thermal. Given enough freedom on the geometry, the optical depth, and the distribution of electron velocities, practically any observed X-ray spectrum can be reproduced. In other words, the X-ray spectra of BHXRBs are infinitely degenerate and, by themselves, they cannot uniquely constrain any physical parameters.
On the contrary, time variability properties (e.g., the properties of QPOs, time lags, power-spectra, etc.) can place significant constrains on theoretical models. One such time-variability property is the one we study in this work, which was first published by Stevens & Uttley (2016). They performed phase-resolved spectroscopy on the type-B QPOs in GX 339-4 and they showed that the shape of the hard X-ray spectrum varies with the QPO phase. In particular, the photon-number spectral index varies sinusoidally with the QPO frequency. Rather intuitively, Stevens & Uttley (2016) proposed that this variation of is due to a precessing jet.
The above proposal, along with the fact that Comptonization in a jet results in direction-dependent energy spectra (Reig et al., 2003; Reig & Kylafis, 2019), have led us to a quantitative investigation of the dependence of with the QPO phase in the range of . For an inclination angle of degrees for GX 339-4, we find that precession of the jet, resulting in observational direction variation in the range of degrees, can quantitatively explain type-B QPOs.
We searched the parameter space for and and found that if and then a precessing jet can explain the variation of observed by Stevens & Uttley (2016). It is beyond the scope of the present letter to undertake an extensive search for the other parameters, however, we can attest to the following. Our results are insensitive to the value of the temperature, , of the blackbody photons. The case is similar for the parameter, , which denotes the distance of the base of the jet from the black hole. This, however, will not be the case if general relativistic effects are taken into account. The width of the acceleration zone is not a crucial parameter either. In contrast, our results are sensitive to and and their values cannot stray too far from the ones that we used in this study. As decreases, the spectra become less anisotropic and, therefore, the variation of with is weaker. The opposite happens when increases. A small variation of , on the other hand, can be accommodated by a corresponding variation of . For example, a 10% increase in can be accommodated by a similar decrease in .
The results presented in this work, as well as the results from our previous works (Reig et al., 2003; Giannios et al., 2004; Giannios, 2005; Kylafis et al., 2008; Reig & Kylafis, 2015; Kylafis & Reig, 2018; Reig et al., 2018; Reig & Kylafis, 2019), show that Comptonization in the jet is a major source of the hard X-ray photons emitted by BHXBs. In the quiescent, hard, hard-intermediate, and soft-intermediate states, a compact jet is fed from the corona. Thus, a significant fraction of the soft photons that enter the corona to be Comptonized cannot escape without entering the jet and also being scattered there.
In addition to the explanation of the spectral variations in type-B QPOs, our jet model can explain several observations and a number of correlations. For example, it can explain the correlation between and time lags in GX 339-4 (Kylafis & Reig, 2018). Such a correlation may actually be omnipresent in BHXRBs (Reig et al., 2018). This result cannot be explained by the propagating fluctuations model (Lyubarskii, 1997; Kotov et al., 2001; Arévalo & Uttley, 2006; Rapisarda et al., 2017), which also provides a physical description of the time lags in BHXRBs. It is possible that this mechanism may take place in accretion flows, because fluctuations are inevitable, but no correlation between and time lags would be expected in this case because the timescale of propagating fluctuations is determined by the properties of the accretion flow, while is determined by the optical depth and the temperature of the corona. On the other hand, time lags due to Comptonization seem unavoidable, when there is a jet, because the jet is situated above and below the corona. Finally, we note that our model not only explains existing correlations, but it also predicts new ones. Our jet model predicts that a correlation between the break frequency in the radio spectrum of GX 339-4 and the photon index , should be seen during the rising part of a future outburst (Kylafis & Reig, 2018).
It seems appropriate to make some remarks regarding similarities and dissimilarities between type-C and type-B QPOs. In both, precession seems to play a central role, yet it is widely accepted that two different mechanisms are involved in these two types of QPOs (Motta et al., 2011).
For type-B QPOs, we have shown that they can be explained quantitatively with Comptonization in a precessing jet. The precessing jet is fed from a precessing corona (hot inner flow) and we note that such a precessing jet has already been seen in general relativistic magnetohydrodynamic simulations (Liska et al., 2018). Comptonization in the corona can precede Comptonization in the jet, without any significant effect on the observed spectrum. On the other hand, type-C QPOs are nicely explained in a quantitative sense by Comptonization in a precessing corona (Ingram & van der Klis, 2015; Ingram et al., 2016, 2017; You et al., 2018), without any involvement of the jet, which is definitely present.
Three questions naturally arise regarding 1) whether the jet is precessing when type-C QPOs are observed; 2) whether Comptonization is taking place in the jet when we see type-C QPOs; 3) why we do not see the precessing corona in type-B QPOs.
The answer to the first question is probably yes, but unlike the type-B QPOs, for which the jet is narrow (see below), in type-C QPOs the jet is wide because the truncation radius is relatively large in the hard and hard-intermediate states. Thus, even if the bottom part of the jet is precessing, there is hardly any variation in its observed emission.
With regard to the second question, in type-C QPOs, the variability at the QPO frequency comes directly from the precessing corona. Any QPO signal that enters the jet gets washed out because the light-travel time in the jet is much larger than the period of the QPO. Thus, Comptonization in the jet can happen, and it almost certainly does, but the QPO signal comes directly from the corona. It may be that the ratio of the X-rays that are emitted by the corona and are not scattered by the jet over the X-rays emitted after Comptonization in the jet is constant, but the unscattered X-ray photons (in absolute number) from the corona, when it is large in size, is large enough for the QPO signal to be detected.
In type-B QPOs on the other hand, the jet is narrow because the corona that feeds it is very small. This is because the truncation radius is close to the inner stable circular orbit in the soft intermediate state. Thus, the answer to the third question is that the QPO signal from the precessing corona is undetectably small and the variability in type-B QPOs comes entirely from the precessing jet. We note here that the jet does not need to precess as a solid body. We have found from our Monte Carlo code that the upscattered photons reach, in their random walk in the jet, a maximum height equal to a few times its radius, . Thus, only the bottom part of the jet needs to precess as a solid body.
In summary, the hard X-rays come from Comptonization in the corona and the jet. In type-C QPOs, we are observing the precession of the corona, whereas in type-B QPOs, we are observing the precession of the jet.
5 Conclusion
In conclusion, we are able to quantitatively explain the periodic variation of the photon index observed by Stevens & Uttley (2016) in GX 339-4, as coming from a precessing jet. The values of the parameters that we use are reasonable for BHXRBs in the soft-intermediate state.
Acknowledgements.
We thank the anonymous referee for asking critical questions, which helped us in the qualitative discussion of our results. We also thank Phil Uttley for a useful exchange of e-mails regarding type-C QPOs.References
- Arévalo & Uttley (2006) Arévalo, P. & Uttley, P. 2006, MNRAS, 367, 801
- Asada & Nakamura (2012) Asada, K. & Nakamura, M. 2012, ApJ, 745, L28
- Belloni et al. (2005) Belloni, T., Homan, J., Casella, P., et al. 2005, A&A, 440, 207
- Belloni (2010) Belloni, T. M. 2010, in Lecture Notes in Physics, Berlin Springer Verlag, Vol. 794, Lecture Notes in Physics, Berlin Springer Verlag, ed. T. Belloni, 53
- Casella et al. (2004) Casella, P., Belloni, T., Homan, J., & Stella, L. 2004, A&A, 426, 587
- Casella et al. (2005) Casella, P., Belloni, T., & Stella, L. 2005, ApJ, 629, 403
- Corbel et al. (2013) Corbel, S., Aussel, H., Broderick, J. W., et al. 2013, MNRAS, 431, L107
- Done et al. (2007) Done, C., Gierliński, M., & Kubota, A. 2007, A&A Rev., 15, 1
- Esin et al. (1997) Esin, A. A., McClintock, J. E., & Narayan, R. 1997, ApJ, 489, 865
- Fender et al. (2009) Fender, R. P., Homan, J., & Belloni, T. M. 2009, MNRAS, 396, 1370
- Fürst et al. (2015) Fürst, F., Nowak, M. A., Tomsick, J. A., et al. 2015, ApJ, 808, 122
- Giannios (2005) Giannios, D. 2005, A&A, 437, 1007
- Giannios et al. (2004) Giannios, D., Kylafis, N. D., & Psaltis, D. 2004, A&A, 425, 163
- Gierliński & Newton (2006) Gierliński, M. & Newton, J. 2006, MNRAS, 370, 837
- Homan & Belloni (2005) Homan, J. & Belloni, T. 2005, Ap&SS, 300, 107
- Homan et al. (2001) Homan, J., Wijnands, R., van der Klis, M., et al. 2001, ApJS, 132, 377
- Ingram & van der Klis (2015) Ingram, A. & van der Klis, M. 2015, MNRAS, 446, 3516
- Ingram et al. (2017) Ingram, A., van der Klis, M., Middleton, M., Altamirano, D., & Uttley, P. 2017, MNRAS, 464, 2979
- Ingram et al. (2016) Ingram, A., van der Klis, M., Middleton, M., et al. 2016, MNRAS, 461, 1967
- Kotov et al. (2001) Kotov, O., Churazov, E., & Gilfanov, M. 2001, MNRAS, 327, 799
- Kovalev et al. (2020) Kovalev, Y. Y., Pushkarev, A. B., Nokhrina, E. E., et al. 2020, MNRAS, 495, 3576
- Kylafis & Belloni (2015) Kylafis, N. D. & Belloni, T. M. 2015, A&A, 574, A133
- Kylafis et al. (2008) Kylafis, N. D., Papadakis, I. E., Reig, P., Giannios, D., & Pooley, G. G. 2008, A&A, 489, 481
- Kylafis & Reig (2018) Kylafis, N. D. & Reig, P. 2018, A&A, 614, L5
- Liska et al. (2018) Liska, M., Hesp, C., Tchekhovskoy, A., et al. 2018, MNRAS, 474, L81
- Lyubarskii (1997) Lyubarskii, Y. E. 1997, MNRAS, 292, 679
- Miyamoto et al. (1995) Miyamoto, S., Kitamoto, S., Hayashida, K., & Egoshi, W. 1995, ApJ, 442, L13
- Motta et al. (2009) Motta, S., Belloni, T., & Homan, J. 2009, MNRAS, 400, 1603
- Motta et al. (2012) Motta, S., Homan, J., Muñoz Darias, T., et al. 2012, MNRAS, 427, 595
- Motta et al. (2011) Motta, S., Muñoz-Darias, T., Casella, P., Belloni, T., & Homan, J. 2011, MNRAS, 418, 2292
- Motta et al. (2015) Motta, S. E., Casella, P., Henze, M., et al. 2015, MNRAS, 447, 2059
- Muñoz-Darias et al. (2011) Muñoz-Darias, T., Motta, S., Stiele, H., & Belloni, T. M. 2011, MNRAS, 415, 292
- Narayan & Yi (1994) Narayan, R. & Yi, I. 1994, ApJ, 428, L13
- Narayan & Yi (1995) Narayan, R. & Yi, I. 1995, ApJ, 444, 231
- Rapisarda et al. (2017) Rapisarda, S., Ingram, A., & van der Klis, M. 2017, MNRAS, 472, 3821
- Reig & Kylafis (2015) Reig, P. & Kylafis, N. D. 2015, A&A, 584, A109
- Reig & Kylafis (2019) Reig, P. & Kylafis, N. D. 2019, A&A, 625, A90
- Reig et al. (2003) Reig, P., Kylafis, N. D., & Giannios, D. 2003, A&A, 403, L15
- Reig et al. (2018) Reig, P., Kylafis, N. D., Papadakis, I. E., & Costado, M. T. 2018, MNRAS, 473, 4644
- Remillard & McClintock (2006) Remillard, R. A. & McClintock, J. E. 2006, ARA&A, 44, 49
- Russell et al. (2020) Russell, D. M., Casella, P., Kalemci, E., et al. 2020, MNRAS, 495, 182
- Shakura & Sunyaev (1973) Shakura, N. I. & Sunyaev, R. A. 1973, A&A, 24, 337
- Shidatsu et al. (2011) Shidatsu, M., Ueda, Y., Nakahira, S., et al. 2011, PASJ, 63, S803
- Stevens & Uttley (2016) Stevens, A. L. & Uttley, P. 2016, MNRAS, 460, 2796
- Stiele et al. (2011) Stiele, H., Motta, S., Muñoz-Darias, T., & Belloni, T. M. 2011, MNRAS, 418, 1746
- Wijnands et al. (1999) Wijnands, R., Homan, J., & van der Klis, M. 1999, ApJ, 526, L33
- You et al. (2018) You, B., Bursa, M., & Życki, P. T. 2018, ApJ, 858, 82