Orbital-selective spin waves in detwinned NaFeAs
Abstract
The existence of orbital-dependent electronic correlations has been recognized as an essential ingredient to describe the physics of iron-based superconductors. NaFeAs, a parent compound of iron based superconductors, exhibits a tetragonal-to-orthorhombic lattice distortion below K, forming an electronic nematic phase with two 90∘ rotated (twinned) domains, and orders antiferromagnetically below K. We use inelastic neutron scattering to study spin waves in uniaxial pressure-detwinned NaFeAs. By comparing the data with combined density functional theory and dynamical mean-field theory calculations, we conclude that spin waves up to an energy scale of meV are dominated by - intra-orbital scattering processes, which have the two-fold () rotational symmetry of the underlying lattice. On the other hand, the spin wave excitations above , which have approximately fourfold () rotational symmetry, arise from the - intra-orbital scattering that controls the overall magnetic bandwidth in this material. In addition, we find that the low-energy ( meV) spin excitations change from approximate to rotational symmetry below a temperature (), while spin excitations at energies above have approximate rotational symmetry and are weakly temperature dependent. These results are consistent with angle resolved photoemission spectroscopy measurements, where the presence of an uniaxial strain necessary to detwin NaFeAs also raises the onset temperature of observable orbital-dependent band splitting to above , thus supporting the notion of orbital selective spin waves in the nematic phase of iron-based superconductors.
I introduction
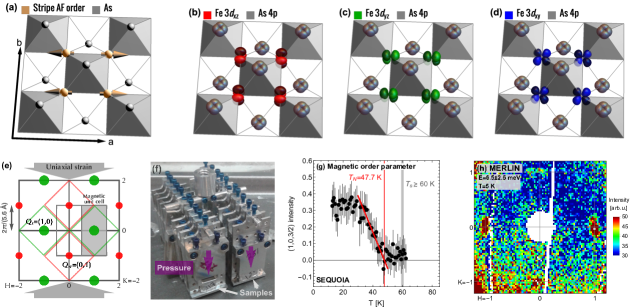
High temperature superconductivity in the copper oxides and iron pnictides arises from electron- and hole-doping of their respective antiferromagnetic (AF) ordered parent compounds scalapinormp ; dairmp . In the case of copper oxide superconductors, the parent compounds are Mott insulators with strong electron correlations palee , and superconductivity arises from electron pairing in the CuO2 plane from the one-electron Cu orbitals scalapino . For iron pnictide superconductors, the parent compounds such as BaFe2As2 and NaFeAs are semi-metallic stewart , and antiferromagnetism can be generated either by Fermi surface nesting of itinerant electrons hirschfeld , or local moments mediated by superexchange interactions through the As anions [Fig. 1(a)] QSi . Instead of the single band in copper oxides, the electronic structure of iron pnictides near the Fermi level contains several active bands with appreciable mixing of the Fe 3 orbitals (, , and ) [Figs. 1(b-d)] YZSL17 . Therefore, a fundamental difference between copper oxides and iron pnictides is the multi-orbital multi-band nature of the underlying electronic structure in iron-based superconductors.
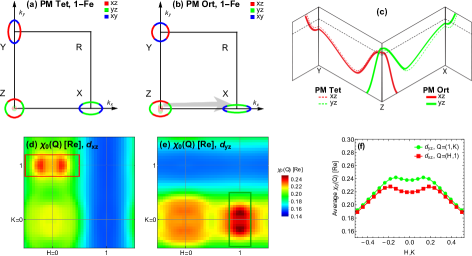
In addition to having collinear AF order below as shown in Fig. 1(a), iron pnictides exhibit a tetragonal ( symmetric) to orthorhombic ( symmetric) lattice distortion at temperature below () stewart , forming an electronic nematic phase with two 90∘ rotated (twinned) domains [Figs. 1(e-h)] Yin11 ; Fernandes . In the paramagnetic tetragonal () and nematic orthorhombic () phases, the Fermi surfaces of NaFeAs observed by angle resolved photo-emission spectroscopy (ARPES) experiments are schematically shown in Figs. 2(a) and 2(b), respectively YZSL17 . The appearance of a nematic phase is associated with an energy splitting between and orbitals, where the band of the electron Fermi surface at goes up in energy, while the band at goes down in energy [Fig. 2(c)] YZSL17 . The splitting leads to more favorable Fermi surface nesting conditions for the orbital along the AF ordering direction [Figs. 1(e) and 2(b)], and lowers the rotational symmetry of electronic interactions that give rise to anisotropic spin fluctuations WKRE16 ; conversely, spin fluctuations with lower rotational symmetry may themselves generate rotational anisotropy in the orbital channel FMTC16 . The situation is not necessarily the same for strongly-coupled, localized electrons, through which spin fluctuations are generated by superexchange interactions taking place between Fe ions across the anion (pnictogen/chalcogen) site, reminiscent of strongly-coupled electrons in the cuprate materials QSi . In the iron-based superconductors, the orbital is most closely positioned to the anions, and it is also the most strongly localized YZSL17 . For example, in FeTe1-xSex superconductors with a nematic phase but without static AF order Hsu ; McQueen09 ; bohmer , signatures of the orbital completely vanish from ARPES measurements at high temperature, indicating that the orbital is becoming more localized, possibly entering into an orbital-selective Mott phase QSi ; YLZY15 or a highly incoherent state through the formation of large on-site fluctuating moments due to the Hund’s rule coupling HMiao2016 ; Yin2012 . From scanning tunneling experiments on FeSe, superconductivity is believed to occur via orbital-selective Cooper pairing from the orbital submanifold Sprau .
In the case of NaFeAs, ARPES studies have found that the -dominated band is more strongly renormalized than the same band in other pnictides, but less so than chalcogenides. Thus, one has a system with moderate overall correlation strength Yin11 ; YZSL17 that may exhibit spin fluctuations from two distinct mechanisms with different intra-orbital scattering processes of different correlation strength. Differentiation of these mechanisms has important consequences for the origins of superconductivity ChKF16 . Inelastic neutron scattering experiments on detwinned FeSe TChen2019 , underdoped superconducting NaFe0.985Co0.015As WYwang2017 , and Ba(Fe1-xCox)2As2 Tian19 suggest that the neutron spin resonance, a collective magnetic excitation coupled to the superconducting order parameter Eschrig ; Maier ; RZhang ; Inosov2010 ; CHLee2013 ; Fwaber2019 , likely arises from orbital-selective electron-hole Fermi surface nesting of quasiparticles within the single orbital submanifold.
In previous inelastic neutron scattering work on twinned NaFeAs Zhang14 and Fe2As2 ( Ca, Ba, Sr) JZhao09 ; leland11 ; Ewings11 , it was found that spin waves in NaFeAs have a zone boundary energy lower than that of Fe2As2. These results have been interpreted as due to increased electron-electron correlations from larger pnictogen height Yin11 , consistent with a combined density functional theory (DFT) and dynamical mean field theory (DMFT) calculation Zhang14 ; Yin14 . As these results are obtained on twinned samples that obey the rotational symmetry, one cannot deduce the relationship between spin excitations and orbital degrees of freedom from symmetry considerations alone in the twinned case. Although recent spin wave measurements on detwinned BaFe2As2 reveal strong magnetic anisotropy between the AF wave vector and in the collinear AF state below the ordering temperature Lu18 , the nearly coupled structural and AF phase transitions in BaFe2As2 qhuang ; kim2011 prevent a determination of the relationship between the and magnetic anisotropy and nematic (structural) phase transition below . On the other hand, NaFeAs exhibits a tetragonal-to-orthorhombic structural transition at K and a separate collinear AF order below K at [Fig. 1(g)] SLi09 ; Tan16 . Thus, detwinned NaFeAs not only presents a platform for testing the relationship between itinerant and localized physics in different orbital degrees of freedom, but also tests how spin waves are associated with the nematic phase across .
II Experimental Details
Our inelastic neutron scattering experiments are carried out at the SEQUOIA SQUOIA and MERLIN MERLIN neutron time-of-flight chopper spectrometers, located, respectively, at the Spallation Neutron Source, Oak Ridge National Laboratory, and ISIS facility, Rutherford-Appleton Laboratory. We define the wave vector Q in three-dimensional reciprocal space in Å-1 as , where , , and are Miller indices and are reciprocal lattice units (r.l.u.) of the orthorhombic unit cell, where Å, Å, and Å SLi09 ; Tan16 ; SI . Figures 1(a) and 1(e) show schematic diagram of the collinear AF order in NaFeAs in real and reciprocal space, respectively. In the unstrained state, NaFeAs forms twin structural domains below [Fig. 1(e)]. To overcome this, uniaxial mechanical pressure has been used to favor one twin orientation Dhital2012 ; Dhital2014 ; YSong2013 ; Tam2017 ; Lu14 . Twenty single crystals of NaFeAs were aligned and cut into rectangular shapes along the direction, individually potted in hydrogen-free Cytop M glue and wrapped in aluminum foil to protect them from exposure to air [Fig. 1(f)]. Since the NaFeAs single crystals are detwinned via uniaxial pressure along the -axis [the vertical arrow direction using aluminum springs in an aluminum manifold as shown in Fig. 1(f)], the AF order occurs at the in-plane wave vector positions, and there should be no magnetic scattering at positions. For a 100% detwinned sample, the magnetic Bragg peak intensity at the AF in-plane wave vector should be a factor of 2 of that at zero pressure, while there should be no observable magnetic Bragg scattering at the position [Fig. 1(e)]. In typical neutron triple-axis experiments on one single crystal sample of iron pnictides, the detwinning ratio of the system can be accurately determined by either comparing the uniaxial pressured induced magnetic Bragg peak intensity gain at or comparing the magnetic Bragg peak intensities at and positions, where for BaFe2As2 and for NaFeAs Dhital2012 ; Dhital2014 ; YSong2013 ; Tam2017 . Unfortunately, the rectangular assembly of 20 single crystals of NaFeAs under uniaxial pressure shown in Fig. 1(f) could not be arranged in the sample environment of a triple-axis experiment. For our measurements using neutron time-of-flight spectrometers with only one sample rotation axis (, along the axis), elastic scans at different temperatures were collected by rotating the angle of the sample assembly to satisfy the elastic condition () at the magnetic Bragg reflection and revealed K [Fig. 1(g)] SLi09 . Since it is not possible to rotate the “weak” magnetic Bragg peak at positions onto the detector bank at fixed , one cannot use the above mentioned method to directly measure the sample assembly detwinning ratio, defined as , where and correspond to the strong and weak magnetic Bragg peaks, respectively WYwang2017 . Nevertheless, one can still determine the sample detwinning ratio using the low-energy inelastic part of the spin fluctuation spectrum, which at least provides a firm lower bound, and was in fact observed to have one-to-one correspondence to in previous experiments on the NaFeAs and BaFe2As2 systems WYwang2017 ; Tian19 .
We estimate the detwinning ratio by integrating the inelastic fluctuation spectrum for energies just above the spin anisotropy gap where spin waves appear at both the strong and weak positions. For spin wave energies below 20 meV, the anisotropy is not highly energy-dependent, giving us confidence in this method. From the inelastic slice containing meV with meV [Fig. 1(h)], we find that the integrated intensities at the strong ( at ) and weak ( at ) positions can give , or a 3:1 domain ratio, only slightly smaller than obtained on one single crystal of NaFe0.985Co0.015As WYwang2017 .
Our measurements were carried out with incident neutron energies 40, 80, 150, and 250 meV at SEQUOIA, and 29, 54, and 170 meV at MERLIN, with the incident beam always along the axis. In this experimental geometry, points with a given , , and energy transfer are always coupled to specific values of . A typical constant energy slice contains data from a wide range of values spanning at least half of a unit cell along the axis direction. We simply average over the values contained in a given slice, converting the analysis into a two-dimensional (2D) problem. For simplicity, we refer to the values without specifying when the energy and are also specified.
III Experimental Results
Figures 2(a) and 2(b) schematically illustrate the electron-hole Fermi surfaces of NaFeAs and their nesting conditions above and below for different orbitals WKRE16 ; ZYLL16 ; ZHYJ12 ; YLMK12 . In the paramagnetic tetragonal state, the electron-hole Fermi surface nesting of the - and - orbital quasiparticles is near the and positions, respectively. When the system is cooled below in the paramagnetic orthorhombic nematic phase, the electron band shifts up in energy while the electron band shifts down [Fig. 2(c)] ZHYJ12 ; YLMK12 . As a result, the inner hole-like pocket at the zone center that is partially closed along acquires an elliptical shape which improves the nesting condition close to the Fermi level due to the larger spectral weight near , therefore enabling scattering processes involving the orbitals to participate in fluctuations with lower overall energy at approximately . Similarly, scattering processes with wavevector close to direction are more favorable for - orbital hole-electron Fermi surface scattering JHZhang2010 .
To determine quantitatively if the above Fermi-surface nesting description is appropriate for understanding the collinear AF order in NaFeAs, we calculated the wavevector () dependence of the real part of the bare susceptibility, [Re] Johannes06 , at zero energy () contributed by the Fe and orbitals (intra-orbital components). While the Fe orbital component has a peak structure around [Fig. 2(d)], the Fe orbital component peaks around [Fig. 2(e)]. Since the comparison plot in Fig. 2(f) shows a somewhat larger ( %) bare susceptibility around than that around , the Fermi surface nesting favors in this compound. However, the Fermi surface nesting itself cannot produce the large anisotropy of the experimental spin excitations between and [Fig. 1(h)]. The two-particle vertex correction strongly enhances this difference and gives rise to the large anisotropy of the spin susceptibility between and , defined as where is the two-particle vertex function Yin14 . For example, if at and at , the spin susceptibility at is about 10 times the value at . Therefore, both the Fermi surface nesting and the two-particle vertex correction play important roles in forming the AF order at .
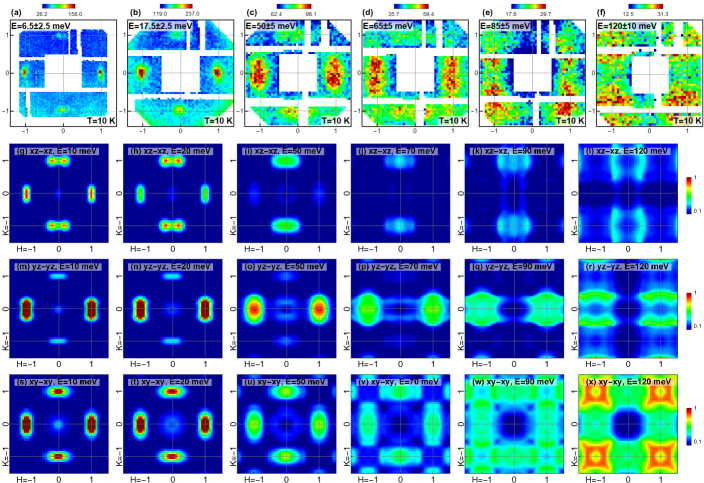
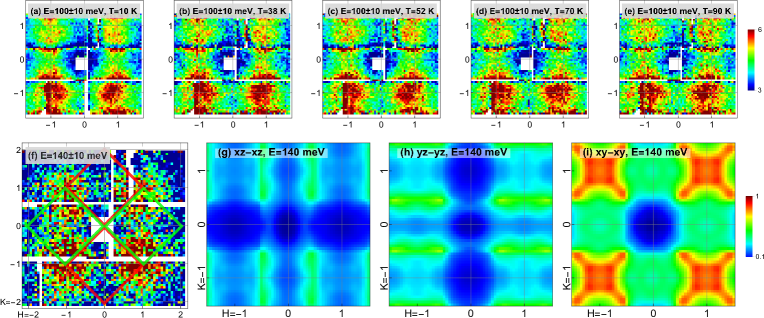
Figures 3(a-f) show 2D images of spin waves at constant energy transfers of , 17.5, 50, 65, 85, and 120 meV in the AF ordered state at 10 K. At meV, there is clear spin wave anisotropy at and positions. With increasing energy transfer, spin wave anisotropy between and becomes smaller and spin waves become almost rotational symmetric around meV. In addition, spin waves broaden and split in the transverse direction with increasing energy, and merge into the position where they remain somewhat anisotropic at meV. Figures 3(g-l), 3(m-r), and 3(s-x) show the corresponding cuts in the -, -, and - intra-orbital scattering channels, respectively, from the combined DFT+DMFT calculations. For spin waves from the - orbital quasiparticle excitations [Figs. 3(g-l)], the spectral weight of the spin waves are mostly focused at , inconsistent with the observed low-energy spin waves [Figs. 3(a-d)]. On the other hand, spin waves from the - orbital quasiparticle excitations are opposite and have large spectral weight at positions [Fig. 3(m-r)]. Finally, spin waves from the - orbital scattering have spectral weight at both and with approximate rotational symmetry [Fig. 3(s-x)].
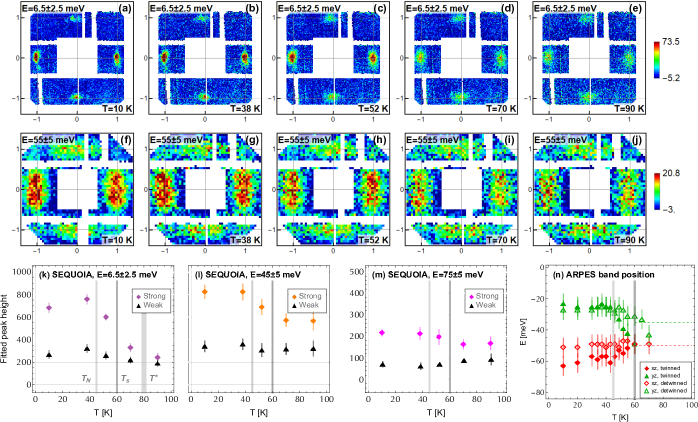
In previous inelastic neutron scattering work on twinned NaFeAs, low energy spin excitations are enhanced dramatically below instead of due to spin-lattice coupling LYSW18 . To determine if spin excitation anisotropy at and in NaFeAs is also controlled by the nematic phase below , we summarize in Fig. 4 temperature dependence of the spin excitations at different energies across and . Figures 4(a-e) and 4(f-j) plot temperature evolution of spin waves at meV and meV, respectively. Figures 4(k), 4(l), and 4(m) show temperature dependence of the spin excitation peak intensity at and for energies , , meV, respectively. Since the widths of spin excitations at these energies are identical for and and only weakly temperature dependent as shown in the supplementary information SI , temperature dependence of the peak intensity should give an accurate account of the spin excitation anisotropy.
For spin excitations at meV, we find enhanced magnetic scattering at a temperature above marked as a wide dark line, different from that of previous work on unstrained twinned NaFeAs LYSW18 . In addition, a strong magnetic excitation anisotropy between and is also established at temperatures across , and persists to temperatures above [Fig. 4(k)]. Upon increasing excitation energies to [Fig. 4(l)] and [Fig. 4(m)] meV, spin excitation anisotropy is also present to temperatures above . These results are consistent with ARPES and transport measurements on both NaFeAs and Ba(Fe1-xCox)2As2, where anisotropy reflecting the nematic order is observed to on-set at a temperature above the zero pressure due to the applied uniaxial pressure necessary to detwin and maintain the single domain orthorhombic AF phase of iron pnictides ZHYJ12 ; YLMK12 ; Chu10 ; ZYLL16 ; HRMan18 ; DWTam2019 . To see this, Figure 4(n) compares the temperature dependence of the band splittings in pressure-free and uniaxial pressure-strained NaFeAs single crystals YLMK12 . Without applied uniaxial pressure, the band splitting of an unstrained (twinned) NaFeAs crystal onsets at . For a detwinned crystal in the presence of uniaxial strain, the band splitting due to orbital anisotropy is resolvable up to at least 70 K, well above YLMK12 [Fig. 4(n)]. The comparison with and without strain shows that this elevation of band splitting to higher temperatures is a direct result of uniaxial strain, which acts like a biasing field to the nematic order just like a magnetic field does to a ferromagnetic order. It is likely that a small anisotropy persists as long as the biasing field—strain in this case—is present, but unresolvable due to finite energy resolution in the ARPES experiments. This is consistent with the observation that while low energy spin excitations in BaFe2As2 ( K) have a small anisotropy at all temperatures below 250 K, the enhancement of spin excitation anisotropy below ( K) is associated with resistivity anisotropy and band splitting DWTam2019 . Although the exact uniaxial pressures used in Ref. YLMK12 and Figs. 4(k-m) are unknown, it is clear that the associated with the enhanced spin excitation anisotropy occurs at approximately the band splitting temperature of a strained NaFeAs.
To test temperature dependence of the spin excitation anisotropy for energies above meV, we show in Fig. 5(a-e) 2D raw images of the meV spin excitations at K, respectively, obtained on SEQUOIA with meV. On warming across and , spin excitations have approximate rotational symmetry with weak anisotropy, but are essentially temperature independent. Figure 5(f) shows the 2D raw image of spin excitations at meV obtained on SEQUOIA with meV and K, again revealing approximate rotational symmetry with weak anisotropy. Comparing these results with the combined DFT+DMFT calculations at meV for - [Fig. 5(g)], - [Fig. 5(h)], and - [Fig. 5(i)] intra-orbital scattering channels, we see that spin excitations with energies above meV are peaked at the positions, which is most consistent with the - intra-orbital scattering [Fig. 5(i)].
To understand the small, weakly temperature dependent, spin excitation anisotropy observed at all energies in Figs. 4 and 5, we note that the applied uniaxial pressure necessary to detwin the sample also induces an orthorhombic lattice distortion and a strain field at all temperatures XYLu2016 . For an applied pressure of MPa, the pressure-induced lattice parameter distortion in BaFe2As2 at temperatures well above the zero pressure is weakly temperature dependent and about 15% of the intrinsic orthorhombic lattice distortion below [see Fig. 1(c) of Ref. XYLu2016 ]. Since the resistivity and spin excitation anisotropy at temperatures above the zero pressure increase with increasing uniaxial pressure Chu10 ; HRMan18 ; DWTam2019 , it is safe to assume that the uniaxial pressure-induced strain field in NaFeAs will produce a small rotatinal symmetry-breaking spin excitation component at all energies and temperatures.
IV DFT+DMFT calculations and comparison with data
DFT+DMFT Kotliar2006 was employed to compute the electronic structure and spin dynamics of NaFeAs and BaFe2As2 in the nematic state. The full-potential linear augmented plane wave method implemented in Wien2K Blaha2001 was used for the density functional theory part in conjunction with Perdew-Burke-Ernzerhof generalized gradient approximation Perdew1996 of the exchange correlation functional. DFT+DMFT was implemented on top of Wien2K and documented in Ref. Haule2010 . In the DFT+DMFT calculations, the electronic charge was computed self-consistently on DFT+DMFT density matrix. The quantum impurity problem was solved by the continuous time quantum Monte Carlo method Haule2007 ; Werner2006 with a Hubbard eV and Hund’s rule coupling eV in the paramagnetic state Yin11 ; Yin14 . Such a choice of the Hund’s rule coupling is essential for the large spin excitation strength and small spin-wave bandwidth. If the Hund’s rule coupling is small, there would be very small local spin moment, very weak spin excitations, and large spin-wave bandwidth. There are also hybridizations of the , , and orbitals between the neighboring Fe atoms, and therefore to the inter-orbital contributions of the total spin excitations. Since the strength of the inter-orbital contribution lies between the individual intra-orbital contributions, we can focus on the intra-orbital contribution to obtain a simplified but largely accurate picture.
The Bethe-Salpeter equation is used to compute the dynamic spin susceptibility where the bare susceptibility is computed using the converged DFT+DMFT Green’s function while the two-particle vertex is directly sampled using continuous time quantum Monte Carlo method after achieving full self-consistency of DFT+DMFT density matrix. We assume that the two-particle vertex is the same in the nematic state as in the paramagnetic state. The detailed method of computing the dynamic spin susceptibility is documented in Ref. Yin14 and was shown to be able to compute accurately the spin dynamics of many iron pnictide superconductors. To simulate the nematic state, 50 meV and 80 meV on-site energy splitting of the and orbitals were added to the DFT+DMFT converged solutions of the paramagnetic state for NaFeAs and BaFe2As2, respectively, consistent with ARPES measurements at the (1,0) and (0,1) electron pockets ZHYJ12 ; YLMK12 . The experimental crystal structures of NaFeAs Parker2009 and BaFe2As2 Rotter2008 were used in the calculations.
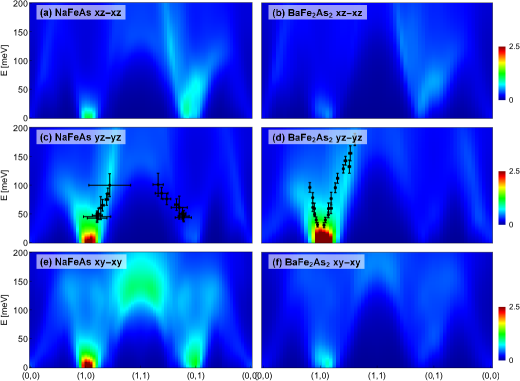
Figures 6(a), 6(c), and 6(e) show the calculated spin wave dispersions of NaFeAs from the , , and orbital channels, respectively. Figures 6(b), 6(d), and 6(f) show similar calculation for BaFe2As2. The data points overlayed in Figs. 6(c) and 6(d) are the spin wave dispersion relations of NaFeAs and BaFe2As2, respectively, determined from neutron scattering experiments Lu18 . By comparing Fig. 6 with Fig. 3 for NaFeAs and those of detwinned BaFe2As2 Lu18 , we conclude that spin waves below meV along the direction arise predominantly from the channel. For meV, the neutron data shows most spectral weight at the position [Fig. 3(f)], consistent with the calculations in the channel but not the channel. This is also the case for spin excitations at meV [Fig. 5(f)]. The spin excitations centered at remain partially anisotropic at least as high as 150 meV, probably arising from the applied pressure-induced lattice anisotropy. There are also experimental ZHYJ12 ; MYi2019 and theoretical CKAF16 evidence that the -dominated bands may participate in the broken rotational symmetry.
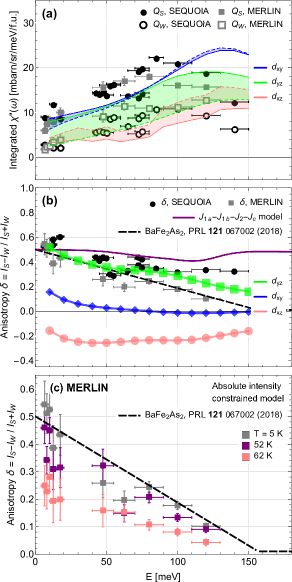
To quantitatively compare the observed spin wave anisotropy in NaFeAs with DFT+DMFT calculations, we show the local dynamic susceptibility in Figure 7(a) as a function of energy, integrated over the green [] and red [] diamond-shaped zones shown in Fig. 1(e). Each diamond has the area of one magnetic unit cell. The intensity in each region is converted into absolute units of magnetic susceptibility by fitting and subtracting the background and correcting for the magnetic form factor of Fe2+ and the Bose factor, as described in the supplementary information SI . The resulting integrated intensity from the strong and weak positions can be averaged to roughly match previously published data Zhang14 ; Carr16 . The green, red, and blue dashed lines represent the DFT+DMFT results from the , , and intra-orbital scattering. Experimental results from SEQUOIA and MERLIN are clearly marked.
Figure 6(b) shows the spin wave energy dependent anisotropy, defined as Song2015 , and its comparison with from the DFT+DMFT calculation for different orbitals. While the observed spin wave anisotropies are similar for energies below meV for SEQUOIA and MERLIN measurements, they are slightly different at higher energies, due in part to different applied uniaxial pressures in these two experiments. The spin wave anisotropy decreases with increasing energy, and changes from the to rotational symmetry around meV (Figs. 3-5). While the low-energy spin excitations change anisotropy at temperatures slightly above , spin excitations at energies above have approximate rotational symmetry that does not change across (Figs. 4, 5). These results clearly reveal orbital selective spin waves, suggesting that low-energy spin waves are mostly controlled by the orbital scattering associated with the nematic order below , while high-energy spin waves near the zone boundary are determined by the electronic bandwidth of the orbitals YZSL17 . The electronic nematic phase below is associated with the splitting of the and orbital bands and spin wave anisotropy between and ZHYJ12 ; YLMK12 , although such an effect is already present above due to applied uniaxial pressure (Fig. 4) YZSL17 ; HRMan18 . In the paramagnetic state at a temperature well above , spin wave anisotropy between and becomes weakly temperature dependent together with the vanishing splitting of the and orbital bands YZSL17 ; HRMan18 . Therefore, the energy splitting of the and orbital bands is directly associated with the electronic and spin nematic phase, and spin waves in NaFeAs are orbital selective and controlled by the electronic properties of the system.
The observation of low-energy - fluctuations is consistent with the idea that these excitations are itinerant and responsible for superconducting pairing TChen2019 ; WYwang2017 ; Tian19 , while the - fluctuations are more localized and do not observably change across the electron-doped superconducting dome Carr16 . Since the spin fluctuation spectrum in BaFe2As2 also exhibits qualitatively similar results as NaFeAs, and with DFT+DMFT calculations showing high-energy scattering centered at but extending to higher energy in BaFe2As2, we conclude that the overall magnetic bandwidth in iron pnictides is controlled by localized magnetic superexchange interactions. With increased pnictogen height above the iron plane and resulting increased electron correlations on moving from BaFe2As2 to NaFeAs, we see a clear reduction in energy for spin excitations at the position, suggesting that spin excitations around the position are mostly associated with the orbital WKRE16 ; ZYLL16 ; ZHYJ12 ; YLMK12 . These results are consistent with the notion that increased electron correlations in NaFeAs are accompanied by reduced electronic bandwidth in the orbital YZSL17 and spin wave energy bandwidth (and the magnetic exchange coupling ) Zhang14 .
Our conclusion that the microscopic origin of magnetic scattering is orbitally selective is not in contradiction with other models previously used for the iron pnictides. Although spin excitations in detwinned NaFeAs can be much better understood by orbital-selective scattering processes, one should also be able to parametrize these excitations with a Heisenberg Hamiltonian which has no information concerning the orbital nature of the excitations Zhang14 . Since superconductivity in iron pinctides arises from electron/hole-doped antiferromagnets, one can use the - model to estimate high temperature superconductivity states regardless of the microscopic origin of spin excitations Karchev98 . In the notion of spin fluctuation driven superconductivity scalapinormp , the superconducting condensation energy of the system should be dominated by the change in magnetic exchange energy between the normal (N) and superconducting (S) phase at zero temperature . Within the - model, this means that , where is the nearest neighbor magnetic exchange coupling and is the magnetic scattering in absolute units at temperature MWang2013 . In this picture, the quasiparticle excitations across the nested hole-electron Fermi surfaces in the nematic phase arise mostly from the - intra-orbital excitations, and give rise to the neutron spin resonance seen in different families of iron-based superconductors TChen2019 ; WYwang2017 ; Tian19 . The increased electron-electron correlations from BaFe2As2 to NaFeAs, reflected in reduced bandwidth of the orbital and high-energy spin excitations Zhang14 , correspond to the reduced magnetic exchange coupling . Therefore, localized electrons in the orbital and associated high energy spin excitations with symmetry are also important for superconductivity of iron-based materials.
V Conclusions
In summary, we have used inelastic neutron scattering to study spin waves of detwinned crystals of NaFeAs. By comparing the energy and temperature dependence of the spin wave anisotropy with DFT+DMFT calculations, we conclude that spin waves in iron pnictides are orbital selective. While the -orbital scattering processes control the bandwidth of spin fluctuations in the iron pnictides, the low energy spin fluctuations may arise through Fermi surface nesting of itinerant electrons with orbital character below , and coupled to the nematic phase transition. Superconductivity in nematic ordered iron pnictides may therefore be controlled by Fermi surface nesting of itinerant electrons with orbital character while high energy spin excitations associated with the orbital and electron correlations are also important.
VI Acknowledgments
The neutron scattering work at Rice is supported by the U.S. Department of Energy (DOE), Basic Energy Sciences (BES), under Contract No. DE-SC0012311 (P.D.) The materials synthesis efforts at Rice is supported by the Robert A. Welch Foundation Grant Nos. C-1839 (P.D.). The research at ORNL was sponsored by the Scientific User Facilities Division, Office of BES, U.S. DOE. ZPY was supported by the NSFC (Grant No. 11674030), the Fundamental Research Funds for the Central Universities (Grant No. 310421113), the National Key Research and Development Program of China grant 2016YFA0302300. The calculations used high performance computing clusters at BNU in Zhuhai and the National Supercomputer Center in Guangzhou. MY is supported by the the Robert A. Welch Foundation Grant No. C-2024 as well as the Alfred P. Sloan Foundation.
References
- (1) D. J. Scalapino, Rev. Mod. Phys. 84, 1383 (2012).
- (2) P. C. Dai, Rev. Mod. Phys. 87, 855 (2015).
- (3) P. A. Lee, N. Nagaosa, and X. G. Wen, Rev. Mod. Phys. 78, 17 (2006).
- (4) D. J. Scalapino, Physics Reports 250, 329 (1995).
- (5) G. R. Stewart, Rev. Mod. Phys. 83, 1589-1652 (2011).
- (6) P. J. Hirschfeld, M. M. Korshunov, and I. I. Mazin, Rep. Prog. Phys. 74, 124508 (2011).
- (7) Q. Si, R. Yu, and E. Abrahams, Nat. Rev. Mater. 1, 16017 (2016).
- (8) M. Yi, Y. Zhang, Z.-X. Shen, and D. Lu. Npj Quantum Materials 2, 57 (2017).
- (9) Z. P. Yin, K, Haule, and G. Kotliar, Nat. Mater. 10, 932 (2011).
- (10) R. M. Fernandes, A. V. Chubukov, and J. Schmalian, Nat. Phys. 10, 97 (2014).
- (11) M. D. Watson, T. K. Kim, L. C. Rhodes, M. Eschrig, M. Hoesch, A. A. Haghighirad, and A. I. Coldea. Phys. Rev. B 94, 201107 (2016).
- (12) L. Fanfarillo, J. Mansart, P. Toulemonde, H. Cercellier, P. Le Fvre, F. Bertran, B. Valenzuela, L. Benfatto, and V. Brouet. Phys. Rev. B 94, 155138 (2016).
- (13) Fong-Chi Hsu, Jiu-Yong Luo, Kuo-Wei Yeh, Ta-Kun Chen, Tzu-Wen Huang, Phillip M. Wu, Yong-Chi Lee, Yi-Lin Huang, Yan-Yi Chu, Der-Chung Yan, and Maw-Kuen Wu, Proc. Natl Acad. Sci. USA 105, 14262 (2008).
- (14) T. M. McQueen, A. J. Williams, P. W. Stephens, J. Tao, Y. Zhu, V. Ksenofontov, F. Casper, C. Felser, and R. J. Cava, Phys. Rev. Lett. 103, 057002 (2009).
- (15) A. E. Böhmer, and A. Kreisel, J. Phys.: Condens. Matter 30, 023001 (2018).
- (16) M. Yi, Z.-K. Liu, Y. Zhang, R. Yu, J.-X. Zhu, J. J. Lee, R. G. Moore, F. T. Schmitt, W. Li, S. C. Riggs, J.-H. Chu, B. Lv, J. Hu, M. Hashimoto, S.-K. Mo, Z. Hussain, Z. Q. Mao, C. W. Chu, I. R. Fisher, Q. Si, Z.-X. Shen, and D. H. Lu, Nature Communications 6, 7777 (2015).
- (17) H. Miao, Z. P. Yin, S. F. Wu, J. M. Li, J. Ma, B.-Q. Lv, X. P. Wang, T. Qian, P. Richard, L.-Y. Xing, X.-C. Wang, C. Q. Jin, K. Haule, G. Kotliar, and H. Ding, Phys. Rev. B 94, 201109(R) (2016).
- (18) Z. P. Yin, K. Haule, and G. Kotliar, Phys. Rev. B 86, 195141 (2012).
- (19) P. O. Sprau, A. Kostin, A. Kreisel, A. E. Böhmer, V. Taufour, P. C. Canfield, S. Mukherjee, P. J. Hirschfeld, B. M. Andersen, and J. C. Samus Davis, Science 357, 75 (2017).
- (20) A. V. Chubukov, M. Khodas, and R. M. Fernandes. Phys. Rev. X 6, 041045 (2016).
- (21) Tong Chen, Youzhe Chen, Andreas Kreisel, Xingye Lu, Astrid Schneidewind, Yiming Qiu, J. T. Park, Toby G. Perring, J Ross Stewart, Huibo Cao, Rui Zhang, Yu Li, Yan Rong, Yuan Wei, Brian M. Andersen, P. J. Hirschfeld, Collin Broholm, and Pengcheng Dai, Nat. Mater. 18, 709 (2019).
- (22) Weiyi Wang, J. T. Park, Rong Yu, Yu Li, Yu Song, Zongyuan Zhang, Alexandre Ivanov, Jiri Kulda, and Pengcheng Dai, Phys. Rev. B 95, 094519 (2017).
- (23) Long Tian, Panpan Liu, Zhuang Xu, Yu Li, Zhilun Lu, H. C. Walker, U. Stuhr, Guotai Tan, Xingye Lu, and Pengcheng Dai, Phys. Rev. B 100, 134509 (2019).
- (24) M. Eschrig, Adv. Phys. 55, 47-183 (2006).
- (25) T. A. Maier and D. J. Scalapino, Phys. Rev. B 78, 020514(R) (2008).
- (26) Rui Zhang, Weiyi Wang, Thomas A. Maier, Meng Wang, Matthew B. Stone, Songxue Chi, Barry Winn, and Pengcheng Dai, Phys. Rev. B 98, 060502(R) (2018).
- (27) D. S. Inosov, J. T. Park, P. Bourges, D. L. Sun, Y. Sidis, A. Schneidewind, K. Hradil, D. Haug, C. T. Lin, B. Keimer, and V. Hinkov, Nat. Phys. 6, 178 (2010).
- (28) C. H. Lee, P. Steffens, N. Qureshi, M. Nakajima, K. Kihou, A. Iyo, H. Eisaki, and M. Braden, Phys. Rev. Lett. 111, 167002 (2013).
- (29) F. Waer, J. T. Park, S. Aswartham, S. Wurmehl, Y. Sidis, P. Steffens, K. Schmalzl, B. Bchner, and M. Braden, npj Quantum Materials 4, 59 (2019).
- (30) C. Zhang, L. W. Harriger, Z. Yin, W. Lv, M. Wang, G. Tan, Y. Song, D. L. Abernathy, W. Tian, T. Egami, K. Haule, G. Kotliar, and P. Dai, Phys. Rev. Lett. 112, 217202 (2014).
- (31) J. Zhao, D. T. Adroja, D.-X. Yao, R. Bewley, S. Li, X. F. Wang, G. Wu, X. H. Chen, J. Hu, and P. C. Dai, Nat. Phys. 5, 555 (2009).
- (32) L. W. Harriger, H. Q. Luo, M. S. Liu, C. Frost, J. P. Hu, M. R. Norman, and Pengcheng Dai, Phys. Rev. B 84, 054544 (2011).
- (33) R. A. Ewings, T. G. Perring, J. Gillett, S. D. Das, S. E. Sebastian, A. E. Taylor, T. Guidi, and A. T. Boothroyd, Phys. Rev. B 83, 214519 (2011).
- (34) Z. P. Yin, K. Haule, G. Kotliar, Nat. Phys. 10, 845 (2014).
- (35) X. Lu, D. D. Scherer, D. W. Tam, W. Zhang, R. Zhang, H. Luo, L. W. Harriger, H. C. Walker, D. T. Adroja, B. M. Andersen, and P. Dai, Phys. Rev. Lett. 121, 067002 (2018).
- (36) Q. Huang, Y. Qiu, Wei Bao, M. A. Green, J. W. Lynn, Y. C. Gasparovic, T. Wu, G. Wu, X. H. Chen, Phys. Rev. Lett. 101, 257003 (2008).
- (37) M. G. Kim, R. M. Fernandes, A. Kreyssig, J. W. Kim, A. Thaler, S. L. Bud’ko, P. C. Canfield, R. J. McQueeney, J. Schmalian, A. I. Goldman, Phys. Rev. B 83, 134522 (2011).
- (38) Shiliang Li, Clarina de la Cruz, Q. Huang, G. F. Chen, T.-L. Xia, J. L. Luo, N. L. Wang, and Pengcheng Dai, Phys. Rev. B 80, 020504(R) (2009).
- (39) Guotai Tan, Yu Song, Chenglin Zhang, Lifang Lin, Zhuang Xu, Tingting Hou, Wei Tian, Huibo Cao, Shiliang Li, Shiping Feng, and Pengcheng Dai, Phys. Rev. B 94, 014509 (2016).
- (40) G. E. Granroth, A. I. Kolesnikov, T. E. Sherline, J. P. Clancy, K. A. Ross, J. P. C. Ruff, B. D. Gaulin, S. E. Nagler, Journal of Physics: Conference Series 251, 12058 (2010).
- (41) R. I. Bewley, T. Guidi, and S. Bennington, Notiziario Neutroni e Luce di Sincrotrone 14, 22 (2009).
- (42) See supplementary information for additional data and analysis, which include Refs. Tam2019b ; QWang2016 .
- (43) C. Dhital, Z. Yamani, W. Tian, J. Zeretsky, A. S. Sefat, Z. Wang, R. J. Birgeneau, and S. D. Wilson, Phys. Rev. Lett. 108, 087001 (2012).
- (44) C. Dhital, T. Hogan, Z. Yamani, R. J. Birgeneau, W. Tian, M. Matsuda, A. S. Sefat, Z. Wang, and S. D. Wilson, Phys. Rev. B 89, 214404 (2014).
- (45) Y. Song, S. V. Carr, X. Y. Lu, C. L. Zhang, Z. C. Sims, N. F. Luttrell, S. X. Chi, Y. Zhao, J. W. Lynn, and P. C. Dai, Phys. Rev. B 87, 184511 (2013).
- (46) David W. Tam, Yu Song, Haoran Man, Sky C. Cheung, Zhiping Yin, Xingye Lu, Weiyi Wang, Benjamin A. Frandsen, Lian Liu, Zizhou Gong, Takashi U. Ito, Yipeng Cai, Murray N. Wilson, Shengli Guo, Keisuke Koshiishi, Wei Tian, Bassam Hitti, Alexandre Ivanov, Yang Zhao, Jeffrey W. Lynn, Graeme M. Luke, Tom Berlijn, Thomas A. Maier, Yasutomo J. Uemura, and Pengcheng Dai, Phys. Rev. B 95, 060505(R) (2017).
- (47) X. Lu, J. T. Park, R. Zhang, H. Luo, A. H. Nevidomskyy, Q. Si, and P. C. Dai, Science 345, 657 (2014).
- (48) Y. Zhang, M. Yi, Z.-K. Liu, W. Li, J. J. Lee, R. G. Moore, M. Hashimoto, M. Nakajima, H. Eisaki, S.-K. Mo, Z. Hussain, T. P. Devereaux, Z.-X. Shen, and D. H. Lu. Phys. Rev. B 94, 115153 (2016).
- (49) Y. Zhang, C. He, Z. R. Ye, J. Jiang, F. Chen, M. Xu, Q. Q. Ge, B. P. Xie, J. Wei, M. Aeschlimann, X. Y. Cui, M. Shi, J. P. Hu, and D. L. Feng. Phys. Rev. B 85, 085121 (2012).
- (50) M. Yi, D. H. Lu, R. G. Moore, K. Kihou, C.-H. Lee, A. Iyo, H. Eisaki, T. Yoshida, A. Fujimori, and Z.-X. Shen. New J. Phys. 14, 073019 (2012).
- (51) Junhua Zhang, Rastko Sknepnek, and Jrg Schmalian, Phys. Rev. B 82, 134527 (2010).
- (52) M. D. Johannes, I. I. Mazin, and C. A. Howells, Phys. Rev. B 73, 205102 (2006).
- (53) Y. Li, Z. Yamani, Y. Song, W. Wang, C. Zhang, D. W. Tam, T. Chen, D. Hu, Z. Xu, S. Chi, K. Xia, L. Zhang, S. Cui, W. Guo, Z. Fang, Y. Liu, and P. Dai. Phys. Rev. X 8, 021056 (2018).
- (54) Jiun-Haw Chu, James G. Analytis, Kristiaan De Greve, Peter L. McMahon, Zahirul Islam, Yoshihisa Yamamoto, and Ian R. Fisher, Science 329, 824 (2010).
- (55) H. R. Man, R. Zhang, J. T. Park, Xingye Lu, J. Kulda, A. Ivanov, and P. C. Dai, Phys. Rev. B 97, 060507(R) (2018).
- (56) D. W. Tam, W. Y. Wang, L. Zhang, Y. Song, R. Zhang, S. V. Carr, H. C. Walker, T. G. Perring, D. T. Adroja, and P. C. Dai, Phys. Rev. B 99, 134519 (2019).
- (57) X.Y. Lu, K.-F. Tseng, T. Keller, W. L. Zhang, D. Hu, Y. Song, H. R. Man, J. T. Park, H. Q. Luo, S. L. Li, A. H. Nevidomskyy, and P. C. Dai, Phys. Rev. B 93, 134519 (2016).
- (58) G. Kotliar, S. Y. Savrasov, K. Haule, V. S. Oudovenko, O. Parcollet, and C. A. Marianetti, Rev. Mod. Phys. 78, 865 (2006).
- (59) P. Blaha, K. Schwarz, G. Madsen, D. Kvasnicka, and J. Luitz, WIEN2K, An Augmented Plane Wave+Local Orbitals Program for Calculating Crystal Properties (Karlheinz Schwarz, Techn. Universitt Wien, Austria, 2001).
- (60) J. P. Perdew, K. Burke, and M. Ernzerhof, Phys. Rev. Lett. 77, 3865 (1996).
- (61) K. Haule, C.-H. Yee, K. Kim Phys. Rev. B 81, 195107 (2010).
- (62) K. Haule, Phys. Rev. B 75, 155113 (2007).
- (63) P. Werner, A. Comanac, L. de’ Medici, M. Troyer, and A. J. Millis, Phys. Rev. Lett. 97, 076405 (2006).
- (64) D. R. Parker, M. J. Pitcher, P. J. Baker, I. Franke, T. Lancaster, S. J. Blundell, and S. J. Clarke, Chem. Commun., 2189-2191 (2009).
- (65) M. Rotter, M. Tegel, D. Johrendt, I. Schellenberg, W. Hermes, and R. Pttgen, Phys. Rev. B 78, 020503(R) (2008).
- (66) M. Yi, H, Pfau, Y, Zhang, Y, He, H, Wu, T. Chen, Z.R. Ye, M. Hashimoto, R. Yu, Q. Si, D.-H. Lee, Pengcheng Dai, Z.-X. Shen, D. H. Lu, and R. J. Birgenau, Phys. Rev. X 9, 041049 (2019).
- (67) M. H. Christensen, J. Kang, B. M. Andersen, and R. M. Fernandes. Phys. Rev. B 93, 085136 (2016).
- (68) S. V. Carr, C. Zhang, Y. Song, G. Tan, Y. Li, D. L. Abernathy, M. B. Stone, G. E. Granroth, T. G. Perring, and P. Dai, Phys. Rev. B 93, 214506 (2016).
- (69) Yu Song, Xingye Lu, D. L. Abernathy, David W. Tam, J. L. Niedziela, Wei Tian, Huiqian Luo, Qimiao Si, and Pengcheng Dai, Phys. Rev. B 92, 180504(R) (2015).
- (70) Naoum Karchev, Phys. Rev. B 57, 10913 (1998).
- (71) M. Wang, C. Zhang, X. Lu, G. T. Tan, H. Luo, Y. Song, M. Y. Wang, X. Zhang, E.A. Goremychkin, T. G. Perring, T. A. Maier, Z. P. Yin, K. Haule, G. Kotliar, P. Dai, Nat. Comm. 4, 2874 (2013).
- (72) D. W. Tam, H.-H. Lai, J. Hu, X. Lu, H. C. Walker, D. L. Abernathy, J. L. Niedziela, T. Weber, M. Enderle, Y. Su, Z. Q. Mao, Q. Si, and P. Dai, Phys. Rev. B 100, 054405 (2019).
- (73) Q. Wang, Y. Shen, B. Pan, X. Zhang, K. Ikeuchi, K. Iida, A. D. Christianson, H. C. Walker, D. T. Adroja, M. Abdel-Hafiez, X. Chen, D. A. Chareev, A. N. Vasiliev, and J. Zhao, Nat. Comm. 7, 12182 (2016).