Modeling the temperature of maximum density of aqueous tert-butanol solutions
Abstract
Short-chain alcohols at high dilution are among the very few solutes that enhance the anomalous behavior of water, in particular the value of the temperature of maximum density. This peculiar feature, first discovered experimentally in the early sixties, has remained elusive to a full explanation in terms of atomistic models. In this paper, we first introduce a two-site model of tert-butanol in which the interactions involving hydrogen bonding are represented by a Stillinger-Weber potential, following the ideas first introduced by Molinero and Moore, [J. Phys. Chem. B, 113, 4008, (2009)]. Our model parameters are fit so as to semi-quantitatively reproduce the experimental densities and vaporization enthalpies of previously proposed united atom and all atom OPLS models. Water is represented using the aforementioned potential model introduced by Molinero and Moore, with cross interaction parameters between water and tert-butanol optimized to yield a reasonable description of the experimental excess enthalpies and volumes over the whole composition range of the mixture. We will see that our simple model is able to reproduce the presence of a maximum in the change of the temperature of maximum density for very low alcohol mole fractions, followed by a considerable decrease until the density anomaly itself disappears. We have correlated this behavior with changes in the local structure of water and compared it with the results of all-atom simulations of water/tert-butanol mixtures.
1 Introduction
Aqueous binary mixtures are of great importance in science and technology in view of the great number of (bio)chemical processes which take place in solution. The scientific challenge posed by mixtures stems from the extra degrees of freedom due to the composition variables, which in turn leads to an extremely rich physical behavior [1]. Among these mixtures, water-alcohol solutions play a particular relevant role due to their multiple uses in various technological and everyday life processes, such as disinfecting and detergent agents[2], solvents [3, 4], dispersion media[5] and drugs constituents [6, 7, 8]. Therefore, the study of the thermodynamics of aqueous alcohol solutions has attracted a good amount of research since long [9, 10]. Having both hydrophilic and hydrophobic functional groups, alcohols are the simplest amphiphilic molecules. For this reason, exploring their behavior in water solutions can provide an invaluable insight on the role of hydrophobic and hydrophilic interactions in biophysical processes. As a matter of fact, those are thought to be the main actors in essential phenomena such as protein folding [11].
Particular interesting are short chain monohydric alcohols that are completely miscible with water: methanol, ethanol, propanol and tertiary butyl alcohol (TBA). Their solutions preserve the well known anomalous behavior of water [12, 13, 14, 15] (temperature of maximum density, pressure of maximum self-diffusion …) up to a certain concentration for which the anomalies are destroyed, typically around , [16, 17, 18]. Interestingly, short chain alcohols are unique among solutes in the fact that the anomalous behavior is even enhanced [19, 20] by their presence in small amounts. Thus one finds that the temperature of maximum density exhibits an increase with respect to that of pure water that in the case of TBA reaches a maximum value for [19].
The thermodynamic anomalies of alcohol-water mixtures originate from the corresponding anomalies of pure water [22, 23]. Of special relevance is the volume contraction of pure water that occurs with increasing temperature until a maximum density is reached around along the atmospheric pressure isobar. The existence of this temperature of maximum density (TMD) is probably the best known singularity of water, studied already since the 17th century [24]. Its microscopic origin is based on the prevalence of the formation of low-density ice-type structures over the high-density close-packed configurations right after melting. Solutes that promote a more stable hydrogen-bond network would enhance the anomalous behavior (raise the TMD), whereas those that tend to weaken it would have the opposite effect. This actually bring us back to the “iceberg model” introduced in the forties by Frank and Evans [25] to analyze the solvation of hydrophobic solutes. According to the “iceberg model”, the presence of a hydrophobic solute (in the case of alcohols the alkyl chain) would induce the reorganization of the surrounding water molecules with an ice-like structure, which in turn would imply an enhancement of the water anomalies (e.g. a rise in the TMD). These solutes were originally termed “structure makers”, in contrast with those that tend to destroy ice-like structures (e.g. hydrophilic groups), termed “structure breakers” [26, 27]. This view has been supported to some extent by the simulation study of Galamba [28].
Since the original contributions of Wada and Umeda in the early sixties [19, 20], a number of works have addressed the issue of the solute’s influence on the TMD of water in the case of short chain alcohols [29, 30, 31, 32, 33, 34, 35, 36]. Among these, it is worth mentioning the statistical mechanical model of Chatterjee et al. [33]. This model predicts an increase in the TMD with the hydrophobic character of the solute (in this particular case, molecular size) and a decrease with the hydrophilic character (solute-solvent attraction), in apparent agreement with the experimental results of Wada and Umeda [19]. The solute mole fraction for the maximum of the shift in the TMD is, however, larger than the experimental result. This idea proposed by Chatterjee et al. was later applied to a simplified dimer molecule where the effect of hydrogen bonding is modeled with a two scale potential[34]. In this case, the presence of the solute decreases the TMD. In contrast, another two-length scale potential dimer model proposed in Ref. [36] displayed a behavior in accordance with the experimental data, but for artificially low densities. On the other hand, atomistic simulations using either united atom models OPLS for methanol [35], or the very recent simulation work for alcohol/water solutions using flexible all-atom models for methanol, ethanol, propanol, and tert-butanol together with TIP4P/2005f water[37], all fail to reproduce the enhancement of the density anomaly for small alcohol concentrations. In all instances the presence of alcohol molecules induces a substantial decrease of the TMD (up to five times larger than the experimental one for concentrations ).
In this work, we will focus on tert-butanol solutions, which are of considerable interest due to the presence of marked thermodynamic anomalies [41, 42]. For instance, highly diluted TBA solutions exhibit the most significant increase of the TMD among all short chain alcohols. Moreover, it is the highest molecular mass alcohol to be completely miscible with water in all proportions under ambient conditions [43]. A possible origin of the anomalies has been attributed to the formation of clathrate-hydrates [44], which fits well within the “iceberg model” picture. Our results will provide further evidence in this direction.
From a computational standpoint modeling TBA/water solutions poses a considerable challenge. The bulky alkyl group of TBA is known to be responsible for the formation of molecular emulsions [16], which for certain concentrations are actually equivalent to a microphase separation, in which two intertwined regions of alcohol and water are separated at the microscopic level. Accounting for these structural effects implies lengthy simulations and extremely large samples. In addition, from the results of Ref. [37] we know that even optimized all-atom models do not seem capable of reproducing the experimental density anomalies. Therefore, here we have chosen a simpler model that can account for the structural order due to the presence of highly directional hydrogen bonds, namely, the Stillinger-Weber potential, which is characterized by the presence of a strongly directional thee-body component that favors tetrahedral coordination [45]. This was first used to model water by Molinero and Moore [21] without explicitly accounting for hydrogen atoms. Hereafter, we will denote this interaction as mW potential. We represent TBA molecules using a two-site model, in which the alkyl group is a Lennard-Jones center, and the hydroxil group site interacts with other hydroxil groups via a modified mW potential. Hydroxil/tert-butyl interactions are plain LJ potentials. The tert-butyl site and hydroxil sites are 1.836 Å apart, in agreement with the geometry parameters of Kusalik et al. three-site model [39]. Water will be modeled using strictly the original mW potential, and the cross interaction between water and TBA’s hydroxil group also accounted for by a modified mW potential. A Lennard-Jones potential is used to model the interaction between the alkyl group and water. The presence of this interaction appropriately tuned leads to an approximately correct number of hydrogen bonds around the alcohol’s hydroxil group. The parameters for the TBA-TBA interaction are tuned to reproduce qualitatively the experimental density and vaporization enthalpies, at least to a comparable level as those of the atomistic models of Kusalik et al. [39, 40].
Using extensive Molecular Dynamics (MD) simulations, we will show that our simple model captures the increase of the TMD of water upon addition of small amounts of TBA. Besides, we have performed a local structure analysis for a series of temperatures above, at and below de TMD using Nguyen and Molinero’s CHILL+ algorithm [46]. This algorithm allows for an identification and quantification of ice like, clathrate, and liquid like structures in a series of configurations of water molecules. This analysis was run on configurations of our dimer TBA model solution and of the all atom flexible model of Ref. [37]. In this way, we have been able to provides a clear correlation between the structural reorganization at the microscopic level and changes in the TMD. Also, one can get some insight as to to why all-atom models to date do not seem capable of reproducing the subtle effects that the presence of alcohols have on the density anomaly.
The rest of the paper is organized as follows. In Section II we introduce our models for water and TBA molecules, and summarize the simulation details. Next, in Section III we discuss our most significant results. The article is closed with a presentation of relevant conclusions and future prospects.
2 The model
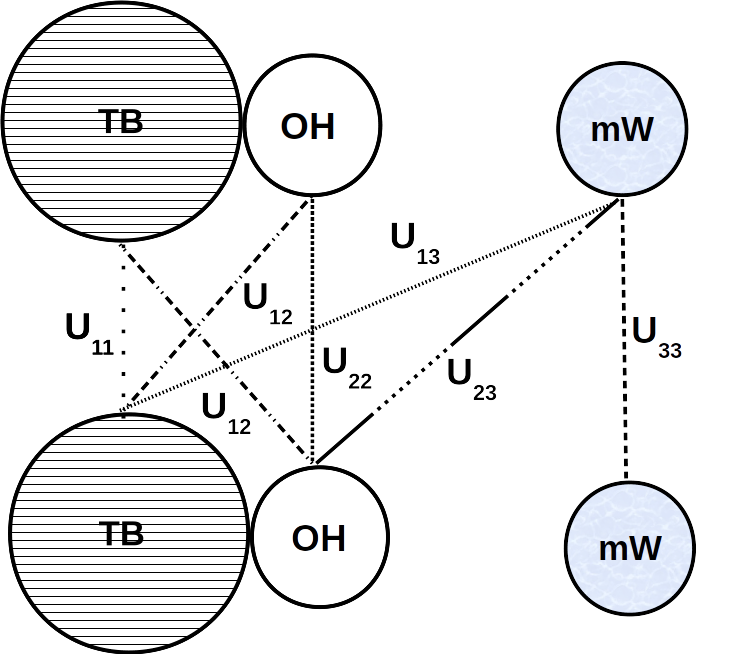
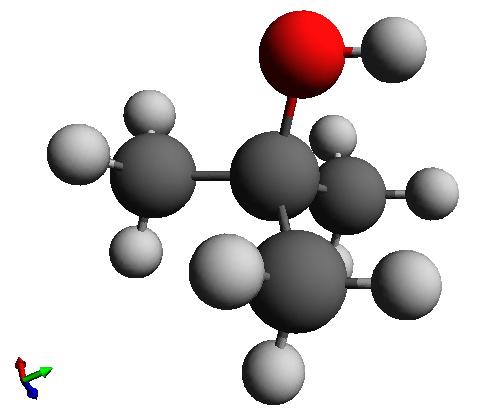
In our model we coarse-grain the 3 atom water molecule to a single site, and the 15 atom TBA to a two site model, as depicted in the left graph of Figure 1(a) in which all the interactions involved are represented by straight lines.
Water. As mentioned, for water we used the model introduced by Molinero and Moore [21], which was devised to tune Stillinger-Weber’s potential –originally designed for Silicon [45] – which guarantees the tetrahedral coordination of oxygen atoms in ice [47]. The model is a coarse-grained representation of water molecules in which only oxygen-oxygen correlations are accounted for. It has two- and three-body contributions of the form
| (1) |
where
| (2) |
and
| (3) |
The fitted parameters are , , , , and , which define the potential’s form and scale. The reduced cutoff ensures that all terms in the potential and forces vanish at . Tetrahedral angles are favored by the cosine quadratic term with the equilibrium value set to . The parameter tunes the repulsive three-body term, setting the strength of the directional interactions of the model [21, 45].
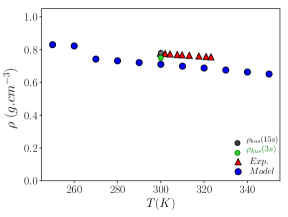
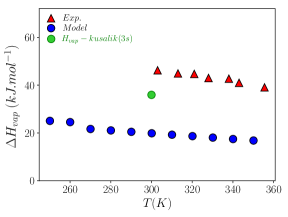
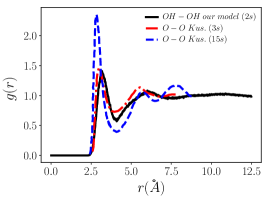
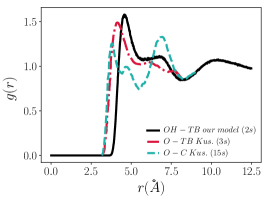
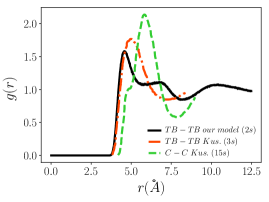
Tert-butyl alcohol. The tert-butanol molecule (See Figure 1(a)) is coarse-grained into a two site model: an apolar tert-butyl center (TB) which interacts via a Lennard-Jones potential () and the hydroxyl group OH which interacts through a Lennard-Jones potential with TB centers () and with other OH sites via a Stillinger-Weber potential similar to the mW interaction (). The parameters of the interactions were adjusted having in mind the experimental values of various thermodynamic and structural quantities: density –Fig. 2(a), vaporization enthalpy - Fig. 2(b) and the radial distribution functions obtained for the three-site and fifteen-site models of Kusalik and coworkers [39, 40](see Fig. 3). Cross interaction parameters are determined from the standard Lorentz-Berthelot combination rules. LJ potentials are truncated at 12.5 Å and long range corrections to the energy and pressure are applied. Explicit parameter values are collected in Table 1. We can appreciate from Figs. 2 that our model performs reasonably well for the density (less than ten percent deviation from the experimental values vs. four percent of the more sophisticated three site model of Ref. [39]) and very specially the temperature dependence is correctly reproduced. Deviations in the vaporization enthalpy are substantially larger, but in our opinion and given the considerable departures exhibited by the more elaborate three site model, they can be deemed acceptable. Note that even for sophisticated water models, vaporization enthalpy is only reproduced when a term to account for the different self-polarization of liquid water are introduced ad hoc[48]. When comparing pair distribution functions, we see that the agreement is more or less reasonable, being our model logically closer to the three site model. This is specially so for the OH-OH and OH-TB partial distributions. Differences between the fifteen site, three site and our model are in any case significant. Not surprisingly, the 15-site model yields pair distribution functions that seem to be in better qualitative agreement with experimental results from neutron diffraction [49]. As to hydrogen bonding, our model gives a coordination number from the integration of up to its first minimum of 2.07, which is somewhat larger than the values 1.62 and 1.77 of Kusalik et al. for three site and 15 site models respectively[39]. Experimental estimates lie in the range from 1.4 to 1.8 [49]. Nonetheless, it is to be noticed that our estimate for the hydrogen bonding capabilities of our model are also well below the maximum possible value of 3. This is a clear indication of the weakening of the hydrogen bonding due to the steric hindrance induced by the bulky alkyl group.
| OH - OH interactions | TB-TB interactions | TB-OH interactions | ||||||
| p | ||||||||
| 1.50 | 2.60 | 65.00 | 1.2 | 5 | 0.25 | 5.45 | LB | LB |
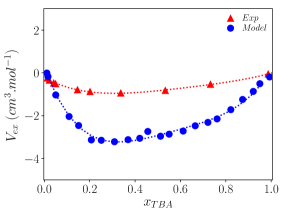
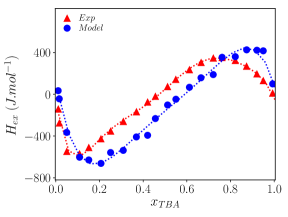
Cross interactions for the TBA-water. The effects of mixing are best analyzed in terms of excess quantities, which are nothing but the difference between mixture thermodynamic properties both real and ideal at a given composition, pressure and temperature. As shown in Ref. [35], excess properties from simulated models can hardly be reproduced if the cross interactions between different molecular components are computed using standard mixing rules. The obvious route to bypass this shortcoming is to adjust these cross interaction parameters to fit the experimental value of the excessproperties over the whole composition range. In our case we have used as reference quantities to be fitted the excess enthalpy [50] and excess volume [51]). Results from the fit are illustrated in Figure 4, and we can see that the model reproduces qualitatively the experimental behavior, both the volume contraction and the non-monotonic compositional dependence of the excess enthalpy. Tert-butyl/water interaction () is modeled via a plain LJ potential truncated at 12.5 Å with long range corrections to the energy and pressure are applied. The OH-water interaction () is again a Stillinger-Weber potential with a three-body component, for which the and parameters have been optimized and the remaining parameter are identical to those of the plain mW water-water interaction. The final fitted parameters are collected in Table 2.
| TB-mW interactions | OH-mW interactions | ||
|---|---|---|---|
| (kcal/mol) | (kcal/mol) | ||
| 0.459 | 3.984 | 1.371 | 3.660 |
We have performed MD simulations for a number of system with particle numbers ranging from 2000 (pure water) to 4000 (pure TBA) for various compositions using the LAMMPS package [52]. Simulations were performed in the isothermal-isobaric ensemble with a Nosé-Hoover thermostat and barostat [53, 54] with a time-step of one fs and relaxation times of 10ps and 100ps respectively. Particles were placed in a cubic box with standard periodic boundary condition. The dimer bonds were kept fixed using a SHAKE algorithm [55], with a tolerance factor of . Our simulations started from a compositionally disordered mixture of TBA and water particles, which was equilibrated at the chosen pressure and temperature for 2 ns. Production runs were 10 ns long. To ensure that the system was thermalized, the evolution of the pressure, and the kinetic and potential energies were closely monitored during the equilibration run. Configurations were stored every 2 ps and running averages computed every 0.1 ps. Additionally, we have run all-atom simulations using an optimized OPLS-AA model proposed by Jorgensen et al. [56] in combination with a TIP4P/2005f flexible model for water [57] and cross interaction parameters fitted to experimental excess properties [37]. Additionally simulations for pure TIP4P/2005f water were also run. We have used the GROMACS package [58, 59] in the isothermal-isobaric ensemble with a time-step of 0.5 fs. Configurations were stored every 2000 time-steps for temperatures approximately at the TMD and some 10K above and below, in order to analyze the structural changes taking place when crossing the temperature of maximum density at constant pressure.
3 Results and Conclusions
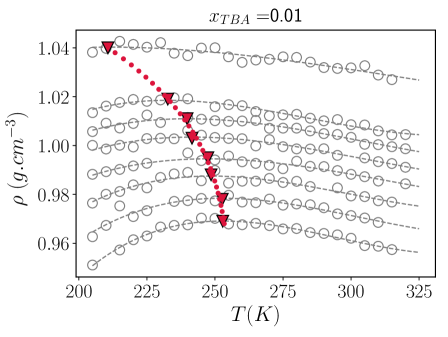
After a long series of simulations for TBA mole fractions at various pressures, we have obtained density isobars as those shown in Figure 5, in which the dashed curves correspond to third degree polynomial fits. We have used these fits to obtain the estimates of the temperature of maximum density. Despite some statistical uncertainty in the simulated densities (due to the high accuracy required to appreciate the very small density change), the trends are clear. One observes that as pressure grows the TMD decreases in a monotonic fashion. This is in agreement with experimental findings [48], and it occurs for all the mole fractions studied for which the anomaly is preserved. The origin of this behavior can be traced back to the fact that pressure tends to hinder the formation of low density ice-like and clathrate structures by which the anomalous region of water (or water solutions here) is shifted to lower temperatures.
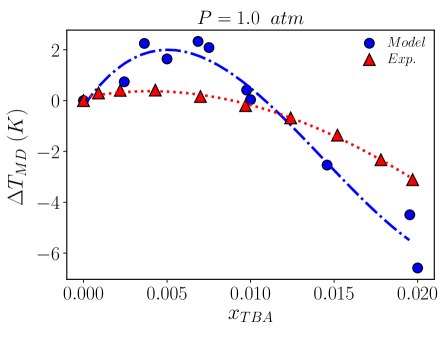
Now, the relevant quantity is precisely the change in the TMD due to the addition of solute, . This quantity is plotted in Figure 6 as computed from the simulation results, together with the experimental results de Wada and Umeda [19]. The first feature one observes in the figure is the presence of a 2K maximum at , which is approximately the location of the maximum for the experimental results. Our model overestimates the temperature change of the maximum. After the maximum, one rapidly reaches for , a value slightly higher than that of the experimental crossover. For larger concentrations the TMD decreases further, as it does experimentally, up to a point where it is either destroyed (TBA does not exhibit any density anomaly) or preempted by crystallization.
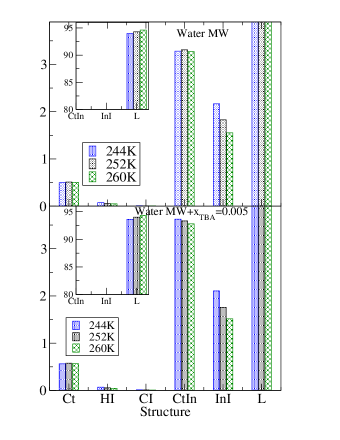
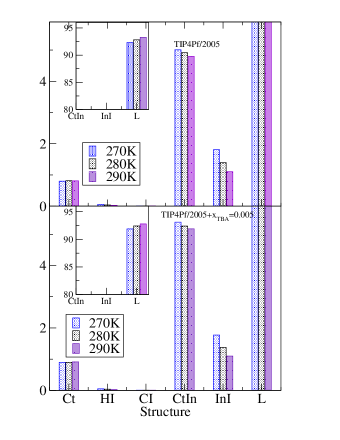
Thus, we have finally devised a simple model of short chain alcohol that displays the “structure maker” character observed experimentally, i.e. a solute that increases the temperature of the maximum density of water. Interestingly, in a very recent work [37] a much more sophisticated model for water/TBA mixtures using flexible all-atom simulations was unable to reproduced this feature. In order to correlate the non-monotonic density dependence of water and water/TBA with microscopic structural changes, we have analyzed a series of configurations from our TBA/water model and the TIP4P/2005f-OPLS of Ref. [37] using Nguyen and Molinero’s CHILL+ algorithm [46]. This procedure allows for the identification and quantification of cubic ice, hexagonal ice, and clathrate hydrate structures (both bulk and interfacial) together with liquid water ones. Results for both models approximately at the TMD and 8-10K above and below are shown in Figs 7, in addition to pure water results modeled using mW potential [21] and the flexible TIP4P/2005f model [57]. Statistical uncertainties are not visible at the scale of the figure. Focusing first on water, one observes that only clathrate hydrate structures exhibit a subtle maximum at the TMD for both water models. In the case of the mW potential a maximum is also present in interfacial clathrate structures. All these structures are tetra-coordinated oxygen atoms but with eclipsed bonds [46]. As temperature increases, both these and liquid-water structures grow initially at the expense of ice-like structures. Being almost perfectly tetrahedral, ice-like structures are less dense. This explains the initial anomalous increase of density. From the TMD onward, the relative weight of low density structures (clathrate, and ice-like structures both bulk and interface) diminishes considerably, and density decreases due to the regular thermal expansion of the high density liquid water structure. Thus, the interplay between a small maximum in low density structures (clathrates) and increase of liquid-like (high density) structures seems to be at the source of the existence of a TMD. Note, additionally, that all other low density (ice-like) structures have a very small presence after melting, and display a monotonic decrease with increasing temperature. It is important to notice that the clathrate structures occur in both models of pure water, so its existence does not require –although, as shown below, it is enhanced by– the presence of solute molecules.
Now in the lower graphs of Figure 7 we have the corresponding histograms for the solutions at , i.e. close to the maximum of for our model. We see that again our results exhibit a maximum in the bulk clathrate hydrate structures. Interestingly the maximum does not occur for the interfacial clathrates anymore. In the solution, these structures are basically promoted by the presence of solute molecules, and their relative weight monotonically decreases with temperature. Now, in the TIP4P/2005f-OPLS model the maximum is shifted to temperatures well beyond the TMD, the region shown in the figure displaying a slight increase in the relative weight of the clathrate structures. This explains why this model preserves the density anomaly, but on the other hand the maximum in the low density structures occurs now for higher temperatures, above the TMD, where the thermal expansion of the dominant liquid-like structures control the behavior, thus the water anomaly is not enhanced and .
In our model, for a larger concentration, such as the density anomaly occurs at very low temperatures, where the large fluctuations in the results are likely connected with the onset of crystallization and . In this case, the solute behaves now as a strong “structure breaker”. We have observed that the maximum in the ratio of bulk clathrate structures is much less marked. Also, the relative weight of interfacial clathrates increases 25 percent with respect to the value for pure water and diminishes with increasing temperature. As in the case of the all-atom model, these structures are promoted by the presence of solute molecules and their relative weight depends on the concentration of the latter. The decrease in the maximum of bulk clathrate structures is most likely connected with the fall in the TMD. Larger increases in will lower the TMD even further, and the density anomaly will be completely preempted by crystallization/vitrification. Apparently, in the all-atom model solution, the shift of the bulk clathrate structure maximum, and in our dimer TBA model the smoothing of the corresponding maxima for concentrations above , are the structural features that determine the “structure breaker” character of the solutes. Note that for lower concentrations, our model solute becomes “structure maker”.
In summary, we have devised a simple diatomic model for TBA with three body interactions on the hydroxil site that mimics the formation hydrogen bonds. Cross interactions were fitted to qualitatively account for the experimental excess properties of water/TBA solutions, with water represented by Molinero and Moore’s model [21]. We have seen that the model is capable of reproducing the experimental enhancement of the density anomaly of water observed for very small concentrations of alcohol. A structural analysis of the simulation results illustrates the correlation between the presence of a maximum of certain clathrate structures and the density anomaly. The fact that the maxima occurs in the bulk clathrates and not interfacial clathrates and that high density liquid like structures also increase in a monotonic fashion with temperature seems to be at the root of the density anomaly enhancement. As found in Ref. [37], a much more sophisticated all-atom model is unable to reproduce the experimental behavior.
Future work should address the inability of all-atom models to account for the concentration dependence of water anomalies. In this regard, the role of the hydrogen bond network has to be reassessed and possibly include non-additive effects such as polarization and charge transfer.
Acknowledgments
EL, EGN and DGS acknowledge the support from the Agencia Estatal de Investigación and Fondo Europeo de Desarrollo Regional (FEDER) under grant No. FIS2017-89361-C3. MSM and MCB thanks the Brazilian science agencies - Conselho Nacional de Desenvolvimento Cientıfico e Tecnologico (CNPq) and Coordenacão de Aperfeiçoamento de Pessoal de Nível Superior (CAPES Print Program) for the support to the collaborative period in the Instituto de Química Fisica Rocasolano. DG acknowledge to the Galicia Supercomputing Center (CESGA) for the computer time allocated for some of our calculations.
Data Availability
The data that support the findings of this study are available from the corresponding author upon reasonable request.
References
- [1] C. Gray, K. Gubbins, and C. Joslin, Theory of Molecular Fluids: Volume 2: Applications. International Series of Monographs on Chemistry, OUP Oxford, 2011.
- [2] A. Timar-Balazsy, D. Eastop, and M. Jaró, Chemical Principles of Textile Conservation. Butterworth Heinemann series in conservation and museology, Butterworth-Heinemann, 1998.
- [3] T. Zelenková, A. A. Barresi, and D. Fissore, “On the use of tert-butanol/water cosolvent systems in production and freeze-drying of poly--caprolactone nanoparticles,” Journal of Pharmaceutical Sciences, vol. 104, no. 1, pp. 178–190, 2015.
- [4] C. Kunz, S. Schuldt-Lieb, and H. Gieseler, “Freeze drying from organic co-solvent systems, part 1: Thermal analysis of co-solvent-based placebo formulations in the frozen state,” Journal of Pharmaceutical Sciences, vol. 107, pp. 1–10, 11 2017.
- [5] E. Graczová, B. Sulgan, and P. Steltenpohl, “tert-butanol-water mixture separation by extractive distillation: Application of experimental data in process simulations,” Separation and Purification Technology, p. 116968, 2020.
- [6] S. Vessot and J. Andrieu, “A review on freeze drying of drugs with tert-butanol (tba) + water systems: Characteristics, advantages, drawbacks,” Drying Technology, vol. 30, no. 4, pp. 377–385, 2012.
- [7] J.-C. Wang, R. Bruttini, and A. I. Liapis, “Insights from a thermodynamic study and its implications on the freeze drying of pharmaceutical solutions having water and tert-butyl alcohol as a co-solvent,” PDA Journal of Pharmaceutical Science and Technology, vol. 73, no. 3, pp. 247–259, 2019.
- [8] B. S. Bhatnagar, J. Sonje, E. Shalaev, S. W. H. Martin, D. L. Teagarden, and R. Suryanarayanan, “A refined phase diagram of the tert-butanol-water system and implications on lyophilization process optimization of pharmaceuticals,” Phys. Chem. Chem. Phys., vol. 22, pp. 1583–1590, 2020.
- [9] F. Franks and D. J. G. Ives, “The structural properties of alcohol–water mixtures,” Q. Rev. Chem. Soc., vol. 20, pp. 1–44, 1966.
- [10] F. Franks, Water A Comprehensive Treatise: Volume 4: Aqueous Solutions of Amphiphiles and Macromolecules. Water, Springer US, 2013.
- [11] C. Van Oss, The Properties of Water and Their Role in Colloidal and Biological Systems. Interface Science and Technology, Elsevier Science, 2008.
- [12] K. Nishikawa, H. Hayashi, and T. Iijima, “Temperature dependence of the concentration fluctuation, the kirkwood-buff parameters, and the correlation length of tert-butyl alcohol and water mixtures studied by small-angle x-ray scattering,” The Journal of Physical Chemistry, vol. 93, no. 17, pp. 6559–6565, 1989.
- [13] L. Zoranić, F. Sokolić, and A. Perera, “Microstructure of neat alcohols: A molecular dynamics study,” The Journal of Chemical Physics, vol. 127, no. 2, p. 024502, 2007.
- [14] D. Subramanian, J. Klauda, J. Leys, and M. Anisimov, “Thermodynamic anomalies and structural fluctuations in aqueous solutions of tertiary butyl alcohol,” Vestn. S.-Peterb. Univ., Ser. 4: Fiz., Khim., vol. 4, pp. 140 – 153, 2013.
- [15] M. Požar and A. Perera, “Evolution of the micro-structure of aqueous alcohol mixtures with cooling: A computer simulation study,” Journal of Molecular Liquids, vol. 248, pp. 602 – 609, 2017.
- [16] B. Kežić and A. Perera, “Aqueous tert-butanol mixtures: A model for molecular-emulsions,” The Journal of Chemical Physics, vol. 137, no. 1, p. 014501, 2012.
- [17] B. Bagchi, The amphiphilic effect: the diverse but intimate world of aqueous binary mixtures, p. 243–260. Cambridge Molecular Science, Cambridge University Press, 2013.
- [18] L. Comez, M. Paolantoni, L. Lupi, P. Sassi, S. Corezzi, A. Morresi, and D. Fioretto, “Hydrophobic hydration in water–tert-butyl alcohol solutions by extended depolarized light scattering,” The Journal of Physical Chemistry B, vol. 119, no. 29, pp. 9236–9243, 2015. PMID: 25436859.
- [19] G. Wada and S. Umeda, “Effects of nonelectrolytes on the temperature of the maximum density of water. i. alcohols,” Bulletin of the Chemical Society of Japan, vol. 35, no. 4, pp. 646–652, 1962.
- [20] G. Wada and S. Umeda, “Effects of nonelectrolytes on the temperature of the maximum density of water. ii. organic compounds with polar groups,” Bulletin of the Chemical Society of Japan, vol. 35, no. 11, pp. 1797–1801, 1962.
- [21] V. Molinero and E. B. Moore, “Water modeled as an intermediate element between carbon and silicon,” The Journal of Physical Chemistry B, vol. 113, no. 13, pp. 4008–4016, 2009. PMID: 18956896.
- [22] F. Franks, The Physics and Physical Chemistry of Water. No. v. 1 in Franks, Felix, Springer US, 1972.
- [23] P. Poole, F. Sciortino, U. Essmann, and H. Stanley, “Phase behavior of metastable water,” Nature, vol. 360, pp. 324–328, 11 1992.
- [24] M. Beretta, “At the source of western science: The organization of experimentalism at the accademia del cimento (1657-1667),” Notes and Records of the Royal Society of London, vol. 54, pp. 131–151, 05 2000.
- [25] H. S. Frank and M. W. Evans, “Free volume and entropy in condensed systems iii. entropy in binary liquid mixtures; partial molal entropy in dilut e solutions; structure and thermodynamics in aqueous electrolytes,” J. Chem. Phys., vol. 13, p. 507, 1945.
- [26] A. J. Darnell and J. Greyson, “Effect of structure-making and -breaking solutes on the temperature of maximum density of water,” The Journal of Physical Chemistry, vol. 72, no. 8, pp. 3021–3025, 1968.
- [27] L. G. Hepler, “Thermal expansion and structure in water and aqueous solutions,” Canadian Journal of Chemistry, vol. 47, no. 24, pp. 4613–4617, 1969.
- [28] N. Galamba, “Water’s structure around hydrophobic solutes and the iceberg model,” J. Phys. Chem. B,, vol. 117, pp. 2153 – 2159, 2013.
- [29] F. Franks and B. Watson, “Maximum density effects in dilute aqueous solutions of alcohols and amines,” Trans. Faraday Soc., vol. 63, pp. 329–334, 1967.
- [30] T. Lilley and S. Murphy, “The temperature of maximum density of aqueous electrolyte solutions and its relation to the temperature derivative of the partial molar volume of the solute,” The Journal of Chemical Thermodynamics, vol. 5, no. 4, pp. 467 – 470, 1973.
- [31] D. Macdonald, B. Dolan, and J. Hyne, “The influence of substituted alcohols on the temperature of maximum density of water,” Journal of Solution Chemistry, vol. 5, pp. 405–416, 01 1976.
- [32] E. S. Kim and K. N. Marsh, “Excess volumes for 2-methyl-2-propanol + water at 5 k intervals from 303.15 to 323.15 k,” Journal of Chemical & Engineering Data, vol. 33, no. 3, pp. 288–292, 1988.
- [33] S. Chatterjee, H. S. Ashbaugh, and P. G. Debenedetti, “Effects of nonpolar solutes on the thermodynamic response functions of aqueous mixtures,” The Journal of Chemical Physics, vol. 123, no. 16, p. 164503, 2005.
- [34] Z. Su, S. V. Buldyrev, P. G. Debenedetti, P. J. Rossky, and H. E. Stanley, “Modeling simple amphiphilic solutes in a jagla solvent,” J. Chem. Phys., vol. 136, p. 044511, 2012.
- [35] D. González-Salgado, K. Zemánková, E. G. Noya, and E. Lomba, “Temperature of maximum density and excess thermodynamics of aqueous mixtures of methanol,” The Journal of Chemical Physics, vol. 144, no. 18, p. 184505, 2016.
- [36] A. P. Furlan, E. Lomba, and M. C. Barbosa, “Temperature of maximum density and excess properties of short-chain alcohol aqueous solutions: A simplified model simulation study,” The Journal of Chemical Physics, vol. 146, no. 14, p. 144503, 2017.
- [37] E. García-Perez, D. González-Salgado, and E. Lomba, “Molecular dynamics simulations of aqueous solutions of short chain alcohols. excess properties and the temperature of maximum density,” to be published, 2020.
- [38] N. I. of Standard and Technology, “2-propanol, 2-methyl.” https://webbook.nist.gov/cgi/cbook.cgi?ID=C75650&Mask=4, 2018.
- [39] P. G. Kusalik, A. P. Lyubartsev, D. L. Bergman, and A. Laaksonen, “Computer simulation study of tert-butyl alcohol. 1. structure in the pure liquid,” The Journal of Physical Chemistry B, vol. 104, no. 40, pp. 9526–9532, 2000.
- [40] P. G. Kusalik, A. P. Lyubartsev, D. L. Bergman, and A. Laaksonen, “Computer simulation study of tert-butyl alcohol. 2. structure in aqueous solution,” The Journal of Physical Chemistry B, vol. 104, no. 40, pp. 9533–9539, 2000.
- [41] D. Subramanian and M. A. Anisimov, “Resolving the mystery of aqueous solutions of tertiary butyl alcohol,” The Journal of Physical Chemistry B, vol. 115, no. 29, pp. 9179–9183, 2011. PMID: 21671661.
- [42] F. Aman-Pommier and C. Jallut, “Excess specific volume of water + tert-butyl alcohol solvent mixtures: Experimental data, modeling and derived excess partial specific thermodynamic quantities,” Fluid Phase Equilibria, vol. 439, pp. 43 – 66, 2017.
- [43] K. Kasraian and P. DeLuca, “Thermal analysis of the tertiary butyl alcohol-water system and its implications on freeze-drying,” Pharmaceutical Research, vol. 12, no. 4, p. 484-490, 1995.
- [44] R. Kay, The Physical Chemistry of Aqueous Systems: A Symposium in Honor of Henry S. Frank on His Seventieth Birthday. Springer US, 2012.
- [45] F. H. Stillinger and T. A. Weber, “Computer simulation of local order in condensed phases of silicon,” Phys. Rev. B, vol. 31, pp. 5262–5271, 04 1985.
- [46] A. H. Nguyen and V. Molinero, “Identification of clathrate hydrates, hexagonal ice, cubic ice, and liquid water in simulations: the CHILL+ algorithm,” J. Phys. Chem. B, vol. 119, no. 29, pp. 9369–9376, 2014.
- [47] V. Molinero, S. Sastry, and C. A. Angell, “Tuning of tetrahedrality in a silicon potential yields a series of monatomic (metal-like) glass formers of very high fragility,” Phys. Rev. Lett., vol. 97, p. 075701, 08 2006.
- [48] H. L. Pi, J. L. Aragones, C. Vega, E. G. Noya, J. L. Abascal, M. A. Gonzalez, and C. McBride, “Anomalies in water as obtained from computer simulations of the tip4p/2005 model: density maxima, and density, isothermal compressibility and heat capacity minima,” Mol. Phys., vol. 107, pp. 365 – 374, 2009.
- [49] D. T. Bowron, J. L. Finney, and A. K. Soper, “The structure of pure tertiary butanol,” Molecular Physics, vol. 93, no. 4, pp. 531–543, 1998.
- [50] Y. Koga, “Excess partial molar enthalpies of water in water-tert-butanol mixtures,” Can. J. of Chem., vol. 66, no. 12, pp. 3171–3175, 1988.
- [51] G. I. Egorov and D. M. Makarov, “Densities and volume properties of (water+tert-butanol) over the temperature range of (274.15 to 348.15)k at pressure of 0.1mpa,” J. Chem. Thermod., vol. 43, no. 3, pp. 430 – 441, 2011.
- [52] S. Plimpton, “Fast parallel algorithms for short-range molecular dynamics,” Journal of Computational Physics, vol. 117, no. 1, pp. 1 – 19, 1995.
- [53] S. Nosé, “A unified formulation of the constant temperature molecular dynamics methods,” The Journal of Chemical Physics, vol. 81, no. 1, pp. 511–519, 1984.
- [54] W. G. Hoover, “Canonical dynamics: Equilibrium phase-space distributions,” Phys. Rev. A, vol. 31, pp. 1695–1697, 03 1985.
- [55] J.-P. Ryckaert, G. Ciccotti, and H. J. Berendsen, “Numerical integration of the cartesian equations of motion of a system with constraints: molecular dynamics of n-alkanes,” Journal of Computational Physics, vol. 23, no. 3, pp. 327 – 341, 1977.
- [56] W. L. Jorgensen, D. S. Maxwell, and J. Tirado-Rives, “Development and testing of the OPLS all-atom force field on conformational energetics and properties of organic liquids,” J. Am. Chem. Soc., vol. 118, no. 45, pp. 11225–11236, 1996.
- [57] M. A. González and J. L. F. Abascal, “A flexible model for water based on tip4p/2005,” J. Chem. Phys., vol. 135, p. 224516, 2011.
- [58] B. Hess, C. Kutzner, D. van der Spoel, and E. Lindahl, “Gromacs 4: Algorithms for highly efficient, load-balanced, and scalable molecular simulation,” J. Chem. Theory Comput., vol. 4, p. 435 – 447, 2008.
- [59] M. J. Abraham, T. Murtola, R. Schulz, S. Páll, J. C. Smith, B. Hess, and E. Lindahl, “GROMACS: High performance molecular simulations through multi-level parallelism from laptops to supercomputers,” SoftwareX, vol. 1-2, pp. 19–25, 2015.