Inverted metallicity gradients in two Virgo cluster star-forming dwarf galaxies: evidence of recent merging?††thanks: Based on observations collected at the Centro Astronómico Hispano Alemán (CAHA) at Calar Alto, operated jointly by the Max-Planck-Institut für Astronomie (MPIA) and the Instituto de Astrofísica de Andalucía (CSIC).
Abstract
We present integral field spectroscopy observations of two star-forming dwarf galaxies in the Virgo cluster (VCC 135 and VCC 324) obtained with PMAS/PPak at the Calar Alto 3.5 meter telescope. We derive metallicity maps using the N2 empirical calibrator. The galaxies show positive gas metallicity gradients, contrarily to what is usually found in other dwarfs or in spiral galaxies. We measure gradient slopes of 0.20 0.06 and 0.15 0.03 dex/ for VCC 135 and VCC 324, respectively. Such a trend has been only observed in few, very isolated galaxies, or at higher redshifts ( 1). It is thought to be associated with accretion of metal-poor gas from the intergalactic medium, a mechanism that would be less likely to occur in a high-density environment like Virgo. We combine emission line observations with deep optical images to investigate the origin of the peculiar metallicity gradient. The presence of weak underlying substructures in both galaxies and the analysis of morphological diagnostics and of ionised gas kinematics suggest that the inflow of metal-poor gas to the central regions of the dwarfs may be related to a recent merging event with a gas-rich companion.
keywords:
galaxies: dwarf, galaxies: star formation, galaxies: ISM, galaxies: kinematics and dynamics, galaxies: interactions, galaxies: evolution.1 Introduction
The abundance of heavy elements is a fundamental tracer of the evolutionary process of a galaxy. The metal content depends on many factors such as star formation rate and gas mass fraction, but it also reflects the interplay between outflows of chemically-enriched gas triggered by stellar feedback and external inflow of gas from the intergalactic medium (IGM; Lilly et al., 2013; Peng & Maiolino, 2014b). Hii-region emission lines, tracing young and massive stellar populations, are linked to the most recent star formation events and they have been long used to investigate the gas-phase abundance pattern and evolution in galaxies (Searle, 1971; Lequeux et al., 1979; Pagel & Edmunds, 1981; van Zee et al., 1998; Tremonti et al., 2004; Mannucci et al., 2010).
The advent of integral field unit (IFU) spectroscopic surveys such as CALIFA (Calar Alto Legacy Integral Field Area; Sánchez et al., 2012), SAMI (Sydney Australian Astronomical Observatory Multi-object Integral Field Spectrograph; Croom et al., 2012), MaNGA (Mapping Nearby Galaxies at Apache Point Observatory; Bundy et al., 2015), and AMUSING (All-weather MUse Supernova Integral-field Nearby Galaxies; Galbany et al., 2016), have made it possible to derive the spatial distribution of metals for large samples of galaxies, using nebular lines. Analysis of the radial distribution of heavy elements in galaxies is of particular interest because it allows us to understand the mass assembly history of a galaxy, the gas accretion process and its radial variation across the stellar disc, and the mechanisms that regulate the inside-out transportation of metals (Chiappini et al., 2001; Mott et al., 2013; Ho et al., 2015; Sánchez-Menguiano et al., 2016).
Studies of the gas metallicity radial gradient in local galaxies and of its dependence on stellar mass report different results. The gradient slopes of a sample of 350 spiral galaxies from the CALIFA survey show a slight dependence on M∗ and morphology, with late-type low-mass objects (M M⊙) displaying flatter trends (Sánchez-Menguiano et al., 2016). Analysis of massive spirals (M M⊙) in both the CALIFA and AMUSING surveys (Sánchez et al., 2014; Sánchez-Menguiano et al., 2018) suggest that galaxies show a common abundance gradient characterised by an inner drop and an outer flattening with only a weak trend with stellar mass (for a more detailed review see Sánchez, 2020). From the resolved mass-metallicity relation, derived in a sample extracted from the MaNGA survey, Barrera-Ballesteros et al. (2016) infer that star-forming galaxies with stellar masses above M⊙ display a common characteristic gradient. On the other hand, using a MaNGA sample of 550 galaxies Belfiore et al. (2017) found that the gas metallicity gradients of star-forming systems do depend on stellar mass: the metal abundance decreases with radius at high M∗ – the more massive the galaxies the steeper is the gradient – whereas low-mass systems (M M⊙) exhibit roughly constant metal content throughout their discs.
The environment where galaxies are evolving is another important factor defining the metal content and its radial distribution. Low-mass satellites (M M⊙) in higher density environments tend to have higher gas abundances (Peng & Maiolino, 2014a). In very low-density environments there is mounting evidence of systems showing anomalous metallicity gradients (Sánchez Almeida et al., 2014). Particularly, a class of extremely low-metallicity star-forming dwarfs with oxygen abundances 12 + log O/H 7.7 ( Z⊙), present an off-center star-forming region of lower metallicity compared to the rest of the disc (Morales-Luis et al., 2011; Sánchez Almeida et al., 2016; Sánchez Almeida et al., 2017; Lagos et al., 2018). The decrease of the metal abundance in these regions is of the order of 0.3 dex or larger and it is associated to the peak of the surface star formation rate (SFR; Richards et al., 2014; Sánchez Almeida et al., 2015). Such metallicity drops may give evidence of pristine gas accretion from the IGM.
Positive or inverted metallicity gradients are observed at redshift (Cresci et al., 2010; Queyrel et al., 2012). They are mostly attributed to the inflow of metal-poor gas from the IGM diluting central metallicities. However, other scenarios require that gaseous outflows triggered by a central starburst eject stellar nucleosynthesis products reducing the metal abundance (Wang et al., 2019).
Here we present the metallicity properties of two star-forming dwarf galaxies (SFDGs) in the Virgo cluster showing inverted oxygen abundance gradients: VCC 135 and VCC 324. They are low-mass star-forming systems in a high density environment with different levels of Hi-deficiency (i.e. from moderate to high, Haynes & Giovanelli, 1984; Gavazzi et al., 2013), implying that they are at different stages of interaction with the cluster. To our knowledge these are the first examples of SFDGs with such characteristics in a cluster environment. This is intriguing because accretion of cool gas from the IGM is expected to be suppressed in dense environments, requiring other scenarios to be investigated. The galaxies were selected from a sample of dwarfs detected by the Herschel Virgo Cluster Survey (Auld et al., 2013; Grossi et al., 2015) and we obtained integral-field spectroscopy observations using the Potsdam Multi Aperture Spectrograph (PMAS; Roth et al., 2005) in the PPak mode (Kelz et al., 2006) at the Calar Alto 3.5 meter telescope. A large set of ancillary data is available for these systems including observations of dust and molecular gas (Grossi et al., 2015, 2016).
The paper is organised as follows: in Sect. 2 we describe the observations and the data reduction procedure; in Sect. 3 we present the properties of our target galaxies; the main results from the analysis of the IFU and optical data are given in Sect. 4; Sect. 5 discusses possible interpretations of the results: in Sect. 6 we summarise our conclusions.
| ID | † | PA | ()‡ | () | () | (SFR) | DefHI | log(O/H) | ||
|---|---|---|---|---|---|---|---|---|---|---|
| [km s-1] | [′′] | [∘] | [∘] | [M⊙] | [M⊙] | [M⊙] | [M⊙ yr-1] | [dex] | [dex/] | |
| VCC 135 | 2408 | 8.2 | 59 | 8.89 0.04 | 6.64 0.08 | 7.53 0.08 | -1.04 0.08 | 1.7 | 0.20 0.06 | |
| VCC 324 | 1531 | 11.0 | 38 | 8.72 0.04 | 8.23 0.01 | 7.60 0.26 | -0.75 0.07 | 0.4 | 0.15 0.03 |
2 Observations and data reduction
2.1 PMAS/PPAK Observations
The PPak Integral Field Unit (IFU) consists of an array of 382 fibers arranged in a hexagonal field of view (FoV) of . Observations were carried with both V500 and V1200 gratings, with a resolution of 850 at Å (FWHM Å), and 1650 at 4500 Å (FWHM 2.3 Å), respectively. Following the CALIFA survey observing strategy (Sánchez et al., 2012), the total integration time on each target was 1.5 h (V1200) and 0.75 h (V500). A dithering scheme with three pointings was adopted to cover the complete FoV and to increase the spatial resolution of the data. The two data sets were combined in one single cube (called ”COMBO“), covering the spectral range 3700 7500 Å with the same resolution of the V500 grating (García-Benito et al., 2015; Sánchez et al., 2016b). The spatial sampling is 1′′, with a point spread function (PSF) given by a Moffat function with a full width half maximum (FWHM) of 25 and = 2.
Data reduction was performed using a python pipeline based on an upgraded version of García-Benito et al. (2015) and Sánchez et al. (2016a) and the data cubes were analysed with the spectral synthesis code STARLIGHT and the Python CALIFA Starlight Synthesis organiser (PyCASSO) platform (Cid Fernandes et al., 2013; de Amorim et al., 2017). The spectra were fitted with the base of stellar libraries described in García-Benito et al. (2017). In short, it combines the GRANADA models of González Delgado et al. (2005) for ages younger than 60 Myr and the single stellar population (SSP) models from Vazdekis et al. (2015) based on BaSTi isochrones for older ages, giving a total of 254 SSPs. The range covers eight metallicities, log / = 2.28, 1.79, 1.26, 0.66, 0.35, 0.06, 0.25, and +0.40, while the age is sampled in 37 bins per metallicity varying from 1 Myr to 14 Gyr. The assumed initial mass function (IMF) is Salpeter (1955). Dust effects were modeled using the Cardelli et al. (1989) reddening law with = 3.1.
The best stellar population model for each spectra was subtracted from the original cube to recover information on the distribution of the ionised gas. Line fluxes were measured with the SHERPA IFU line fitting software (SHIFU; García-Benito et al., in prep.), based on the package of CIAO SHERPA (Freeman et al., 2001; Doe et al., 2007). Maps of the H, H, [Nii] 6584, [Oiii] 4959,5007 emission and of the line-of-sight velocity fields were generated. The COMBO cubes reach a S/N 3 per spaxel and spectral pixel at 5600 Å of 2 erg s-1 cm-2 Å-1 arcsec-2. The H maps attain a surface brightness limit of erg s-1 cm-2 arcsec-2 at a 3 level.
2.2 MegaCam observations from the Next Generation Virgo Cluster Survey
The Next Generation Virgo Cluster Survey (NGVCS) is carried out with the MegaCam instrument on the the Canada–France–Hawaii Telescope covering an area of 104 square degrees of the Virgo cluster through 5 optical filters (; Ferrarese et al., 2012). The survey is designed to map the two main substructures surrounding the massive early-type galaxies M87 and M49 (cluster A and B; Binggeli et al., 1987), out to their virial radii. Details about the observation strategy and data reduction procedure can be found in Ferrarese et al. (2012). With a 2 surface brightness limit of 29 mag arcsec-2 (Ferrarese et al., 2016) the NGVCS is the deepest optical survey of the cluster to date. The -band images are the most sensitive and with the least number of CCD artifacts compared to the other filters. The MegaCam archive contains and observations of VCC 135 and VCC 324, respectively. The average seeing is 07 (VCC 0135) and 09 (VCC 324). The pixel size of MegaCam images is 0187.
3 Galaxy sample properties
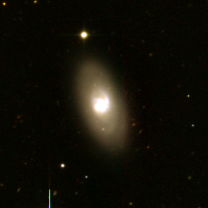
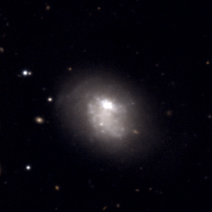
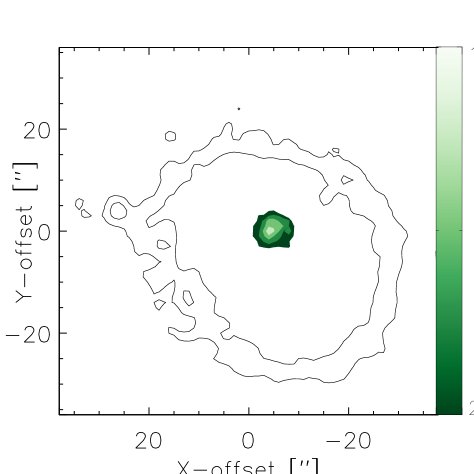
VCC 135. Classified as S pec/blue compact dwarf (BCD), it hosts a nuclear star-forming region
overlaid on a red ( mag) stellar population (Meyer et al., 2014, top-left panel of Fig. 1).
It is an extremely Hi-deficient system111The Hi deficiency parameter is defined as the logarithmic difference between
the observed Hi mass and that expected for an isolated galaxy of the same morphological type:
Def (Giovanardi et al., 1983; Haynes &
Giovanelli, 1984).
(Def; Grossi
et al., 2016), and
the H emission
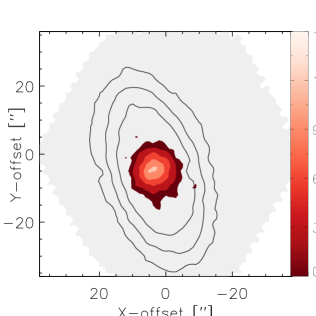
is compact, extending to only 1.5 times the effective radius ( 82; top-central panel of Fig. 1).
The ionised gas is usually more centrally concentrated in Hi-deficient galaxies
(Koopmann &
Kenney, 2004).
VCC 135 has a large radial velocity ( = 2408 km s-1)
compared to the cluster systemic velocity (1149 km s-1; Lisker
et al., 2018). Distances to
Virgo members are highly uncertain: according to Gavazzi et al. (2003) VCC 135 belongs to the M cloud, a substructure behind
the cluster, while Meyer et al. (2014) assume it is at the same distance as cluster A, 17 Mpc.
Using the infall model
of Praton &
Schneider (1994), Kim
et al. (2014) consider VCC 135 a possible Virgo member.
However its radial speed is about 200 km s-1higher than the escape velocity predicted by the model at its
projected distance to the cluster centre.
VCC 324. The galaxy is classified as a BCD (Binggeli et al., 1985; Meyer et al., 2014). The optical image shows a blue compact region superimposed on a lower surface brightness stellar component (Fig. 1, bottom left). The peak of the H emission is located in correspondence of the compact region. Two bright knots are also visible to the south and south-west and appear to be connected by a tail of ionised gas (bottom central panel of Fig. 1). Rosa-González et al. (2007) suggest that the galaxy is dominated by a recent star-forming event that started less than 3.5 Myr ago. VCC 324 is moderately Hi deficient (Def). Hi observations with the Very Large Array (VLA; Lake et al., 1987) show that the atomic gas extends out to about 2 times the optical radius ( 1′) and the outer Hi distribution is elongated to the south-west. The Hi velocity field is not well ordered and it shows only a weak hint of rotation. VCC 324 has a radial velocity km s-1and it is located in the Virgo southern extension, a substructure infalling towards the main cluster, at a projected distance of 5 degs from M49 ( 1.5 Mpc at = 17 Mpc), the centre of cluster B (Binggeli et al., 1987). Meyer et al. (2014) adopt a distance 17 Mpc and according to the infall model of Praton & Schneider (1994) VCC 324 is a possible Virgo member (Kim et al., 2014).
4 Results
4.1 Metallicity maps and gradients
The data products provide spatially resolved information on the stellar population and the distribution of the ionised gas emission lines such as H, H, [O iii]4363, [O iii]5007, [N ii]6548,6584, [S ii]6717,6731. The [O iii] line is detected only in VCC 324 and the emission is concentrated in a very compact region compared to the size of the galaxy (see Fig. 7 and Appendix A). Therefore strong-line ratios provide the only tool to derive oxygen abundances across the galaxy discs. One of the most commonly used calibrations is based on the line ratio N2 [N ii]/H (Denicoló et al., 2002; Pettini & Pagel, 2004). It has the advantage of being independent of reddening and its relation with O/H is single-valued although it saturates in the high-metallicity regime (Nagao et al., 2006). On the other hand, the N2-based calibration suffers from systematic uncertainties due to its dependence on the nitrogen-to-oxygen abundance (objects with high N/O ratios will have higher O/H values than the real ones) and the degeneracy with the ionisation parameter (Pérez-Montero & Contini, 2009; Stasińska, 2010; López-Sánchez et al., 2012). Another popular strong-line calibration is based on the line ratios O3N2 = ([O iii]/H)/([N ii]/H) (Pettini & Pagel, 2004). However [O iii] emission of VCC 135 is even more compact than H, being detected to a radius , difficulting the use of O3N2 to assess the metallicity spatial distribution in this galaxy. Thus, despite the limitations of the N2 parameter, in the rest of this paper we discuss results based on this method that can be more easily applied to both our targets. We adopt the calibration of Marino et al. (2013) to derive the oxygen abundances. In Appendix A we discuss metallicity estimates of VCC 324 obtained with the O3N2 calibration and other diagnostics based on photoionisation models, and we show that our final conclusions are similar to what we infer with the N2 index.
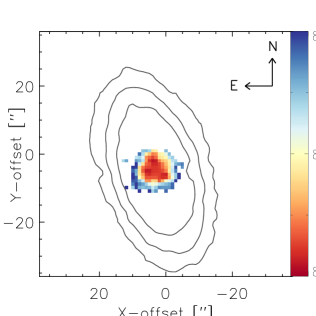
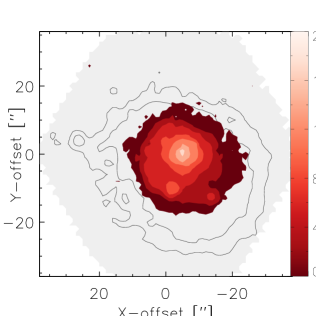
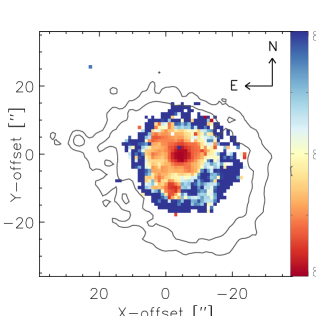
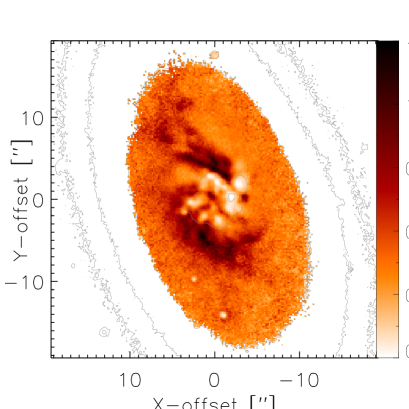
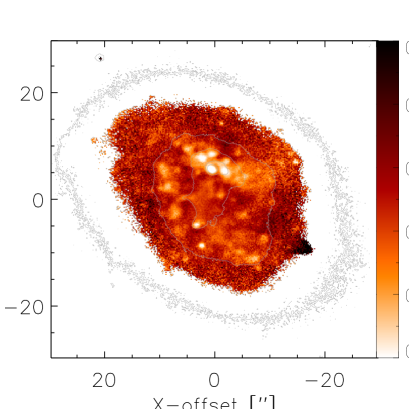
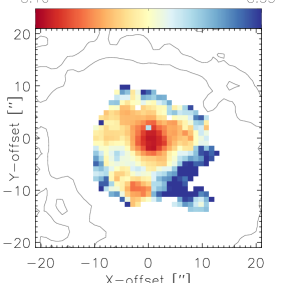
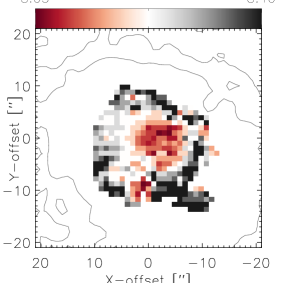
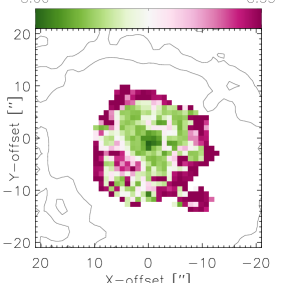
The O/H maps of VCC 135 and VCC 324 are displayed in the right panels of Fig. 1. BPT diagnostic diagrams (Baldwin et al., 1981) for each spaxel where [O iii] was detected, have been checked to ensure that the metallicity was obtained in regions ionised by star formation activity rather than by hot, old stars (Belfiore et al., 2016). Moreover, we required that the oxygen abundance was measured only in spaxels with H equivalent width (EW) larger than 3Å (Cid Fernandes et al., 2011; Lacerda et al., 2018). This additional criterion excludes the outermost pixels where H emission is detected in VCC 135 (Fig. 1, top-central and top-right panels). The maps show that the oxygen abundance of the regions with peak H emission is lower by 0.2 dex compared to the outer part of the discs. An additional metallicity dip can be seen in VCC 324 at about 10′′ to the south with 12 + log(O/H) 8.25 dex, in correspondence of a local enhancement of the H emission. An anticorrelation between the peak of the star formation rate and the oxygen abundance is usually observed in galaxies with metallicity drops in their discs (Cresci et al., 2010; Richards et al., 2014; Lagos et al., 2016; Sánchez Almeida et al., 2018; Ellison et al., 2020) and we discuss in Sect. 5 what are the possible scenarios to explain this trend.
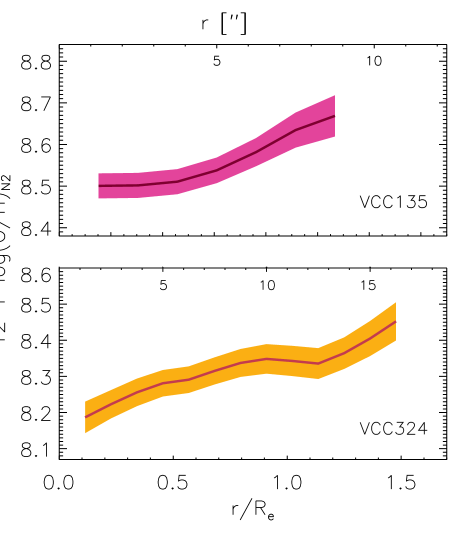
To derive the metallicity gradients, we used the ELLIPSE task within IRAF. We defined a series of elliptical apertures on the H and [N ii] maps with increasing radii taken in steps of 125, so that the sampling is done at separations corresponding to half width of the PSF222 Ideally the width of the annuli should be comparable to the spatial resolution of roughly 25, however we chose this value to obtain a reasonably sampled profile of the abundance of VCC 135 where the ionised gas emitting region is very compact. . Ellipsis axial ratios and position angles (PAs) were inferred from the analysis of the SDSS -band images with ELLIPSE and they are displayed in Tab. 1. The apertures were centred on the peak of the H emission. The uncertainty on the metallicity within each bin takes into account the average errors on the emission-line fluxes along the best-fit isophote as well as the errors on the calibration coefficients (Marino et al., 2013).
Figure 2 shows the metallicity variation as a function of radial distance. Both galaxies display positive gradients with O/H increasing from the main star-forming region outwards. A linear fit provides slopes of 0.20 (0.27) 0.06 and 0.15 (0.16) 0.03 dex/ (dex/kpc) for VCC 135 and VCC 324, respectively. We assumed = 17 Mpc, 82, and 11′′ in the band (Table 1; Kim et al., 2014). As a comparison, dwarf galaxies at show flatter positive radial gradients, with log(O/H) dex/kpc (Wang et al., 2019). Inverted gradients are also detected in a subsample of 20 spiral galaxies in the CALIFA survey with an average flatter slope than our dwarfs, log(O/H) = 0.048 0.033 dex/ (Pérez-Montero et al., 2016).
4.2 Ionised-gas velocity curves
PMAS/PPak observations allow us to extract two-dimensional velocity maps of both the gas and stellar components. Studying the ionised gas kinematics can help inferring evidence of ongoing interaction processes traced by velocity field perturbations or anomalies (Ryś et al., 2014; Barrera-Ballesteros et al., 2015b).
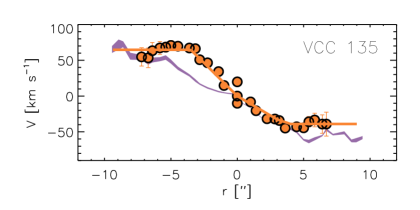
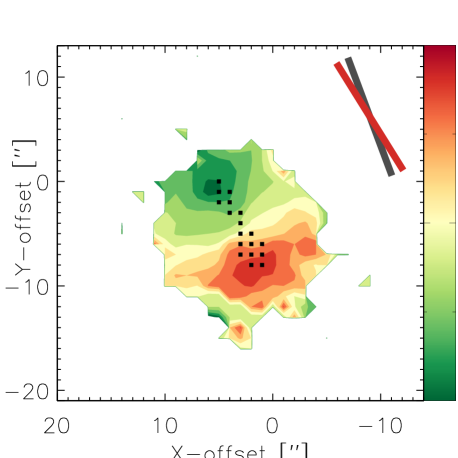
The ionised-gas velocity maps indicate that both galaxies display a velocity gradient (Figs. 3 and 4). To derive the ionised gas rotation curve we followed the method described in García-Lorenzo et al. (2015) applied to galaxies of the CALIFA survey. First we determined the kinematic center (KC) as the spaxel with zero-rotation velocity. We built a distance-velocity diagram for each spaxel with coordinates , , where the distance to the kinematic centre (, ) is defined as , and positive values correspond to increasing values of the right ascension. Then we selected the spaxels with the maximum projected velocity at a given distance to the KC that are expected to trace the kinematic line of nodes (Nicholson et al., 1992). The kinematic axis position angle (PAkin) and the corresponding uncertainty are calculated as the mean and standard deviation of the PAs of the radial distance between the selected spaxels and the KC (see García-Lorenzo et al., 2015, for details).
In VCC 135 the kinematic centre agrees with the position of the optical centre. We obtained PA, and the PAs of the receding and approaching sides are comparable within the errors (black squares in the bottom panel of Fig. 3). The kinematic and photometric axis show a similar alignment with an angular difference of 8∘. The orientation of both axis is displayed in the top-right corner of the VCC 135 velocity map. In the top panel of the Fig. 3 we show the position-velocity diagram of the spaxels included in an artificial slit of width 2′′ (2 spaxels) centred on the KC, and orientation defined by the measured PAkin (Bassett et al., 2017). The gas velocity of VCC 135 rises linearly up to 5′′ where it reaches the maximum. The velocity profile is fitted with a function (i.e. solid-body rotation) for and for , where indicates the transition radius between the two regimes. We obtain a best-fit radius on both sides. The maximum velocity of the receding side km s-1 (76 km s-1, inclination corrected) is higher compared to that of the approaching one, km s-1. Comparison with the stellar velocity map obtained from our data set shows a similar trend with a more symmetric receding and approaching maximum velocities (filled curve).
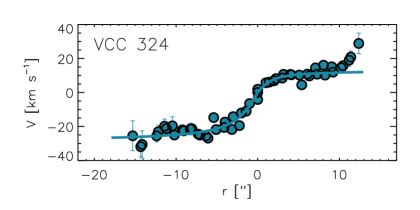
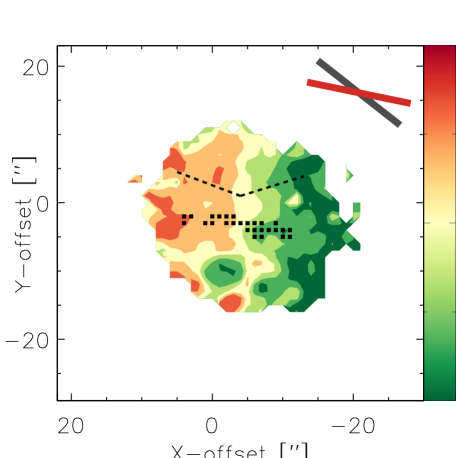
VCC 324 displays a much smoother velocity gradient with a more complex kinematics (Fig. 4, bottom panel). The range in velocities across the system is relatively small, varying between and 20 km s-1, with an almost uniform speed in the receding side hovering around 10 km s-1. At these values possible signatures of rotation become indistinguishable from the random motion of the gaseous component (McGaugh, 2012; McNichols et al., 2016). The southern clump, corresponding to the region with an additional metallicity dip in Fig. 1, appears to be kinematically disjoint from the surrounding gas as it is moving at 20 km s-1. Given the lack of a clear rotation pattern it is difficult to identify an obvious kinematic centre from the map. Nonetheless we apply the method of García-Lorenzo et al. (2015) to attempt to constrain the gas kinematics. If we use as KC the zero-velocity spaxel associated to the centre of symmetry of the ionised gas (KC1), we obtain an average PA as it is highlighted by the black squares in the bottom panel of Fig. 4. This would imply a misalignment of 27 between the kinematic and photometric major axis (see bars at the top-right corner of the velocity map). However, if we select the zero-velocity spaxel in correspondence with the peak of the H emission (KC2), we obtain a very different result, with a large misalignment between the receding and approaching sides (; dashed lines in the same panel). Both alternatives though would imply a kinematically disturbed gas disc. The position-velocity diagram derived in an artificial slit of 2′′ width, centred on KC1, with PA is shown in Fig. 4. The arctan function , where is the maximum velocity rotation and the radius where 50% of is attained, provides a better fit to the receding-side curve compared to the linear model applied to VCC 135. This function has been successfully applied to model rotation curves of local disc galaxies (Courteau, 1997). The best-fit asymptotic velocity is km s-1 ( km s-1after correcting for an inclination 38∘). On the other hand, the receding-side velocity remains almost constant around km s-1 to a radial distance of and then increases in the outermost spaxels.
The stellar velocity map of VCC 324 does not present a clear velocity gradient thus it is not displayed in Fig. 4. As mentioned in Sect. 3, the Hi component also shows weak evidence of rotation (Lake et al., 1987), and single-dish observations of the molecular gas provide a velocity range comparable to the H measurements (Grossi et al., 2016).
The lack of a regularly rotating disc may be due to an interaction or merger that is causing an asymmetry in the gas kinematics as it is observed in other BCDs (Östlin et al., 2001; Ashley et al., 2017; Carvalho & Plana, 2018), thus the disc would still be in the process of settling into a rotation pattern. Moreover, misalignments between the kinematic and photometric major axis of the order of what we find in VCC 324 are usually observed in interacting galaxies (Barrera-Ballesteros et al., 2015b; Ashley et al., 2017). Simulations predict angles of 20∘ in remnants of 3:1 mergers, while misalignments larger than are expected in 1:1 mergers (Jesseit et al., 2007).
4.3 Analysis of optical images
4.3.1 Unsharp masks and colour index maps
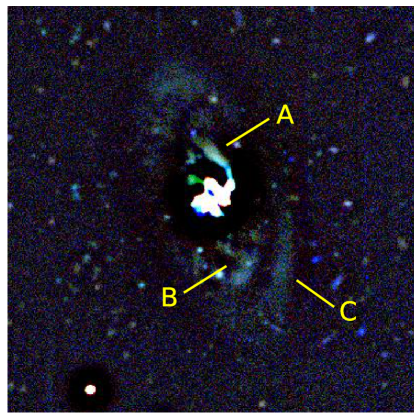
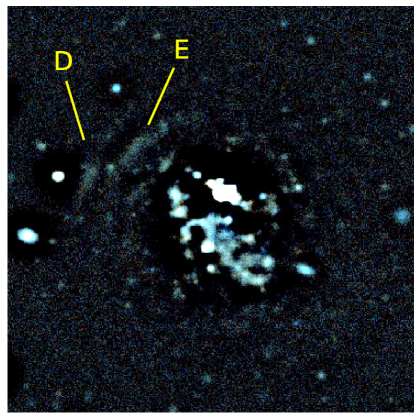
Unsharp masks are a common technique adopted to enhance weak substructures like spiral arms, bars, or stellar streams hidden below the dominant light distribution (Erwin, 2004; Lisker et al., 2006). We produced a set of unsharp masks for each object by smoothing images obtained from the archive of the NGVCS. Images were convolved with a circular gaussian of various kernel sizes, . Small values enhance small structures while large kernel sizes allow the detection of weak large-scale features. For each set of unsharp masks we chose values of = 2, 3, 4, 5, 6, 8, 10, 12 pixels. Figure 5 shows the unsharp masks of VCC 135 (left) and VCC 324 (right) with kernel size 8, and 10, respectively. VCC 135 presents a central blue core where most of the star formation is ongoing, with one plume to the north (feature A) at the edge of the nuclear star-forming region. To the south, an S-shaped structure extends from the blue central region for about 12′′(feature B in Fig. 5). The residual image also shows a ring feature in the outer part of the galaxy (C). We can rule out that these structures are model-dependent artifacts as they also appear in residual images obtained by fitting two Sérsic components to the data with GALFITM (Bamford et al., 2011; Häußler et al., 2013). The unsharp mask of VCC 324 reveals an elongated jellyfish-shaped structure with several star-forming knots, where most of the ongoing star formation is occurring, as also shown by the H emission. A shell structure (labeled with D and E in Fig. 5) is visible to the northwest side of the galaxy. The shells are more clearly detected in the unsharp mask, suggestive of a relatively young stellar population. In both galaxies unsharp masks reveal underlying structure in the stellar discs that appear to trace signature of recent interaction/merging events.
Moreover, we built optical colour-index maps to investigate the spatial distribution of extinction patches associated to dusty regions333The color-index maps were generated dividing the images taken in a blue and a red filter (, for VCC 135, and for VCC 324) after sky subtraction. The seeing of the images in the blue and red filters are very similar, however we convolved the image with the better seeing with a two-dimensional Gaussian function with width equal to the quadrature difference of the two seeing values.. The bottom-left panel of Fig. 5 shows two red plumes ( mag) in VCC 135 extending to the north and to the south of the central star-forming region. The southern plume twist to the west while the norther one extends out to 10′′ (approximately 1 kpc at 17 Mpc) where two further patchy red features are visible. The plumes may hint at a relic structure originated from the tidal disruption of an accreted satellite galaxy. For example, the presence of spiral-shaped or irregular dust morphologies in early-type galaxies has been interpreted as evidence of gas-rich minor mergers (van Dokkum & Franx, 1995; Ferrarese et al., 2006; Yıldız et al., 2020). The map of VCC 324 shows the inner jellyfish-shaped bluer region associated to ongoing star formation. There is not a clear dusty structure as in VCC 135 although darker patchy regions are visible in between the trail of bright clusters and blue associations. In both systems the blue star-forming regions show a different spatial distribution than the outer structure of the galaxy associated to the older stellar populations.
4.3.2 CAS and Gini- diagnostics
As a further test we analysed the -band images of both galaxies with statmorph (Rodriguez-Gomez et al., 2019), a Python package for calculating non-parametric morphological diagnostics such as the Gini coefficient (), the second moment of the brightest pixels of a galaxy containing 20% of the total flux (; Lotz et al., 2004), and the concentration-asymmetry-smoothness system (CAS; see Conselice, 2003, for details). These diagnostics have been extensively applied to quantify galaxy morphologies, also allowing to identify systems with signatures of recent or ongoing mergers. The asymmetry index () is obtained by subtracting the galaxy image rotated by 180∘ from the original one, and dividing the sum of the absolute value of the residuals to the original galaxy’s flux (Abraham et al., 1996). Galaxies with are considered morphologically disturbed and those with are likely to be major-merger remnants (Conselice et al., 2000; Conselice, 2003; De Propris et al., 2007). Originally used in economics to quantify the unequal distribution of wealth in a population, the Gini coefficient is adopted in astronomy to provide a measure of the relative distribution of light within the galaxy image (Abraham et al., 2003). 0 means an equal distribution across all galaxy pixels, while 1 corresponds to extreme inequality where all the light is concentrated within a few pixels. The position of a galaxy in the plane allows us to separate major mergers from non-interacting galaxies (Lotz et al., 2004). Mergers occupy the region of the parametric space defined by the following relation: (Lotz et al., 2008). We ran statmorph on the images and derived the diagnostics discussed above for the two galaxies that we display in Table 2. In VCC 324 the asymmetry index is above the threshold value that defines major-merger candidates, while its places it at the very edge of the region that separates mergers from ”normal“ irregular galaxies in the plane. On the other hand, VCC 135 with and is below the canonical major-merger separation thresholds. However this does not rule out that VCC 135 might have experienced a minor merger event. Hoyos et al. (2012) report that in late minor mergers in which the less massive galaxies have been almost entirely dissolved – as the analysis of VCC 135 images may suggest – the application of these diagnostics is less effective.
| ID | ) | |||||
|---|---|---|---|---|---|---|
| VCC 135 | 3.62 | 0.14 | 0.11 | 0.54 | -2.09 | -0.08 |
| VCC 324 | 2.69 | 0.36 | 0.04 | 0.54 | -1.43 | 0.01 |
5 Discussion
The observed anticorrelation between the metallicity of the gas and the SFR is expected in a scenario where the star-formation process is triggered by metal-poor gas falling onto the disc. Two mechanisms can cause the inflow of metal-poor gas: accretion from the IGM (Ceverino et al., 2016) or galaxy-galaxy interactions/mergers (Rich et al., 2012). Alternatively, intense outflows produced by stellar winds and supernovae (SNe) could eject metals from the central star-forming regions, diluting the heavy-element abundance (Tremonti et al., 2004; Troncoso et al., 2014).
Models of galaxy formation predict that gas accretion from the cosmic web is a primary driver of star formation at early epochs (Dekel et al., 2013), and that at dark matter halo masses of M M⊙ cold gas accretion still occurs in low-density environments and filaments at = 0 (Sancisi et al., 2008; Kereš et al., 2009). Analytical models of Mott et al. (2013) are able to reproduce the observed inverted gradients in high redshift galaxies introducing a high inflow rate of pristine gas towards the inner region of their discs. In the external gas accretion scenario the metallicity of the infalling gas must be much lower than solar (Sánchez Almeida et al., 2016; Sánchez Almeida et al., 2018); the accreted gas would mix in a time-scale of the order of the rotational period, averaging the inverted gradient in a few hundred Myr (Yang & Krumholz, 2012; Petit et al., 2015).
Extended Hi discs with disturbed morphologies and kinematics are thought to be associated with intergalactic gas flows (Sancisi et al., 2008; Kreckel et al., 2011). The VLA map of VCC 324 shows a Hi extension of about 1′ at a column density of 1.5 cm-2 (Lake et al., 1987), typical of late-type dwarfs. It is difficult to confirm or reject the external gas accretion scenario from these data, requiring deeper aperture synthesis observations. High-resolution 21-cm data of VCC 135 are not available in the literature. Accretion of gas from the IGM would be suppressed in a dense environment, however neither galaxy is located in the very central regions of Virgo. Adopting a distance of 17 Mpc, VCC 135 and VCC 324 are at about 1.1 and 1.4 Mpc from M87 (cluster A) and M49 (cluster B), respectively. Both observations and simulation suggest that galaxies in the periphery of clusters ( Mpc) can accrete cool gas from their surroundings. However, at smaller distances to the cluster centre, starvation (1 Mpc 2.4 Mpc) and ram pressure stripping ( Mpc) can inhibit this process (Tonnesen et al., 2007; Yoon et al., 2015).
Mergers and interactions between dwarf galaxies have been proposed to explain the properties of starbursting BCDs (Pustilnik et al., 2001; Bekki, 2008). In this scenario, metal-poor gas from the outskirts of the progenitor discs is brought towards the centre by the interaction with another gas-rich dwarf, similarly to what is found in more massive galaxy mergers (Rich et al., 2012). Ellison et al. (2018, 2020) found that interacting starburst galaxies (M M⊙) present lower central metallicities suggesting that metal-poor gas inflows from mergers can dilute the oxygen abundance. On the other hand, Barrera-Ballesteros et al. (2015a) determined that the central metallicities of interacting systems extracted from the CALIFA survey are comparable to those of a non-interacting control sample, suggesting that stellar feedback could be responsible for enriching the ISM in the center444The apparently contradicting results of the two studies may be due to the different criteria adopted to select the interacting/merging galaxy samples: Barrera-Ballesteros et al. (2015a) included systems at varied stages of interaction (from pre-merger pairs with separations as large as 150 kpc to post-mergers) while Ellison et al. (2018) considered only galaxies above the main sequence with enhanced star formation activity..
Simulations of massive galaxies give evidence that galaxy-galaxy interactions can flatten the metallicity gradient, but it is not clear whether they are capable of inverting it (Sillero et al., 2017; Carton et al., 2018). Central metallicity depressions of the order of 0.2 dex are predicted (Torrey et al., 2012), and such values are in agreement with observations (Rupke et al., 2008; Ellison et al., 2013). Models of low-mass discs interactions show for example that galaxies with stellar masses of M M⊙ and initial nuclear metallicities of 12 + log(O/H) 8.6 could attain 12 + log(O/H) 8.3 or 8.4 in the centre during a merger (Torrey et al., 2012). If low-mass galaxies are on average characterised by flat metallicity gradients (Lagos et al., 2012; Magrini et al., 2017; Belfiore et al., 2017; Gonçalves, 2019) the central depression combined with a flat distribution at larger radii could produce an overall positive trend similarly to what we observe in our targets.
The results that we presented in Sect. 4 seem to support the merger scenario. The lack of a clear rotation gradient and the kinematic axis misalignment in VCC 324 may imply that the galaxy went through a major merger (mass ratio 3:1) as it is also may be suggested by the Asymmetry parameter. Shell-like stellar structures similar to what are found in VCC 324, are associated with intermediate-mass/major mergers (Pop et al., 2018) and they have been observed in both massive (Duc et al., 2015; Kado-Fong et al., 2018) and dwarf galaxies (Paudel et al., 2017; Zhang et al., 2020). For what concerns VCC 135, analysis of the gas kinematics and of the morphology indicators would exclude a major merger. However, the structures that we find in the unsharp masks and colour index maps give hints of an interaction event possibly related to the accretion of a lower-mass satellite. Given the high Hi deficiency of this galaxy it is plausible that most of the detected gas is associated to the accreted object and under this assumption we can estimate an upper limit to the mass of the disrupted dwarf. For a total gas mass M M⊙(including H2 and Hi, Table 1), assuming that the accreted object is gas-rich (Mgas/M; Huang et al., 2012), comparison with VCC 135 stellar mass would imply that the galaxy may have experienced a minor merger event with ratio 1:10.
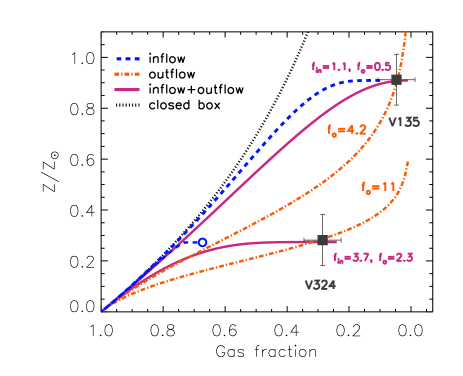
Lastly, outflows due to SN feedback ejecting enriched gas from the inner regions could also produce the observed metallicity trend. This process is found to be effective in galaxies at high redshift (Wang et al., 2019) with log(sSFR/yr = -7.7, well above those observed in our targets (by a factor of 1.8 dex in VCC 324 and 2.8 dex in VCC 135, respectively; see Table 1). To test this possibility, in Fig. 6 we compare the properties of our galaxies with the simple chemical evolution model of Erb (2008). The model has two free parameters: the mass loading factor, SFR, and the mass accretion factor, SFR, where and are the mass-loss and mass-accretion rates, respectively555The model adopts the instant recycling and mixing approximations. The metallicity of the infalling gas is assumed to be zero, while the outflows have the same abundance as the galaxy ISM, and the fraction of gas returned to the ISM by star formation is neglected.. In a pure-outflow scenario high mass loading factors ( 4.2 and 11) would be needed to reproduce the observed gas fraction and metallicities of the two dwarfs (Fig. 6). Observations of nearby starburst dwarfs reveal that there are relatively few strong outflows in low-mass galaxies in the local Universe (Martin, 1999; McQuinn et al., 2019). The measured mass loading factors range between 0.2 and 7 with a weak dependence on stellar mass ( M), and only few objects have above 2. An average 1.2 is expected for a galaxy with stellar mass M M⊙(McQuinn et al., 2019), in agreement with results from hydrodynamical simulations at this mass range (Christensen et al., 2016). Given the relatively low sSFR of our targets and the high mass loading factors required by pure outflow scenarios, it appears unlikely that stellar feedback only is able to cause the observed inverted metallicity gradients.
A pure inflow model with mass-accretion factor = 1.1 (dashed blue line, Fig. 6) or a combination of and a low outflow rate (, solid blue line) appear more favoured in VCC 135. For VCC 324 we find a best-fitting model with and , while a pure inflow scenario with the same (dashed line) is not able to reproduce the observed galaxy properties. This is because the model predicts that in the absence of outflows the gas reservoir cannot be completely exhausted, thus cannot decrease beyond a minimum threshold set by the inflow rate, (empty dot in Fig. 6). Even though outflows may be present in these systems this analysis suggests that they do not dominate the chemical evolution of our targets, that is more likely driven by the infall of low-metallicity gas possibly related to a recent interaction. The lower mass accretion factor obtained for VCC 135 compared to VCC 324 would support our interpretation of a minor- versus major-merger event.
6 Summary and Conclusions
We presented integral field spectroscopy observations of two star-forming dwarf galaxies in the Virgo cluster obtained with PMAS/PPak at the Calar Alto 3.5 meter telescope. We derived metallicity maps using the N2 indicator. The galaxies show inverted metallicity gradients, contrary to what is usually observed in dwarfs or in spiral galaxies. We find gradient slopes of 0.20 0.06 and 0.15 0.03 dex/ for VCC 135 and VCC 324, respectively. The slopes are steeper than what is found in previous studies of local spirals or high- dwarfs with similar positive gradients. We discussed whether such a trend could be caused by inflow of metal-poor gas – accreted from the IGM or in a recent merging event – or to enriched-gas outflows triggered by the star formation activity. Comparison with simple chemical evolution models seem to favour the gas-inflow scenarios. However their location in the outskirts of the Virgo cluster would hinder external gas accretion from the IGM due to the effects of ram-pressure stripping and/or starvation. Analysis of deep optical images and of the ionised gas kinematics suggest that both galaxies may have recently accreted a gas-rich companion. We argue that VCC 324 is the remnant of a major merger, while a minor-merger scenario seems more favoured for VCC 135. The accretion event drove metal-poor gas from the galaxy outskirts to the central regions, causing the inverted metallicity trend across the galaxy discs. Atomic hydrogen maps are needed to investigate the Hi distribution in the two systems in order to further constrain our interpretation of a dwarf-galaxy merging scenario.
Acknowledgements
The authors wish to thank the Calar Alto telescope staff for help and support during the observing runs. We thank the anonymous referee for his/her suggestions and comments that contributed to improve the manuscript. RGB acknowledges support from the Spanish Ministerio de Economía y Competitividad, through project AYA2016-77846-P and by the Spanish Science Ministry "Centro de Excelencia Severo Ochoa Program under grant SEV-2017-0709. PAAL thanks the support of CNPq, grant 309398/2018-5. We acknowledge the usage of MPFIT (Markwardt, 2009) routines. This work is based on observations obtained with MegaPrime/MegaCam, a joint project of CFHT and CEA/ DAPNIA, at the Canada–France–Hawaii Telescope (CFHT), which is operated by the National Research Council (NRC) of Canada, the Institut National des Sciences de l’Univers of the Centre National de la Recherche Scientifique (CNRS) of France, and the University of Hawaii.
Data availability statement
The data underlying this article will be shared on reasonable request to the corresponding author.
References
- Abraham et al. (1996) Abraham R. G., van den Bergh S., Glazebrook K., Ellis R. S., Santiago B. X., Surma P., Griffiths R. E., 1996, ApJS, 107, 1
- Abraham et al. (2003) Abraham R. G., van den Bergh S., Nair P., 2003, ApJ, 588, 218
- Aller (1954) Aller L. H., 1954, ApJ, 120, 401
- Ashley et al. (2017) Ashley T., Simpson C. E., Elmegreen B. G., Johnson M., Pokhrel N. R., 2017, AJ, 153, 132
- Asplund et al. (2009) Asplund M., Grevesse N., Sauval A. J., Scott P., 2009, ARA&A, 47, 481
- Auld et al. (2013) Auld R., et al., 2013, MNRAS, 428, 1880
- Baldwin et al. (1981) Baldwin J. A., Phillips M. M., Terlevich R., 1981, PASP, 93, 5
- Bamford et al. (2011) Bamford S. P., Häußler B., Rojas A., Borch A., 2011, Measuring the Physical Properties of Galaxy Components Using Modern Surveys. p. 479
- Barrera-Ballesteros et al. (2015a) Barrera-Ballesteros J. K., et al., 2015a, A&A, 579, A45
- Barrera-Ballesteros et al. (2015b) Barrera-Ballesteros J. K., et al., 2015b, A&A, 582, A21
- Barrera-Ballesteros et al. (2016) Barrera-Ballesteros J. K., et al., 2016, MNRAS, 463, 2513
- Bassett et al. (2017) Bassett R., et al., 2017, MNRAS, 470, 1991
- Bekki (2008) Bekki K., 2008, MNRAS, 388, L10
- Belfiore et al. (2016) Belfiore F., et al., 2016, MNRAS, 461, 3111
- Belfiore et al. (2017) Belfiore F., et al., 2017, MNRAS, 469, 151
- Binggeli et al. (1985) Binggeli B., Sandage A., Tammann G. A., 1985, AJ, 90, 1681
- Binggeli et al. (1987) Binggeli B., Tammann G. A., Sandage A., 1987, AJ, 94, 251
- Blanc et al. (2015) Blanc G. A., Kewley L., Vogt F. P. A., Dopita M. A., 2015, ApJ, 798, 99
- Bundy et al. (2015) Bundy K., et al., 2015, ApJ, 798, 7
- Cardelli et al. (1989) Cardelli J. A., Clayton G. C., Mathis J. S., 1989, ApJ, 345, 245
- Carton et al. (2018) Carton D., et al., 2018, MNRAS, 478, 4293
- Carvalho & Plana (2018) Carvalho M. S., Plana H., 2018, MNRAS, 481, 122
- Ceverino et al. (2016) Ceverino D., Sánchez Almeida J., Muñoz Tuñón C., Dekel A., Elmegreen B. G., Elmegreen D. M., Primack J., 2016, MNRAS, 457, 2605
- Chabrier (2003) Chabrier G., 2003, PASP, 115, 763
- Chiappini et al. (2001) Chiappini C., Matteucci F., Romano D., 2001, ApJ, 554, 1044
- Christensen et al. (2016) Christensen C. R., Davé R., Governato F., Pontzen A., Brooks A., Munshi F., Quinn T., Wadsley J., 2016, ApJ, 824, 57
- Cid Fernandes et al. (2011) Cid Fernandes R., Stasińska G., Mateus A., Vale Asari N., 2011, MNRAS, 413, 1687
- Cid Fernandes et al. (2013) Cid Fernandes R., et al., 2013, A&A, 557, A86
- Conselice (2003) Conselice C. J., 2003, ApJS, 147, 1
- Conselice et al. (2000) Conselice C. J., Bershady M. A., Jangren A., 2000, ApJ, 529, 886
- Courteau (1997) Courteau S., 1997, AJ, 114, 2402
- Cresci et al. (2010) Cresci G., Mannucci F., Maiolino R., Marconi A., Gnerucci A., Magrini L., 2010, Nature, 467, 811
- Croom et al. (2012) Croom S. M., et al., 2012, MNRAS, 421, 872
- De Propris et al. (2007) De Propris R., Conselice C. J., Liske J., Driver S. P., Patton D. R., Graham A. W., Allen P. D., 2007, ApJ, 666, 212
- Dekel et al. (2013) Dekel A., Zolotov A., Tweed D., Cacciato M., Ceverino D., Primack J. R., 2013, MNRAS, 435, 999
- Denicoló et al. (2002) Denicoló G., Terlevich R., Terlevich E., 2002, MNRAS, 330, 69
- Dinerstein (1990) Dinerstein H. L., 1990, Abundances in extragalactic H II regions. pp 257–285, doi:10.1007/978-94-009-0595-5_10
- Doe et al. (2007) Doe S., et al., 2007, Developing Sherpa with Python. p. 543
- Dopita et al. (2013) Dopita M. A., Sutherland R. S., Nicholls D. C., Kewley L. J., Vogt F. P. A., 2013, ApJS, 208, 10
- Duc et al. (2015) Duc P.-A., et al., 2015, MNRAS, 446, 120
- Ellison et al. (2013) Ellison S. L., Mendel J. T., Patton D. R., Scudder J. M., 2013, MNRAS, 435, 3627
- Ellison et al. (2018) Ellison S. L., Sánchez S. F., Ibarra-Medel H., Antonio B., Mendel J. T., Barrera-Ballesteros J., 2018, MNRAS, 474, 2039
- Ellison et al. (2020) Ellison S. L., Thorp M. D., Pan H.-A., Lin L., Scudder J. M., Bluck A. F. L., Sánchez S. F., Sargent M., 2020, MNRAS, 492, 6027
- Erb (2008) Erb D. K., 2008, ApJ, 674, 151
- Erwin (2004) Erwin P., 2004, A&A, 415, 941
- Ferland et al. (2013) Ferland G. J., et al., 2013, Rev. Mex. Astron. Astrofis., 49, 137
- Ferrarese et al. (2006) Ferrarese L., et al., 2006, ApJS, 164, 334
- Ferrarese et al. (2012) Ferrarese L., et al., 2012, ApJS, 200, 4
- Ferrarese et al. (2016) Ferrarese L., et al., 2016, ApJ, 824, 10
- Freeman et al. (2001) Freeman P., Doe S., Siemiginowska A., 2001, Sherpa: a mission-independent data analysis application. pp 76–87, doi:10.1117/12.447161
- Galbany et al. (2016) Galbany L., et al., 2016, MNRAS, 455, 4087
- García-Benito et al. (2015) García-Benito R., et al., 2015, A&A, 576, A135
- García-Benito et al. (2017) García-Benito R., et al., 2017, A&A, 608, A27
- García-Lorenzo et al. (2015) García-Lorenzo B., et al., 2015, A&A, 573, A59
- Garnett (1992) Garnett D. R., 1992, AJ, 103, 1330
- Gavazzi et al. (2003) Gavazzi G., Boselli A., Donati A., Franzetti P., Scodeggio M., 2003, A&A, 400, 451
- Gavazzi et al. (2013) Gavazzi G., et al., 2013, A&A, 553, A90
- Giovanardi et al. (1983) Giovanardi C., Helou G., Salpeter E. E., Krumm N., 1983, ApJ, 267, 35
- Gonçalves (2019) Gonçalves D. R., 2019, in McQuinn K. B. W., Stierwalt S., eds, IAU Symposium Vol. 344, Dwarf Galaxies: From the Deep Universe to the Present. pp 161–177 (arXiv:1902.04291), doi:10.1017/S1743921318007408
- González Delgado et al. (2005) González Delgado R. M., Cerviño M., Martins L. P., Leitherer C., Hauschildt P. H., 2005, MNRAS, 357, 945
- Grossi et al. (2015) Grossi M., et al., 2015, A&A, 574, A126
- Grossi et al. (2016) Grossi M., et al., 2016, A&A, 590, A27
- Häußler et al. (2013) Häußler B., et al., 2013, MNRAS, 430, 330
- Haynes & Giovanelli (1984) Haynes M. P., Giovanelli R., 1984, AJ, 89, 758
- Ho et al. (2015) Ho I. T., Kudritzki R.-P., Kewley L. J., Zahid H. J., Dopita M. A., Bresolin F., Rupke D. S. N., 2015, MNRAS, 448, 2030
- Hoyos et al. (2012) Hoyos C., et al., 2012, MNRAS, 419, 2703
- Huang et al. (2012) Huang S., Haynes M. P., Giovanelli R., Brinchmann J., 2012, ApJ, 756, 113
- Jesseit et al. (2007) Jesseit R., Naab T., Peletier R. F., Burkert A., 2007, MNRAS, 376, 997
- Kado-Fong et al. (2018) Kado-Fong E., et al., 2018, ApJ, 866, 103
- Kelz et al. (2006) Kelz A., et al., 2006, PASP, 118, 129
- Kereš et al. (2009) Kereš D., Katz N., Fardal M., Davé R., Weinberg D. H., 2009, MNRAS, 395, 160
- Kewley & Dopita (2002) Kewley L. J., Dopita M. A., 2002, ApJS, 142, 35
- Kewley et al. (2001) Kewley L. J., Dopita M. A., Sutherland R. S., Heisler C. A., Trevena J., 2001, ApJ, 556, 121
- Kim et al. (2014) Kim S., et al., 2014, ApJS, 215, 22
- Koopmann & Kenney (2004) Koopmann R. A., Kenney J. D. P., 2004, ApJ, 613, 866
- Kreckel et al. (2011) Kreckel K., et al., 2011, AJ, 141, 4
- Lacerda et al. (2018) Lacerda E. A. D., et al., 2018, MNRAS, 474, 3727
- Lagos et al. (2012) Lagos P., Telles E., Nigoche Netro A., Carrasco E. R., 2012, MNRAS, 427, 740
- Lagos et al. (2016) Lagos P., Demarco R., Papaderos P., Telles E., Nigoche-Netro A., Humphrey A., Roche N., Gomes J. M., 2016, MNRAS, 456, 1549
- Lagos et al. (2018) Lagos P., Scott T. C., Nigoche-Netro A., Demarco R., Humphrey A., Papaderos P., 2018, MNRAS, 477, 392
- Lake et al. (1987) Lake G., Schommer R. A., van Gorkom J. H., 1987, ApJ, 314, 57
- Leitherer et al. (1999) Leitherer C., et al., 1999, ApJS, 123, 3
- Lequeux et al. (1979) Lequeux J., Peimbert M., Rayo J. F., Serrano A., Torres-Peimbert S., 1979, A&A, 500, 145
- Levesque et al. (2010) Levesque E. M., Kewley L. J., Larson K. L., 2010, AJ, 139, 712
- Lilly et al. (2013) Lilly S. J., Carollo C. M., Pipino A., Renzini A., Peng Y., 2013, ApJ, 772, 119
- Lisker et al. (2006) Lisker T., Grebel E. K., Binggeli B., 2006, AJ, 132, 497
- Lisker et al. (2018) Lisker T., Vijayaraghavan R., Janz J., Gallagher John S. I., Engler C., Urich L., 2018, ApJ, 865, 40
- López-Sánchez et al. (2012) López-Sánchez Á. R., Dopita M. A., Kewley L. J., Zahid H. J., Nicholls D. C., Scharwächter J., 2012, MNRAS, 426, 2630
- Lotz et al. (2004) Lotz J. M., Primack J., Madau P., 2004, AJ, 128, 163
- Lotz et al. (2008) Lotz J. M., Jonsson P., Cox T. J., Primack J. R., 2008, MNRAS, 391, 1137
- Magrini et al. (2017) Magrini L., Gonçalves D. R., Vajgel B., 2017, MNRAS, 464, 739
- Mannucci et al. (2010) Mannucci F., Cresci G., Maiolino R., Marconi A., Gnerucci A., 2010, MNRAS, 408, 2115
- Marino et al. (2013) Marino R. A., et al., 2013, A&A, 559, A114
- Markwardt (2009) Markwardt C. B., 2009, Non-linear Least-squares Fitting in IDL with MPFIT. p. 251
- Martin (1999) Martin C. L., 1999, ApJ, 513, 156
- McGaugh (2012) McGaugh S. S., 2012, AJ, 143, 40
- McNichols et al. (2016) McNichols A. T., et al., 2016, ApJ, 832, 89
- McQuinn et al. (2019) McQuinn K. B. W., van Zee L., Skillman E. D., 2019, ApJ, 886, 74
- Meyer et al. (2014) Meyer H. T., Lisker T., Janz J., Papaderos P., 2014, A&A, 562, A49
- Mollá et al. (2009) Mollá M., García-Vargas M. L., Bressan A., 2009, MNRAS, 398, 451
- Morales-Luis et al. (2011) Morales-Luis A. B., Sánchez Almeida J., Aguerri J. A. L., Muñoz-Tuñón C., 2011, ApJ, 743, 77
- Morales-Luis et al. (2014) Morales-Luis A. B., Pérez-Montero E., Sánchez Almeida J., Muñoz-Tuñón C., 2014, ApJ, 797, 81
- Mott et al. (2013) Mott A., Spitoni E., Matteucci F., 2013, MNRAS, 435, 2918
- Nagao et al. (2006) Nagao T., Maiolino R., Marconi A., 2006, A&A, 459, 85
- Nicholson et al. (1992) Nicholson R. A., Bland-Hawthorn J., Taylor K., 1992, ApJ, 387, 503
- Osterbrock & Ferland (2006) Osterbrock D. E., Ferland G. J., 2006, Astrophysics of gaseous nebulae and active galactic nuclei
- Östlin et al. (2001) Östlin G., Amram P., Bergvall N., Masegosa J., Boulesteix J., Márquez I., 2001, A&A, 374, 800
- Pagel & Edmunds (1981) Pagel B. E. J., Edmunds M. G., 1981, ARA&A, 19, 77
- Paudel et al. (2017) Paudel S., et al., 2017, ApJ, 834, 66
- Peng & Maiolino (2014a) Peng Y.-j., Maiolino R., 2014a, MNRAS, 438, 262
- Peng & Maiolino (2014b) Peng Y.-j., Maiolino R., 2014b, MNRAS, 443, 3643
- Pérez-Montero (2014) Pérez-Montero E., 2014, MNRAS, 441, 2663
- Pérez-Montero & Contini (2009) Pérez-Montero E., Contini T., 2009, MNRAS, 398, 949
- Pérez-Montero et al. (2016) Pérez-Montero E., et al., 2016, A&A, 595, A62
- Petit et al. (2015) Petit A. C., Krumholz M. R., Goldbaum N. J., Forbes J. C., 2015, MNRAS, 449, 2588
- Pettini & Pagel (2004) Pettini M., Pagel B. E. J., 2004, MNRAS, 348, L59
- Pop et al. (2018) Pop A.-R., Pillepich A., Amorisco N. C., Hernquist L., 2018, MNRAS, 480, 1715
- Praton & Schneider (1994) Praton E. A., Schneider S. E., 1994, ApJ, 422, 46
- Pustilnik et al. (2001) Pustilnik S. A., Kniazev A. Y., Lipovetsky V. A., Ugryumov A. V., 2001, A&A, 373, 24
- Queyrel et al. (2012) Queyrel J., et al., 2012, A&A, 539, A93
- Rich et al. (2012) Rich J. A., Torrey P., Kewley L. J., Dopita M. A., Rupke D. S. N., 2012, ApJ, 753, 5
- Richards et al. (2014) Richards S. N., et al., 2014, MNRAS, 445, 1104
- Rodriguez-Gomez et al. (2019) Rodriguez-Gomez V., et al., 2019, MNRAS, 483, 4140
- Rosa-González et al. (2007) Rosa-González D., Schmitt H. R., Terlevich E., Terlevich R., 2007, ApJ, 654, 226
- Roth et al. (2005) Roth M. M., et al., 2005, PASP, 117, 620
- Rupke et al. (2008) Rupke D. S. N., Veilleux S., Baker A. J., 2008, ApJ, 674, 172
- Ryś et al. (2014) Ryś A., van de Ven G., Falcón-Barroso J., 2014, MNRAS, 439, 284
- Salpeter (1955) Salpeter E. E., 1955, ApJ, 121, 161
- Sánchez (2020) Sánchez S. F., 2020, ARA&A, 58, annurev
- Sánchez Almeida et al. (2014) Sánchez Almeida J., Morales-Luis A. B., Muñoz-Tuñón C., Elmegreen D. M., Elmegreen B. G., Méndez-Abreu J., 2014, ApJ, 783, 45
- Sánchez Almeida et al. (2015) Sánchez Almeida J., et al., 2015, ApJ, 810, L15
- Sánchez Almeida et al. (2016) Sánchez Almeida J., Pérez-Montero E., Morales-Luis A. B., Muñoz-Tuñón C., García-Benito R., Nuza S. E., Kitaura F. S., 2016, ApJ, 819, 110
- Sánchez Almeida et al. (2017) Sánchez Almeida J., Filho M. E., Dalla Vecchia C., Skillman E. D., 2017, ApJ, 835, 159
- Sánchez Almeida et al. (2018) Sánchez Almeida J., Caon N., Muñoz-Tuñón C., Filho M., Cerviño M., 2018, MNRAS, 476, 4765
- Sánchez-Menguiano et al. (2016) Sánchez-Menguiano L., et al., 2016, A&A, 587, A70
- Sánchez-Menguiano et al. (2018) Sánchez-Menguiano L., et al., 2018, A&A, 609, A119
- Sánchez et al. (2012) Sánchez S. F., et al., 2012, A&A, 538, A8
- Sánchez et al. (2014) Sánchez S. F., et al., 2014, A&A, 563, A49
- Sánchez et al. (2016a) Sánchez S. F., et al., 2016a, Rev. Mex. Astron. Astrofis., 52, 21
- Sánchez et al. (2016b) Sánchez S. F., et al., 2016b, A&A, 594, A36
- Sancisi et al. (2008) Sancisi R., Fraternali F., Oosterloo T., van der Hulst T., 2008, A&ARv, 15, 189
- Searle (1971) Searle L., 1971, ApJ, 168, 327
- Sillero et al. (2017) Sillero E., Tissera P. B., Lambas D. G., Michel-Dansac L., 2017, MNRAS, 472, 4404
- Stasińska (2010) Stasińska G., 2010, in Bruzual G. R., Charlot S., eds, IAU Symposium Vol. 262, Stellar Populations - Planning for the Next Decade. pp 93–96 (arXiv:0910.0175), doi:10.1017/S1743921310002590
- Tonnesen et al. (2007) Tonnesen S., Bryan G. L., van Gorkom J. H., 2007, ApJ, 671, 1434
- Torrey et al. (2012) Torrey P., Cox T. J., Kewley L., Hernquist L., 2012, ApJ, 746, 108
- Tremonti et al. (2004) Tremonti C. A., et al., 2004, ApJ, 613, 898
- Troncoso et al. (2014) Troncoso P., et al., 2014, A&A, 563, A58
- Vazdekis et al. (2015) Vazdekis A., et al., 2015, MNRAS, 449, 1177
- Wang et al. (2019) Wang X., et al., 2019, ApJ, 882, 94
- Yang & Krumholz (2012) Yang C.-C., Krumholz M., 2012, ApJ, 758, 48
- Yates et al. (2020) Yates R. M., Schady P., Chen T. W., Schweyer T., Wiseman P., 2020, A&A, 634, A107
- Yıldız et al. (2020) Yıldız M. K., Peletier R. F., Duc P. A., Serra P., 2020, arXiv e-prints, p. arXiv:2001.08087
- Yoon et al. (2015) Yoon H., Chung A., Sengupta C., Wong O. I., Bureau M., Rey S.-C., van Gorkom J. H., 2015, Publication of Korean Astronomical Society, 30, 495
- Zhang et al. (2020) Zhang H.-X., et al., 2020, ApJ, 891, L23
- de Amorim et al. (2017) de Amorim A. L., et al., 2017, MNRAS, 471, 3727
- van Dokkum & Franx (1995) van Dokkum P. G., Franx M., 1995, AJ, 110, 2027
- van Zee et al. (1998) van Zee L., Salzer J. J., Haynes M. P., O’Donoghue A. A., Balonek T. J., 1998, AJ, 116, 2805
Appendix A Alternative estimates of the oxygen abundance of VCC 324
In this section we discuss alternative methods to determine the gas-phase metallicity. As mentioned in Sect. 4.1 the N2 ratio depends on physical parameters of a nebula other than the metallicity. Therefore variations of the N2 index could be correlated, for example, to changes in the ionisation parameter666The ionisation parameter, defined as the ratio of ionising photon density to hydrogen density, is sometimes defined in the literature in the dimensionless form where is the speed of light. () instead of metal abundance (López-Sánchez et al., 2012; Morales-Luis et al., 2014). On the other hand, Sánchez Almeida et al. (2018) showed that the observed anticorrelation between N2-based metallicities and SFR in a sample of star-forming dwarfs still holds when O/H is calculated with photoionisation models that take into account the variation of the physical properties of a nebula. It is thus important to test whether different metallicity estimates can reproduce the results that we derived with the N2 calibrator.
An alternative way to determine O/H is provided by the direct method (Aller, 1954; Dinerstein, 1990; Osterbrock & Ferland, 2006), based on the detection of the auroral line [Oiii]4363 that allows to measure the electron temperature ([Oiii]). Assuming a two-zone approximation (Garnett, 1992), the electron temperature ([Oii]) in the O+ zone is measured from weak auroral lines such as [Oii]7320,7330, or it is calculated from ([Oiii]) through a relation derived from photoionisation models (Garnett, 1992; Pérez-Montero, 2014). The metallicity is then obtained from the relations linking the oxygen ionic abundances (O+/H, O++/H) to the corresponding electron temperatures and observed emission-line ratios (Osterbrock & Ferland, 2006). However, auroral lines are intrinsically faint and thus more difficult to observe. In VCC 324 [Oiii]4363 is detected above 3 only in a very small region (; Fig. 7), and [Oii]7320,7330 is observed in an even more compact area, smaller by a factor of two. The reduced extension of [Oiii]4363 emission compared to the size of the galaxy, its relatively low S/N ratio (only a few spaxels have S/N 10), the lack of the auroral lines that allows to more accurately determine ([Oii]) and the O+ abundance (Yates et al., 2020), hamper the application of this method.
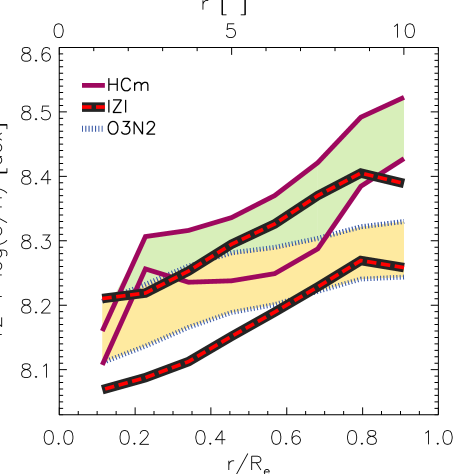
Therefore, here we test another widely-used empirical calibrators, O3N2 (see Sect. 4.1), and metallicity diagnostics based on photoionisation models: i) Inferring metallicities () and Ionisation parameters (IZI777https://users.obs.carnegiescience.edu/gblancm/izi/; Blanc et al., 2015); ii) Hii-CHI-MISTRY888https://www.iaa.csic.es/~epm/HII-CHI-mistry-opt.html (HCm, v4.1; Pérez-Montero, 2014). The comparison is only performed for VCC 324 because it is the target where line emissions cover a larger fraction of the galaxy disc, allowing to better investigate the spatial variation of the metallicity.
The O3N2 map is displayed in the left panel of Fig. 8. In the figure we are showing a smaller region compared to Fig. 1 to ensure that we are analysing only spaxels where the observed strong-line fluxes have S/N 10. The map presents a similar range of O/H and spatial trend to N2. However this could be due to the fact that O3N2 is also sensitive to both metallicity and ionisation parameter (Kewley & Dopita, 2002; Stasińska, 2010).
IZI provides a method to determine the physical properties of a nebula from strong emission lines without using a specific metallicity indicator. The tool applies Bayesian inference to calculate the joint and marginalised probability density function (PDF) of the oxygen abundance (and ) for a given combination of observed lines, comparing simultaneously all the available line ratios to the predictions of three different sets of photoionisation models (Kewley et al., 2001; Levesque et al., 2010; Dopita et al., 2013). A uniform maximum ignorance prior in and is assumed. The procedure allows to include different strong emission lines as input, and we used the following set tested in Blanc et al. (2015): [Oii]3727,3729, H, [Oiii]5007, H, [Nii]6548,6584, [S ii]6717,6731. Line fluxes were corrected for extinction using the Balmer decrement assuming case B recombination and applying a Cardelli et al. (1989) galactic extinction law. The IZI output, shown in the central panel of Fig. 8, was obtained using the Kewley et al. (2001) grids with 12 + log(O/H)⊙ = 8.69 (Asplund et al., 2009); qualitatively similar results are found with the other photoionisation models implemented in the procedure. In this case, the input ionising spectrum is computed with STARBURST99 (Leitherer et al., 1999) assuming a Salpeter (1955) initial mass function (IMF) and an age of 8 Myr for the stellar population. The IZI output provides a measure of the metallicity which is consistent with O3N2 and N2, displaying a central dip and an abundance increase with radius.
HCm determines chemical abundances (O/H, N/O) and the ionisation parameter performing a minimization procedure between the observed line fluxes and the predictions of a grid of models calculated with CLOUDY (v17.00; Ferland et al., 2013). The ionising radiation field is simulated with the POPSTAR code (Mollá et al., 2009) assuming a starburst age of 1 Myr and a Chabrier (2003) IMF. The procedure first determines the N/O ratio using strong lines such as [Nii]6584/[Oii]3727 and [Nii]6584/[S ii](6717 + 6731). Once N/O is constrained, the oxygen abundance and the ionisation parameters are determined in a new iteration using other combinations of the available line ratios (see Pérez-Montero, 2014, for details). When the [Oiii]4363 line is lacking an empirical relation between O/H and is assumed. HCm allows to use the same set of line fluxes as IZI with the inclusion of [Ne iii]3869 and [Oiii]4363, if detected. We ran HCm with [Ne iii]3869 among the list of observables and its output is displayed in the right panel of Fig. 8. Including [Ne iii] results in a smoother increase of the metallicity with radius from 12 + log(O/H) 8.1 to 8.5 dex. Compared to the other methods HCm measures a higher abundance at the edge of the displayed region. The advantage of this procedure is that it allows to derive chemical abundances that are consistent with the direct method (Pérez-Montero, 2014).
Lastly, in Fig. 9 we plot the oxygen abundance gradients derived with the three methods. IZI and the O3N2 calibrator provide very similar radial variations of O/H, while HCm derives a steeper gradient. Overall the outputs of the different diagnostics are comparable within the uncertainties, and they all lead to the same conclusion that we illustrated in Sect. 4.1. In the lack of applicability of the direct method, all the diagnostics that we tested are consistent with the presence of an inverted abundance gradient in VCC 324.