Real-time observation of ligand-induced allosteric transitions in a PDZ domain
Abstract
While allostery is of paramount importance for protein regulation, the underlying dynamical process of ligand (un)binding at one site, resulting time evolution of the protein structure, and change of the binding affinity at a remote site is not well understood. Here the ligand-induced conformational transition in a widely studied model system of allostery, the PDZ2 domain, is investigated by transient infrared spectroscopy accompanied by molecular dynamics simulations. To this end, an azobenzene derived photoswitch is linked to a peptide ligand in a way that its binding affinity to the PDZ2 domain changes upon switching, thus initiating an allosteric transition in the PDZ2 domain protein. The subsequent response of the protein, covering four decades of time ranging from 1 ns to 10 s, can be rationalized by a remodelling of its rugged free energy landscape, with very subtle shifts in the populations of a small number of structurally well defined states. It is proposed that structurally and dynamically driven allostery, often discussed as limiting scenarios of allosteric communication, actually go hand-in-hand, allowing the protein to adapt its free energy landscape to incoming signals.
Introduction
Allostery represents the coupling of two sites in a protein or a protein complex, where the binding of a ligand to the distal site modifies the affinity at the active site.Wodak2019 Since biological function is intimately related to protein structure, ligand-induced changes of the protein’s function (e.g., the transition from an inactive to an active state) are often associated with a change of the protein’s mean structure.Changeux2012 On the other hand, ligand (un)binding may also alter the protein’s flexibility, which changes the variance of the structure and gives an entropic contribution to the free energy.Cooper84 Referring to the associated change of the structural fluctuations, the latter scenario, termed “dynamic allostery,” has been invoked to explain apparent absence of conformational change upon ligand (un)binding. Cooper84 ; Fuentes06 ; Bahar07 ; Petit09 ; McLeish13 ; Nussinov15 ; Guo16 ; Thirumalai19 Studying the effects of dynamic allostery has been mainly done by NMR spectroscopyPalmer2004 ; Mittermaier2006 ; Bourgeois2005 which, however, only accounts for equilibrium dynamics.
While both models, structural change vs. dynamic change, may appear plausible, the nature of the “allosteric signal” is not known. A stringent examination ultimately requires us to study the genesis of allostery. This includes three steps: (1) The (un)binding of a ligand (usually initiated by a change of its concentrationDeupi10 ) causes (2) the atoms of the protein to undergo a non-equilibrium time evolution, which (3) eventually leads to a change of the binding affinity at a remote site of the protein. This so-called “allosteric transition” is a non-equilibrium process and has been observed directly only rarely, in part because the smallness of the structural changes makes the transition pathways challenging to observe experimentally,Brueschweiler09 and also because of the time-scale limitations of molecular dynamics (MD) simulations.Hyeon05 ; Pontiggia15 ; Smith16 In this work, we outline an approach to study the first two steps, i.e., the ligand-induced allosteric transition, employing a PDZ2 domain as model system.
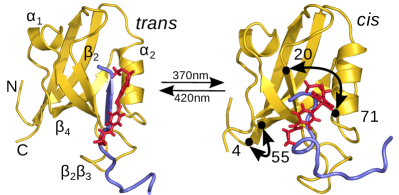
Known for their modest conformational change upon ligand binding, PDZ domains are considered as prime examples of dynamic allostery.fuentes2004 ; Fuentes06 ; Petit09 PDZ domain-mediated interactions play a pivotal role in many signal transduction complexes.Kim2004 ; Sheng2001 Allosteric information flow in PDZ domains is thought to be transduced via conserved allosteric networks in the protein.lockless99 ; Fuentes06 ; Law2009 ; Kong09 ; reynolds2011 The system considered here is the PDZ2 domain from hPTP1E (human tyrosine phosphatase 1E) and a RA-GEF-2 peptide derivative (Ras/Rap1 associating guanidine nucleotide exchange factor 2)kozlov02 with an azobenzene moiety linked as photoswitch,zhang03 see Fig. 1. It was recently reported for a very similar system that the phosphorylation of the serine (-2) residue, a common target in regulatory processes of PDZ domains,Cao1999 leads to a 5 – 7-fold difference in the affinity towards the PDZ2 domain.Toto2017 We will see that the binding affinity can be perturbed to the same extent (5 fold) by introducing such a photoswitchable element on the ligand instead. Since the PDZ2 domain is not modified at all, this strategy leads to a much less artificial construct than obtained in our previous study,Buchli13 where the photoswitch was covalently linked across the binding pocket of the PDZ2 domain. In addition, using the ligand as a trigger, one can apply this strategy to virtually any system.
By photo-isomerizing the azobenzene moiety, we change the binding affinity of the ligand at a precisely defined point in time. We employ time-resolved vibrational spectroscopy in connection with a isotope labeling strategy to monitor the structural change of the protein in real time, and perform extensive (more than 0.5 ms aggregate simulation time) all-atom non-equilibrium MD simulations combined with Markov modeling to interpret the experimental results in terms of the structural evolution of the system. We find that the mean structural change of the protein is rather small. Yet, in both experiment and MD simulations the free energy surface of the protein can be characterized by a small number of metastable conformational states. In agreement with the view of allostery as an interconversion between the relative population of metastable states, we see how the ligand-induced response of the PDZ2 domain is best described as remodelling of the free energy landscape,Frauenfelder91 ; Dill97 ; smock2009 ; Tsai2014 ; Hilser2012 and how the response is transduced from the ligand to the protein without introducing a significant structural change.

Results
Experimental
To set the stage, we have investigated the influence of photoswitching of the ligand on its binding affinity. By choosing the spacing between the anchoring points of the azobenzene moiety, the peptide ligand was designed such that the longer trans conformation mimics the native extended -strand conformation, while the cis configuration shortens the peptide and perturbs it from its extended form. To that end, the alanine residue at position -1 (the ligand is labelled by negative numbers) was chosen as the first anchoring spot for the photoswitch, since it has been shown that a mutation at this position does not significantly affect the binding, while residues that are crucial for binding (Val(0), Ser(-2) and Val(-3)) are preserved.Chi2012 ; Lee2010b The second anchoring point chosen was Asp(-6) which allows the peptide to be maximally stretched in the trans configuration of the photoswitch. Protein and peptide have been expressed/synthesized using standard procedures,Zanobini2018 ; Buchli13 see Materials and Methods for details. The dissociation constants () in the two configurations of the photoswitchable peptide were determined by ITC, fluorescence and CD spectroscopy (see Supplementary Figs. S2 and S3).Jankovic2019 The obtained values averaged for all methods (M, M, see Supplementary Table S1) reveal an appreciable 5-fold difference in the binding affinity, with the cis state being the destabilized one, as anticipated.
Considering these binding affinities and the relatively high concentrations needed for the transient IR experiment (1.25 mM for the peptide and 1.5 mM for the protein), it is clear that most of the ligands are bound in both states to a protein of the photoswitch (97% in cis and 99% in trans), hence we will not observe many binding or unbinding events. Furthermore, as binding and unbinding in similar PDZ/ligand systems was observed to occur on 10 – 100 ms time-scales, Gianni2005 these processes are hardly within the time window of our experiment. Nevertheless, we will be able to observe the adaptation of the protein to a perturbed peptide conformation in the binding pocket and its transition to unspecific binding on the protein surface.
We investigate that process with the help of transient IR spectroscopy in the range of the amide I band (see Materials and Methods for details).ham00b ; Bredenbeck2004 ; Feng2017 This band originates from mostly the C=O stretch vibration of the peptide/protein backbone, and is known to be strongly structure dependent.barth02 While one cannot invert the problem and determine the structure of a protein from the amide I band, any change in protein structure will cause small but distinct changes in this band (see Fig. 2 a-c).
Figure 2 shows the transient IR response in the spectral region of the amide I vibration after photoswitching in either the trans-to-cis (panels d-f) or the cis-to-trans direction (panels g-i). To be directly comparable, the two data sets were scaled in a way that they refer to the same amount of isomerizing molecules, and not the same amount of excited molecules. The scaling took into account the different pump-pulse energies used in the experiments (see Materials and Methods), cross sections (23500 cm-1M-1 for trans at 380 nm vs 2000 cm-1M-1 for cis at 420 nm)zhang03 , and isomerization quantum yields (8% for trans-to-cis switching and 62% for cis-to-trans switching).borisenko05
The left panels of Fig. 2 show the results for the wild type PDZ2 domain, and the middle panels those with the protein 13C15N labelled, which down-shifts the frequency of the amide I band by 25 cm-1. The transient IR responses of both isotopologues look quite similar, as the signal is dominated by the photoswitchable peptide, which is perturbed directly by the azobenzene moiety. To remove that contribution and to isolate the smaller protein response, the two signals have been subtracted in the right panels of Fig. 2, with some of the more prominent features highlighted in Fig. 3a-d. In this way, we take advantage of the fact that only the amide I band of the protein is affected by 13C15N-isotope labelling and not that of the photoswitchable ligand. By doing so, we implicitly assume that the spectra of protein and ligand are additive and that coupling between them can be neglected. Great care was taken that protein and peptide concentrations were exactly the same in both experiments. Furthermore, both experiments were performed right after each other without changing any setting of the laser setup.
Overall, the kinetics of these double-difference spectra are quite complex and cover many orders of magnitudes in time.Sabelko99 Furthermore, the responses for trans-to-cis (Figs. 2f and 3a,c) vs cis-to-trans switching (Figs. 2i and Fig. 3b,d) are not mirror-images from each other, which one might expect if the protein would take the same pathway in the opposite direction. For example, the strongest band at 1636 cm-1 (marked as *1 in Figs. 2f and 3a) reveals the biggest step at around 1 ns in the trans-to-cis data, while the complementary feature in cis-to-trans data (marked as *2 in Figs. 2i and 3b) develops in a very stretched manner from 3 ns to 3 s. Worthwhile noting is also a transient band at 1579 cm-1 in the trans-to-cis data (marked as *3 in in Figs. 2f and 3c), living up to 100 ns, which has no complementary counterpart in the cis-to-trans data (Figs. 2i and 3d).
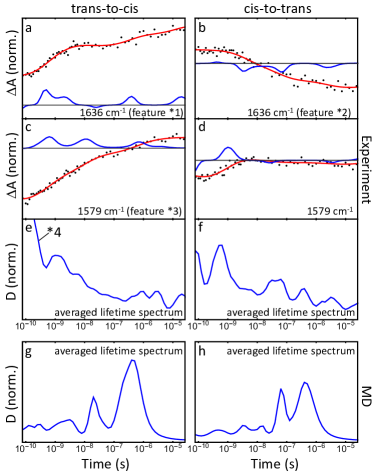
The red lines in Figs. 3a-d are fits revealed from a time-scale analysis of the signals using a Maximum Entropy method:Lorenz-Fonfria2006
| (1) |
Here denotes the probe frequency and the delay time of the signal, which is represented by a multiexponential function with time-scales . The time-scale spectra are shown in Figs. 3a-d as blue lines. Each of the kinetic processes discussed above shows up as a peak in these time-scale spectra, and the pattern of peaks is different for all the examples shown in Figs. 3a-d. Nevertheless, the dynamical content,Stock2018 , which averages over the complete data set shown in Supplementary Fig. S4, seems to indicate a relatively small number of discrete time scales, see Figs. 3e,f. We attribute the first peak around 100 ps (labeled as *4 in Figs. 2f and 3e) to a “heat signal” originating from the vibrational energy released by the photo-isomerization of the azobenzene moiety, an effect that is seen universally in this type of experiments.ham97b ; Baumann2019
The transient spectra at the latest pump-probe delay time that is accessible to our transient experiment (i.e., 42 s) are shown in Figs. 2a-c in blue for trans-to-cis switching and in red for cis-to-trans switching. They are compared to a properly scaled trans-minus-cis FTIR difference spectrum (black), which represents the response at effectively infinite time after photoswitching. The counterpart of the negative band in the blue and black trans-to-cis spectra at 1600 cm-1 (marked as *5 in Figs. 2c) has not yet evolved in the red cis-to-trans spectrum. We conclude from this observation that the cis-to-trans transition is not completely finished after 42 s.
MD simulations
To aid the interpretation of the above experiments, we performed all-atom explicit-solvent MD simulations of the cis and trans equilibrium states as well as non-equilibrium MD simulations Nguyen06 of the ligand-induced conformational changes of PDZ2. Using the GROMACS v2016 software packageAbraham15 and the Amber99*ILDN force field,Hornak2006 ; Best2009 ; LindorffLarsen2010 we collected in total s simulation time (see Materials and Methods). For the structural characterization of the protein, we determined 56 -distances between residues and that are not redundant (such as and ) and whose ensemble average changes significantly (Å) during the non-equilibrium simulations (Supplementary Fig. S5). To identify the essential coordinates of the system, we performed a principal component analysis on the normalized distances of all simulation data,Sittel2018 followed by robust density-based clusteringSittel16 and a recently proposed machine learning approachBrandt2018 (see Materials and Methods and Supplementary Fig. S6 for details). While we used six dimensions for the clustering, we find that two -distances suffice to qualitatively characterize the conformational distribution of PDZ2: accounting for the width of the binding pocket located between and , as well as representing the distance between N-terminus and - loop, which reflects the compactness of the C- and N-terminus region (see Fig. 1). Employing these coordinates, Fig. 4a shows the free energy surface , obtained from s-long trans equilibrium simulations describing the ligand-bound state of PDZ2. The free energy landscape reveals four well-defined local minima indicating metastable conformational states of the system. Density-based clustering identifies state 1 as close to the crystal structure,Zhang10 while state 2 indicates an opening of the binding pocket. Both states are mirrored by states 3 and 4, which are shifted to larger values of coordinate .
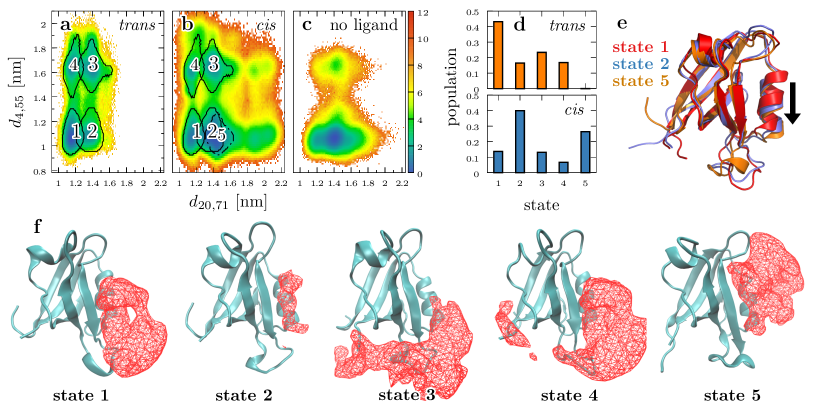
Upon switching the ligand from trans to cis configuration, PDZ2 undergoes a non-equilibrium time evolution until it relaxes within a few microseconds (see below) into its cis equilibrium state, describing the perturbed protein-ligand complex. Performing s-long trans-to-cis non-equilibrium simulations, we took the last s of each trajectory to estimate the rather heterogeneous conformational distribution of the cis equilibrium state. When we compare the resulting free energy landscapes of cis and trans, Figs. 4a,b reveal that the accessible conformational space in cis is considerably increased, along with the occurrence of additional state 5 that reports on a further opening of the binding pocket. Representing the populations of all states in trans and cis as a histogram, Fig. 4d demonstrates that the photoswitching of the ligand causes a notable () shift of the state populations, mostly from state 1 to states 2 and 5.
To illustrate the conformational changes associated with these states, Fig. 4e displays an overlay of minimum-energy structures of states 1 and 2 as well as the cis-specific state 5. We find that the opening of the binding pocket described by mainly reflects a shift of the helix down and away from the protein core. Interestingly, the structural rearrangement between main states 1 and 2 results in an overall root mean squared (RMS) displacement of only Å and causes only few () contacts to change (Supplementary Fig. S7). This is in striking contrast to the cross-linked photoswitchable PDZ2 studied by Buchli et al.Buchli13 where 34 contact changes were found for the trans-to-cis reaction,Buchenberg14 and cis and trans free energy landscapes hardly overlapped.Stock2018 This findings indicate that ligand-switching is considerably less invasive than a cross-linked photoswitch and therefore better mimics the natural unbiased system.
Is the above discussed population shift as well as the very occurrence of states an inherent property of the protein’s rugged free energy landscape,Frauenfelder91 ; Dill97 or are these features rather induced by the ligand? Figure 4c addresses this question by showing the free energy landscape obtained from previously performed s-long simulations of PDZ2 without a ligand Buchenberg14 . While the state separation along coordinate still exists, we find that states 1, 2 and 5 merge into a single energy minimum. It is centered at the position of state 2, but is wide enough to cover a large part of states 1 and 5. Similarly states 3 and 4 form a weakly populated () single minimum. This indicates that ligand-free PDZ2 provides the flexibility to assess the entire free energy landscape explored during binding and unbinding, while the interaction with the ligand appears to stabilize conformational states 1 and 4.
Showing protein structures of the main states together with position densities of the ligand, Fig. 4f illustrate these interactions (see also Supplementary Fig. S8). For one, we notice that the opening and closing of the binding pocket (described by ) is associated with the conventional binding of the ligand’s C-terminus in this pocket, which stabilizes closed state 1 in trans. In the open state 2, the probability to find the ligand in its binding mode is significantly decreased, pointing to a reduced ligand affinity of the protein. On the other hand, we find that the distinct conformations of the protein’s termini described by are a consequence of the formation of contacts with the ligand’s N-terminus in states 3 and 4, which are absent in states 1, 2 and 5. In particular, state 5 represents a situation where the hydrophobic photoswitch of the ligand forms a contact with a hydrophobic bulge at the protein surface around Ile20, which can be classified as unspecific binding of the ligand to the protein surface.
Adopting our trans-to-cis non-equilibrium simulations, we can describe the overall structural evolution of PDZ2 in terms of time-dependent expectation values of various observables. As an example, Figs. 5a,b show the time evolution of the two Cα-distances and introduced above. Following trans-to-cis ligand switching, it takes about 100 ns until the sub-picosecond photoisomerization of the photoswitch affects the protein’s binding region (indicated by ), which becomes wider as the ligand moves out. The flexible N-terminal region indicated by , on the other hand, undergoes conformational changes already within a few nanoseconds. The weak correlation between the two inter-residue distances (i.e., for all data), however, indicates that this early motion of the terminal region may be not directly related to the functional dynamics of PDZ2. Interestingly, the associated root mean squared deviations (RMSD) of the two distances show quite similar behavior. Moreover, Supplementary Fig. S9 displays various ligand-protein distances and contact changes, which illustrate that the ligand leaves the binding pocket on time-scales of 0.1 – s. When we calculate the dynamical content of all considered intraprotein Cα-distances, we obtain a time-scale distribution that roughly resembles the experimental result (Fig. 3g,h).
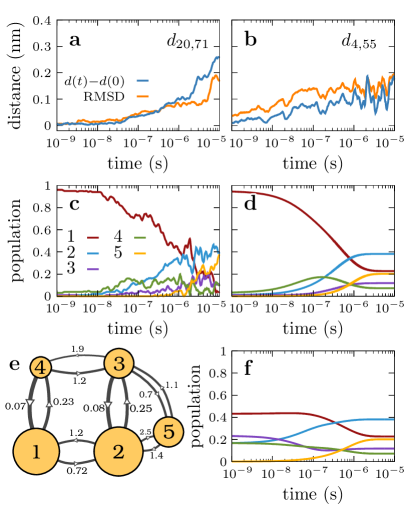
It is instructive to consider the resulting time-dependent populations of the protein’s metastable states. Choosing initial conditions close to the crystal structure,Zhang10 Fig. 5c exhibits the trans-to-cis time evolution of the state populations. The system starts at time almost completely in state 1 and converts to the other states within microseconds. To rationalize these findings, we construct a Markov state modelBowman2013 ; Sengupta18 (MSM) which describes the conformational dynamics of PDZ2 via memory-less jumps between metastable states. To this end, we calculate a transition matrix containing the probabilities , that the system jumps from state to within lag time , and determine its eigenvectors and eigenvalues (see Materials and Methods and Supplementary Fig. S10 for technical details). As a first impression, Figs. 5c,d compares the state populations obtained from the non-equilibrium MD simulations and the corresponding MSM predictions (using ns). We find excellent agreement for the first three decades of time, but only qualitative agreement in the last decade, which reflects the bias of our non-equilibrium MD simulations towards shorter time-scales (s-long and s-long data). Showing a network representation of the MSM, Fig. 5e illustrates the connectivity and transition times of the system. We see that the open-close transition of the binding pocket occurs on a time-scale of s, whereas transitions from states 1 and 2 to states 4 and 3 are a factor 4 faster with a back-rate that is even a factor 10 faster.
Assuming a time-scale separation between fast intrastate fluctuations and rarely occurring interstate transitions, MSM theoryBowman2013 states that the time-dependent expectation value of any dynamical observable can be written as a sum over exponential functions weighted by the projection of the observable onto the th eigenvector of transition matrix . The implied time-scales of the MSM therefore govern the time evolution of such different observables as vibrational spectra and state populations.Noe2011 To facilitate a comparison of experimental and simulated time evolutions, we run a MSM simulation using trans equilibrium initial conditions, which is also the starting point of the trans-to-cis experiments. Comparing the simulation results (Fig. 5f) to the experimental time traces (Fig. 3), we find that both spectral and population evolutions appear to be completed on microsecond time-scale. Moreover, the MSM populations exhibits various transient features on time-scales of 10 – 100 ns, which are also present in the experimental time signals.
Discussion and Conclusions
Combining transient IR spectroscopy and non-equilibrium MD simulations, we have described the ligand-induced conformational transition in the PDZ2 domain, which is thought to be responsible for protein allosteric communication. We have found that the free energy landscape of PDZ2 can be described in terms of a few metastable states with well-defined structure (Fig. 4), although the mean structural changes upon ligand switching are rather small. That is, the secondary and tertiary structure of the protein are quite similar (Å RMS displacement) in the different states, and only modest (%) shifts of the state’s population are found (Fig. 4b). On average, the measurable structural change is therefore only in the order of 0.2 Å. In light of this result, it is remarkable that we can observe such minor structural changes by transient IR spectroscopy (Fig. 2), unpinning the extraordinary structural sensitivity of the method.
Using isotope labeling to discriminate the dynamics of protein and ligand, the resulting time-resolved double-difference IR spectra have revealed complex kinetics of the protein that cover many time-scales (Fig. 2). The spectra for trans-to-cis and cis-to-trans ligand-switching are not mirror-images from each other, and the trans-to-cis signals exhibit short-time transients that are not found for cis-to-trans. Moreover, the cis-to-trans transition does not seem to be finished within 42 s (Fig. 2c). The overall slower response of the cis-to-trans transition reflects the general observation that enforced leaving of a well-defined (low entropy) ligand binding structure (here trans) occurs faster than starting in a conformationally disordered (high-entropy) state (here cis) and trying to find stabilizing interactions to end in a more organized structure.Wolf2019
More specifically, the trans-to-cis non-equilibrium simulations reveal that the ligand remains bound with its C-terminus to the protein binding site between and up to about 1 s. In this way, it stabilizes the main bound protein conformation (state 1). At longer times, it starts to move out from the binding pocket, but remains non-specifically bound to the protein surface. While diffusion on the surface may continue for long times after trans-to-cis switching, it only little affects the protein internal structure. Nevertheless, this diffusion will be the first rate-limiting step after cis-to-trans switching, which might be the reason that the ligand does not completely localize in the binding pocket within s.
The existence of well-defined metastable conformational states implies a time-scale separation between fast intrastate fluctuations and rarely occurring interstate transitions. This allowed us to construct a Markov state model (MSM), which illustrates the connectivity and transition times between the metastable states (Fig. 5d). In particular, the discrete time-scales predicted by the MSM are directly reflected in the dynamical content calculated for experiments and MD simulations (Fig. 3e-h), which both cover time-scales from 1 ns to 10 s. Reflecting different observables (transition dipole vs. Cα-distances, respectively), the weights of the various peaks are different.
While ligand switching was shown to cause a conformational transition of PDZ2 in terms of the mean structure, at the same time it may also effect a change of the protein’s fluctuations. Comparing the time evolution of the means of the distances and their RMSD, Figs. 5a,b reveal that the two quantities correlate closely, a behavior that is found for all considered Cα-distances (Supplementary Fig. S5). This finding reflects the fact that the Cα-distance distributions pertaining to the individual states are in most cases well separated (Supplementary Fig. S11), such that a transition between two states affects both mean and variance. Accounting for an entropic contribution of the conformational transition, the latter effect is often referred to as “dynamic allostery”.Cooper84 ; Fuentes06 ; Petit09 The above findings indicate that allosteric transitions may involve both, conformational and dynamic changes in the case of the PDZ2 domain.Nussinov15 The answer to what is the dominant effect will greatly depend on the system under consideration and on the applied experimental method. While the overall structural change (Å RMS displacement) may be too small to be detected by structure analysis, NMR relaxation methods can sensitively explore the structural flexibility of proteins. The IR spectrum of the amide I band, in contrast, is commonly thought of as a measure of structure,barth02 but dephasing due to fast fluctuation might also affect the IR lineshape.
In conclusion, we have characterized the non-equilibrium allosteric transition in a joint experimental-theoretical approach. The protein per se was kept unmodified, hence ligand-switching mimics very closely the naturally occurring allosteric perturbation caused by ligand (un)binding events. We employed a widely studied model system for this purpose, the PDZ2 domain, which is small enough to allow for a characterization of the process in atomistic detail by MD simulations, but we believe that the findings are of more general nature. That is, while the ligand-induced allosteric transition originates from a population shift between various metastable conformational states, the measurable mean structural change of the protein may be tiny and therefore difficult to observe Nussinov15 . Moreover, we suggest that the separation between purely dynamically driven allostery and allostery upon a conformational change may not be as clear-cut as previously thought, but rather that there may be an interplay between both that allows proteins to adapt their free energy landscape to incoming signals. The photo-switching approach presented here is very versatile, and allows us to shed light on the aspects of “time” and “speed” in allosteric communication.
Materials & Methods
.1 Protein and Peptide Preparation
Expression of the wild type PDZ2 domain from human phosphatase 1E,kozlov02 isotope labelled (13C15N) protein variant and synthesis of the photoswitchable peptide ligand was performed as described earlier.Zanobini2018 ; Buchli13 The wild type RA-GEF-2 sequence was modified in order to enable cross-linking the photoswitch, while preserving residues that are important for regulation and binding. That is, amino acids at positions (-1) and (-6) were chosen as anchoring points for the photoswitch and mutated into cysteine residues. Four N-terminal residues (RWAK) were added to the sequence in order to improve the water solubility and facilitate the concentration determination of the construct. Final sequence of the peptide was RWAKSEAKECEQVSCV. The purity of all samples was confirmed by mass spectrometry analysis (Fig. S1). All samples were dialyzed against 50 mM borate, 150 mM NaCl buffer, pH = 8.5. For transient infrared measurements, samples were lyophilized and resuspended in D2O. Incubation of the samples in D2O overnight at room temperature before the measurements eliminated H/D exchange during experiments. The concentration of the samples was determined via the tyrosine absorption at 280 nm for the protein and 310 nm for the peptide and confirmed by amino-acid analysis.
.2 Determining the Binding Affinity
Isothermal titration calorimetry (ITC) measurements were performed on a MicroCal ITC200 (Malvern, UK). In order to ensure the obtained values for the cis and trans measurement were mutually comparable, the experiments were performed using the same stock solution of the peptide and protein for both measurements, and under exactly the same experimental conditions. The experiment was performed in triplicate in order to ensure the reproducibility of the data. The sample cell was loaded with 250 l of 80 M PDZ2 domain solution and the syringe was loaded with 40 l of 800 M photoswitchable peptide solution. For the trans measurement, the system was kept in the dark for the duration of the experiment, while for the cis measurement the syringe was constantly illuminated with a 370 nm cw laser (CrystaLaser, power 90 mW).Jankovic2019 The results are shown in Fig. S2.
As alternative method to determine the binding affinity, we also used circular dichroism (CD) spectroscopy as well as fluorescence quenching. Both spectroscopic signals change upon the formation of a protein-ligand complex, hence, when measuring them in dependence of peptide and protein concentration, the binding affinity can be fitted assuming a bimolecular equilibrium. CD measurements were done on Jasco (Easton, MD) model J810 spectropolarimeter in a 0.1 cm quartz cuvette as described previously.Jankovic2019 . Intrinsic tryptophan fluorescence quenching experiment was done on PelkinElmer spectrofluorimeter as described previously.Jankovic2019 In either case, the protein concentration was kept constant at 5 M, respectively, while the peptide concentrations were varied. Fig. S3 shows the results for the CD spectroscopy and trypthophan fluorescence quenching, while Table S1 compares the binding affinities obtained from all different methods.
.3 Transient IR Spectroscopy
Transient VIS-pump-IR-probe spectra were recorded using two electronically synchronized Ti:Sapphire laser systemsBredenbeck2004 running at 2.5 kHz. The wavelength of the pump-laser was tuned as to obtain 380 nm pump pulses (2.1 J) for the trans-to-cis experiment, and 420 nm (1.3 J) for the cis-to-trans experiment, respectively, via second harmonic generation in a BBO crystal. The beam diameter of the pump pulse at the sample position was 180 m, employing a pulse duration of 200 ps (by extracting the light directly after the regenerative amplifier and before the compressor) to minimize the sample degradation during the measurements. Mid-IR probe pulses centered at 1630 cm-1 (pulse duration 100 fs, beam diameter on the sample 150 m) were obtained in a optical parametric amplifier (OPA),ham00b passed through a spectrograph and detected in a 264 MCT array detector with a spectral resolution of 2 cm-1/pixel. Pump-probe spectra were acquired up to the maximum delay value of 42 s with a time resolution of 200 ps. Normalisation for noise suppression was performed as described in Ref. Feng2017 .
The samples (700 l) were pumped through a closed flow-cell system purged with N2. The system consisted of a sample cell with two CaF2 windows separated by a 50 m Teflon spacer and a reservoir. The flow speed in the sample cell was optimized in order to minimize loss of sample at the largest pump-probe delay time (42 s) on the one hand, but to have the sample exchanged essentially completely for the subsequent laser shot after 400 s on the other hand. The concentrations of the samples were set at 1.25 mM for the peptide and 1.5 mM for the protein. A slight excess of protein was needed to ensure that the peptide was fully saturated with the protein; in order to eliminate the response of free, photoswitchable peptide. As a reference, FTIR difference spectra have been taken in a Bruker Tensor 27 FTIR spectrometer, using the same sample conditions.
For the experiment with trans-to-cis switching, we relied on thermal cis-to-trans back reaction. By comparing its rate with the isomerization probability induced by the 380 nm pump light (determined by pump light power, total sample volume, absorption cross sections,zhang03 and isomerization quantum yieldborisenko05 ), we estimated that the photo-equilibrium in the total sample volume is 70%/30% trans/cis during measurement. It furthermore helps that the absorption cross section at 380 nm of the azobenzene moiety in the trans-state is 20 times larger than that of the cis-state,zhang03 which leads us to conclude that 97% of the molecules in the trans-to-cis experiment undergo the desired isomerisation direction.
For the experiment with cis-to-trans switching, the sample could be actively switched back by illuminating the reservoir with an excess of light at 370 nm from a cw laser (CrystaLaser, 150 mW).
.4 MD Simulations
All MD simulations of PDZ2 were performed using the GROMACS v2016 software packageAbraham15 and the Amber99*ILDN force field.Hornak2006 ; Best2009 ; LindorffLarsen2010 Force field parameters of the azobenzene photoswitch were taken from Ref. Zanobini2018 . Protein-ligand structures were solvated with ca. 8000 TIP3P water moleculesJorgensen1983 in a dodecahedron box with a minimal image distance of 7 nm. 16 Na+ and 16 Cl- were added to yield a charge-neutral system with a salt concentration of 0.1 M. All bonds involving hydrogen atoms were constrained using the LINCS algorithm,Hess2008 allowing for a time step of 2 fs. Long-range electrostatic interactions were computed by the Particle Mesh Ewald method,Essmann1995 whereas the short-range electrostatic interactions were treated explicitly with the Verlet cutoff scheme. The minimum cutoff distance for electrostatic and van der Waals interactions was set to 1.4 nm. A temperature of 300 K was maintained via the Bussi thermostatBussi2007 (aka velocity-rescale algorithm) with a coupling time constant of = 0.1 ps. A pressure 1 bar was controlled using the pressure coupling method of BerendsenBerendsen1984 with a coupling time constant of = 0.1 ps.
The starting structure of the photoswitched ligand bound to PDZ2 was prepared previously (see Ref. Zanobini2018 ) based on the crystal structure (PDB ID 3LNXZhang10 ). Here, the azobenzene photoswitch was attached in trans conformation to the ligand at positions (-6) and (-1), which had been mutated to cysteins as in experiment to provide covalent connection points. Residues missing at the N-terminus of the ligand were added (see Sec. .1). Following NPT equilibration of the system in trans conformation for 10 ns, 4 statistically independent (i.e., with different initial velocity distributions) NVT runs of 100 ns each were performed. For one, we selected 5 randomly chosen snapshots from the end of these trajectories to perform s-long trans equilibrium simulations. Moreover, we selected 25 randomly chosen snapshots from each of the last 50 ns of these four NVT trajectories to perform trans-to-cis nonequilibrium simulations, yielding a total of 100 starting structures which consists mostly of metastable state 1 (for state definition, see Sec. .5). Employing these initial conditions, trans-to-cis photoswitching was performed using a previously developed potential-energy surface switching approach Nguyen06 . All 100 trans-to-cis nonequilibrium simulations were run for s; 25 of them were extended to a length of 10 s.
Upon switching the ligand from trans to cis configuration, PDZ2 undergoes a nonequilibrium time evolution until it relaxes within a few microseconds (see below) into its cis equilibrium state, describing the unbound protein-ligand complex. Performing s-long trans-to-cis nonequilibrium simulations, we took the last s of each trajectory to estimate the rather heterogeneous conformational distribution of the cis equilibrium state. To generate initial structures for cis-to-trans photoswitching, we took from the 25 trans-to-cis trajectories 100 randomly chosen snapshot at a simulation time around 3.0s. Following photoswitching, 100 cis-to-trans nonequilibrium trajectories were simulated for a trajectory length of 1 s; 10 simulations were extended to a length of 8 s.
Gromacs tools and were employed to compute backbone dihedral angles, interresidue -distances, and the number of contacts between various segments of PDZ2. Time-dependent distributions and mean values of these observables were calculated via an ensemble average over 100 nonequilibrium trajectories.
.5 Dimensionality reduction and clustering
To choose suitable internal coordinates that account for the conformational transitions of the system, Sittel2018 we determined 56 -distances between residues and that are not redundant (such as and ) and whose ensemble average changes significantly (Å) during the first microsecond trans-to-cis nonequilibrium simulations, see Fig. S5. Moreover, we considered all backbone dihedral angles that show a change of from their initial value during the trans-to-cis nonequilibrium simulations.
Since the interresidue -distances appear to provide more information, these coordinate are chosen for the subsequent principal component analysis (PCA), which was performed on all data.Sittel2018 For adequate relative weighting of short and long distances, the data was normalized. Ernst2015 Diagonalizing the resulting covariance matrix, we obtain its eigenvectors (yielding the PCs) and eigenvalues (reflecting the fluctuations of the PCs). The first two PCs cover 43 % of the overall fluctuations, while six PCs yield about 65 %. Calculating the free energy profiles pertaining to the PCs, we find that in particular PC 1–4, 6 and 7 show multistate behavior reflecting metastable states.
Including these 6 PCs, we performed robust density-based clustering,Sittel16 which first computes a local free energy estimate for every structure in the trajectory by counting all other structures inside a -dimensional hypersphere of fixed radius . Normalization of these population counts yields densities or sampling probabilities , which give the free energy estimate . Thus, the more structures are close to the given one, the lower the free energy estimate. By reordering all structures from low to high free energy, finally the minima of the free energy landscape can be identified. By iteratively increasing a threshold energy, all structures with a free energy below that threshold that are closer than a certain lumping radius will be assigned to the same cluster, until all clusters meet at their energy barriers. In this way, all data points are assigned to a cluster as one branch of the iteratively created tree. For PDZ2, we used a hypersphere that equaled the lumping radius employed in the last step.
Figure S6(top) shows the resulting total number of states obtained as a function of the minimal populations a state must contain. Here we chose , resulting in a clustering into 12 states. According to visual inspection of the resulting free energy landscapes (Fig. S6(middle)), these states separate accurately all density maxima of the system. Since the 5 lowest populated states cover less than 5 % of the total population, we lumped them to main states 1 to 7 as follows: (1, 9)1, (2, 10)2, (4, 12)4, (5, 8, 11)5. This is justified due to their geometric vicinity in the free energy landscape (Fig. S6(middle)), as well as due to their kinetic vicinity in the transition matrix. Following the calculation of the time-dependent states populations, in a last step we lumped states (4, 7)4 and states (5, 6)5 for the sake of easy interpretability.
Finally we employed a recently proposed machine learning approachBrandt2018 to identify the internal coordinates that allow to discuss the 5 main states of PDZ2 in a two-dimensional free energy landscape. On the basis of the decision-tree based program XGBoost,Chen2016a we trained a model that determines the features of the molecular coordinates that are most important to discriminate given metastable states. Using a new algorithm that exploits this feature importance via an iterative exclusion principle, we identified the essential internal coordinates, that is, the most important Cα-distances of PDZ2. Figure S6(bottom) shows that three distances, , and suffice to qualitatively distinguish the 5 main states of PDZ2. The XGBoost parameters are chosen as in Ref. Brandt2018 , including learning rate , maximum tree depth of 6, 10 training rounds, and 70% and 30% of the data used for training and validation, respectively.
.6 Markov state model
On the basis of the above defined 7 metastable states, we constructed a Markov state modelBowman2013 of the trans-to-cis transition of PDZ2, using all (s and s) trans-to-cis nonequilibrium trajectories. A general problem with the definition of metastable states is that, due to the inevitable restriction to a low-dimensional space combined with insufficient sampling, we often obtain a misclassification of sampled points in the transition regions, which causes intrastate fluctuations to be mistaken as interstate transitions. As a simple but effective remedy, we use dynamical coring which requires that a transition must a minimum time in the new state for the transition to be counted.Jain2014 ; Nagel2019 A suitable quantity that reflects these spurious crossings is the probability to stay in state for duration (without considering back transitions). As shown in Fig. S10, without coring we observe a strong initial decay of for all states, instead of a simple exponential decay we would expect for Markovian states. Applying coring with increasing coring times, this initial drop vanishes because fluctuations on timescales are removed. Here we determined ns as shortest coring time, which removes the spurious interstate transitions.
Figure S10shows the resulting implied timescales and eigenvectors of the model. Using a lag time of 1 ns, we moreover show the time evolution of the state populations, assuming that we start completely in a specific state.
Acknowledgements
We thank Rolf Pfister for the synthesis of the peptides and the Functional Genomics Center Zurich, especially Serge Chesnov and Birgit Roth, for their help with the mass spectrometry and amino-acid analysis. We also thank Benjamin Lickert, Daniel Nagel and Georg Diez for many enlightening discussions concerning the MD data analysis. The work has been supported by the Swiss National Science Foundation (SNF) through the NCCR MUST and Grant 200020B_188694/1, as well as by the Deutsche Forschungsgemeinschaft through Grant STO 247/10-2. We acknowledge support by the High Performance and Cloud Computing Group at the Zentrum für Datenverarbeitung of the University of Tübingen and the Rechenzentrum of the University of Freiburg, the state of Baden-Württemberg through bwHPC and the DFG through Grant Nos. INST 37/935-1 FUGG (RV bw16I016) and INST 39/963-1 FUGG (RV bw18A004), the Black Forest Grid Initiative, and the Freiburg Institute for Advanced Studies (FRIAS) of the Albert-Ludwigs-University Freiburg.
Author contributions
O.B., C.Z. and A.G. contributed equally to this work. O.B, S.W., G.S., and P.H. designed research, O.B and B.J prepared samples, all authors provided data and/or analyzed them, O.B, C.Z., S.W., G.S., and P.H contributed to the writing of the paper.
References
References
- (1) S. J. Wodak et al., Allostery in Its Many Disguises: From Theory to Applications, Structure 27, 566 (2019).
- (2) J.-P. Changeux, Allostery and the Monod-Wyman-Changeux Model After 50 Years, Annu. Rev. Biophys. 41, 103 (2012).
- (3) A. Cooper and D. T. F. Dryden, Allostery without conformational change, Eur. Biophys. J. 11, 103 (1984).
- (4) E. J. Fuentes, S. A. Gilmore, R. V. Mauldin, and A. L. Lee, Evaluation of Energetic and Dynamic Coupling Networks in a PDZ Domain Protein., J. Mol. Biol. 364, 337 (2006).
- (5) I. Bahar, C. Chennubhotla, and D. Tobi, Intrinsic dynamics of enzymes in the unbound state and relation to allosteric regulation, Curr. Opin. Struct. Biol 17, 633 (2007).
- (6) C. M. Petit, J. Zhang, P. J. Sapienza, E. J. Fuentes, and A. L. Lee, Hidden Dynamic Allostery in a PDZ Domain., Proc. Natl. Acad. Sci. USA 106, 18249 (2009).
- (7) T. C. B. McLeish, T. L. Rodgers, and M. R. Wilson, Allostery without conformational change: modelling protein dynamics at multiple scales, Phys. Biol. 10, 056004 (2013).
- (8) R. Nussinov and C.-J. Tsai, Allostery without a conformational change? Revisiting the paradigm, Curr. Opin. Struc. Biol. 30, 17 (2015).
- (9) J. Guo and H.-X. Zhou, Protein allostery and conformational dynamics, Chem. Rev. 116, 6503 (2016).
- (10) D. Thirumalai, C. Hyeon, P. I. Zhuravlev, and G. H. Lorimer, Symmetry, rigidity, and allosteric signaling: From monomeric proteins to molecular machines, Chem. Rev. 119, 6788 (2019).
- (11) A. G. Palmer, NMR characterization of the dynamics of biomacromolecules, Chem. Rev. 104, 3623 (2004).
- (12) A. Mittermaier and L. E. Kay, New tools provide new insights in NMR studies of protein dynamics, Science 312, 224 (2006).
- (13) D. Bourgeois and A. Royant, Advances in kinetic protein crystallography, Curr. Opin. Struct. Biol. 15, 538 (2005).
- (14) X. Deupi and B. K. Kobilka, Dynamics and Function, Physiology 25, 293 (2010).
- (15) S. Brüschweiler, P. Schanda, K. Kloiber, B. Brutscher, G. Kontaxis, R. Konrat, and M. Tollinger, Direct observation of the dynamic process underlying allosteric signed transmission, J. Am. Chem. Soc. 131, 3063 (2009).
- (16) C. Hyeon and D. Thirumalai, Mechanical unfolding of RNA hairpins, Proc. Natl. Acad. Sci. USA 102, 6789 (2005).
- (17) F. Pontiggia, D. V. Pachov, M. W. Clarkson, J. Villali, M. F. Hagan, V. S. Pande, and D. Kern, Free energy landscape of activation in a signalling protein at atomic resolution, Nat. Commun. 6, 7284 (2015).
- (18) C. A. Smith, D. Ban, S. Pratihar, K. Giller, M. Paulat, S. Becker, C. Griesinger, D. Lee, and B. L. De Groot, Allosteric switch regulates protein-protein binding through collective motion, Proc. Natl. Acad. Sci. U. S. A. 113, 3269 (2016).
- (19) E. J. Fuentes, C. J. Der, and A. L. Lee, Ligand-dependent dynamics and intramolecular signaling in a PDZ Domain, J. Mol. Biol. 335, 1105 (2004).
- (20) E. Kim and M. Sheng, PDZ domain proteins of synapses, Nat. Rev. Neurosci. 5, 771 (2004).
- (21) M. Sheng and C. Sala, PDZ Domains and the Organization of Supramolecular Complexes, Annu. Rev. Neurosci. 24, 1 (2001).
- (22) S. W. Lockless and R. Ranganathan, Evolutionarily Conserved Pathways of Energetic Connectivity in Protein Families, Science 286, 295 (1999).
- (23) A. B. Law, E. J. Fuentes, and A. L. Lee, Conservation of side-chain dynamics within a protein family, J. Am. Chem. Soc. 131, 6322 (2009).
- (24) Y. Kong and M. Karplus, Signaling Pathways of PDZ2 Domain: a Molecular Dynamics Interaction Correlation Analysis., Proteins 74, 145 (2009).
- (25) K. A. Reynolds, R. N. McLaughlin, and R. Ranganathan, Hot spots for allosteric regulation on protein surfaces, Cell 147, 1564 (2011).
- (26) G. Kozlov, D. Banville, K. Gehring, and I. Ekiel, Solution Structure of the PDZ2 Domain from Cytosolic Human Phosphatase hPTP1E Complexed with a Peptide Reveals Contribution of the Beta 2-Beta 3 Loop to PDZ Domain-Ligand Interactions, J. Mol. Biol. 320, 813 (2002).
- (27) Z. Zhang, D. C. Burns, J. R. Kumita, O. S. Smart, and G. A. Woolley, A Water-Soluble Azobenzene Cross-Linker for Photocontrol of Peptide Conformation, Bioconjugate Chem. 14, 824 (2003).
- (28) T. T. Cao, H. W. Deacon, D. Reczek, A. Bretscher, and M. Von Zastrow, A kinase-regulated PDZ-domain interaction controls endocytic sorting of the 2-adrenergic receptor, Nature 401, 286 (1999).
- (29) A. Toto, A. Mattei, P. Jemth, and S. Gianni, Understanding the role of phosphorylation in the binding mechanism of a PDZ domain, Protein Eng. Des. Sel. 30, 1 (2017).
- (30) B. Buchli, S. A. Waldauer, R. Walser, M. L. Donten, R. Pfister, N. Blöchliger, S. Steiner, A. Caflisch, O. Zerbe, and P. Hamm, Kinetic response of a photoperturbed allosteric protein, Proc. Natl. Acad. Sci. USA 110, 11725 (2013).
- (31) H. Frauenfelder, S. G. Sligar, and P. G. Wolynes, The Energy Landscapes and Motions of Proteins, Science 254, 1598 (1991).
- (32) K. A. Dill and H. S. Chan, From Levinthal to pathways to funnels: The ”new view” of protein folding kinetics, Nat. Struct. Bio. 4, 10 (1997).
- (33) R. G. Smock and L. M. Gierasch, Sending signals dynamically, Science 324, 198 (2009).
- (34) C. J. Tsai and R. Nussinov, A Unified View of ”How Allostery Works”, PLoS Comput. Biol. 10 (2014).
- (35) V. J. Hilser, J. O. Wrabl, and H. N. Motlagh, Structural and Energetic Basis of Allostery, Annu. Rev. Biophys. 41, 585 (2012).
- (36) C. N. Chi, A. Bach, K. Strømgaard, S. Gianni, and P. Jemth, Ligand binding by PDZ domains, BioFactors 38, 338 (2012).
- (37) H.-J. Lee and J. J. Zheng, PDZ domains and their binding partners: structure, specificity, and modification, Cell Commun. Signal. 8, 8 (2010).
- (38) C. Zanobini, O. Bozovic, B. Jankovic, K. L. Koziol, P. J. M. Johnson, P. Hamm, A. Gulzar, S. Wolf, and G. Stock, Azidohomoalanine : A Minimally Invasive, Versatile, and Sensitive Infrared Label in Proteins To Study Ligand Binding, J. Phys. Chem. B 122, 10118 (2018).
- (39) B. Jankovic, A. Gulzar, C. Zanobini, O. Bozovic, S. Wolf, G. Stock, and P. Hamm, Photocontrolling Protein–Peptide Interactions: From Minimal Perturbation to Complete Unbinding, J. Am. Chem. Soc. 141, 10702 (2019).
- (40) S. Gianni, Å. Engström, M. Larsson, N. Calosci, F. Malatesta, L. Eklund, C. C. Ngang, C. Travaglini-Allocatelli, and P. Jemth, The kinetics of PDZ domain-ligand interactions and implications for the binding mechanism, J. Biol. Chem. 280, 34805 (2005).
- (41) P. Hamm, R. A. Kaindl, and J. Stenger, Noise suppression in femtosecond Mid-infrared light sources, Opt. Lett. 25, 1798 (2000).
- (42) J. Bredenbeck, J. Helbing, and P. Hamm, Continuous scanning from picoseconds to microseconds in time resolved linear and nonlinear spectroscopy, Rev. Sci. Instrum. 75, 4462 (2004).
- (43) Y. Feng, I. Vinogradov, and N.-H. Ge, General noise suppression scheme with reference detection in heterodyne nonlinear spectroscopy, Opt. Express 25, 26262 (2017).
- (44) A. Barth and C. Zscherp, What vibrations tell us about proteins, Q. Rev. Biophys. 35, 369 (2002).
- (45) V. Borisenko and G. A. Woolley, Reversibility of conformational switching in light-sensitive peptides, J. Photochem. Photobiol. A Chem. 173, 21 (2005).
- (46) J. Sabelko, J. Ervin, and M. Gruebele, Observations of strange kinetics in protein folding, Proc. Natl. Acad. Sci. USA 96, 6031 (1999).
- (47) V. A. Lórenz-Fonfría and H. Kandori, Transformation of time-resolved spectra to lifetime-resolved spectra by maximum entropy inversion of the Laplace transform, Appl. Spectrosc. 60, 407 (2006).
- (48) G. Stock and P. Hamm, A Nonequilibrium Approach to Allosteric Communication, Philos. Trans. R. Soc. B Biol. Sci. 373, 20170187 (2018).
- (49) P. Hamm, S. M. Ohline, and W. Zinth, Vibrational cooling after ultrafast photoisomerization of azobenzene measured by femtosecond infrared spectroscopy, J. Chem. Phys. 106, 519 (1997).
- (50) T. Baumann et al., Site-Resolved Observation of Vibrational Energy Transfer Using a Genetically Encoded Ultrafast Heater, Angew. Chemie - Int. Ed. 58, 2899 (2019).
- (51) P. H. Nguyen and G. Stock, Nonequilibrium molecular dynamics simulation of a photoswitchable peptide, Chem. Phys. 323, 36 (2006).
- (52) M. J. Abraham, T. Murtola, R. Schulz, S. Páll, J. C. Smith, B. Hess, and E. Lindah, Gromacs: High performance molecular simulations through multi-level parallelism from laptops to supercomputers, SoftwareX 1-2, 19 (2015).
- (53) V. Hornak, R. Abel, A. Okur, B. Strockbine, A. Roitberg, and C. Simmerling, Comparison of Multiple Amber Force Fields and Development of Improved Protein Backbone Parameters Viktor, Proteins Struct. Funct. Bioinforma. 65, 712 (2006).
- (54) R. B. Best and G. Hummer, Optimized molecular dynamics force fields applied to the helix-coil transition of polypeptides, J. Phys. Chem. B 113, 9004 (2009).
- (55) K. Lindorff-Larsen, S. Piana, K. Palmo, P. Maragakis, J. L. Klepeis, R. O. Dror, and D. E. Shaw, Improved side-chain torsion potentials for the Amber ff99SB protein force field, Proteins Struct. Funct. Bioinforma. 78, 1950 (2010).
- (56) F. Sittel and G. Stock, Perspective: Identification of collective variables and metastable states of protein dynamics, J. Chem. Phys. 149, 150901 (2018).
- (57) F. Sittel and G. Stock, Robust Density-Based Clustering to Identify Metastable Conformational States of Proteins, J. Chem. Theory Comput. 12, 2426 (2016).
- (58) S. Brandt, F. Sittel, M. Ernst, and G. Stock, Machine Learning of Biomolecular Reaction Coordinates, J. Phys. Chem. Lett. 9, 2144 (2018).
- (59) J. Zhang, P. J. Sapienza, H. Ke, A. Chang, S. R. Hengel, H. Wang, G. N. Phillipsand, and A. L. Lee, Crystallographic and nuclear magnetic resonance evaluation of the impact of peptide binding to the second PDZ domain of protein tyrosine phosphatase 1E, Biochemistry 49, 9280 (2010).
- (60) S. Buchenberg, V. Knecht, R. Walser, P. Hamm, and G. Stock, Long-Range Conformational Transition of a Photoswitchable Allosteric Protein: A Molecular Dynamics Simulation Study, J. Phys. Chem. B 118, 13468 (2014).
- (61) G. R. Bowman, V. S. Pande, and F. Noe, An Introduction to Markov State Models, Springer, Heidelberg, 2013.
- (62) U. Sengupta and B. Strodel, Markov models for the elucidation of allosteric regulation, Phil. Trans. R. Soc. B 373, 20170178 (2018).
- (63) F. Noé, S. Doose, I. Daidone, M. Löllmann, M. Sauer, J. D. Chodera, and J. C. Smith, Dynamical fingerprints for probing individual relaxation processes in biomolecular dynamics with simulations and kinetic experiments, Proc. Natl. Acad. Sci. U. S. A. 108, 4822 (2011).
- (64) S. Wolf et al., Estimation of Protein-Ligand Unbinding Kinetics Using Non-Equilibrium Targeted Molecular Dynamics Simulations, J. Chem. Inf. Model. 59, 5135 (2019).
- (65) W. L. Jorgensen, J. Chandrasekhar, J. D. Madura, R. W. Impey, and M. L. Klein, Comparison of simple potential functions for simulating liquid water, J. Chem. Phys. 79, 926 (1983).
- (66) B. Hess, P-LINCS: A parallel linear constraint solver for molecular simulation, J. Chem. Theory Comput. 4, 116 (2008).
- (67) U. Essmann, L. Perera, M. L. Berkowitz, T. Darden, H. Lee, and L. G. Pedersen, A smooth particle mesh Ewald method, J. Chem. Phys. 103, 8577 (1995).
- (68) G. Bussi, D. Donadio, and M. Parrinello, Canonical sampling through velocity rescaling, J. Chem. Phys. 126, 014101 (2007).
- (69) H. J. C. Berendsen, J. P. M. Postma, W. F. van Gunsteren, A. DiNola, and J. R. Haak, Molecular dynamics with coupling to an external bath, J Chem Phys 81, 3684 (1984).
- (70) M. Ernst, F. Sittel, and G. Stock, Contact- and distance-based principal component analysis of protein dynamics, J. Chem. Phys. 143, 244114 (2015).
- (71) T. Chen and C. Guestrin, XGBoost: A scalable tree boosting system, Proc. ACM SIGKDD Int. Conf. Knowl. Discov. Data Min. 13-17-Augu, 785 (2016).
- (72) A. Jain and G. Stock, Hierarchical folding free energy landscape of HP35 revealed by most probable path clustering, J. Phys. Chem. B 118, 7750 (2014).
- (73) D. Nagel, A. Weber, B. Lickert, and G. Stock, Dynamical coring of Markov state models, J. Chem. Phys. 150, 094111 (2019).