MEGARA-IFU detection of extended He ii nebular emission in the central region of NGC 1569 and its ionization budget
Abstract
We here report the detection of extended He ii nebular emission in the central region of NGC 1569 using the integral field spectrograph MEGARA at the 10.4-m Gran Telescopio Canarias. The observations cover a Field of View (FoV) of 12.5 arcsec11.3 arcsec at seeing-limited spatial resolution of 15 pc and at a spectral resolution of R=6000 in the wavelength range 4330–5200 Å. The emission extends over a semi-circular arc of 40 pc width and 150 pc diameter around the super star cluster A (SSC-A). The derived using Balmer decrement varies from the Galactic value of 1.6 mag to a maximum of 4.5 mag, with a mean value of 2.650.60 mag. We infer 12411 Wolf-Rayet (WR) stars in SSC-A using the He ii broad feature and =2.3 mag. The He+ ionizing photon rate from these WR stars is sufficient to explain the luminosity of the He ii nebula. The observationally-determined total He+ and H0 ionizing photon rates, their ratio, and the observed number of WR stars in SSC-A are all consistent with the predictions of simple stellar population models at an age of 4.00.5 Myr, and mass of (5.5) M⊙. Our observations reinforce the absence of WR stars in SSC-B, the second most massive cluster in the FoV. None of the other locations in our FoV where He ii emission has been reported from narrow-band imaging observations contain WR stars.
keywords:
stars: emission-line – galaxies: star clusters – galaxies: individual (NGC 1569)1 Introduction
Availability of large telescopes equipped with integral field spectrographs has enabled the creation of maps of He ii nebular emission in nearby star-forming galaxies (e.g. Kehrig et al., 2015, 2018). Given that only photons shortward of 228 Å (54 eV) can doubly ionize helium, the He ii line provides a ground-based tool to trace the hard part of the ultraviolet (UV) spectrum. High mass stars, especially during their short-duration Wolf-Rayet (WR) phase, are the most common sources that emit these hard UV photons (Schaerer, 1996). The UV flux emerging from a starburst region depends both on the hardness of the UV spectrum of WR stars as well as on the number of WR stars present. Because of the presence of an expanding atmosphere, models incorporating specialized line-blanketing treatment are required in order to quantitatively predict the flux of hard UV photons emitted by the WR stars. The emergent spectra in models incorporating such treatment (e.g. Hillier & Miller, 1998; Gräfener, Koesterke & Hamann, 2002) are found to be softer as compared to earlier models that did not take into account opacities from metals (Schmutz, Leitherer & Gruenwald, 1992). On the other hand, the number of WR stars and the duration of the WR phase in a starburst region depend on metallicity (e.g. Maeder & Meynet, 1989; Schaller et al., 1992; Bressan, Chiosi, Fagotto, 1994; Chen et al., 2015), stellar rotation (Meynet & Maeder, 2005) and the stellar multiplicity (Eldridge et al., 2017). The calculated rate of He+ ionizing photons at different metallicities depends critically on the mass-loss recipes used during massive star evolution. The general trend from the different set of currently available codes is a decrease in the expected luminosity of the He ii line with decreasing metallicity.
The spectra from Sloan Digital Sky Survey (SDSS) have enabled the detection of the relatively faint He ii line in large samples of star-forming galaxies (e.g. Shirazi & Brinchmann, 2012). These studies find that the observed He ii /H intensity ratio does not drop at low metallicities. In fact, recent studies find the ratio to be increasing as the metallicity decreases (Schaerer, Fragos & Izotov, 2019). Furthermore, these low-metallicity He ii -emitting galaxies often show only a weak or no evidence of the presence of WR stars (Shirazi & Brinchmann, 2012). Thus, questions have been raised on the WR stars as the sole source of ionization of He+ (Plat et al., 2019). Alternative mechanisms such as hard radiation from high-mass stars in binaries (Eldridge et al., 2017), shocks from supernova remnants (Garnett et al., 1991; Dopita & Sutherland, 1996) and high-mass X-ray binaries (HMXB; Schaerer, Fragos & Izotov, 2019; Kojima, et al., 2020) are often invoked. Nearby low-metallicity systems offer an opportunity to address the He+ ionization problem by enabling study of individual star-forming knots. In a detailed study of the metal-poor (Z=3–4% Z⊙) galaxy SBS 0335 052E using MUSE, Kehrig et al. (2018) discard WR stars as the source of ionization and instead propose rotating metal-free stars or a binary population with and an extremely top-heavy initial mass function (IMF) as the only plausible way of getting around the problem of the ionization budget. In a recent study Schaerer, Fragos & Izotov (2019) find that the observed He ii intensity in metal-poor star-forming galaxies can be naturally reproduced if the bulk of the He+ ionizing photons is emitted by the HMXB, whose number is found to increase with decreasing metallicity. X-ray binaries in a cluster appear only after the death of the most massive stars, and hence this scenario cannot explain the He+ ionization in young systems (H equivalent widths (EWs) 200 Å), as illustrated by Plat et al. (2019).
A detailed analysis of the He ii ionization budget problem has been carried out only in a handful of extreme metal-poor galaxies (e.g. Kehrig et al., 2011, 2018). Lack of observational data of individual massive stars at these low metallicities makes the predictions of population synthesis calculations heavily dependent on the theoretical assumptions. On the other hand, model calculations have been better calibrated at the LMC and solar metallicities. However, its detection requires sensitive observations, specially aimed at detecting faint emission lines. The newly available spectrograph MEGARA at the 10.4-m Gran Telescopio Canarias (GTC), equipped with Integral Field Unit (IFU) at spectral resolution 6000 has the capability of detecting and mapping the faint emission lines from extragalactic nebulae (Gil de Paz et al., 2020). In order to exploit this capability, we carried out MEGARA observations of NGC 1569, a dwarf galaxy with a gas-phase oxygen abundance close to that of the LMC (=8.19; Kobulnicky & Skillman, 1997). We mapped its central region, which is known to have extended H emission (Hodge, 1974; Waller, 1991; Hunter, Hawley & Gallagher, 1993). Throughout this study, we use a distance of 3.1 Mpc, measured using Hubble Space Telescope (HST) observations of the tip of the red giant branch (Grocholski, et al., 2012). This distance is 10% smaller than that obtained by Grocholski et al. (2008) using an earlier analysis of the same dataset, but is still considerably higher than the 2.2 Mpc distance (Israel, 1988) that was being routinely used in studies prior to the Grocholski et al. (2008) work.
NGC 1569 is among the nearest galaxies that harbours young superstellar clusters (SSCs) that are as massive as the Galactic globular clusters. Its most massive SSCs, called A and B, are estimated to have dynamical masses of M⊙ (Ho & Filippenko, 1996) and M⊙(Larsen et al., 2008), respectively (after rescaling the masses to the currently used distance of 3.1 Mpc for this galaxy from Grocholski, et al., 2012). These two SSCs are at the high-mass end of a population of around 50 SSCs, whose ages range from a few million to several hundred million years (Hunter et al., 2000). The H morphology of the galaxy is dominated by H ii regions (Waller, 1991), large-scale shells and superbubbles (Hunter, Hawley & Gallagher, 1993; Westmoquette et al., 2008), with the brightest H ii region in this galaxy associated to the star forming complex surrounding cluster 10 of Hunter et al. (2000) that lies 105 pc (7 arcsec) to the east of SSC-A, and is outside our FoV. Extended X-ray emission is detected in the galaxy, most of which coincides with the H bubbles (Martin et al., 2002; Sánchez-Cruces et al., 2015). Giant molecular clouds have been detected, but none of them are associated to SSCs A and B (Taylor et al., 1999). The largest CO cloud complex in the galaxy lies to the east of cluster 10 outside our FoV.
Long-slit spectroscopic observations have established the presence of WR stars in SSC-A, whereas no WR stars have been detected in SSC-B (González-Delgado et al., 1997). Using narrow-band HST imaging observations with the F469N filter, Buckalew et al. (2000) have inferred the presence of WR features from 5 SSCs, including SSC-A, and 7 individual stars, and nebular emission from three additional point sources. Kobulnicky & Skillman (1997) reported faint He ii nebular emission at some of the locations along the longslits they had used. However, no extended He ii nebular emission has been yet detected in this galaxy. In this paper, we present our results obtained from spectral mapping of the central zone that includes both the SSCs A and B.
In Section 2, we describe the observations and the data reduction. Techniques for separating the He ii emission lines of stellar origin from nebular origin are also detailed in this section. In Section 3, we present the maps in these two components and compare them with the maps available at the HST resolution. Then, Section 4 deals with the calculation of the number of WR stars and the ionizing photon rate of doubly ionized helium. The ionization budget is discussed in Section 5, and our conclusions are given in Section 6. Measured data in individual fibre spectrum are presented in an appendix.
2 Observations, reduction and data analysis
2.1 Observations
Spectroscopic observations of the central part of NGC 1569 (RA=04:30:48.5, DEC=+64:50:55.5) were carried out using the recently available MEGARA instrument at the 10.4-m GTC. MEGARA provides multi-object and integral field spectroscopy at low, medium and high spectral resolutions 6000, 12000 and 20000, respectively, in the visible wavelength interval from 3650 to 9700 Å, through 18 spectral configurations (=Full Width at Half Maximum (FWHM) of a line). The IFU, also named Large Compact Bundle (LCB), covers an area on the sky of 12.5 arcsec11.3 arcsec with 567 fibres for a spaxel size of 0.62 arcsec. To perform simultaneous sky subtraction, the IFU fibres are supplemented by another 56 fibres distributed in 8 mini-bundles of 7 fibres, located at the edge of the field at distances from 1.7 arcmin to 2.5 arcmin from the centre of the LCB. The complete set of 623 fibres is mounted in the LCB spectrograph pseudo-slit. Additionally, a set of robotic positioners host 92 mini-bundles of 7 fibres each, also for a spaxel size of 0.62 arcsec, allowing observations in a field of view (FoV) of 3.5 arcmin3.5 arcmin in the multi-object spectrograph (MOS) mode. These 644 fibres are arranged in a different pseudo-slit interchangeable with the LCB pseudo-slit. For a complete description of MEGARA performance at GTC and the first scientific results obtained during the instrument commissioning, see Carrasco et al. (2018) and Gil de Paz et al. (2018, 2020).
The observations reported here were carried out as part of MEGARA guaranteed time on 2019 February 9th in queue mode under dark sky and photometric conditions. The data were obtained using the IFU mode in combination with the LR-B volume phase holographic grating, centred at 4800 Å, covering the spectral range from 4330 to 5200 Å for a resolution of FWHM=0.78 Å with a reciprocal dispersion of 0.21 Å/pixel. Three 1200 s exposures were taken at airmasses between 1.25–1.30, and seeing 0.9 arcsec. For flux calibration the spectroscopic standard star HR5501 was observed in the same setup as for NGC 1569. Bias, flat field and arc lamp images were also obtained as part of the data package.
2.2 Primary Data Reduction
The primary reduction of the dataset was carried out using the standard MEGARA data reduction pipeline (DRP; Pascual et al., 2018). As described above, MEGARA/IFU data consist of 623 spectra corresponding to 567 object and 56 sky fibres, arranged into groups of multiple minibundles. In the spectral image, these groups are separated by gaps and have progressively smaller number of minibundles as they were built to reconstruct the curvature of the pseudo-slit at the focal plane of the MEGARA spectrograph. Flat-field images are used to trace the locus of each of the 623 spectra using an automatic routine. The routine fits simultaneously 623 Gaussians every 200 columns and then interpolates the parameters of the Gaussian for each spectral pixel. With this information, the routine generates a weight map for every fibre that is applied to the data in order to perform the extraction. The procedure allows correcting the flux of each fibre for cross-talk contamination from adjacent fibres to a level of a few per cent, depending on the quality of the spectrograph focus during the observation and the shape of the spectral PSF for each wavelength and fibre.
A shift along the pseudo-slit axis of the trace locus with dome temperature has been noticed, which needs a correction of the locus for each observed frame. We used sky lines to measure interactively the shifts, which are found to be 2 pixels for the three spectral images used in this work. The final product of the DRP is a wavelength-calibrated, sky-subtracted 2D spectral image. This image contains 623 spectra, one spectrum corresponding to each fibre. The standard star is also reduced in an identical fashion. Spectra of all fibres containing the standard star are summed to extract a 1D spectrum, which is used to obtain the flux sensitivity curve using the iraf111iraf is distributed by the National Optical Astronomy Observatories, which are operated by the Association of Universities for Research in Astronomy, Inc., under cooperative agreement with the National Science Foundation. routines for this purpose. The resulting sensitivity curve is used to obtain the flux-calibrated 2D images in selected spectral lines and the 3D data cube.
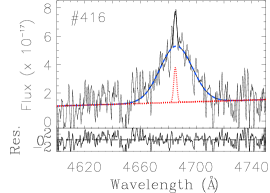
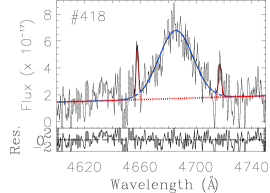
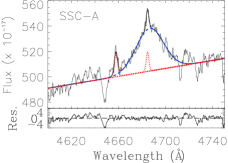
In Fig. 1, we show spectra of 4 fibres illustrating the detection of broad (top two panels) and narrow (bottom two panels) He ii features. The Balmer lines H and H, and the [OIII]5007 Å line are also indicated.

2.3 Line maps, data cube and astrometry
The positions of the fibres in the image plane with respect to the image centre are given in millimeters in the image headers. The 2D spectral image is converted into a 3D data cube using these fibre coordinates. A plate scale of 1.212 arcsec mm-1 and a fibre diameter of 0.62 arcsec were used to transform the image coordinates from cartesian to equatorial systems. To create a map at any sampled wavelength (or a selected band corresponding to a line or a continuum region), we deposited the flux at that wavelength into hexagonal areas (the hexagonal spaxel is inscribed in a circle of 0.62 arcsec diameter), which correctly simulates the FoV of each fibre on the sky. Alternatively, to visualize extended emission, we also created smooth images by depositing the flux of a fibre into a highly oversampled pixel (size=0.021 arcsec) and then convolving it with Gaussian kernel of =half the fibre size (0.31 arcsec). Finally, the World Coordinate System header parameters were updated to force the RA and DEC of SSC-A to their values (RA=04:30:48.233, DEC=+64:50:58.59) in the GAIA-DR2 system. After creating the image, we measured a mean coordinate error of 0.3 arcsec for different sources in the resulting image.
We used the QFitsView facility (Ott, 2012) for a quick visualization of the datacube and inspection of spectral features associated to known structures in the image. However, all analysis were carried out on the spectrum of an individual fibre or a sum of spectra of neighbouring fibres associated to a physical source. A datacube from the 2D spectral data was constructed using megararss2cube222megararss2cube is a tool written in python to convert MEGARA reduced dataproducts from the RSS format obtained with megaradrp to a more user-friendly 3-D datacube, available as a repository in GitHub: https://github.com/javierzaragoza/megararss2cube, whereas the generation of line maps and their astrometry, extraction of spectra for physical regions and measurement of line fluxes were all carried out using our own scripts333MEGARA-related iraf scripts are available on request to the first author. in the iraf environment.
We calculated the error as the 1- deviation, , on each measured
line flux using the expression (Tresse et al., 1999):
| (1) |
where is the spectral dispersion in Å per pixel, is the mean standard deviation per pixel of the continuum, is the number of pixels covered by the line, and EW is the equivalent width of the measured line. We used the value of FWHM to substitute for .
2.4 Ancillary Data
We used HST images in F555W (ACS/HRC), F814W (ACS/WFC), F658N (ACS/WFC) and F469N (WFPC2) bands to associate our spectra to known structures in the image. All the HST images were brought to GAIA-DR2 coordinate system using the GAIA stars in the HST images. The first two images allow us to locate the stars and clusters, whereas the latter two trace the H and He ii emitting sources, respectively. We used the identifications of the SSCs by Hunter et al. (2000) and WR and nebular He ii sources by Buckalew et al. (2000). We also used the Chandra/ACIS X-ray image in the 0.2–10 keV band from Sánchez-Cruces et al. (2015) in order to locate the point and diffuse X-ray sources with respect to the optical sources.
3 Detection of WR and nebular He ii emission
A simple visual inspection of the 2-D spectral image suggested the presence of a feature around 4686 Å in many fibre spectra. Gaussian profile fitting of this feature suggested that in most cases, the feature is narrow with FWHM1–2 Å, comparable or slightly above the resolution of the spectrograph. In some other fibres, the feature is broad with FWHM6 Å. These narrow and broad components are illustrated in the bottom two and top two spectra in Fig. 1, respectively. The narrow feature is easily identified as the He ii emission line from the ionized nebula, whereas the broad component is identified as the blue bump (BB), which is the distinguishing characteristic of WR stars. The BB is a broad spectral feature between 4600 to 4700 Å, and consists of broad lines of He and/or N ions from nitrogen-rich WR stars (WN-types), or He and/or C ions from carbon-rich WR stars (WC-types). Among these, the prominent N and C lines are N iii , N v , C iii and C iv. WC stars, and hence lines from C ions, are generally absent in low-metallicity environments (see e.g. figure 8 in López-Sánchez & Esteban, 2010). Additionally, nebular lines He i , He ii and [Fe iii] can also contribute to the BB. Some spectra showed both narrow and broad He ii features, which required an analysis using multi-Gaussian fitting for the recovery of each component.
Another factor that affects the measurement of fluxes of relatively faint lines is determining the precise shape of the continuum, which requires a signal-to-noise ratio (SNR) of at least 10 in the continuum on either side within 100 Å of the line of interest. In most continuum-weak fibres this condition is not met. For example, the SNR of the continuum in the bottom three spectra in Fig. 1 is 5 at 4400 Å to 9 at 4800 Å. On the other hand, the top spectrum, which belongs to SSC-A, has a minimum SNR of 23 at 4400 Å, increasing to 43 at 4800 Å. Stellar absorption lines, most of which are reported by González-Delgado et al. (1997) for SSC-A, can be seen in the top-most spectrum.
3.1 Multi-component Gaussian decomposition of the blue bump
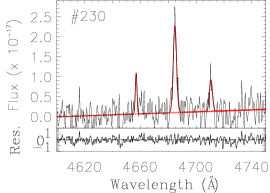
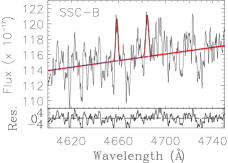
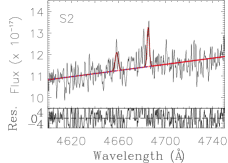
It is well established that the individual lines that contribute to the BB can be extracted from multi-component Gaussian decomposition technique (see e.g. Brinchmann, Kunth & Durret, 2008). We hence carried out multi-Gaussian decomposition fittings using a custom-made code which uses the idl routine lmfit444The lmfit function (lmfit.pro) does a non-linear least squares fit to a function with an arbitrary number of parameters. It uses the Levenberg-Marquardt algorithm, incorporated in the routine mrqmin of Numerical Recipes in C (Press et al., 1992).(see Gómez-González et al., 2020). Before fitting multiple Gaussians, a continuum level is defined for each spectrum in a two-step procedure. First, a large-scale continuum is defined for each spectrum using the task continuum in iraf, by fitting a high-order polynomial (spline3, order=11) passing through carefully chosen line-free bins in the entire wavelength range of the observed spectrum. Second, any residual local continuum around the BB is accounted for by linearly interpolating line-free zones on either side of the BB. Two of the 3 parameters, the peak intensity and the line width that define each Gaussian, were left free. Any line with a FWHM Å is defined as a broad line associated to a WR star. The third parameter, , is assigned to the rest wavelength of one of the expected lines from WR stars. The fitting program is executed interactively, where the bright nebular lines are fitted first, followed by the He ii broad component. Residuals are examined for a peak near any of the expected line wavelength. If present, a second broad line is fitted and residuals are re-examined. While fitting this second line, the and of the first line were left free. The process continues examining the residuals and adding a new line until the residual flux is less than 3 times the root-mean-square (RMS) noise of the spectrum. In the iterative process, any faint nebular lines are fitted, if needed. The method is able to recover the He ii components from WR (broad) and nebula (narrow) even when both are present in a single spectrum. Fig. 2 illustrates the multi-Gaussian fits for spectra from 3 individual fibres that require both a broad and a narrow He ii line (left), only a broad line (middle) and only the narrow line (right). None of our fibre spectra showed broad lines from nitrogen or carbon ions. A feature is recovered in many fibres at =4658 Å (see the spectra in the middle and right panels), which matches the wavelength of the C iv (broad) feature. However, the width of this line is comparable to that of nebular lines, and hence we identify this feature with the nebular (narrow) line [Fe iii] .
We used the fitting program to automatically identify broad and narrow He ii features in each of the 567 spectra. As mentioned above, the flux at the peak of the fitted Gaussian should be at least 3 times the noise level for it to be considered a detection. The narrow component, which is of nebular origin, is detected in 262 of these fibres and the broad component, in 50. Twenty five of the spectra showing a broad component have an associated narrow component, whereas the remaining 25 show only a broad component.
3.2 Location of fibres with WR features
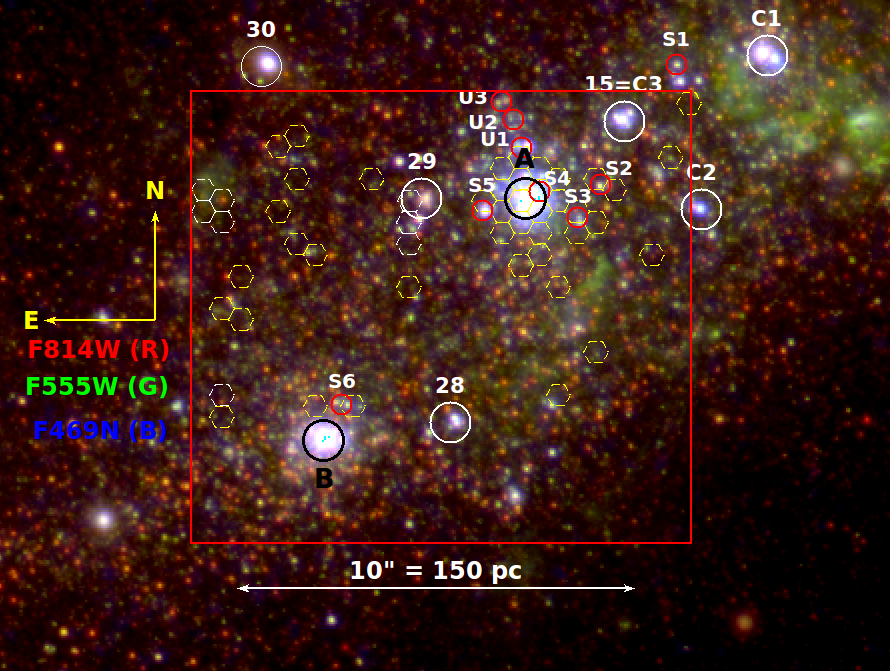
In Fig. 3, we show the positions of all the 50 individual fibres with broad He ii detections (hexagons555See Fig. 12 in the appendix for the identification numbers of each fibre.), overlaid on an RGB colour-composite image formed by HST images in F814W, F555W and F469N filters, shown as red, green and blue colours, respectively. This set of images was chosen in order to highlight the candidate WR stars, which are expected to be continuum-bright sources with He ii -excess. The red and green images having been taken using broad bands, trace continuum sources, whereas the blue image traces sources that have contribution from emission lines in the 4650–4720 Å range. The He ii line is the most likely contributor to this image, but as the spectra in Fig. 2 illustrate, nebular lines [Fe iii] and He i 4713 could also contribute in this filter. Thus, blueish-looking continuum-bright sources in this image are the likely WR candidates. Buckalew et al. (2000) used the F469N image in combination with continuum and nebular images to identify WR candidate sources. They classified these as cluster, stellar, and unknown origin sources, and named them as C1 to C4, S1 to S6, and U1 to U3 sources, respectively, which are all identified in the figure. In addition, we identified stellar clusters catalogued by Hunter et al. (2000) (numbers 15, 28, 29 and 30) and the two well-known SSCs A and B in the figure. Cluster C4, which lies just outside our FoV and is identified as cluster 10 by Hunter et al. (2000), is the ionizing cluster of the brightest H ii region in this galaxy.
The presence of the He ii broad component is the characteristic signature of a WR star. However, given that our observations were carried out at 0.9 arcsec seeing and the fibres cover a diameter of 0.62 arcsec, several adjacent fibre spectra should also show up the broad feature in order to associate the inferred feature with the detection of a WR star. Out of the 50 fibres where we inferred He ii broad component, 18 contiguous fibres are associated to SSC-A. Some of these fibres could be associated to candidate stellar sources S3, S4 and S5, which are located within the seeing-convolved image of SSC-A.
Of the remaining detections, we infer two locations with four (#417, 419, 421, 423; on the top-left) and three (#145, 149, 153; on the top-middle) contiguous fibres, associated to them. However, a careful scrutiny of the fibres associated to these locations revealed that these fibres are physically next to one of the 18 fibres belonging to SSC-A on the psuedo-slit, and hence the detected broad bump is likely arising due to residual cross-talk from SSC-A. Hence, we ignore the detections in these seven fibres. The rest of the inferred He ii broad component corresponds to 25 single-fibre detections, scattered all over the image. One of these detections (#413) is due to cross-talk with SSC-A. Of the remaining detections, two coincide with the previously reported candidate stellar sources S2 and S6. If these single-fibre detections come from real sources, spectra extracted by summing spectra of fibres adjacent to the location of these fibres also should show a broad He ii feature. We carried out the Gaussian decomposition of the BB with the specific purpose of detecting these broad features in spectra obtained by summing spectra of at least 3 fibres around the one where we detected the broad feature. None of these summed spectra around the 25 single-fibre detections showed a broad component. Uncertainty in defining the continuum is the likely reason for the feature to vanish in summed spectra in spite of them being detected, i.e. the peak flux of the fitted broad (FWHM6 Å) Gaussian profile is 3 times the RMS error of the continuum, in individual fibre spectra. The spectrum for fibre #49 in Fig. 1 is one such example. Deeper observations would be required to ascertain the nature of these sources. We consider these detections as marginal and in §4.3 we compare their fluxes to that expected from typical WNL-type WR stars.
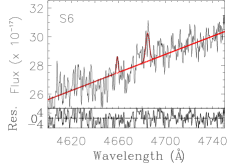
The summed spectra allow us to understand the reasons why Buckalew et al. (2000) interpreted the observed excess emission in the HST/F469N band in C3, S2 and S6 as originating in WR stars. It may be recalled that imaging observations cannot distinguish between the narrow and broad components. Buckalew et al. (2000) assumed it to be a WR detection, if the position of a star or cluster coincides with the position where an excess flux is detected in the F469N band. This selection criterion does not contemplate the presence of extended He ii nebular emission. As we discuss in detail below, we have detected extended He ii nebular emission in the central zone of NGC 1569. Objects C3, S2 and S6 are stellar sources in which we detect narrow nebular He ii and [Fe iii] lines in our spectra (see the bottom three spectra in Fig. 4). The narrow lines are not originating in the stellar sources, and are instead part of the extended nebular emission. At the location of the three sources of unknown origin (U1, U2 and U3), we detect only narrow He ii line; these sources are also part of the extended nebula.
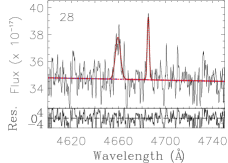
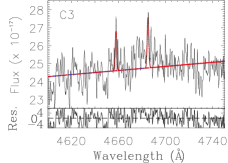
Our spectral data are used to infer the WR population in known clusters in our FoV. Apart from SSC-A, where we already demonstrated the presence of WR stars, our FoV includes clusters SSC-B, 28, 29, and C3. Among these, previous spectroscopic observations have already ruled out the presence of WR features in SSC-B (e.g. González-Delgado et al., 1997). No WR stars were inferred in F469N images by Buckalew et al. (2000) from sources 28 and 29, whereas C3 is a candidate WR cluster. We extracted spectra around all these sources, as well as for SSC-A (C4), by adding spectra of 7 fibres around the location of these clusters. Unfortunately, cluster 29 spectrum suffers from cross-talk problem as several of its fibres are adjacent to some of the fibres of SSC-A on the pseudo-slit. We hence did not carry out an analysis of search for WR stars in this cluster. Multi-Gaussian analysis was carried out on these summed spectra, which are shown in Fig. 4. These fits establish the presence of WR features in summed spectra of SSC-A, and their absence in SSC-B, 28 and C3. The figure also shows (last two panels) the results of the fits to the summed spectra for S2 and S6. Given the closeness of these sources to SSC-A and SSC-B, respectively, we summed spectra of only 3 adjacent fibres in these cases. The broad He ii component is not recovered in these summed spectra.
3.3 He ii nebular morphology
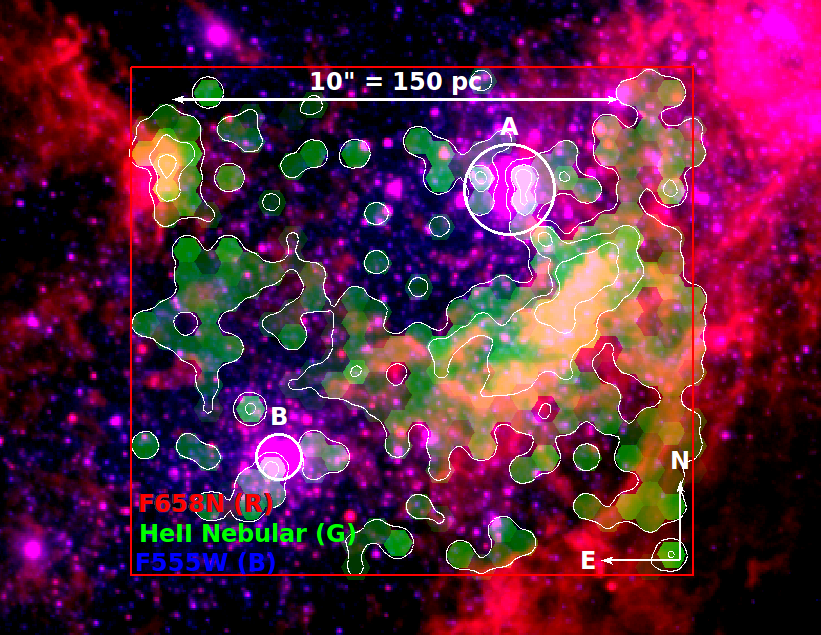
We now discuss the results obtained by muti-Gaussian fitting to recover the He ii nebular line. Unlike the broad component, the narrow He ii line, which is of nebular origin, is detected in nearly half of the total fibres. The fibre fluxes and locations are used to create a map, which is shown in Fig. 5 as the green component of the RGB image. The HST images in F658N (H + continuum) and F555W bands are used for the red and blue components, respectively. These latter images help us to see the large-scale distribution of ionized gas and stars at the HST resolution. Contours corresponding to He ii nebular line surface brightness of 3, 12 and 20 erg cm-2 s-1 arcsec-2 are shown.
Clearly the He ii narrow emission is not confined to a few point sources, but instead is part of an extended nebula. This emission is distributed along a semi-circular arc of 150 pc (10 arcsec) diameter. The brightest part of the He ii nebula lies to the south-west of SSC-A at a distance of 40 pc (2.5 arcsec). This brightest part is also the zone closest to SSC-A, where there is an increase in the H surface brightness, and corresponds to the H ii region numbered 3 by Waller (1991). The nebular arc is widest near this zone, reaching 40 pc width. The centre of the semi-circular arc does not coincide with SSC-A, and instead is shifted to the east of it by 40 pc, roughly coincident with cluster 29. Unfortunately our FoV does not cover the northern part, hence we cannot conclude whether the observed arc is part of a complete circular nebula or not. There is no evidence for arc-like structure in the H image on the northern side, nor any of the ionized superbubbles (sb) identified by Sánchez-Cruces et al. (2015) match our He ii emitting segment or its possible northern counterpart. This can be due to the lower sensitivity of Fabry-Pèrot images presented by Sánchez-Cruces et al. (2015) in comparison to the HST images. The He ii emitting segment lies between the superbubbles classified as sb4, sb5, sb6 and sb7. The He ii nebular emission is weak in the immediate vicinity of SSC-A and SSC-B.
By mapping the He ii nebular emission we can obtain the total flux in this line, and from this, the ionization requirements. The data need to be corrected for extinction from dust along the line of sight in the Galaxy as well as the dust in NGC 1569, before we can carry out these calculations. The availability of the extinction-sensitive Balmer lines H and H in our dataset allows us to obtain the extinction from each fibre spectrum. We describe the procedure adopted for extinction correction in the next section.
4 Extinction-corrected number of WR stars and the He ii ionizing photon rate
In this section, we present the extinction map of the zone covered by our IFU observations, and obtain the He ii luminosity of the broad and narrow lines, corrected for extinction. The luminosity in the broad component is used to calculate the number of WR stars inferred from our observations, whereas the luminosity in the narrow component is used to obtain the He+ ionizing photon rate. We used the emission line intensities of Balmer lines (H and H) in our IFU spectra to create maps of the ionized nebula and extinction. We note that the stellar continuum of unresolved populations, in general, experiences lesser amount of attenuation as compared to that experienced by the ionized gas (Calzetti, Kinney & Storchi-Bergmann, 1994; Mayya & Prabhu, 1996). Hence, the number of WR stars derived after correcting the broad component luminosity for nebular extinction could be an over-estimate.
4.1 Extinction map of the observed zone
In §3.1, we described the procedure we followed for decomposing the narrow and broad components of the He ii feature. We measured the fluxes and related quantities of H and H nebular lines in each fibre spectrum using the single Gaussian fitting option of the IRAF task splot in batch mode. The line fluxes in each fibre are then transformed into maps using the procedure described in §2.3.
H and H emission fluxes were used to obtain the extinction from each fibre spectrum, where both of these lines were detected, using the Balmer decrement method for case B recombination of a typical photoionized nebula (=10000 K, =100 cm-3; Osterbrock & Ferland, 2006) and the reddening curve of Cardelli, Clayton & Mathis (1989). Only spectra with a SNR of at least 3 in both the lines are used. The H line is detected at SNR7 in all the 567 fibres. This line is well-resolved with the FWHM of the fitted Gaussian varying between 1 and 2 Å. Some spectra clearly showed signs of more than one velocity component. In 86% of these spectra (487), the H line is also detected at SNR, enabling measurements in all these spectra. The resulting values along with the errors are given in the last two columns of Table 2. However, all measurements are not reliable. A source of error in the derived is the uncertain correction of the underlying absorption in H and H lines. We used a uniform 1 Å of correction in EW proposed by González-Delgado et al. (1997) for both the H and H lines. The underlying absorption affects spectra at locations where we detected strong continuum, some of which belong to the WR stars. Thus, it is reasonable to use the obtained for continuum-weak, or alternatively high EW, spectra for carrying out fibre-to-fibre corrections. As H is the more critical of the two lines in measurements, we used only those spectra that have EW(H)8 Å. This left us with the best 106 measurements of . The resulting values are plotted against the SNR of the H line, which is the fainter of the two lines used for determining extinction, in Fig. 6. The estimated error on each measurement is shown, which is typically 0.5 mag. These error bars do not take into account errors introduced by the uncertain correction for the underlying stellar absorption, e.g. the values would be 0.2 mag higher or lower depending on no correction, or correction of 2 Å (instead of the assumed 1 Å), respectively.

Devost, Roy & Drissen (1997) obtained using H and H lines for 16 zones spread over the entire galaxy. They found all zones have 1.6 mag, with the minimum value corresponding to a zone in an ionized bubble, which is outside our FoV. They proposed that this minimum value corresponds to the extinction from the Galactic dust along the line of sight to NGC 1569. Grocholski, et al. (2012) obtained a marginally higher value (=1.8 mag) using an analysis of the red giant branch of the resolved stellar population in the outer disk of the galaxy. There are many independent measurements of the Galactic extinction in the direction of NGC 1569. Using the line of sight HI observations, Burstein & Heiles (1984) and Schlegel, Finkbeiner & Davis (1998) obtained values of =2.03 mag (equivalent to =1.55 mag) and =2.3 mag, respectively. Israel (1988) and Origlia et al. (2001) analysed the UV spectra of NGC 1569 and suggested a foreground extinction of =1.7 mag. More recently, Schlafly & Finkbeiner (2011) obtained a value of =1.9 mag based on the colour excess of Sloan Digital Sky Survey (SDSS) stars that have spectroscopic data.
All these values, with the exception of one (Schlegel, Finkbeiner & Davis, 1998), are compatible with a Galactic extinction value of =1.6 mag proposed by Devost, Roy & Drissen (1997) after taking into account measurement errors. We show this lower limit by a dashed line in Fig. 6. Ninety per cent of our measurements are above this line. Nine of the 11 measurements below this line are consistent with =1.6 mag if we calculate without any absorption correction. Thus, taking into account external errors, our data are in agreement with a minimum =1.6 mag proposed by Devost, Roy & Drissen (1997). The rest of the H ii regions observed by Devost, Roy & Drissen (1997) have a mean value of =2.26 mag, implying an average internal extinction of 0.66 mag for NGC 1569. We obtain a mean =2.650.60 mag for 95 spectra having 1.6 mag. This implies an average internal extinction of 1.05 mag for the zone covered by our observations.
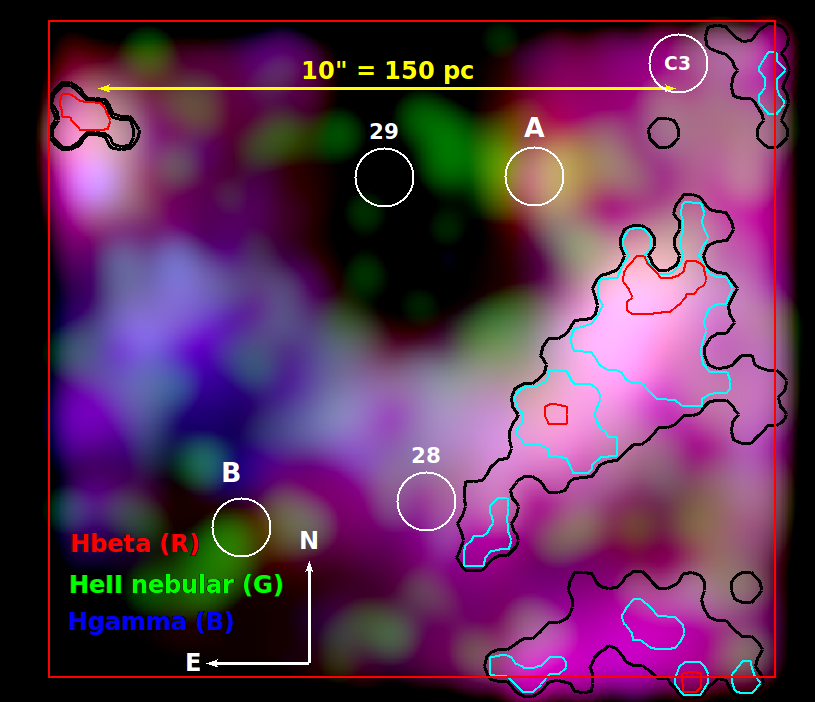
We used the values obtained in these 95 fibres to create an extinction map, whose contours are shown in Fig. 7, overlaid on a nebular colour-composite image, formed by combining H, He ii and H images as red, green and blue components, respectively. All the three nebular images are smoothed using a Gaussian kernel of 0.31 arcsec following the procedure described in §2.3. As the H to H ratio is sensitive to extinction, the colour in the image is expected to change from blue to red as extinction increases. The zone with the highest He ii nebular surface brightness (south-west of SSC-A) is also the zone with the highest , reaching values 4 mag. Extinction smoothly decreases from this point towards the south-east, reaching the Galactic values of =1.6 mag at the boundaries of the detected zone. High extinction is also inferred from the zone with weak nebular emission in the bottom-right corner of the image, and a zone at the top-left corner of the image. Nebular lines are weak in almost all continuum-bright regions, including in SSC-A, which prevented us from determining for these sources. We have assigned the Galactic values of =1.6 mag to all regions outside the black contours, where could not be reliably measured. Fig. 7 also allows us to compare the large-scale morphology of He ii nebula (green) with that of the ionized gas traced by Balmer lines at the same resolution. The H ii gas is also distributed along the semi-circular arc traced by the He ii nebula, both showing a clear hole in the central zone of their intensity distributions.
4.2 Total He ii ionizing photon rate
The availability of an extinction map allows us to apply fibre-to-fibre extinction corrections. We used a uniform value of =1.6 mag to all spectra where could not be measured reliably. Summing all these fluxes, we obtain a total He ii flux of erg cm-2 s-1. This corresponds to a L(He ii ) of erg s-1 and a Q(He+) of photon s-1 using the basic photo-ionization equation from Osterbrock & Ferland (2006),
| (2) |
| (3) |
where , is the energy of the He ii photon, and and are case-B recombination coefficients. We used the and assuming reasonable =10000 K and =100 cm-3 for the nebula. The calculated Q(He+) would change by less than 10% for the entire range of and covered by the photoionized nebulae (Kehrig et al., 2015).
The total extinction-corrected H flux from the same regions is
erg cm-2 s-1. This is equivalent to a Lyman continuum rate
Q(H0) of photon s-1, using an equation similar
to equation 2 but for Q(H0), which is
| (4) |
where is the luminosity of the H line. The above equations result in the ratio
| (5) |
The luminosity of He ii corresponds to 2.05% of the H luminosity, which results in a value of Q(He+)/Q(H0)= 0.01000.0002.
The emission EW of H of a starburst population is a well-known age indicator. For unresolved regions, it is one of the quantities easiest to obtain from spectroscopic data. Furthermore, it is independent of extinction as long as the ionizing cluster and the nebula are spatially coincident, or there is no differential extinction between cluster stars and nebula. However, in a resolved nebula such as the one discussed here, determination of EW(H) is non-trivial. As the ionized nebula is spatially separated from the ionizing cluster, we made the assumption that the photoionization from SSC-A is responsible for the total observed H flux. With this assumption, we divided the observed integrated H flux by the continuum flux in the integrated spectrum of SSC-A (displayed in Fig. 4), measured close to the H line. We obtained EW(H) under three assumptions. The first one is that the ratio is independent of extinction. In the second case, the continuum flux is corrected by =2.3 mag, and the H flux is corrected for the extinction determined by the Balmer decrement method. In the third case, the same H flux correction was used, but the continuum flux was corrected by making use the minimum extinction of =1.6 mag. The three assumptions give values of 75 Å, 75 Å, 160 Å, respectively.

4.3 The number of WR stars in the mapped zone
While fitting the BB with multi-Gaussians, we have looked for N (N iii ) and C (C iii and C iv) broad lines in addition to the broad He ii feature. In all spectra, including that of SSC-A, only one broad component was required, which is the He ii line. In some spectra, a nebular [Fe iii] line is seen at the expected broad C iv line, where our fitting procedure would have been able to recover a broad feature even in the presence of an overlying narrow line. The absence of any of the C lines points to the absence of WC stars in the observed zone. Previous observations of SSC-A that had covered the red bump (C iv ) part of the spectrum had already indicated the absence of WC stars (González-Delgado et al., 1997), which is not unusual given that its metallicity is lower than solar (López-Sánchez & Esteban, 2010). Thus, we conclude that all our detections originated in WN stars. The relative weakness of N iii suggests these are WNL stars.
We now estimate the number of WR stars in each of the fibres where the broad He ii feature was detected in single-fibre spectra. As pointed out in §3.2, 18 of these fibres belong to SSC-A, and 8 other fibres are in cross-talk with fibres belonging to SSC-A. Single-fibre detections in rest of the fibre spectra are considered tentative, as the detected broad feature could not be recovered by summing spectra of neighbouring fibres. The number was estimated by dividing the observed luminosity in the He ii broad feature by the typical luminosity of a WNL star which is 1.22 erg s-1 (López-Sánchez & Esteban, 2010) for the metallicity of NGC 1569. This value is 30% smaller than the corresponding value at the Solar metallicity (Vacca & Conti, 1992). The observed luminosities of the He ii broad feature in each fibre need to be corrected for extinction. As discussed above, the values derived at the positions of WR stars are highly unreliable, because of low nebular flux and high underlying Balmer absorptions at these locations. Larsen et al. (2011) found the colours of the resolved stellar population of SSC-A to be consistent with =2.3 mag. This suggests that the internal extinction of the cluster stars is 0.35 mag lower than the mean value of the nebula, as expected for an attenuation law like the one proposed by Calzetti, Kinney & Storchi-Bergmann (1994). Hence, =2.3 mag seems the most appropriate value to use to correct the fluxes of the He ii broad feature from SSC-A. We hence calculate the number of WR stars using this optimum value =2.3 mag. We also calculate the minimum and maximum number corresponding to =1.6 mag and =2.65 mag, respectively.
In Fig. 8, we show the estimated number of WR stars in each fibre where the broad He ii feature is inferred, including those fibres with tentative detections. The solid symbols joined by solid lines indicate the number using the optimum value for SSC-A of =2.3 mag, whereas the other two lines correspond to minimum (=1.6 mag, triangles joined by dotted lines) and mean nebular (=2.65 mag, circles with dotted lines) extinction. Fibres assigned to SSC-A are identified (red shaded area), as well the 8 fibres that are affected by cross-talk with SSC-A (black diagonal hatched area). With the optimum value of =2.3 mag, all the fibres associated to SSC-A have the luminosity of at least 1 WNL star, with one of the fibres (#418) containing as many as 19 WNLs. This fibre belongs to the core of SSC-A. In total, we find 124 WNL stars in SSC-A by adding the numbers in each one of the 18 fibres, where the quoted error assumes poissonian statistics. This number agrees with the corresponding number obtained by fitting the multi-Gaussian on the spectra summed over 19 fibres covering the SSC-A. Detected fluxes correspond to 56 and 186 WNL stars if we adopt =1.6 mag or =2.65 mag, respectively. The uncertainty in the modeling of the extended wings of the spatial profile of the PSF of the fibres for those SSC-A spaxels where the WR bump is detected might lead to an underestimation to the total number of WR stars in SSC-A that could be of the order of a few per cent. Among the other single-fibre detections, only sources belonging to fibres #49 and #51 have at least one for 2.3 mag. Detected fluxes in the rest of the fibres are less than the flux expected for a WNL star. As discussed in §3.2, these detections were considered as tentative due to the non-recovery of the broad component in spectra obtained by summing spectra of neighbouring fibres.
González-Delgado et al. (1997) have estimated the number of WR stars in SSC-A from their long-slit spectroscopic data assuming an =1.6 mag. Using an older distance estimate of 2.2 kpc, and luminosity of a WNL star of 1.7 erg s-1 from Vacca & Conti (1992), they estimated 24 WNL stars from their spectra, which corresponds to 66 WNL stars for the values used in our work. Our value for =1.6 mag is comparable with this value. On the other hand, the number of WR stars estimated based on the HST narrow band image in the F469N filter by Buckalew et al. (2000) is 5119 (=1.6 mag, distance = 2.2 kpc) WNL stars, which corresponds to 141 WNLs for the distance and WNL luminosity used in our work. This is 2.5 times higher than our value. As noted earlier (see Fig. 4 for SSC-A), nebular lines are weak for SSC-A, and hence it is unlikely that this discrepancy comes from the contribution of the nebular lines (e.g. He ii , He i4713 and [Fe iii] ) to the inferred flux in the F469N filter. Residual error in continuum subtraction because of the strong continuum of SSC-A could be the most likely reason for the overestimation of the number of WR stars.
5 The ionization budget of He ii
5.1 Ionization by WR stars
The region of NGC 1569 analyzed in this work is dominated by the SSCs A and B in continuum light (Arp & Sandage, 1985). Prada, Greeve & McKeith (1994) inferred the presence of Red Super Giants (RSGs) in both the SSCs A and B. SSC-A is made of two components, separated by 0.2 arcsec (3 pc), called A1 and A2 by De Marchi et al. (1997). González-Delgado et al. (1997) found spectral features characteristic of both the WR stars and RSGs in their ground-based long-slit spectra of SSC-A. Origlia et al. (2001) analysed HST UV spectra of SSC-A and suggested that the RSGs and WR features are orginiated in A1 and A2 components, respectively, with the age of the latter component not exceeding 5 Myr. Larsen et al. (2011) carried out photometry of the stars in the periphery of the clusters A and B on the HST images to obtain turn-off ages in the colour-magnitude diagram (CMD). They found RSGs in the CMD of SSC-B, but not in SSC-A. If the RSGs are restricted to the A1 component as Origlia et al. (2001) suggested this implies this component is centrally concentrated and the stars in the periphery are part of A2, the younger of the two sub-clusters. Based on the absence of RSGs in the CMD, they derived an upper age limit of 4.5 Myr for this component. On the other hand, they obtained an age of 16 Myr for SSC-B. Thus, at present SSC-A is in the WR phase, when a cluster is most efficient in producing He ii ionizing photons. We point out that the bright H emission seen at the top-right corner of the image presented in Fig. 5 is due to ionization by cluster 10 (Westmoquette et al., 2007), which coincides with WR cluster C1 of Buckalew et al. (2000). We here investigate whether SSC-A alone is capable of producing the observed luminosity of the He ii nebular line.
The principal sources of He ii ionizing photons in young stellar systems are O stars and their evolutionary products, such as WR stars. These stars have extended atmospheres with high mass-loss rates, hence a calculation of the rate of He ii ionizing photons has to take into account the radiation transfer through these atmospheres. In recent years, such spectra are available from CMFGEN code (Pauldrach, Hoffmann & Lennon, 2001; Hillier & Miller, 1998; Smith, Norris, Crowther, 2002) for O and WR stars, and from the Potsdam PoWR library (Gräfener, Koesterke & Hamann, 2002) for WR stars. We compared our observed values with publicly available Simple Stellar Population (SSP) models that have incorporated either CMFGEN or PoWR spectra in their codes. Calculations are available at discrete values of metallicity. The gas-phase oxygen abundance of NGC 1569 corresponds to Z=0.006 for a depletion of 30% of oxygen on to dust grains and assuming [O/Fe]=0.0 (Gutkin, Charlot & Bruzual, 2016). We illustrate the results for models using Z=0.008, which is the closest metallicity to that of NGC 1569, and comment on the metallicity dependence of the obtained results. A summary of the Z=0.008 models we used is given in Table 1.
| SSP code ID | WR model + atmosphere | I(He ii)/H | WR phase | EW(H) | Q(H0) | Comments | ||
| age | peak | age | log | |||||
| Myr | log | Myr | Å | ph s-1 | ||||
| (1) | (2) | (3) | (4) | (5) | (6) | (7) | (8) | (9) |
| SB99/Padova | Padova1994+CMFGEN | 3.5 | 1.20 | 3.3–4.9 | 123 | 278–88 | 52.03 | Good fit |
| SB99/Geneva | Geneva1994+CMFGEN | 5.3 | 2.45 | 3.2–4.4 | 155 | 157–85 | 51.98 | I(He ii)/I(H) too low |
| PopStar/Padova | Padova1994+CMFGEN | 4.0 | 1.61 | 3.5–4.5 | 106 | 165–84 | 51.95 | Good fit |
| BC03/Padova | Padova1994+PoWR | 4.0 | 1.03 | — | — | — | 52.13 | Good fit |
| C&B/Padova | Padova2015+PoWR | 4.2 | 2.10 | 3.3–4.2 | 89 | — | 52.10 | Marginal fit |
| BPASS/single | Cambridge+PoWR | 3.2 | 4.03 | 4.0–5.0 | 80 | 180–110 | 52.02 | I(He ii)/I(H) too low |
| BPASS/binary | Cambridge+PoWR | 16 | 2.89 | 4.0–16 | 124 | 195–19 | 52.08 | I(He ii)/I(H) too low |
| SSC-A | Observed or inferred | 1.69 | 4.0 | 124 | 75 | 52.00 | M⊙ | |
| 56–186 | 160 | |||||||
(1)–(2): Model name, evolutionary tracks and WR atmospheric models used (Padova1994=Bressan, Chiosi, Fagotto 1994; Geneva1994=Meynet, et al. 1994; Padova2015=Chen et al. 2015). Last row contains observationally inferred quantities. The tracks used in PopStar is a modified version of Padova1994 tracks as described in Mollá, García-Vargas & Bressan (2009); (3) age at which nebular I(He ii )/I(H) ratio is maximum; (4) maximum value of I(He ii )/I(H) in the model in log units; (5) The age interval over which the model has more than the observationally estimated minimum number of 56 WR stars, for the determined mass. The last row contains the age range over which models using Padova tracks reproduce the observed I(He ii )/I(H); (6) The maximum number of WR stars in the model in the WR phase. Last row contains the best estimation and the possible range depending on the assumption on extinction; (7) range of EW(H) for the age range in column 5. EW(H) decreases monotonically with age. Observed range in last row corresponds to the minimum and maximum values based on different assumptions on differential extinction (see text for details); (8) model log(Q(H0)) at the most likely age (4 Myr) and mass (5.5 M⊙); (9) comments on the comparison between the observations and model. Last row contains the best determined mass and error on it, which takes into account the error on the determined age.
The codes we used are, STARBURST99 (Leitherer et al., 1999; Leitherer, et al., 2014) with Padova (SB99/Padova; Bressan, Chiosi, Fagotto, 1994) and Geneva high-mass loss (SB99/Geneva; Meynet, et al., 1994) evolutionary tracks, PopStar (PopStar/Padova; Mollá, García-Vargas & Bressan, 2009) with an updated version of the Bressan, Chiosi, Fagotto (1994) Padova tracks, two versions of GALAXEV: BC03/Padova (Bruzual & Charlot, 2003) based on tracks from Bressan, Chiosi, Fagotto (1994) and C&B/Padova (Charlot & Bruzual, in preparation; see Gutkin, Charlot & Bruzual, 2016; Plat et al., 2019) based on tracks from Chen et al. (2015), and the BPASS (Eldridge et al., 2017) that uses Cambridge evolutionary tracks in single (BPASS/single) and binary (BPASS/binary) mode. STARBURST99 and PopStar make use of CMFGEN code, whereas GALAXEV and BPASS use PoWR code, to model the extended atmospheres of WR stars. We downloaded the latest results from these codes from the websites of the respective codes, uniformly using Kroupa (2001) IMF between 0.15 M⊙ to 100 M⊙. In the case of BPASS models, the detailed calculations of ratios of different lines, including that of I(He ii )/I(H), has been provided by Xiao, Stanway & Eldridge (2018). We used the ratios corresponding to the ionization parameter of 1.5 and an atomic density of 1 atom cm-3. For the rest of the models, we used Eqn. 5 to convert the ratio of He+ to H0 ionizing photon rates to a flux ratio I(He ii )/I(H).
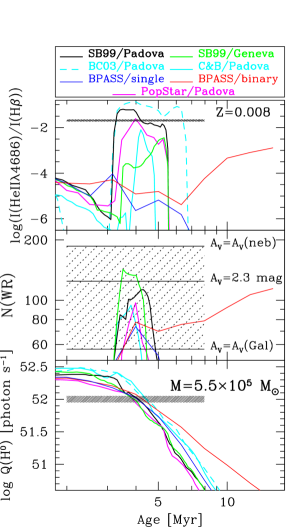
Results of the comparisons are presented in Fig. 9 on the left panels. Horizontal hatched areas in each panel encompass the entire range of observable quantities with account for observational errors. For I(He ii )/I(H) and Q(H0), errors are taken as 10%, whereas for the number of WR stars, the main source of error is the uncertainty in extinction correction.
The model Q(H0) decreases monotonically with age, whereas the nebular I(He ii )/I(H) ratio has a well-defined peak at 4 Myr, which corresponds to the appearance of WR stars in the cluster. This ratio is independent of distance, cluster mass, extinction, the chosen nebular parameters (temperature and density), and the choice of IMF parameters, as long as the upper cut-off mass is not very much different from 100 M⊙. Hence, among the three plotted quantities, the age derived from I(He ii )/I(H) ratio is the most reliable. Three models that use Bressan, Chiosi, Fagotto (1994) Padova evolutionary tracks have peak values of I(He ii )/I(H) higher than the observed value in NGC 1569 (see Tab. 1). The ratio is marginally smaller for model that makes use of the results from the new Padova tracks (Chen et al., 2015), whereas in the other three models this ratio is much lower. All the models reproduce the observationally estimated Q(H0) for a cluster of mass (5.5) M⊙ in its WR phase. The observed EW(H) is also consistent with the value expected during the WR phase for single star evolutionary models (see column 7 in Tab. 1). The number of WR stars predicted in all models agrees with the best estimation of the observed value to within 30% for the mass inferred above. The WR phase in single star evolutionary models lasts between 3.5–5 Myr. The limits for star cluster age are determined from the condition that the model predicted number of WR stars for the above inferred mass exceeds the lower limit for the observationally inferred number of WR stars in SSC-A. This age range, as well as the age at which I(He ii )/I(H) ratio reaches its peak value, are given in Table 1, in columns 5 and 3, respectively.
It is interesting to note that the SB99/Padova and SB99/Geneva models use the same atmospheric models in the WR phase, but Geneva evolutionary tracks have lower I(He ii )/I(H) in spite of having 25% more number of WR stars. This implies that the low values of I(He ii )/I(H) in SB99/Geneva models are not due to lack of WR stars, but due to the different surface parameter values in these models as compared to those in the Padova tracks. Both the single and binary BPASS models predict systematically a smaller number of WR stars, and a lower peak value of I(He ii )/I(H) at the 3–5 Myr age. In binary models, peak values of these two parameters are reached at later ages (16 Myr) when Q(H0) falls by a factor of 30 with respect to its values at the WR phase in single star evolutionary models. The observed EW of H is not in favour of this advanced age.
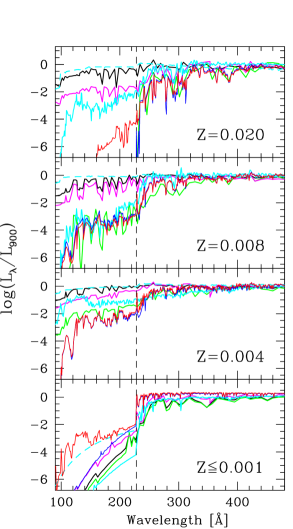
In the right panel of Fig. 9, we plot the typical emergent spectum around the He+ ionization edge (228 Å; the dashed vertical line) during the WR phase (4 Myr for all models except BPASS where it is 3.2 Myr) for a range of metallicities. All spectra are normalized to their fluxes at =900 Å. The normalisation wavelength is specifically chosen to be slightly blueward of the H0 ionization edge (912 Å), so that the shape of the plotted spectra blueward of 228 Å is an indicator of the I(He ii )/I(H) ratio. The spectra in the four models incorporating the Padova tracks (SB99/Padova, PopStar, BC03 and C&B) exhibit more He+ ionizing photons blueward of 228 Å for metallicities Z0.004 than those in the SB99/Geneva and BPASS models. At these metallicities, the emergent spectrum using the new Padova tracks (C&B/Padova) is softer than that using the older Padova tracks, but it is still harder than that obtained in SB99/Geneva and BPASS models. On the other hand, the spectral behaviour is similar in all the seven plotted models at low metallicities (Z0.001), all models predicting a downward jump at 228 Å. The plot illustrates that the atmospheric parameters (effective temperature and bolometric luminosity) of WR stars in Padova tracks are particularly able to account for the observed ratio of I(He ii )/I(H) at metallicities Z0.004.
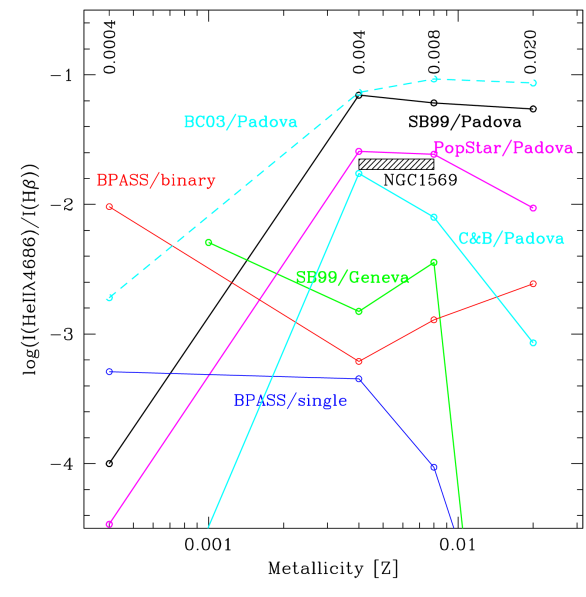
In the above analysis we have compared the values of NGC 1569 with Z=0.008 metallicity models. For the observed gas-phase abundance of oxygen, the metallicity Z can be as low as Z=0.004 if less than 10% of oxygen is depleted on to dust grains (Gutkin, Charlot & Bruzual, 2016). Given that the hardness of the spectrum blueward of the He+ ionization edge depends on metallicity, we now examine the behaviour of I(He ii )/I(H) ratio with metallicity during the WR phase. This is illustrated in Fig. 10 for all the models discussed in this work. The observed ratio in NGC 1569 is well reproduced for a metallicity range of Z=0.004–0.008 in all SSPs that use Padova tracks, independent of whether CMFGEN or PoWR models are used to represent the atmospheres of WR stars. In comparison, SSP models using Geneva tracks and BPASS models predict more than an order of magnitude lower values.
It can be seen in Fig. 10 that the I(He ii )/I(H) ratio decreases sharply at Z0.004 in models using Padova tracks. The maximum I(He ii )/I(H) ratio at the lowest plotted metallicity (Z=0.0004) corresponds to the BPASS/binary model. However, the ratio just about reaches 0.01. The observed ratio in metal-poor galaxies is often higher that these predicted values (see Shirazi & Brinchmann, 2012). In fact, observed data show a gradual tendency for the nebular I(He ii )/I(H) ratio to increase with decreasing metallicity reaching values as high as 0.06 in the most metal-poor galaxies known (Schaerer, Fragos & Izotov, 2019). This incapability of the SSP models to reproduce the observed I(He ii )/I(H) ratio at low-metallicities (Z0.004) is often referred to as the He+ ionization budget problem. The problem starts arising just below the metallicity of NGC 1569. At these low metallicities, the problem is aggravated due to the small number of WR detections. For example, I Zw 18, one of the most metal-poor galaxies, emits as much He+ ionizing photons as SSC-A in NGC 1569, but it has at the most 9 WR stars detected (Kehrig et al., 2015) as compared to the 124 WR stars in SSC-A. A comprehensive analysis of this problem was carried out recently by Plat et al. (2019). They used the same C&B/Padova model that we have used here, and calculated the I(He ii )/I(H) ratio for a variety of additional input physics not explored in this study. They find that the conditions most favourable to produce I(He ii )/I(H) at low metallicities include: (1) the presence of stars significantly more massive than 100 M⊙, (2) extremely high ionization parameter, , (3) the presence of interacting binaries that produce X-rays, (4) ionization of He+ by radiative shocks, or (5) when analysing intergrated spectra of distant galaxies, ionization of He+ by an active galactic nucleus. It is likely that more than one of these conditions are met in some of the metal-poor galaxies.
In summary, the observed number of Q(H0) from nebula surrounding SSC-A and in SSC-A are consistent with each other for all models for a cluster mass of (5.5) M⊙ at 4.0 Myr age. The observed nebular I(He ii )/I(H) ratio is in the range of predicted values during the WR phase in models that use Padova evolutionary tracks. The inferred age for SSC-A is in agreement with the age of 4.5 Myr determined by Larsen et al. (2011) using the CMD of stars in the periphery of SSC-A. The inferred mass is 15% lower as compared to the photometric mass of M⊙ determined by Larsen et al. (2011), after scaling their mass to the distance of 3.1 Mpc used in this work. Slightly larger mass for SSC-A in Larsen et al. (2011) is expected given that the SSC-A has two populations, a centrally concentrated population (A1) containing RSGs (older than 7 Myr) and a slightly extended component (A2) containing WR and O stars. Our measured mass is based on the ionizing flux and hence corresponds to the mass of the component A2. On the other hand, the photometric mass derived by Larsen et al. (2011) is based on integrated photometry of stellar light, and hence it includes the mass of both the components. On the other hand, the mass derived by us is 25% higher than the dynamical mass of M⊙ obtained by Ho & Filippenko (1996) using spectral lines originating in cool supergiants. Ho & Filippenko (1996) commented that the velocity dispersion obtained from cool supergiants in the integrated spectrum could underestimate the mass by as much as a factor of 2. Furthermore, the cool supergiants belong to the older of the two populations. The derived dynamical mass is expected to be the total of the two populations if they are dynamically mixed. The presence of hot massive stars, but not cool supergiants, in the periphery of SSC-A argues against such a mixing (Larsen et al., 2011). Measurements of velocity dispersion using spectral lines sensitive to hot stars (e.g. He absorption lines which are prominent in the spectrum of SSC-A) could help to address this issue. MEGARA has the capability of obtaining velocity dispersion in its high resolution mode, providing a possibility of addressing this issue in the near future.
5.2 Morphology of the He ii nebula and the location of SSC-A
We found that the entire observed He ii emission can be understood in terms of the ionization from WR stars in SSC-A. However, the observed He ii emission is not coincident with the location of the ionizing cluster. Instead, the most intense part of the ionized nebula both in the Balmer and in the He ii lines lies 40 pc to the south-west of the cluster. The zone of intense emission is part of a semi-circular arc of 150 pc diameter, with its centre 40 pc to the east of SSC-A. Because of this off-centring, the distance of ionizing source to different parts of the emitting arc is different, causing the surface brightness of the emission to decrease along the arc as its distance increases from SSC-A. The emission is weak inside the semi-circular arc (see Section 3). The observed morphology resembles the structure of a classical wind-driven bubble. If this is the case, the hot shocked gas that fills the bubble should be a source of the X-ray emission (Weaver et al., 1977; Chu & Mac Low, 1990; Silich, Tenorio-Tagle & Añorve-Zeferino, 2005). Soft X-rays are indeed detected in NGC 1569, whose morphology is discussed below.
5.3 X-ray morphology
The combined effect of stellar winds from massive stars in cluster A, including those from the multiple WR stars, is to form a global star cluster wind able to expel the inserted and the residual gas away into the interstellar medium (ISM). The interaction of the combined star cluster wind with the ISM leads to a strong shock which sweeps up the ambient gas into a thin shell, while the cluster wind is thermalised at a reverse shock. The shell of swept-up matter cools rapidly, if the ambient gas density is not too small, to be then completely or partially photoionized by the energetic photons escaping the cluster (Castor, McCray & Weaver, 1975; , 2014).
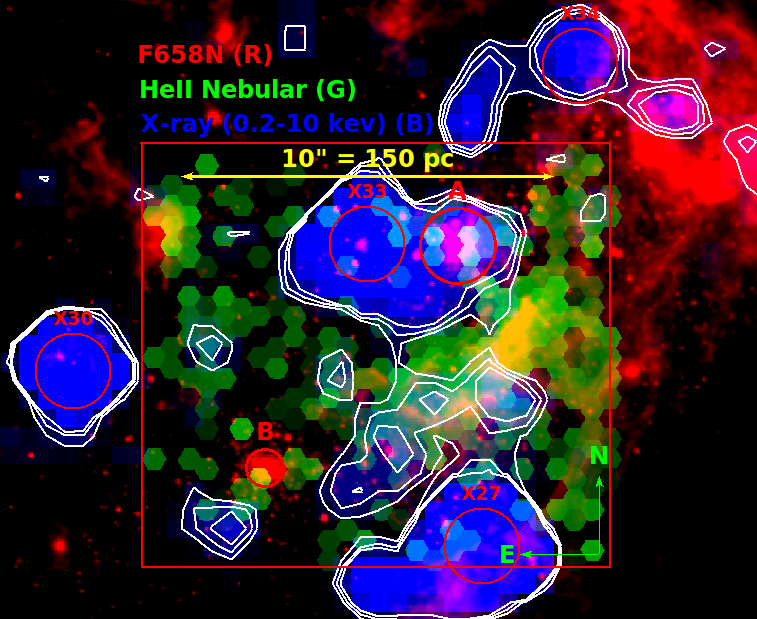
Both soft (0.2–2 keV) and hard (2–10 keV) X-ray emission have been detected from the central zone of NGC 1569 (Martin et al., 2002; Sánchez-Cruces et al., 2015). The soft X-ray emission is diffuse, whereas the hard X-rays principally come from point sources. We plot the X-ray map (blue) superposed on the He ii nebular map (green) in Fig. 11. The F658N image (H + continuum emission) is shown in red for positional reference. The observed FoV contains two hard X-ray emitting point sources catalogued by Sánchez-Cruces et al. (2015): source 27 (identified as X27) is associated to an X-ray binary, and source 33 (denoted as X33) as originating in the cluster 29 of Hunter et al. (2000) (see our Fig. 3).
Most of the soft X-ray emission comes from diffuse regions coincident with parts of the He ii nebula. However, the brightest part of the He ii nebula does not show any X-ray emission. As illustrated by Sánchez-Cruces et al. (2015), there is faint emission from the intervening zone between the SSC-A and the ionized nebula. This emission is likely associated with the hot shocked winds.
X-ray photons can also produce the He ii emission. We used the factor photon erg-1 defined by Schaerer, Fragos & Izotov (2019) to estimate the Q(He+) using the observed X-ray luminosity from the two X-ray sources in our FoV. The two sources combined contribute photon s-1, which is less than 2% of the observed ionization requirement. Hence, we are justified in neglecting any contribution to ionization from X-ray photons.
6 Conclusions
Using the recently available integral field spectrograph MEGARA at the 10.4-m GTC, we detect extended He ii nebula in the central starburst zone of the nearby dwarf galaxy NGC 1569. The nebula extends along a semi-circular arc of 150 pc (10 arcsec) diameter and 40 pc width, with the zone of the brightest He ii nebular emission lying at 40 pc (2.5 arcsec) south-west of the massive young cluster SSC-A. The spectral data also show broad He ii emission from 18 individual fibres belonging to the SSC-A. None of the other sources that are well separated from SSC-A, where WR detection have been reported using HST imaging data by Buckalew et al. (2000), show broad He ii emission. We find that these sources are stars and clusters immersed in the He ii nebula. We use the H and H nebular lines in the same spectra to map the extinction in the observed zone. The minimum extinction we obtain is consistent with the =1.6 mag from the Milky Way along the line of sight to NGC 1569. The mean value for all fibres where we could reliably measure is =2.65 mag. The low surface brightness of the nebular flux in and around SSC-A prevented us from obtaining nebular extinction towards this cluster. Using =2.3 mag, the value used by Larsen et al. (2011) to interpret the colours of the resolved stellar population in SSC-A, we estimate 124 WR stars of type WNL in SSC-A. We derive hydrogen and He+ ionizing rates of 1 photon s-1 and 1 photon s-1, respectively. These observed quantities are in agreement with the expectations from single stellar population models at 4.00.5 Myr for a cluster of mass (5.5) M⊙. The derived age is consistent with the turn-off ages determined by Larsen et al. (2011) from resolved stellar populations in the periphery of this cluster. A careful comparison of the most commonly used population synthesis models, we find that the predicted values of nebular I(He ii )/I(H) in models that make use of Padova evolutionary tracks are in the range of observed value of 0.02 for metallicities Z0.004. Thus, at =8.19 (Z0.006), which is the measured value for NGC 1569, the WR stars from the cluster are able to explain the origin of the He ii nebula.
Acknowledgements
It is a pleasure to thank the anonymous referee for thoughtful comments that lead to a significant improvement of the manuscript. This publication is based on data obtained with the MEGARA instrument at the Gran Telescopio Canarias, installed in the Spanish Observatorio del Roque de los Muchachos, in the island of La Palma. MEGARA has been built by a Consortium led by the Universidad Complutense de Madrid (Spain) and that also includes the Instituto de Astrofísica, Óptica y Electrónica (Mexico), Instituto de Astrofísica de Andalucía (CSIC, Spain) and the Universidad Politécnica de Madrid (Spain). MEGARA is funded by the Consortium institutions, GRANTECAN S.A. and European Regional Development Funds (ERDF), through Programa Operativo Canarias FEDER 2014-2020. We thank CONACyT for the research grants CB-A1-S-25070 (YDM), CB-A1-S-22784 (DRG), and CB-A1-S-28458 (SS). VMAGG is funded by UNAM DGAPA PAPIIT project number IA100318. Authors acknowledge financial support from the Spanish MINECO under grant numbers AYA2016-79724-C4-4-P, AYA2016-75808-R, AYA2017-90589-REOT and RTI2018-096188-B-I00.
7 Data availability
The fluxes of principal emission lines used in this work are available in the article and in its online supplementary material. The reduced fits files on which these data are based will be shared on reasonable request to the first author.
References
- Arp & Sandage (1985) Arp, H., & Sandage, A. 1985, AJ, 90, 1163
- Brinchmann, Kunth & Durret (2008) Brinchmann, J., Kunth, D. & Durret, F. 2008, A&A, 485, 657
- Bressan, Chiosi, Fagotto (1994) Bressan A., Chiosi C., Fagotto F., 1994, ApJS, 94, 63
- Bressan, Granato, Silva (1998) Bressan A., Granato G. L., Silva L. 1998, A&A, 332, 135
- Bruzual & Charlot (1993) Bruzual, A. G., Charlot, S., 1993, ApJ, 405, 538
- Bruzual & Charlot (2003) Bruzual, A. G., Charlot, S., 2003, MNRAS, 344, 1000
- Buckalew et al. (2000) Buckalew, B. A., Dufour, R. J., Shopbell, P. L. & Walter, D. K. 2000, AJ, 120, 2402
- Burstein & Heiles (1984) Burstein, D. & Heiles, C. 1984, ApJS, 54, 33
- Calzetti, Kinney & Storchi-Bergmann (1994) Calzetti D., Kinney A. L., Storchi-Bergmann T., 1994, ApJ, 429, 582
- Cardelli, Clayton & Mathis (1989) Cardelli, J. A., Clayton, G. C. & Mathis, J. S. 1989, ApJ, 345, 245
- Carrasco et al. (2018) Carrasco E., et al., 2018, SPIE, 1070216, SPIE10702
- Castor, McCray & Weaver (1975) Castor J., McCray R., Weaver R., 1975, ApJL, 200, L107
- Chen et al. (2015) Chen, Y., Bressan, A., Girardi, L., et al. 2015, MNRAS 452, 1068
- Chu & Mac Low (1990) Chu Y.-H., Mac Low M.-M., 1990, ApJ, 365, 510
- De Marchi et al. (1997) De Marchi, G., Clampin, M., Greggio, L., Leitherer, C., Nota, A., & Tosi, M. 1997, ApJ, 479, L27
- Devost, Roy & Drissen (1997) Devost, D., Roy, J.-R. & Drissen, L. 1997, ApJ, 482, 765
- Dopita & Sutherland (1996) Dopita, M. A. & Sutherland, R. S. 1996, ApJS, 102, 161
- Eldridge & Tout (2004) Eldridge J. J., Tout C. A., 2004, MNRAS, 353, 87
- Eldridge et al. (2017) Eldridge, J. J., Stanway, E. R., Xiao, L. et al. 2017, PASA, 34, e058
- Fragos et al. (2013) Fragos T., et al., 2013, ApJ, 764, 41
- Garnett et al. (1991) Garnett, D. R., Kennicutt, R. C., Chu, Y.-H. & Skillman, E.D. 1991, ApJ, 373, 458
- Gil de Paz et al. (2018) Gil de Paz A., et al., 2018, SPIE, 1070217, SPIE10702
- Gil de Paz et al. (2020) Gil de Paz A., et al., 2020 (submitted to A&A)
- Gómez-González et al. (2020) Gómez-González, V.M.A., et al. 2020, MNRAS, 493, 3879
- González-Delgado et al. (1997) González-Delgado, R. M., Leitherer, C., Heckman, T. & Cerviño, M. 1997, ApJ, 483, 705
- Gräfener, Koesterke & Hamann (2002) Gräfener, G., Koesterke, L. & Hamann, W.-R. 2002, A&A, 387, 244
- Grocholski et al. (2008) Grocholski, A. J., Aloisi, A., van Der Marel, R. P., et al. 2008, ApJ, 686, L79
- Grocholski, et al. (2012) Grocholski, A. J., van der Marel R. P., Aloisi A., Annibali F., Greggio L., Tosi M., 2012, AJ, 143, 117
- Gutkin, Charlot & Bruzual (2016) Gutkin J., Charlot S. & Bruzual, G. 2016, MNRAS, 462, 1757
- Hillier & Miller (1998) Hillier, D.J. & Miller, D.L. 1998, 496, 4007
- Hunter, Hawley & Gallagher (1993) Hunter, D. A., Hawley, W. & Gallagher, J. S. 1993, AJ, 106, 1797
- Hunter et al. (2000) Hunter, D. A., O’Connell, R. W., Gallagher, J. S. & Smecker-Hane, T. A. 2000, AJ, 120, 2383
- Ho & Filippenko (1996) Ho, L. C. & Filippenko, A. V. 1996, ApJ, 446, L83
- Hodge (1974) Hodge, P. W. 1974, ApJ, 191, L21
- Israel (1988) Israel, F.P. 1988, A&A, 194, 24
- Kehrig et al. (2011) Kehrig, C., Oey, M.S., Crowther, P.A. et al. 2011, A&A, 526, L128
- Kehrig et al. (2015) Kehrig, C., Vílchez, J. M., Pérez-Montero, E. et al. 2015, ApJ, 80, L28
- Kehrig et al. (2018) Kehrig, C., Vílchez, J. M., Guerrero, M. A. et al. 2018, MNRAS, 480, 1081
- Kobulnicky & Skillman (1997) Kobulnicky, H. A., Skillman, E. D. 1997, ApJ, 489, 636
- Kojima, et al. (2020) Kojima T., et al., 2020, arXiv, arXiv:2006.03831
- Kroupa (2001) Kroupa P., 2001, MNRAS, 322, 231
- Larsen et al. (2008) Larsen, S. S., Origlia, L., Brodie, J. & Gallagher, J. S. 2008, MNRAS, 383, 263
- Larsen et al. (2011) Larsen, S. S., de Mink, S. E., Eldridge, J. J. el al. 2011, A&A, 532, 147
- Leitherer et al. (1999) Leitherer, C., Schaerer, D., Goldader, J. D., González-Delgado, R. M., Robert, C. et al. 1999, ApJ, 123, 3
- Leitherer, et al. (2014) Leitherer C., Ekström S., Meynet G., Schaerer D., Agienko K. B., Levesque E. M., 2014, ApJS, 212, 14
- López-Sánchez & Esteban (2010) López-Sánchez Á. R., Esteban C., 2010, A&A, 516, A104
- Maeder & Meynet (1989) Maeder, A. & Meynet, G. 1989, A&A, 210, 155
- Martin et al. (2002) Martin, C. L., Kobulniky, H. A. & Heckman, T. M. 2002, ApJ, 574, 663
- (49) Martínez-González S., Silich S., Tenorio-Tagle G., 2014, ApJ, 785, 164
- Mayya & Prabhu (1996) Mayya, Y. D. & Prabhu, T. P. 1996, AJ, 111, 1252
- Meynet, et al. (1994) Meynet G., Maeder A., Schaller G., Schaerer D., Charbonnel C., 1994, A&AS, 103, 97
- Meynet & Maeder (2005) Meynet G., & Maeder A., 2005, A&A, 429, 581
- Mollá, García-Vargas & Bressan (2009) Mollá, M., García-Vargas, M. L., Bressan, A., 2009, MNRAS, 398, 451
- Origlia et al. (2001) Origlia, L., Leitherer, C., Aloisi, A., Greggio, L. & Tosi, M. 2001, AJ, 122, 815
- Osterbrock & Ferland (2006) Osterbrock, D. E. & Ferland, G. J. 2006, in Astrophysics of Gaseous Nebulae and Active Galactic Nuclei (CA: University Science Books)
- Ott (2012) Ott, T. 2012, QFitsView: FITS file viewer, ascl:1210.019
- Pauldrach, Hoffmann & Lennon (2001) Pauldrach, A. W. A., Hoffmann, T.L. & & Lennon, M. 2001, A&A, 375, 161
- Pascual et al. (2018) Pascual, S., Cardiel, N., Picazo-Sanchez, P., et al. 2018, guaix-ucm/megaradrp: v0.8, Zenodo, doi:10.5281/zenodo.2206856
- Plat et al. (2019) Plat, A., Charlot, S., Bruzual, G., Feltre, A., Vidal-García, A. et al. 2019, MNRAS, 490, 978
- Prada, Greeve & McKeith (1994) Prada, F., Greve, A., & McKeith, C. D. 1994, A&A, 288, 396
- Press et al. (1992) Press, W.H., Teukolsky, S.A., Vetterling, W.T. & Flannery, B.P. 1992, Numerical Recipes in C (Second Edition), Cambridge University Press
- Sánchez-Cruces et al. (2015) Sánchez-Cruces, M., Rosado, M., Rodríguez-González, A. & Reyes-Iturbide, J. 2015, ApJ, 799, 231
- Schaerer (1996) Schaerer, D. (1996) ApJ, 467, L17
- Schaerer, Fragos & Izotov (2019) Schaerer D., Fragos T., Izotov Y. I., 2019, A&A, 622, L10
- Schaller et al. (1992) Schaller, G., Schaerer, G. Meynet, G. & Maeder, A. 1992, A&AS, 96, 269
- Schlafly & Finkbeiner (2011) Schlafly, E. & Finkbeiner, D. P. 2011, ApJ, 737, 103
- Schlegel, Finkbeiner & Davis (1998) Schlegel, D. J., Finkbeiner, D. P. & Davis, M. 1998, ApJ, 500, 525
- Schmutz, Leitherer & Gruenwald (1992) Schmutz W., Leitherer C., Gruenwald R., 1992, PASP, 104, 1164
- Shirazi & Brinchmann (2012) Shirazi, M. & Brinchmann, J. (2012) MNRAS, 421, 1043
- Silich, Tenorio-Tagle & Añorve-Zeferino (2005) Silich S., Tenorio-Tagle G., Añorve-Zeferino G. A., 2005, ApJ, 635, 1116
- Smith, Norris, Crowther (2002) Smith L., Norris R., & Crowther P., 2002, MNRAS, 337, 1309
- Taylor et al. (1999) Taylor C. L., Hüttemeister S., Klein U., Greve A., 1999, A&A, 349, 424
- Tresse et al. (1999) Tresse, L., Maddox, S., Loveday, J. & Singleton, C. 1999, MNRAS, 310, 262
- Vacca & Conti (1992) Vacca, W. D. & Conti, P. S. 1992, ApJ, 401, 543
- Waller (1991) Waller, W. H. 1991, ApJ, 370, 144
- Weaver et al. (1977) Weaver, R., McCray, R., Castor, J., Shapiro, P. & Moore, R. 1977, ApJ, 218, 377
- Westmoquette et al. (2007) Westmoquette, M. S., Exter, K. M., Smith, L. J. & Gallagher, J. S. 2007, MNRAS, 381, 894
- Westmoquette et al. (2008) Westmoquette, M. S., Smith, L. J. & Gallagher, J. S. 2008, MNRAS, 383, 864
- Xiao, Stanway & Eldridge (2018) Xiao, L. et al. Stanway, E. R., Eldridge, J. J., 2018, MNRAS, 477, 904
Appendix A Measured data in individual fibre spectrum
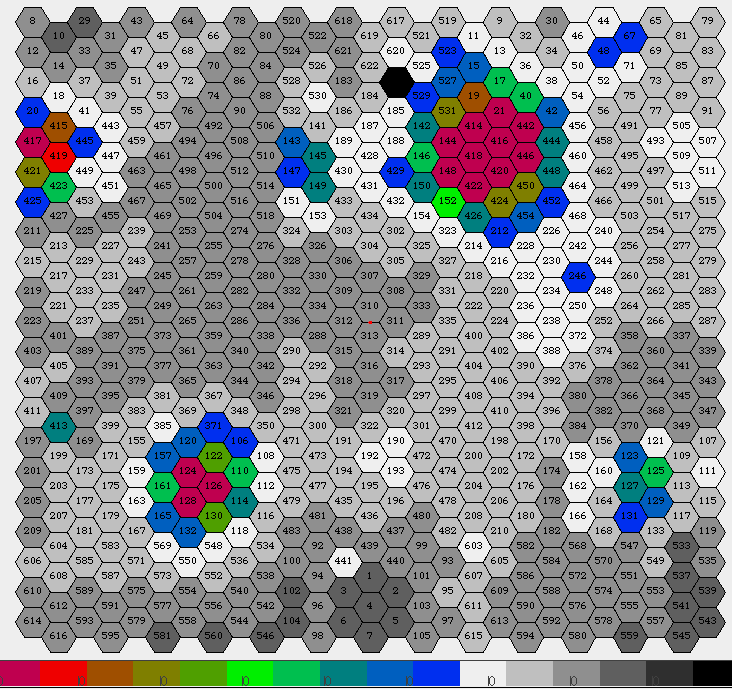
In Table 2, we give the measured and calculated values for all the lines used in this work for 50 illustrative fibre spectra. The first 25 rows contain data for fibres arranged as a decreasing function of H flux (column 6), whereas the remaining 25 rows show data for fibres where we detected WR features. These data are arranged in the decreasing order of (column 19). The electronic version contains data for all the 567 fibres, arranged in the increasing order of fibre number (column 1). The note to the table contains a detailed explanation of the quantities in each column. In Fig. 12, we show a spaxel map of MEGARA, where we indicate the location of each fibre, identified by its number.
| Fibre coordinates | H-related | H-related | Heii4686 nebula-related | Heii4686 WR-related | Extinction | ||||||||||||||||
| Fno | dX | dY | R | PA | snr | EW | FW | f | snr | FW | snr | f | FW | e | e | ||||||
| arcsec | arcsec | pc | ∘ | Å | Å | Å | Å | Å | Å | mag | mag | ||||||||||
| 1 | 2 | 3 | 4 | 5 | 6 | 7 | 8 | 9 | 10 | 11 | 12 | 13 | 14 | 15 | 16 | 17 | 18 | 19 | 20 | 21 | 22 |
| 242 | 1.86 | -1.61 | 36.9 | 229.1 | 6.181 | 82.7 | 51.2 | 1.2 | 19.6 | 10.8 | 4685.1 | 4.1 | 10.230 | 8.8 | 3.7 | 0.0 | 0.0 | 0.0 | 0.0 | 4.52 | 0.43 |
| 240 | 2.32 | -1.34 | 40.3 | 240.0 | 3.990 | 56.2 | 41.1 | 1.3 | 19.6 | 9.1 | 4684.7 | 2.5 | 8.726 | 10.7 | 4.9 | 0.0 | 0.0 | 0.0 | 0.0 | 4.40 | 0.48 |
| 244 | 2.32 | -1.88 | 44.9 | 231.0 | 3.972 | 59.9 | 57.1 | 1.2 | 21.8 | 9.6 | 4684.9 | 2.9 | 6.808 | 9.6 | 3.8 | 0.0 | 0.0 | 0.0 | 0.0 | 4.12 | 0.48 |
| 246 | 1.86 | -2.15 | 42.7 | 220.8 | 3.010 | 70.5 | 64.5 | 1.2 | 23.4 | 16.7 | 4684.8 | 2.1 | 4.168 | 10.3 | 3.1 | 0.0 | 0.0 | 0.0 | 0.0 | 3.65 | 0.25 |
| 406 | 0.46 | -4.03 | 60.9 | 186.6 | 2.171 | 67.0 | 50.5 | 1.3 | 23.0 | 14.1 | 4685.1 | 2.1 | 2.881 | 9.2 | 2.9 | 0.0 | 0.0 | 0.0 | 0.0 | 3.71 | 0.30 |
| 20 | -7.89 | 0.81 | 119.2 | 84.2 | 2.144 | 63.4 | 41.1 | 1.4 | 24.2 | 10.4 | 4684.8 | 1.4 | 1.503 | 4.8 | 1.6 | 0.0 | 0.0 | 0.0 | 0.0 | 3.57 | 0.45 |
| 248 | 2.32 | -2.42 | 50.4 | 223.8 | 2.140 | 73.2 | 61.0 | 1.2 | 23.4 | 13.0 | 4684.7 | 1.6 | 2.257 | 8.6 | 2.3 | 0.0 | 0.0 | 0.0 | 0.0 | 3.58 | 0.34 |
| 256 | 2.79 | -1.61 | 48.4 | 240.0 | 1.867 | 61.4 | 39.4 | 1.4 | 21.8 | 8.9 | 4685.1 | 2.4 | 3.300 | 7.5 | 3.9 | 0.0 | 0.0 | 0.0 | 0.0 | 3.85 | 0.51 |
| 250 | 1.86 | -2.68 | 49.1 | 214.7 | 1.791 | 79.6 | 68.2 | 1.2 | 25.3 | 12.8 | 4684.8 | 1.7 | 1.621 | 7.4 | 2.0 | 0.0 | 0.0 | 0.0 | 0.0 | 3.20 | 0.36 |
| 234 | 1.39 | -2.42 | 41.9 | 210.0 | 1.667 | 80.9 | 59.2 | 1.3 | 25.6 | 15.2 | 4684.7 | 2.0 | 2.191 | 10.9 | 2.9 | 0.0 | 0.0 | 0.0 | 0.0 | 3.19 | 0.29 |
| 260 | 2.79 | -2.15 | 52.9 | 232.4 | 1.450 | 51.2 | 44.5 | 1.4 | 23.4 | 9.4 | 4684.6 | 2.4 | 1.845 | 6.0 | 2.8 | 0.0 | 0.0 | 0.0 | 0.0 | 3.55 | 0.46 |
| 238 | 1.39 | -2.95 | 49.1 | 205.2 | 1.290 | 87.0 | 61.5 | 1.3 | 26.8 | 16.4 | 4685.0 | 2.5 | 1.594 | 9.4 | 2.7 | 0.0 | 0.0 | 0.0 | 0.0 | 2.93 | 0.27 |
| 230 | 1.39 | -1.88 | 35.2 | 216.5 | 1.088 | 67.2 | 42.1 | 1.3 | 26.0 | 13.6 | 4684.8 | 2.8 | 2.052 | 11.3 | 4.2 | 0.0 | 0.0 | 0.0 | 0.0 | 3.03 | 0.32 |
| 497 | 3.25 | -0.27 | 49.0 | 265.3 | 1.033 | 49.4 | 28.6 | 1.8 | 23.4 | 10.7 | 0.0 | 0.0 | 0.000 | 0.0 | 0.0 | 0.0 | 0.0 | 0.0 | 0.0 | 3.46 | 0.39 |
| 468 | 1.86 | -1.07 | 32.2 | 240.0 | 0.997 | 49.7 | 26.3 | 1.5 | 24.2 | 9.3 | 4685.1 | 2.6 | 1.294 | 5.4 | 2.9 | 0.0 | 0.0 | 0.0 | 0.0 | 3.31 | 0.47 |
| 372 | 1.86 | -3.22 | 55.9 | 210.0 | 0.986 | 64.6 | 60.4 | 1.2 | 27.3 | 20.6 | 4684.8 | 1.7 | 0.915 | 10.4 | 2.1 | 0.0 | 0.0 | 0.0 | 0.0 | 2.79 | 0.18 |
| 374 | 2.32 | -3.49 | 63.0 | 213.6 | 0.946 | 54.0 | 50.0 | 1.2 | 25.4 | 11.9 | 4684.3 | 0.8 | 0.239 | 2.3 | 0.6 | 0.0 | 0.0 | 0.0 | 0.0 | 3.18 | 0.36 |
| 404 | 0.31 | -3.76 | 56.5 | 184.7 | 0.904 | 58.2 | 35.1 | 1.3 | 24.9 | 9.5 | 4685.1 | 2.3 | 1.542 | 9.0 | 3.8 | 0.0 | 0.0 | 0.0 | 0.0 | 3.20 | 0.47 |
| 358 | 2.79 | -3.22 | 64.0 | 220.8 | 0.896 | 47.0 | 47.2 | 1.2 | 25.2 | 9.0 | 4684.8 | 2.3 | 0.850 | 4.8 | 2.1 | 0.0 | 0.0 | 0.0 | 0.0 | 3.21 | 0.49 |
| 513 | 3.71 | -0.54 | 56.4 | 261.8 | 0.869 | 51.4 | 26.4 | 1.7 | 23.9 | 8.8 | 0.0 | 0.0 | 0.000 | 0.0 | 0.0 | 0.0 | 0.0 | 0.0 | 0.0 | 3.26 | 0.49 |
| 615 | 0.31 | -8.59 | 129.1 | 182.1 | 0.846 | 55.7 | 78.0 | 1.3 | 28.0 | 8.8 | 0.0 | 0.0 | 0.000 | 0.0 | 0.0 | 0.0 | 0.0 | 0.0 | 0.0 | 2.77 | 0.53 |
| 236 | 0.93 | -2.68 | 42.7 | 199.1 | 0.843 | 70.3 | 44.7 | 1.4 | 27.2 | 15.2 | 4684.8 | 2.5 | 1.393 | 11.8 | 3.7 | 0.0 | 0.0 | 0.0 | 0.0 | 2.80 | 0.28 |
| 264 | 2.79 | -2.68 | 58.1 | 226.1 | 0.843 | 44.6 | 44.2 | 1.2 | 25.2 | 11.0 | 4685.0 | 1.5 | 0.775 | 5.0 | 2.0 | 0.0 | 0.0 | 0.0 | 0.0 | 3.05 | 0.36 |
| 232 | 0.93 | -2.15 | 35.2 | 203.4 | 0.832 | 70.3 | 29.7 | 1.5 | 24.9 | 9.5 | 4684.8 | 1.1 | 0.584 | 4.4 | 1.6 | 4685.0 | 8.2 | 0.7 | 0.1 | 3.08 | 0.48 |
| 390 | 0.93 | -3.76 | 58.2 | 193.9 | 0.773 | 77.1 | 48.8 | 1.4 | 27.5 | 15.1 | 4685.2 | 2.0 | 0.822 | 8.7 | 2.4 | 0.0 | 0.0 | 0.0 | 0.0 | 2.76 | 0.29 |
| 418 | 0.31 | 0.31 | 4.7 | 135.0 | 0.175 | 32.0 | 2.3 | 2.5 | 18.9 | 5.4 | 0.0 | 0.0 | 0.000 | 0.0 | 0.0 | 4685.5 | 28.8 | 19.8 | 0.8 | 1.06 | 0.43 |
| 416 | 0.46 | 0.27 | 8.1 | 120.0 | 0.158 | 31.1 | 1.9 | 2.1 | 22.5 | 6.3 | 4685.1 | 2.5 | 0.413 | 3.4 | 5.8 | 4685.7 | 27.5 | 14.8 | 0.8 | 1.75 | 0.48 |
| 420 | 0.46 | -0.27 | 8.1 | 240.0 | 0.142 | 45.0 | 2.2 | 2.2 | 18.4 | 4.6 | 4684.5 | 1.7 | 0.326 | 3.3 | 5.1 | 4686.3 | 25.6 | 13.3 | 0.8 | 1.10 | 0.54 |
| 414 | 0.31 | 0.54 | 8.1 | 150.0 | 0.107 | 33.6 | 2.1 | 2.1 | 22.7 | 5.8 | 0.0 | 0.0 | 0.000 | 0.0 | 0.0 | 4686.6 | 29.8 | 12.6 | 0.6 | 1.44 | 0.51 |
| 419 | -7.43 | 0.31 | 111.6 | 87.6 | 0.240 | 58.5 | 11.2 | 1.4 | 22.2 | 14.6 | 4685.0 | 2.2 | 0.393 | 5.3 | 3.6 | 4685.3 | 73.1 | 11.2 | 0.6 | 1.87 | 0.19 |
| 422 | 0.31 | -0.54 | 8.1 | 210.0 | 0.098 | 37.2 | 2.6 | 2.3 | 24.7 | 5.4 | 0.0 | 0.0 | 0.000 | 0.0 | 0.0 | 4685.7 | 24.9 | 10.0 | 0.5 | 0.00 | 0.43 |
| 144 | -0.46 | 0.27 | 8.1 | 60.0 | 0.065 | 29.6 | 2.0 | 2.4 | 3.7 | 1.3 | 4684.5 | 4.2 | 0.363 | 4.5 | 12.5 | 4685.4 | 38.7 | 8.3 | 0.5 | 0.00 | 0.00 |
| 446 | 0.93 | 0.31 | 14.0 | 108.5 | 0.117 | 37.4 | 2.9 | 1.9 | 18.8 | 5.9 | 4685.5 | 1.2 | 0.111 | 2.4 | 2.1 | 4686.7 | 30.0 | 7.2 | 0.5 | 2.50 | 0.51 |
| 21 | 0.46 | 0.81 | 14.0 | 150.0 | 0.141 | 47.9 | 3.4 | 2.2 | 17.2 | 6.7 | 0.0 | 0.0 | 0.000 | 0.0 | 0.0 | 4686.5 | 24.5 | 6.9 | 0.5 | 3.38 | 0.49 |
| 148 | -0.46 | -0.27 | 8.1 | 120.0 | 0.059 | 24.6 | 2.0 | 2.4 | 21.4 | 3.2 | 4683.9 | 1.6 | 0.129 | 2.4 | 4.9 | 4685.9 | 26.6 | 6.5 | 0.4 | 0.00 | 0.65 |
| 424 | 0.46 | -0.81 | 14.0 | 210.0 | 0.085 | 35.7 | 4.1 | 1.9 | 33.5 | 8.5 | 4684.7 | 2.1 | 0.114 | 2.4 | 3.0 | 4687.1 | 25.6 | 4.4 | 0.3 | 0.00 | 0.35 |
| 442 | 0.93 | 0.54 | 16.1 | 120.0 | 0.105 | 39.6 | 3.4 | 2.0 | 18.4 | 6.2 | 4685.4 | 1.4 | 0.112 | 2.5 | 2.4 | 4685.8 | 24.1 | 4.4 | 0.4 | 3.36 | 0.55 |
| 145 | -2.79 | 0.31 | 41.9 | 83.6 | 0.025 | 15.7 | 2.1 | 2.0 | 4.7 | 0.8 | 0.0 | 0.0 | 0.000 | 0.0 | 0.0 | 4685.0 | 28.6 | 3.6 | 0.3 | 0.00 | 0.00 |
| 152 | -0.46 | -0.81 | 14.0 | 150.0 | 0.034 | 14.1 | 2.2 | 2.3 | 7.9 | 1.7 | 0.0 | 0.0 | 0.000 | 0.0 | 0.0 | 4684.4 | 30.5 | 3.2 | 0.4 | 0.00 | 0.00 |
| 146 | -0.93 | 0.31 | 14.0 | 71.5 | 0.028 | 12.8 | 1.9 | 2.0 | 3.1 | 0.7 | 0.0 | 0.0 | 0.000 | 0.0 | 0.0 | 4686.4 | 27.2 | 3.0 | 0.3 | 0.00 | 0.00 |
| 531 | -0.46 | 0.81 | 14.0 | 30.0 | 0.051 | 33.5 | 2.5 | 1.9 | 13.7 | 3.2 | 4684.9 | 1.1 | 0.076 | 2.4 | 3.3 | 4688.7 | 23.1 | 2.9 | 0.3 | 1.85 | 0.66 |
| 149 | -2.79 | -0.54 | 42.6 | 100.9 | 0.019 | 12.9 | 1.8 | 2.0 | 9.5 | 1.1 | 4688.2 | 2.1 | 0.082 | 0.0 | 9.6 | 4685.8 | 27.8 | 2.6 | 0.3 | 0.00 | 0.00 |
| 423 | -7.43 | -0.54 | 111.9 | 94.1 | 0.118 | 44.3 | 10.8 | 1.5 | 24.8 | 7.1 | 4684.7 | 1.2 | 0.087 | 2.3 | 1.6 | 4685.6 | 25.8 | 2.5 | 0.4 | 0.48 | 0.39 |
| 19 | 0.31 | 1.07 | 16.1 | 163.9 | 0.106 | 40.9 | 4.4 | 2.5 | 18.9 | 4.8 | 4685.2 | 0.7 | 0.071 | 2.2 | 1.5 | 4687.9 | 15.2 | 2.3 | 0.3 | 3.14 | 0.74 |
| 417 | -7.89 | 0.27 | 118.7 | 88.1 | 0.221 | 71.5 | 12.8 | 1.3 | 23.1 | 12.1 | 0.0 | 0.0 | 0.000 | 0.0 | 0.0 | 4684.5 | 10.7 | 2.1 | 0.2 | 1.51 | 0.25 |
| 51 | -6.03 | 1.34 | 92.9 | 77.5 | 0.067 | 32.3 | 14.8 | 1.9 | 29.8 | 4.5 | 4684.5 | 1.7 | 0.084 | 2.4 | 2.8 | 4688.6 | 38.4 | 2.0 | 0.3 | 1.75 | 0.96 |
| 448 | 1.39 | -0.27 | 21.3 | 259.1 | 0.109 | 42.1 | 8.1 | 1.7 | 27.5 | 7.3 | 0.0 | 0.0 | 0.000 | 0.0 | 0.0 | 4689.4 | 25.0 | 1.8 | 0.3 | 1.91 | 0.54 |
| 452 | 1.39 | -0.81 | 24.2 | 240.0 | 0.335 | 49.2 | 12.2 | 1.7 | 25.6 | 9.4 | 0.0 | 0.0 | 0.000 | 0.0 | 0.0 | 4688.4 | 20.1 | 1.8 | 0.2 | 2.58 | 0.43 |
| 212 | 0.46 | -1.34 | 21.3 | 199.1 | 0.062 | 28.5 | 7.0 | 1.8 | 37.2 | 6.3 | 0.0 | 0.0 | 0.000 | 0.0 | 0.0 | 4685.4 | 19.5 | 1.5 | 0.2 | 0.04 | 0.57 |
| 49 | -5.57 | 1.61 | 87.1 | 73.9 | 0.052 | 28.4 | 11.6 | 2.0 | 31.8 | 3.8 | 4685.4 | 0.9 | 0.056 | 2.6 | 2.4 | 4686.1 | 32.7 | 1.4 | 0.3 | 1.63 | 1.18 |
-
•
Row description:
Data for 50 fibres, ordered according to the decreasing contribution in H (column 6) in the first 25 rows, and ordered according to the decreasing number of WR stars (column 19) in the next 25 lines. Table containing data for all 567 fibres (excluding the sky fibres) is available in the electronic version.
Column description:
1 - Fibre number.
2–3 - X and Y shifts in arcsecs with respect to (wrt) the core of SSC-A, which is the closest to fibre #418. Objects to the east and south of SSC-A have negative shifts.
4 - distance from SSC-A in parsec using a scale of 15 pc arcsec-1.
5 - PA in degrees of the fibre position wrt SSC-A.
6 - 100 the extinction-corrected H flux in the fibre wrt total H flux (4.444 erg cm-2 s-1).
7 - Signal-to-noise ratio (SNR) of the H line (see equation 1).
8 - Emission Equivalent Width (EW) in Å of the H emission line.
9 - FWHM in Å of the fitted Gaussian to the emission line of H.
10 - 100 ratio.
11 - SNR of the H emission line.
12 - Central wavelength in Å of the fitted He ii narrow (nebular) line.
13 - FWHM in Å of the fitted He ii narrow (nebular) line.
14 - 100 the extinction-corrected He ii nebular line flux in the fibre wrt total flux in the same line (9.13 erg cm-2 s-1).
15 - SNR of the fitted He ii narrow (nebular) line.
16 - 100 ratio.
17 - Central wavelength in Å of the fitted He ii broad (WR) line.
18 - FWHM in Å of the fitted He ii broad (WR) line.
19 - Luminosity of the He ii broad line expressed in units of 1.22 erg s-1 =equivalent number of WNL stars.
20 - Error in , determined by propagating errors in the He ii broad line flux.
21 - determined from H and H lines when both the lines have (absorption correction 1 Å in EWs.)
22 - Error on , determined by propagating errors in the H and H line fluxes.