Prebiotic precursors of the primordial RNA world in space: Detection of NH2OH
Abstract
One of the proposed scenarios for the origin of life is the primordial RNA world, which considers that RNA molecules were likely responsible for the storage of genetic information and the catalysis of biochemical reactions in primitive cells, before the advent of proteins and DNA. In the last decade, experiments in the field of prebiotic chemistry have shown that RNA nucleotides can be synthesized from relatively simple molecular precursors, most of which have been found in space. An important exception is hydroxylamine, NH2OH, which, despite several observational attempts, it has not been detected in space yet. Here we present the first detection of NH2OH in the interstellar medium towards the quiescent molecular cloud G+0.693-0.027 located in the Galactic Center. We have targeted the three groups of transitions from the =21, 32, and 43 rotational lines, detecting 5 transitions that are unblended or only slightly blended. The derived molecular abundance of NH2OH is (2.10.9)10-10. From the comparison of the derived abundance of NH2OH and chemically related species, with those predicted by chemical models and measured in laboratory experiments, we favor the formation of NH2OH in the interstellar medium via hydrogenation of NO on dust grain surfaces, with possibly a contribution of ice mantle NH3 oxidation processes. Further laboratory studies and quantum chemical calculations are needed to completely rule out the formation of NH2OH in the gas phase.
1 Introduction
| Frequency | Transition | log | S | log | Eu | Blendinga | |
|---|---|---|---|---|---|---|---|
| (GHz) | () | (nm2 MHz) | (D2) | (s-1) | (K) | ||
| 100.683580 | 211,1 | -4.8754 | 0.52036 | -5.9078 | 5 | 15.2 | blended with CH3OCHO |
| 100.748230 | 210,1 | -4.7384 | 0.69380 | -5.7821 | 5 | 7.2 | unblended |
| 100.807620 | 211,0 | -4.8743 | 0.52041 | -5.9062 | 5 | 15.2 | blended with CH3COOH and s-C2H5CHO |
| 151.020701 | 321,2 | -4.2821 | 0.92509 | -5.2759 | 7 | 22.4 | unblended |
| 151.101986 | 322,1 | -4.5203 | 0.57820 | -5.4793 | 7 | 46.3 | blended with s-C2H5CHO |
| 151.102324 | 322,0 | -4.5203 | 0.57820 | -5.4793 | 7 | 46.3 | blended with s-C2H5CHO |
| 151.117668 | 320,2 | -4.2189 | 1.04068 | -5.2239 | 7 | 14.5 | slightly blended with s-C2H5CHOb |
| 151.207007 | 321,1 | -4.2810 | 0.92520 | -5.2742 | 7 | 22.5 | slightly blended with unidentified line |
| 201.352578 | 431,3 | -3.8964 | 1.30100 | -4.8621 | 9 | 32.1 | blended with CH3SH and HDCO |
| 201.435072 | 433,1 | -4.3192 | 0.60710 | -5.1926 | 9 | 95.8 | blended with CH3OH |
| 201.435072 | 433,0 | -4.3192 | 0.60710 | -5.1926 | 9 | 95.8 | blended with CH3OH |
| 201.460663 | 432,2 | -4.0274 | 1.04082 | -4.9584 | 9 | 56.0 | blended with CH3OH |
| 201.461598 | 432,1 | -4.0274 | 1.04081 | -4.9583 | 9 | 24.1 | blended with CH3OH |
| 201.481718 | 430,3 | -3.8563 | 1.38777 | -4.8333 | 9 | 32.1 | slightly blended with unidentified line |
| 201.600715 | 431,2 | -3.8954 | 1.30089 | -4.8606 | 9 | 15.6 | blended with H2C18O and CH3CONH2 |
Life likely appeared about 3.8 billion years ago, 700 Myr after the formation of the Earth (Mojzsis et al. 1996). However, the processes that allowed the transition from chemistry to biology are still uncertain. Present-day life is mainly based on three biopolymers: RNA and DNA nucleic acids, which store genetic information, and proteins, responsible for most metabolic activities. One of the main challenges for understanding the origin of life is the ”chicken and egg” paradox: nucleic acids need catalytic proteins for their replication, while the biosynthesis of proteins requires the prior presence of genetic information coded in nucleic acids. To solve this problem, Gilbert (1986) proposed the hypothesis of a primordial RNA world, in which RNA molecules could have performed the functions that were carried out by DNA and proteins in the subsequent DNA/RNA/protein world.
One of the weaknesses of the RNA world hypothesis was that ribonucleotides (RNA monomers) seemed difficult to be synthesized under plausible prebiotic conditions (Atkins et al. 2011; Ruiz-Mirazo et al. 2014). However, over the last years, this possibility has gained support thanks to recent prebiotic chemistry experiments that have shown that ribonucleotides can be formed from relatively simple organic molecules such as cyanoacetylene (HC3N), cyanamide (NH2CN), glycolaldehyde (CH2OHCHO), urea (NH2CONH2) and/or hydroxylamine (NH2OH; see Powner 2009; Patel 2015; Becker et al. 2016, 2019).
Interestingly, except NH2OH, all these RNA molecular precursors have been detected in the interstellar medium (ISM; Turner 1971, Turner et al. 1975, Hollis et al. 2000, Belloche et al. 2019). As recently shown by Becker et al. (2019), NH2OH is a key precursor in the unified synthesis of both pyrimidine and purine ribonucleotides. However, observational searches of NH2OH in the ISM have so far been unsuccessful (Pulliam et al. 2012; McGuire et al. 2015; Ligterink et al. 2018). This is a puzzling result since NH2OH is expected to form efficiently on dust grains according to chemical models and laboratory experiments (Garrod et al. 2008; Garrod 2013; Zheng & Kaiser 2010; Fedoseev et al. 2012; He et al. 2015).
In this Letter, we present the first detection of NH2OH in the ISM towards the quiescent molecular cloud G+0.693-0.027 (G+0.693, hereafter) located in the Sgr B2 complex in the Galactic Center. This cloud shows a very rich chemistry in complex organic molecules (Requena-Torres et al. 2008; Martín et al. 2008; Zeng et al. 2018; Rivilla et al. 2018, 2019) including urea (Jiménez-Serra et al. 2020), another key ingredient in the pathway to ribonucleotides proposed by Becker et al. (2019). All this makes G+0.693 the perfect target where to search for NH2OH in the ISM.
2 Observations
We have carried out a high-sensitivity spectral survey at 3, 2 and 1 mm toward G+0.693 molecular cloud using the IRAM 30m telescope. The IRAM 30m observations were performed in three observing runs during 2019: April 10-16, August 13-19, and December 11-15 (projects numbers 172-18, 018-19 and 133-19). We used the broad-band Eight MIxer Receiver (EMIR) and the fast Fourier transform spectrometers in FTS200 mode, which provided a channel width of 200 kHz, i.e. a velocity resolution of 0.30.85 km s-1. We smoothed the spectra to resolutions of 1.6, 1.4 and 4.0 km s-1 for the 3, 2, and 1 mm data, respectively, high enough to sample the observed linewidths of 1525 km s-1, and to provide similar root-mean-square () noise (2.63.8 mK), and optimal line visualization. We stress that the results of our analysis (described in Section 3) are independent of the spectral resolution. Each frequency setup was observed several times shifting the central frequency by 20-100 MHz in order to identify possible spectral features resulting from unsuppressed image side band emission. The image-band lines, identified by comparing the same frequency range observed during two different spectral setups, were eliminated during the reduction of the data. The covered spectral ranges were 71.76116.72 GHz, 124.77175.5 GHz, 199.8238.29 GHz, 252.52260.30 GHz and 268.2275.98 GHz. The observations were centered at (J2000.0)= 17h47m22s, (J2000.0)=28∘21′27 ′′. The position switching mode was used in all observations with the off position located at (-885′′,290′′) from the source position. The intensity of the spectra is given in T as the molecular emission toward G+0.693 is relatively extended over the beam (Requena-Torres et al. 2006; Rivilla et al. 2018).
3 Analysis and Results
The identification of the molecular lines was performed using the version 19/06/2020 of SLIM (Spectral Line Identification and Modeling) tool within the MADCUBA package111Madrid Data Cube Analysis on ImageJ is a software developed at the Center of Astrobiology (CAB) in Madrid; http://cab.inta-csic.es/madcuba/Portada.html. (Martín et al. 2019), which uses the spectroscopic entries from the Cologne Database for Molecular Spectroscopy (CDMS, Endres et al. 2016) and the Jet Propulsion Laboratory (JPL; Pickett et al. 1998), and generates the synthetic spectra under the assumption of Local Thermodynamic Equilibrium (LTE) conditions. The spectroscopic information of NH2OH (CDMS entry 33503, from March 2003) was obtained from Tsunekawa (1972) and Morino et al. (2000). NH2OH is nearly a prolate symmetric top molecule, in which the principal a- and c-axis are in a plane of symmetry. Both a-type (=0) and c-type (=0) transitions are allowed, but only the former are expected to be detected in the ISM since the projected dipole moment along the a-axis is about ten times larger (Tsunekawa 1972). The partition function of the ground vibrational state used in the analysis, obtained from the CDMS entry, does not have substantial contribution of the lowest-lying vibrational states (with energies 555 K, Morino et al. 2000) due to the low excitation temperatures of the molecular emission towards G+0.693 (Tex520 K; Requena-Torres et al., 2008; Zeng et al., 2018; Rivilla et al., 2019).
| Molecule | vLSR | Abundancea | Referenceb | |||
|---|---|---|---|---|---|---|
| (1013 cm-2) | (K) | (km s-1) | (km s-1) | (10-10) | ||
| NH2OH | 2.80.6 | 15 | 68.60.8 | 15 | 2.10.9 | 1 |
| HNO | 5.81.3 | 3.70.2 | 66.40.4 | 20.50.9 | 4.31.8 | 1 |
| N2O | 4811 | 182 | 64.70.8 | 212 | 3615 | 1 |
| NO | 3600200 | 4.10.4 | 681 | 211 | 2700700 | 2 |
| NO2 | 29 | 10 | 69 | 20 | 22 | 1 |
| HONO | 0.2 | 10 | 69 | 20 | 0.16 | 1 |
| HNO3 | 0.5 | 10 | 69 | 20 | 0.33 | 1 |
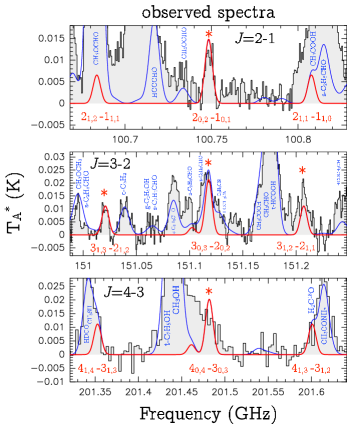
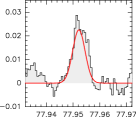
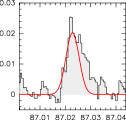
We list in Table 1 all the a-type transitions of NH2OH that fall in the observed data: 15 lines of the rotational transitions =21, 32, and 43. We note that transitions from higher energy levels (5) have low predicted intensities due to the low excitation temperatures of G+0.693. The fitted line profiles of NH2OH (see details of the fit below) are shown with a red solid line in the left panels of Fig. 1. Five of the targeted NH2OH transitions (1 at 3mm, 3 at 2mm, and 1 at 1mm, indicated with an asterisk in Fig. 1), appear either unblended or only slightly blended. The other transitions, which are blended with brighter lines from other molecules, have predicted intensities consistent with the observed spectra.
To properly evaluate the line contamination by other molecules we have searched for more than 300 different molecules in our dataset, including all the species detected and previously towards G+0.693 (e.g. Requena-Torres et al. 2006, 2008; Zeng et al. 2018; Rivilla et al. 2018, 2019; Jiménez-Serra et al. 2020), and those detected so far in the ISM (McGuire 2018)222See also https://cdms.astro.uni-koeln.de/classic/molecules, and http://astrochymist.org/astrochymistmole.html. We have fitted the emission of all the detected molecules, and produced the total LTE spectra, which is shown with a solid blue line in the left panels of Fig. 1. We list in the last column of Table 1 the molecules with transitions that produce blending with some of the NH2OH lines. More detailed information about all the identified molecular transitions that contribute to the line emission in the spectral ranges shown in Fig. 1 is presented in Appendix A.
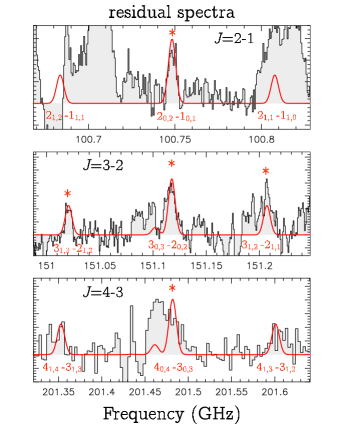
To highlight the emission from NH2OH, we have computed the residual spectra obtained by subtracting from the observed spectra the predicted LTE contribution for all the identified molecular species but NH2OH. The resulting residual spectra, shown in the right panels of Fig. 1, clearly exhibit the spectral line profiles that match the LTE predictions for NH2OH in red solid lines (see below), supporting the identification of NH2OH333We note that the NH2OH transition at 100.683580 GHz is not well reproduced in the residual spectra due to the oversubtraction of the LTE model of two bright contaminating transitions of CH3OCH3: 980,8 A E..
To derive the physical parameters that explain the NH2OH emission, we used the SLIM-AUTOFIT tool of MADCUBA that provides the best non-linear least-squares LTE fit to the data using the Levenberg-Marquardt algorithm. The fitted parameters are: molecular column density (), excitation temperature (), central velocity (vLSR) and full width half maximum () of the Gaussian profiles. SLIM considers the solution of the radiative transfer as described in eq. 4 of Martín et al. (2019). For the modeling of G+0.693, where no continuum emission is detected (e.g. Ginsburg et al. 2016), we consider =0, and the cosmic background temperature of =2.73 K. The fit to the NH2OH profiles was performed by considering also the total contribution of the LTE emission from all the other identified molecules (blue line in Fig 1). We fixed the linewidth to 15 km s-1, which reproduces the profiles of the two strongest completely unblended transitions, 210,1 and 321,2 (Fig. 1). This value is consistent with the typical molecular linewidths found towards G+0.693, which span between 14 and 34 km s-1 (e.g. Requena-Torres et al. 2008; Zeng et al. 2018). We considered typical values of found in G+0.693 in the range 520 K (see e.g. Zeng et al. 2018). Low values (510 K) underestimate the observed intensities of the NH2OH transitions at 2 and 1 mm, while values in the range 1520 K are able to reproduce well all the transitions. We thus fixed =15 K444The value of the partition function of NH2OH, log (15K)=1.4613, is obtained by log-log linear interpolation of the values at 9.375 and 18.75 K from CDMS. to perform the fit, noting that if the assumed fixed value is 20 K the derived column density would only vary by a factor of 1.1. We then performed AUTOFIT, leaving column density and vLSR as free parameters. The resulting best LTE fit is shown by the red curve in Fig. 1, and the derived physical parameters are presented in Table 2. To derive the final uncertainty of the column density we added quadratically the error derived from the fitting algorithm, and a 20 from the typical flux density uncertainty of the IRAM 30m telescope. We obtain a column density of (2.80.6)1013 cm-2, which translates into a molecular abundance with respect to molecular hydrogen of (2.10.9)10-10.
To gain insight into the interstellar chemistry and synthesis routes of NH2OH in the ISM, we have also analysed the emission from chemically-related species. We detected the nitroxyl radical (HNO) and nitrous oxide (N2O). The observed spectra along with the derived best LTE fits for these two molecules, reported for the first time in G+0.693 in this Letter, are presented in Appendix C. Other species such as HONO, NO2 and HNO3 were not detected. The derived physical parameters for all these species are reported in Table 2.
| Region | NH2OH | NO | N2O | NH2OH/NO | NO/N2O | Referencesa |
|---|---|---|---|---|---|---|
| G+0.693 | 2.110-10 | 2.710-7 | 3.510-9 | 810-4 | 76 | 1 |
| L1157-B1 | 1.410-8 | (4-7)10-6 | - | 310-3 | - | 2,3 |
| IRAS 16293-2422 B | 3.110-11 | 1.710-9 | 3.310-9 | 210-2 | 0.5 | 4 |
| Sgr B2(N)b | 810-12 | 6.210-9 | 1.510-9 | 1.310-3 | 4 | 5,6 |
| Sgr B2(M) | - | 910-9 | 110-9 | - | 9 | 7 |
(a) References: (1) This work; (2) McGuire et al. (2015); (3) Codella et al. (2018); (4) Ligterink et al. (2018); (5) Pulliam et al. (2012) ; (6) Halfen et al. (2001); (7) Ziurys et al. (1994). (b) For a comparison with the NH2OH upper limit obtained by Pulliam et al. (2012), the NO abundance has been recalculated using the column density reported by Halfen et al. (2001) and the hydrogen column density used by Pulliam et al. (2012).
4 Discussion
4.1 Formation of NH2OH in the ISM
Table 3 compares the abundance of NH2OH in G+0.693 with the upper limits found in other regions where it has been previously searched for. We find that the abundance of NH2OH in G+0.693 is about a factor of 6 and 25 higher than the upper limits measured in the hot corino IRAS 162932422 B and the hot core Sgr B2(N), respectively (Ligterink et al. 2018; Pulliam et al. 2012). Unfortunately, the upper limit toward the protostellar shock L1157-B1 (McGuire et al. 2015) is too high for a meaningful comparison.
The several routes that have been proposed for the synthesis of NH2OH in the ISM, all of them based on surface chemistry, are summarized in Table 4. The hydrogenation of nitrogen oxide (NO) (Route 1; Table 4) was suggested theoretically by Charnley et al. (2001) and it has been confirmed experimentally by different groups (Fedoseev et al., 2012; Congiu et al., 2012). In this process, the successive hydrogenation of NO and its products HNO and H2NO, is barrierless (or it occurs with very small activation barriers), yielding NH2OH in a very efficient way even at low temperatures (Congiu et al., 2012; Fedoseev et al., 2012). This chemical scheme requires the presence of significant amounts of NO on grain surfaces. For the case of G+0.693, this is not an issue since high abundances of this molecule are measured toward this source (of 310-7; Table 3). Similar high abundances of NO have been measured toward the shocked region B1 in the L1157 molecular outflow (Codella et al. 2018, Table 3). These authors showed that such high NO abundance can be produced via the neutral-neutral reaction N + OH NO + H in the gas phase. Thus, a significant fraction of NO would then be available to deplete onto dust grains at the low dust temperatures of G+0.693 (30 K; Rodríguez-Fernández et al., 2004).
Although NO could be destroyed prior to be depleted onto dust grains due to its conversion to N2O via the gas-phase reaction NO + NH N2O+H (Halfen et al., 2001), this mechanism does not seem efficient in G+0.693, where the NO/N2O ratio of 76 is much higher than those found in hotter sources (Table 3). As indicated by Halfen et al. (2001), this gas phase reaction is only efficient for kinetic temperatures 150 K. The gas kinetic temperature in G+0.693 is 50120 K (Hüettemeister et al. 1993; Krieger et al. 2017), i.e. lower than in hot cores/corinos (with temperatures of 200300 K; Belloche et al. 2013; Jørgensen et al. 2016), which would explain the low efficiency of the gas-phase conversion of NO into N2O. Note, however, that N2O could also be formed on the surface of dust grains (Fedoseev et al. 2012; Congiu et al. 2012), and be subsequently desorbed by shocks in G+0.693, which might explain the observed N2O.
In addition, we have also detected HNO (see Table 2 and Appendix C), the first hydrogenation product of NO, supporting this chemical route. Although several gas-phase formation routes of HNO exist, such as e.g. NH2 + O H + HNO, or HCO + NO HNO + CO (see the KIDA database555http://kida.astrophy.u-bordeaux.fr, Wakelam et al. 2012), Hasegawa et al. (1992) showed that the predicted abundance of HNO in models that consider only gas-phase reactions is of just a few 10-11. Since the derived abundance of HNO in G+0.693 is about one order of magnitude higher, the formation of HNO in G+0.693 likely occurs mainly on the surface of dust grains through the NO hydrogenation chain that also produces NH2OH.
Other NH2OH formation pathways have been proposed by laboratory experiments (Nishi et al. 1984; Zheng & Kaiser 2010) and chemical modeling (Garrod 2013) involving the amidogen radical NH2 (see Routes 2a and 2b in Table 4). However, we note again that the low dust temperature in G+0.693 (30 K, Rodríguez-Fernández et al. 2004) would limit the mobility of heavier radicals such as NH2 or OH on grain surfaces (Routes 2a and 2b) compared to atomic H (Route 1), which suggests that the hydrogenation route is more plausible.
The third grain-surface reaction for the formation of NH2OH is the oxidation of NH3 (Routes 3 and 4 in Table 4). The experiments of He et al. (2015) and Tsegaw et al. (2017) show that NH2OH can be formed on the surface of dust grains from NH3 and O/O2 at warm (70 K) and cold temperatures (10 K), respectively. In the He et al. (2015) work, however, the predicted ice-mantle abundance of NH2OH (with respect to H) lies in the range 1010-6, which is several orders of magnitude higher than the one observed in the gas phase of G+0.693. Besides missing destruction pathways, this could be due to an optimistic value of the reaction rate of NH3 + O NH2OH in He et al. (2015), since the oxidation of NH3 in their experiments occurs via the Eley-Rideal mechanism, which may be more efficient than the Langmuir-Hinschelwood mechanism taking place on interstellar dust grains.
The second oxidation route, NH3 + O2 NH2OH + O, has been studied by the laboratory experiments by Tsegaw et al. (2017), in which interstellar ice analogs were irradiated with energetic electrons to mimic the effect of cosmic rays. Since G+0.693 is affected by a high cosmic-ray ionization rate (Requena-Torres et al. 2006; Zeng et al. 2018), this oxidation route might be a possible additional mechanism for the formation of NH2OH.
In contrast to grain-surface chemistry, very little is known about possible gas-phase formation routes for NH2OH. Experimental works have shown that gas-phase production of NH2OH through the reaction between HNO+ and H2, is inefficient (Blagojevic et al. 2003). Neutral-neutral reactions such as NH3 + OH or NH2 + OH are expected to be efficient at the kinetic temperatures of G+0.693 (see KIDA database). However, these reactions mainly yield, respectively, NH2 + H2O and NH + H2O. Indeed, no NH2OH seems to be found in the products of the gas-phase reaction NH3 + H2O (Prof. D. Heard, private communication), although further experiments and quantum chemical calculations are needed to confirm this result.
| Route | References | |
|---|---|---|
| 1) | NO HNO H2NO/HNOH NH2OH | i |
| 2a) | NH2 + H + H2O NH2OH +H2 | ii |
| 2b) | NH2 + OH NH2OH | iii |
| 3) | NH3 +O NH2OH | iv |
| 4) | NH3 +O2 NH2OH + O | v |
4.2 The role of NH2OH in prebiotic chemistry
Recent prebiotic experiments conducted under plausible early Earth conditions have shown that NH2OH is a central species in the synthesis of pyrimidine rubonucleotides (Becker et al. 2019), through its reaction with HC3N in the presence of urea (NH2CONH2). HC3N is very abundant in G+0.693 (Zeng et al. 2018), and NH2CONH2 has also been detected recently toward this source (Jiménez-Serra et al. 2020). Thus, the only missing ingredient was NH2OH, reported in this paper. Precursors of purine ribonucleotides such as cyanamide (NH2CN) and glycolaldehyde (CH2OHCHO) (Powner 2009; Becker et al. 2016), have also been detected in G+0.693 (Requena-Torres et al. 2008; Zeng et al. 2018). Therefore, the G+0.693 molecular cloud presents all precursors of ribonucleotides.
In summary, the detection of NH2OH in the molecular cloud G+0.693 supports the idea that essential prebiotic precursors of the RNA world could have been synthesized initially in the ISM, to be subsequently transferred to small Solar-System bodies, and later on to young planets through the impact of meteorites and comets (see e.g. Chyba & Sagan 1992; Pierazzo & Chyba 1999; Pearce & Pudritz 2015; Martins 2018; Pizzarello et al. 2006; Rubin et al. 2019; Rivilla et al. 2020).
References
- Atkins et al. (2011) Atkins, J., Gesteland, R., & Cech, T. . 2011, 66 pages, 73 col & 23 b/w illus, ed. C. S. H. L. Press, 366
- Becker et al. (2016) Becker, S., Thoma, I., Deutsch, A., et al. 2016, Science, 352, 833, doi: 10.1126/science.aad2808
- Becker et al. (2019) Becker, S., Feldmann, J., Wiedemann, S., et al. 2019, Science, 366, 76, doi: 10.1126/science.aax2747
- Belloche et al. (2019) Belloche, A., Garrod, R. T., Müller, H. S. P., et al. 2019, A&A, 628, A10, doi: 10.1051/0004-6361/201935428
- Belloche et al. (2013) Belloche, A., Müller, H. S. P., Menten, K. M., Schilke, P., & Comito, C. 2013, Astronomy and Astrophysics, 559, A47, doi: 10.1051/0004-6361/201321096
- Blagojevic et al. (2003) Blagojevic, V., Petrie, S., & Bohme, D. K. 2003, MNRAS, 339, L7, doi: 10.1046/j.1365-8711.2003.06351.x
- Charnley et al. (2001) Charnley, S. B., Rodgers, S. D., & Ehrenfreund, P. 2001, A&A, 378, 1024, doi: 10.1051/0004-6361:20011193
- Chyba & Sagan (1992) Chyba, C., & Sagan, C. 1992, Nature, 355, 125, doi: 10.1038/355125a0
- Codella et al. (2018) Codella, C., Viti, S., Lefloch, B., et al. 2018, MNRAS, 474, 5694, doi: 10.1093/mnras/stx3196
- Congiu et al. (2012) Congiu, E., Fedoseev, G., Ioppolo, S., et al. 2012, ApJ, 750, L12, doi: 10.1088/2041-8205/750/1/L12
- Endres et al. (2016) Endres, C. P., Schlemmer, S., Schilke, P., Stutzki, J., & Müller, H. S. P. 2016, Journal of Molecular Spectroscopy, 327, 95, doi: 10.1016/j.jms.2016.03.005
- Fedoseev et al. (2012) Fedoseev, G., Ioppolo, S., Lamberts, T., et al. 2012, J. Chem. Phys., 137, 054714, doi: 10.1063/1.4738893
- Garrod (2013) Garrod, R. T. 2013, ApJ, 765, 60, doi: 10.1088/0004-637X/765/1/60
- Garrod et al. (2008) Garrod, R. T., Widicus Weaver, S. L., & Herbst, E. 2008, The Astrophysical Journal, 682, 283, doi: 10.1086/588035
- Gilbert (1986) Gilbert, W. 1986, Nature, 319, 618, doi: 10.1038/319618a0
- Ginsburg et al. (2016) Ginsburg, A., Henkel, C., Ao, Y., et al. 2016, Astronomy & Astrophysics, 586, A50, doi: 10.1051/0004-6361/201526100
- Halfen et al. (2001) Halfen, D. T., Apponi, A. J., & Ziurys, L. M. 2001, ApJ, 561, 244, doi: 10.1086/322770
- Hasegawa et al. (1992) Hasegawa, T. I., Herbst, E., & Leung, C. M. 1992, ApJS, 82, 167, doi: 10.1086/191713
- He et al. (2015) He, J., Vidali, G., Lemaire, J.-L., & Garrod, R. T. 2015, ApJ, 799, 49, doi: 10.1088/0004-637X/799/1/49
- Hollis et al. (2000) Hollis, J. M., Lovas, F. J., & Jewell, P. R. 2000, The Astrophysical Journal Letters, 540, L107, doi: 10.1086/312881
- Hüettemeister et al. (1993) Hüettemeister, S., Wilson, T. L., Bania, T. M., & Martín-Pintado, J. 1993, Astronomy and Astrophysics, 280, 255. http://adsabs.harvard.edu/abs/1993A%26A...280..255H
- Jiménez-Serra et al. (2020) Jiménez-Serra, I., Martń-Pintado, J., Rivilla, V. M., et al. 2020, Astrobiology, 0, null, doi: 10.1089/ast.2019.2125
- Jørgensen et al. (2016) Jørgensen, J. K., van der Wiel, M. H. D., Coutens, A., et al. 2016, A&A, 595, A117, doi: 10.1051/0004-6361/201628648
- Krieger et al. (2017) Krieger, N., Ott, J., Beuther, H., et al. 2017, The Astrophysical Journal, 850, 77, doi: 10.3847/1538-4357/aa951c
- Ligterink et al. (2018) Ligterink, N. F. W., Calcutt, H., Coutens, A., et al. 2018, A&A, 619, A28, doi: 10.1051/0004-6361/201731980
- Martín et al. (2019) Martín, S., Martín-Pintado, J., Blanco-Sánchez, C., et al. 2019, A&A, 631, A159, doi: 10.1051/0004-6361/201936144
- Martín et al. (2008) Martín, S., Requena-Torres, M. A., Martín-Pintado, J., & Mauersberger, R. 2008, The Astrophysical Journal, 678, 245, doi: 10.1086/533409
- Martins (2018) Martins, Z. 2018, Life, 8, doi: 10.3390/life8030028
- McGuire (2018) McGuire, B. A. 2018, ApJS, 239, 17, doi: 10.3847/1538-4365/aae5d2
- McGuire et al. (2015) McGuire, B. A., Carroll, P. B., Dollhopf, N. M., et al. 2015, ApJ, 812, 76, doi: 10.1088/0004-637X/812/1/76
- Mojzsis et al. (1996) Mojzsis, S. J., Arrhenius, G., McKeegan, K. D., et al. 1996, Nature, 384, 55–59, doi: 10.1038/384055a0
- Morino et al. (2000) Morino, I., Yamada, K., Klein, H., et al. 2000, Journal of Molecular Structure, 517-518, 367 , doi: https://doi.org/10.1016/S0022-2860(99)00263-X
- Nishi et al. (1984) Nishi, N., Shinohara, H., & Okuyama, T. 1984, J. Chem. Phys., 80, 3898, doi: 10.1063/1.447172
- Patel (2015) Patel, B. H., P. C. R. D. J. D. C. D. S. J. D. 2015, Nature Chemistry, 7, 301, doi: 10.1038/nchem.2202
- Pearce & Pudritz (2015) Pearce, B. K. D., & Pudritz, R. E. 2015, The Astrophysical Journal, 807, 85, doi: 10.1088/0004-637x/807/1/85
- Pickett et al. (1998) Pickett, H. M., Poynter, R. L., Cohen, E. A., et al. 1998, J. Quant. Spec. Radiat. Transf., 60, 883, doi: 10.1016/S0022-4073(98)00091-0
- Pierazzo & Chyba (1999) Pierazzo, E., & Chyba, C. F. 1999, Meteoritics & Planetary Science, 34, 909, doi: 10.1111/j.1945-5100.1999.tb01409.x
- Pizzarello et al. (2006) Pizzarello, S., Cooper, G. W., & Flynn, G. J. 2006, The Nature and Distribution of the Organic Material in Carbonaceous Chondrites and Interplanetary Dust Particles, ed. D. S. Lauretta & H. Y. McSween, 625
- Powner (2009) Powner, Matthew W., G. B. S. J. D. 2009, Nature, 459, 239–242, doi: 10.1038/nature08013
- Pulliam et al. (2012) Pulliam, R. L., McGuire, B. A., & Remijan, A. J. 2012, ApJ, 751, 1, doi: 10.1088/0004-637X/751/1/1
- Requena-Torres et al. (2008) Requena-Torres, M. A., Martín-Pintado, J., Martín, S., & Morris, M. R. 2008, The Astrophysical Journal, 672, 352, doi: 10.1086/523627
- Requena-Torres et al. (2006) Requena-Torres, M. A., Martín-Pintado, J., Rodríguez-Franco, A., et al. 2006, Astronomy & Astrophysics, 455, 971, doi: 10.1051/0004-6361:20065190
- Rivilla et al. (2018) Rivilla, V. M., Jiménez-Serra, I., Zeng, S., et al. 2018, Monthly Notices of the Royal Astronomical Society, doi: 10.1093/mnrasl/slx208
- Rivilla et al. (2019) Rivilla, V. M., Martín-Pintado, J., Jiménez-Serra, I., et al. 2019, MNRAS, 483, L114, doi: 10.1093/mnrasl/sly228
- Rivilla et al. (2020) Rivilla, V. M., Drozdovskaya, M. N., Altwegg, K., et al. 2020, MNRAS, 492, 1180, doi: 10.1093/mnras/stz3336
- Rodríguez-Fernández et al. (2004) Rodríguez-Fernández, N. J., Martín-Pintado, J., Fuente, A., & Wilson, T. L. 2004, Astronomy and Astrophysics, 427, 217, doi: 10.1051/0004-6361:20041370
- Rubin et al. (2019) Rubin, M., Bekaert, D. V., Broadley, M. W., Drozdovskaya, M. N., & Wampfler, S. F. 2019, ACS Earth and Space Chemistry, 3, 1792, doi: 10.1021/acsearthspacechem.9b00096
- Ruiz-Mirazo et al. (2014) Ruiz-Mirazo, K., Briones, C., & de la Escosura, A. 2014, Chemical reviews, 114, 285, doi: 10.1021/cr2004844
- Tsegaw et al. (2017) Tsegaw, Y. A., Góbi, S., Förstel, M., et al. 2017, Journal of Physical Chemistry A, 121, 7477, doi: 10.1021/acs.jpca.7b07500
- Tsunekawa (1972) Tsunekawa, S. 1972, Journal of the Physical Society of Japan, 33, 167, doi: 10.1143/JPSJ.33.167
- Turner (1971) Turner, B. E. 1971, ApJ, 163, L35, doi: 10.1086/180662
- Turner et al. (1975) Turner, B. E., Liszt, H. S., Kaifu, N., & Kisliakov, A. G. 1975, ApJ, 201, L149, doi: 10.1086/181963
- Wakelam et al. (2012) Wakelam, V., Herbst, E., Loison, J.-C., et al. 2012, The Astrophysical Journal Supplement, 199, 21, doi: 10.1088/0067-0049/199/1/21
- Zeng et al. (2018) Zeng, S., Jiménez-Serra, I., Rivilla, V. M., et al. 2018, Monthly Notices of the Royal Astronomical Society, 478, 2962, doi: 10.1093/mnras/sty1174
- Zheng & Kaiser (2010) Zheng, W., & Kaiser, R. I. 2010, Journal of Physical Chemistry A, 114, 5251, doi: 10.1021/jp911946m
- Ziurys et al. (1994) Ziurys, L. M., Apponi, A. J., Hollis, J. M., & Snyder, L. E. 1994, ApJ, 436, L181, doi: 10.1086/187662
5 ACKNOWLEDGEMENTS
We acknowledge the anonymous reviewers for their careful reading of the manuscript and their useful comments. This work is based on observations carried out under projects number 172-18, 018-19 and 133-19 with the IRAM 30m telescope. IRAM is supported by INSU/CNRS (France), MPG (Germany) and IGN (Spain). We thank the IRAM-30m staff for the precious help during the different observing runs. V.M.R. has received funding from the European Union’s Horizon 2020 research and innovation programme under the Marie Skłodowska-Curie grant agreement No 664931. I.J.-S. and J.M.-P. have received partial support from the Spanish FEDER (project number ESP2017-86582-C4-1-R), the Ministry of Science and Innovation through project number PID2019-105552RB-C41, and State Research Agency (AEI) through project number MDM-2017-0737 Unidad de Excelencia María de MaeztuCentro de Astrobiología (INTA-CSIC).
Appendix A Full molecular identification
We list in Table 5 the identified molecular transitions of the molecules that contribute to the spectra shown in Fig. 1. We have searched for more than 300 different molecules in our spectral survey, including all the species detected previously towards G+0.693 (e.g. Requena-Torres et al. 2006, 2008; Zeng et al. 2018; Rivilla et al. 2018, 2019; Jiménez-Serra et al. 2020), and those detected so far in the ISM666See also https://cdms.astro.uni-koeln.de/classic/molecules, and http://astrochymist.org/astrochymistmole.html (McGuire 2018). We show in Table 5 transitions with line intensities 1 mK.
| Molecule | Freq. | |
|---|---|---|
| (GHz) | (mK) | |
| 3 mm - NH2OH =21 | ||
| CH3OCHO | 100.6815450 | 93.3 |
| CH3OCHO | 100.6833680 | 93.4 |
| NH2OH | 100.6835800 | 6.1 |
| CH3OCHO | 100.6931270 | 1.22 |
| HCCCHO | 100.7169300 | 18.4 |
| CH3OCHO | 100.734805 | 1.1 |
| NH2OH | 100.7482300 | 12.1 |
| NH2OH | 100.8076200 | 6.1 |
| CH3COOH | 100.8119422 | 1.52 |
| s-C2H5CHO | 100.8149861 | 6.3 |
| s-C2H5CHO | 100.8149861 | 6.3 |
| Molecule | Freq. | |
|---|---|---|
| (GHz) | (mK) | |
| 2 mm - NH2OH =32 | ||
| CH3OCH3 | 150.992109 | 1.8 |
| CH3OCH3 | 150.9921790 | 2.8 |
| s-C2H5CHO | 150.9952334 | 1.5 |
| CH3OCH3 | 150.9953910 | 7.4 |
| s-C2H5CHO | 150.9954363 | 1.5 |
| CH3OCH3 | 150.9954363 | 1.5 |
| CH3OCH3 | 150.9986390 | 4.6 |
| NH2OH | 151.0207010 | 11.6 |
| c-C3H2 | 151.0391730 | 3.2 |
| g-C2H5OH | 151.0641006 | 2.2 |
| s-C2H5CHO | 151.0653970 | 1.1 |
| s-C2H5CHO | 151.0654207 | 1.1 |
| s-C2H5CHO | 151.0831633 | 1.1 |
| s-C2H5CHO | 151.0831861 | 1.1 |
| s-C2H5CHO | 151.0970518 | 1.1 |
| s-C2H5CHO | 151.0970740 | 1.1 |
| NH2OH | 151.1019860 | 2.2 |
| NH2OH | 151.1023240 | 2.2 |
| s-C2H5CHO | 151.1148181 | 1.1 |
| s-C2H5CHO | 151.1148394 | 1.1 |
| NH2OH | 151.1176680 | 19.4 |
| C2H5CN | 151.1272640 | 3.5 |
| HOCH2CN | 151.1300319 | 1.0 |
| CH3COOH | 151.1620321 | 1.5 |
| CH3CHO | 151.1671882 | 18.4 |
| t-HCOOH | 151.1762475 | 81.4 |
| NH2OH | 151.2070070 | 11.6 |
| HCOCH2OH | 151.2430164 | 4.5 |
| Molecule | Freq. | |
| (GHz) | (K) | |
| 1 mm - NH2OH =43 | ||
| HDCO | 201.3413620 | 13.2 |
| CH3SH | 201.3440150 | 14.6 |
| NH2OH | 201.3525783 | 13.6 |
| t-C2H5OH | 201.4372959 | 24.3 |
| CH3OH | 201.4454903 | 77.0 |
| NH2OH | 201.4606626 | 3.3 |
| NH2OH | 201.4615977 | 3.3 |
| NH2OH | 201.4817175 | 21.6 |
| NH2OH | 201.6007146 | 13.6 |
| H2C18O | 201.6142649 | 21.4 |
| CH3CONH2 | 201.6210000 | 1.7 |
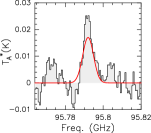
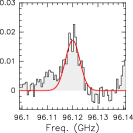
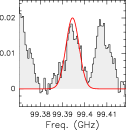
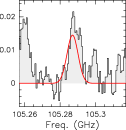
Appendix B Detection of Propanal (s-C2H5CHO) towards G+0.693
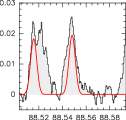
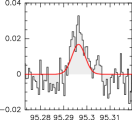
The syn-conformer of propanal (s-C2H5CHO) has been identified towards the G+0.693 molecular cloud. The analysis has been done using the SLIM-MADCUBA tool, following the same procedure described in Section 3. We use the CDMS entry 58505 (version Jan. 2018). We fixed vLSR to 69 km s-1 and to 21 km s-1, and obtained = 12.00.8 K, and =(7.41.5)1013 cm-2, which translates into an abundance with respect to H2 of (52)10-10. The best LTE fit for selected transitions (listed in Table 6) is shown in Figure 2 with a red line. The s-C2H5CHO transitions that contribute to the spectra shown in Fig. 1 are listed in Table 5.

| Frequency | Transition | log | Eu |
|---|---|---|---|
| (GHz) | (s-1) | (K) | |
| 77.1819857 | 871,7 E | -5.1418 | 17.4 |
| 77.1819857 | 871,7 A | -5.1418 | 17.4 |
| 77.9521729 | 870,7 E | -5.1275 | 17.3 |
| 77.9521729 | 870,7 A | -5.1275 | 17.3 |
| 87.0228499 | 980,8 E | -4.9808 | 21.5 |
| 87.0228499 | 980,8 A | -4.9808 | 21.5 |
| 88.5156329 | 872,5 E | -4.9810 | 21.0 |
| 88.5156329 | 872,5 A | -4.9810 | 21.0 |
| 88.5476678 | 322,0 E | -5.0515 | 8.0 |
| 88.5485859 | 322,0 A | -5.0116 | 8.0 |
| 95.2964249 | 1091,9 E | -4.8656 | 26.1 |
| 95.2964249 | 1091,9 A | -4.8656 | 26.1 |
| 95.7920583 | 1091,9 E | -4.8531 | 26.1 |
| 95.7920583 | 1091,9 A | -4.8531 | 26.1 |
| 96.1200037 | 1090,9 E | -4.8484 | 26.1 |
| 96.1200037 | 1090,9 A | -4.8484 | 26.1 |
| 99.3945076 | 432,2 E | -4.9654 | 10.0 |
| 99.3945076 | 432,2 A | -4.9643 | 10.0 |
| 105.2870083 | 1091,8 E | -4.7369 | 29.1 |
| 105.2870083 | 1091,8 A | -4.7369 | 29.1 |
Appendix C Detections of HNO and N2O towards G+0.693
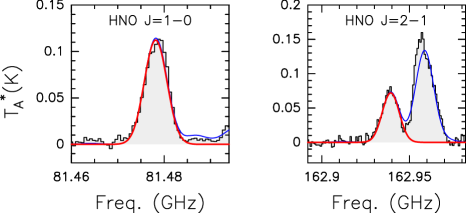
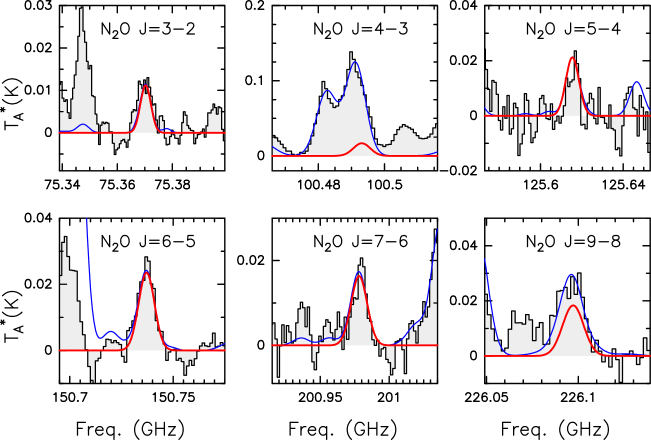
We report here the detection of the nitroxyl radical (HNO) and nitrous oxide (N2O) towards G+0.693. We show in Figs. 3 and 4 the detected transitions of HNO and N2O, respectively, which are listed in Table 7. The analysis have been done using the SLIM-MADCUBA tool, following the same procedure described in Section 3. The derived parameters from the fits (, , and vLSR) are presented in Table 2.
| Molecule | Frequency | Transition(a) | log | Eu |
| (GHz) | (s-1) | (K) | ||
| HNO | 81.47749 | 100,0 F=2-1 | -5.65235 | 3.9 |
| HNO | 81.47749 | 100,0 F=1-1 | -5.65240 | 3.9 |
| HNO | 81.47749 | 100,0 F=0-1 | -5.65240 | 3.9 |
| HNO | 162.937949 | 210,1 F=3-2 | -4.67021 | 11.7 |
| HNO | 162.937949 | 210,1 F=2-1 | -4.79519 | 11.7 |
| HNO | 162.937949 | 210,1 F=1-0 | -4.92554 | 11.7 |
| HNO | 162.937949 | 210,1 F=1-1 | -5.05044 | 11.7 |
| HNO | 162.937949 | 210,1 F=2-2 | -5.27229 | 11.7 |
| HNO | 162.937949 | 210,1 F=1-2 | -6.22654 | 11.7 |
| N2O | 75.369224 | 32 | -7.25771 | 7.2 |
| N2Ob | 100.49174 | 43 | -6.86711 | 12.1 |
| N2O | 125.61369 | 54 | -6.56660 | 18.1 |
| N2O | 150.735046 | 65 | -6.32247 | 25.3 |
| N2O | 200.975333 | 87 | -6.32247 | 43.4 |
| N2Oc | 226.0940229 | 98 | -6.32247 | 54.3 |
(a): The format for the quantum numbers is for HNO and for N2O.
(b): Transition contaminated by CH3OCHO (100.490682 GHz) and aGg-(CH2OH)2 (100.4906121 GHz).
(c): Transition contaminated by CH3SH (226.093108 GHz).