Origin of micron-scale propagation lengths of heat-carrying acoustic excitations in amorphous silicon
Abstract
The heat-carrying acoustic excitations of amorphous silicon are of interest because their mean free paths may approach micron scales at room temperature. Despite extensive investigation, the origin of the weak acoustic damping in the heat-carrying frequencies remains a topic of debate. Here, we report measurements of the thermal conductivity mean free path accumulation function in amorphous silicon thin films from 60 - 315 K using transient grating spectroscopy. With additional picosecond acoustics measurements and considering the known frequency-dependencies of damping mechanisms in glasses, we reconstruct the mean free paths from THz. The mean free paths are independent of temperature and exhibit a Rayleigh scattering trend over most of this frequency range. The observed trend is inconsistent with the predictions of numerical studies based on normal mode analysis but agrees with diverse measurements on other glasses. The micron-scale MFPs in amorphous Si arise from the absence of anharmonic or two-level system damping in the sub-THz frequencies, leading to heat-carrying acoustic excitations with room-temperature damping comparable to that of other glasses at cryogenic temperatures.
The collective acoustic excitations of amorphous solids are of fundamental interest due to their anomalous properties compared to those of crystalline solids, including an excess heat capacity at cryogenic temperatures Malinovsky et al. (1990); Liu and v Löhneysen (1996) and damping by two-level systems Jäckle et al. (1976); Phillips (1972); HUNKLINGER and ARNOLD (1976); Anderson et al. (1972); Zaitlin and Anderson (1975a). The dispersion and damping of acoustic excitations responsible for heat transport have been extensively explored in many glasses using experimental methods such as inelastic scattering Baldi et al. (2010); Moon et al. (2019); Monaco and Giordano (2009); Rufflé et al. (2006); Masciovecchio et al. (1996); Sette et al. (1998), tunnel junction spectroscopy Dietsche and Kinder (1979), Brillouin scattering Vacher et al. (1980); Vacher and Pelous (1976); Benassi et al. (2005), and picosecond acoustics Zhu et al. (1991); Devos et al. (2008), among others. These studies have generally found that excitations with well-defined frequency and wave vector are supported up to THz. In vitreous silica, a relative of amorphous silicon (aSi), the attenuation exhibits several different regimes, yielding different power-law frequency dependencies. For frequencies below GHz the damping scales as corresponding to anharmonic and thermally activated relaxation damping. Between 600 GHz and 1 THz, a Rayleigh scattering trend of is observed, followed by a return to scaling Baldi et al. (2010). At still higher frequencies, Kittel proposed that attenuation is independent of frequency if the wavelength is comparable to the interatomic length scale Kittel (1949). Considering these different regimes, the general trend of MFP versus frequency of acoustic excitations in glasses has been presented in Fig. 7 of Ref. Freeman and Anderson (1986) and Fig. 3 of Ref. Goodson et al. (1994), among others Zeller and Pohl (1971); Graebner et al. (1986).
Amorphous silicon is an anomalous glass for several reasons. First, at ultrasonic frequencies, attenuation by two-level systems is observed in vitreous silica but not in aSi, suggesting a low density of these systems in aSi Von Haumeder et al. (1980); Liu et al. (1997). Second, thermal transport measurements indicate that the thermal conductivity of aSi can be higher than those of many glasses Wieczorek et al. (1989); Kuo et al. (1992); Moon et al. (2002); Liu et al. (2009) and that heat-carrying acoustic excitations travel distances on the order of one micron at room temperature despite the atomic disorder Liu et al. (2009); Kwon et al. (2017); Braun et al. (2016); Pan et al. (2020). This value is far larger than few nanometer value inferred for vitreous silica at room temperature Zeller and Pohl (1971); Goodson et al. (1994).
Experimentally probing the damping of acoustic excitations in this regime with small sample volume is a long-standing experimental challenge, and as a result, studies of the acoustic excitations in aSi have relied on numerical simulations based on normal mode analysis. Feldman and Allen classified the excitations in aSi as propagons, diffusons, and locons according to the qualities of the normal mode eigenvectors Allen et al. (1999). Fabian and Allen computed anharmonic decay rates of the normal modes of aSi, predicting that they should exhibit a clear temperature dependence Fabian and Allen (1996). Other molecular dynamics simulations based on normal mode analysis have predicted that the MFPs decrease as with increasing frequency for excitations of a few THz frequency, leading to the conclusion that they are damped by anharmonicity Larkin and McGaughey (2014); Sääskilahti et al. (2016). Although some of these predictions are reported to be consistent with experiment Zink et al. (2006), others are not. For instance, the predicted temperature dependence of THz excitations in Ref. Fabian and Allen (1996) is not observed experimentally using inelastic x-ray scattering Moon et al. (2019). In the hypersonic frequency band GHz, the measured values of attenuation are lower than those predicted by anharmonic damping Hondongwa et al. (2011).
An experimental approach to constrain the frequency-dependence of sub-THz phonon damping in aSi would help to resolve this discrepancy. For solids like aSi with MFPs in the micron range, transient grating (TG) is a tabletop experimental method that is capable of measuring the MFP accumulation function, or the cumulative thermal conductivity distribution versus MFP Minnich (2012). The technique relies on observations of non-diffusive thermal transport to constrain this function. The frequency-dependent MFPs and hence the damping mechanisms can be reconstructed from these measurements in certain cases with additional data. In the particular case of aSi, the dispersion of acoustic excitations is isotropic and experimentally available Moon et al. (2019); the low and high frequency limits of the attenuation coefficient are known from picosecond acoustics and inelastic x-ray scattering Moon et al. (2019), respectively; and the frequency-dependencies of the acoustic damping mechanisms of glasses are known Jäckle et al. (1976), providing ample constraints for the reconstruction.
Here, we report the application of this approach to reconstruct the MFPs of sub-THz acoustic excitations in a free-standing aSi thin film. The reconstructed MFPs are independent of temperature and exhibit a Rayleigh-type scattering trend over most of the accessible frequency range from THz. These trends are inconsistent with predictions from normal mode analysis but agree with the trends measured in other glasses. The distinguishing feature of aSi is the weak anharmonic or two-level systems (TLS) damping of sub-THz vibrations, leading to acoustic attenuation in aSi at room temperature comparable to that of vitreous silica at K.
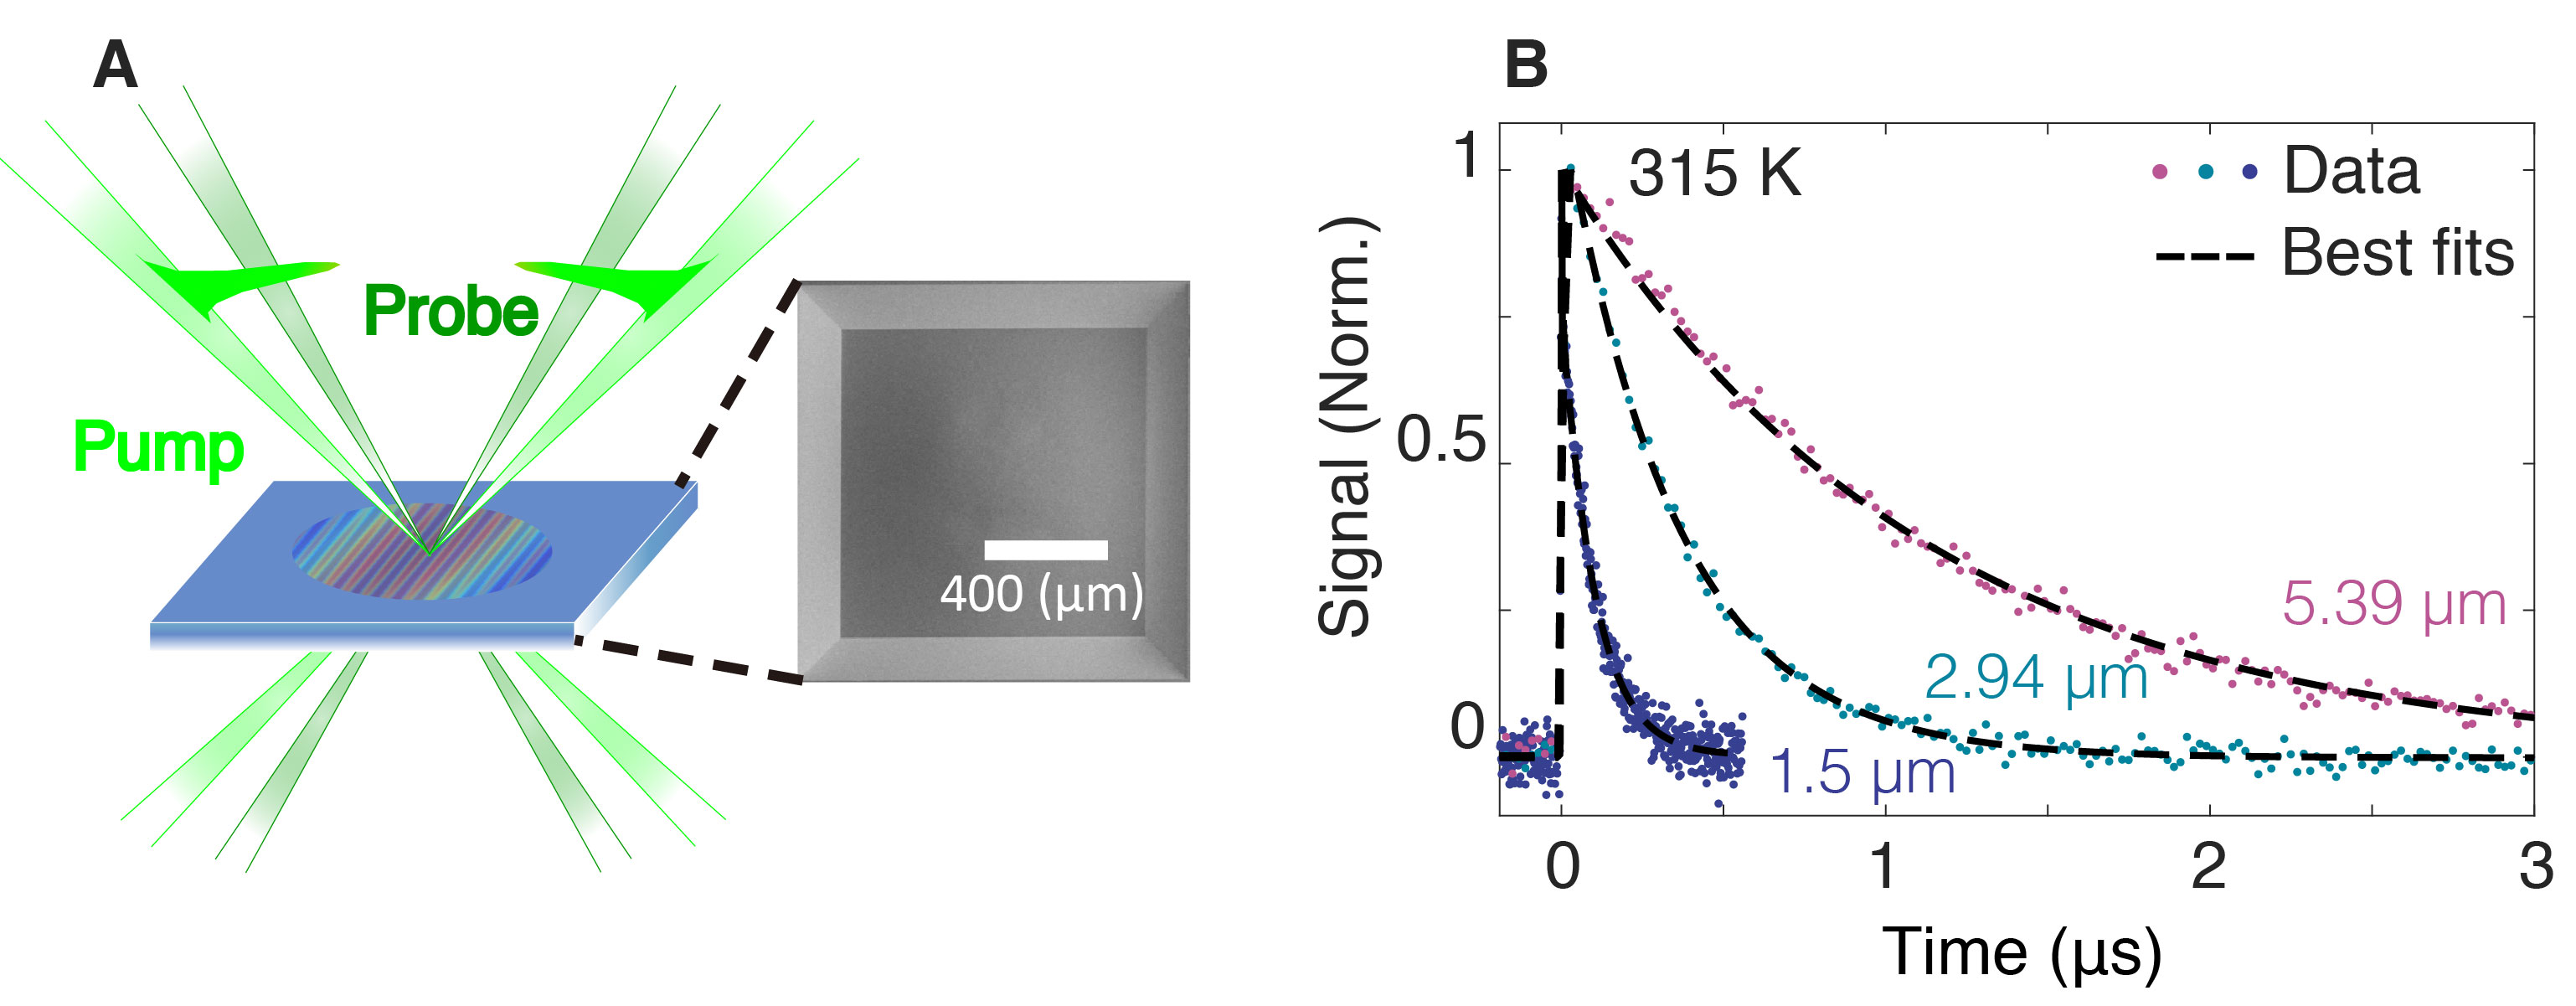
We used TG to measure the thermal diffusivity of free-standing aSi thin films with variable grating period from m. The sample of nm thickness and 1 mm2 cross-sectional area is prepared by depositing aSi on a silicon nitride substrate using chemical vapor deposition as described in Ref. Moon et al. (2019); a scanning electron microscope (SEM) image is given in Fig. 1A. The transient grating setup is identical to that described in Refs. Ravichandran et al. (2018); Robbins et al. (2019) and is illustrated schematically in Fig. 1A. Briefly, a pair of pump pulses (wavelength 515 nm, pulse duration 1 ns, repetition rate 200 Hz, 520 m diameter) is focused on the sample to create a spatially periodic heating profile with grating period () and wave vector ( defined by the incident angle. A continuous wave laser beam (wavelength 532 nm, chopped at 3.2% duty cycle to minimize steady heating, 470 m diameter) diffracts from the grating, monitoring its thermal relaxation. We employ a heterodyne detection method to increase the signal-to-noise ratio Maznev et al. (1998). The optical powers were chosen to yield adequate signal-to-noise ratio while minimizing steady heating (see Supplementary Information Sec. V for additional discussion).
Figure 1B shows representative signals at 315 K (additional data and fits are provided in Supplementary Information Sec. I). The decay exhibits a single exponential profile with a time constant in the range of tens of nanoseconds to microseconds due to thermal transport. The thermal diffusivity is obtained by extracting the time constant of the single exponential decay; the thermal conductivity is then computed using the measured heat capacity from Ref. Queen et al. (2013).
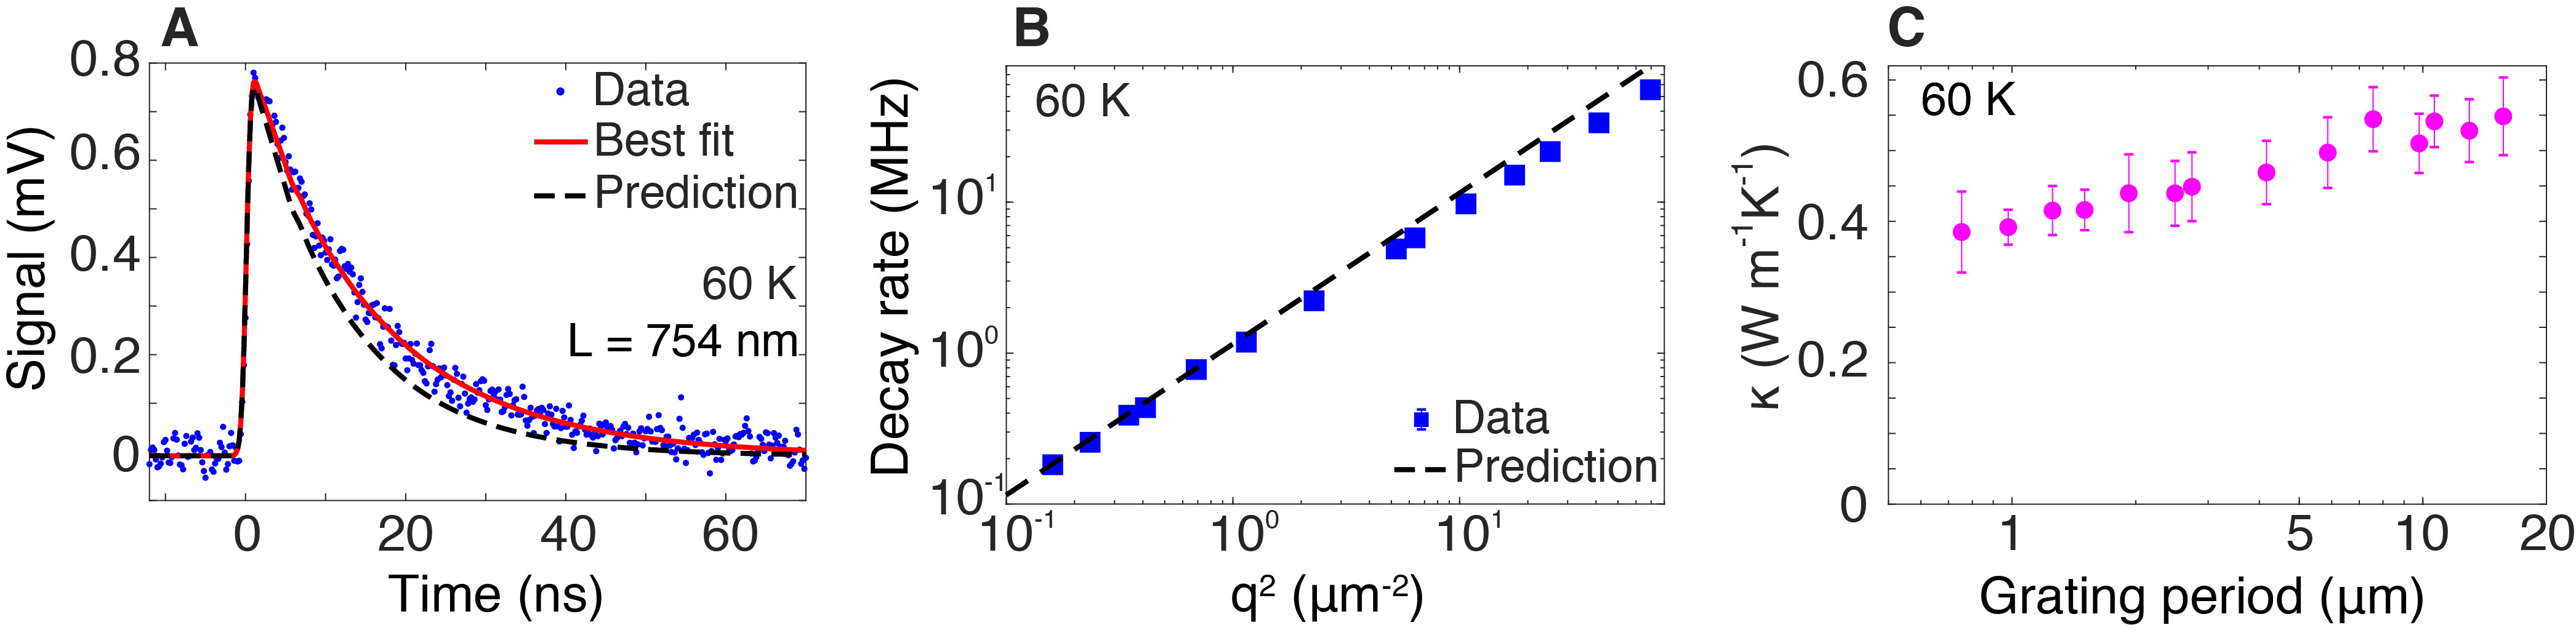
The measured TG signal for a grating period of nm is shown in Fig. 2A. The actual thermal decay is clearly slower than that predicted based on the thermal diffusivity measured at m, indicating the presence of acoustic excitations with MFPs comparable to the grating period. Measurements of the decay rate versus for all the grating periods at 60 K are given in Fig. 2B. The measured decay rate follows the linear trend expected from diffusion theory up to around ( m), above which the decay rate becomes smaller.
Figure 2C shows the measured thermal conductivity versus grating period obtained from these time constants at 60 K considered in this study. As the grating period becomes comparable to some MFPs, the effective thermal conductivity varies with grating period due to the ballistic transport of the acoustic excitations over the scale of the grating period. For nm, the reduction of the thermal conductivity from the value at m is 30%.
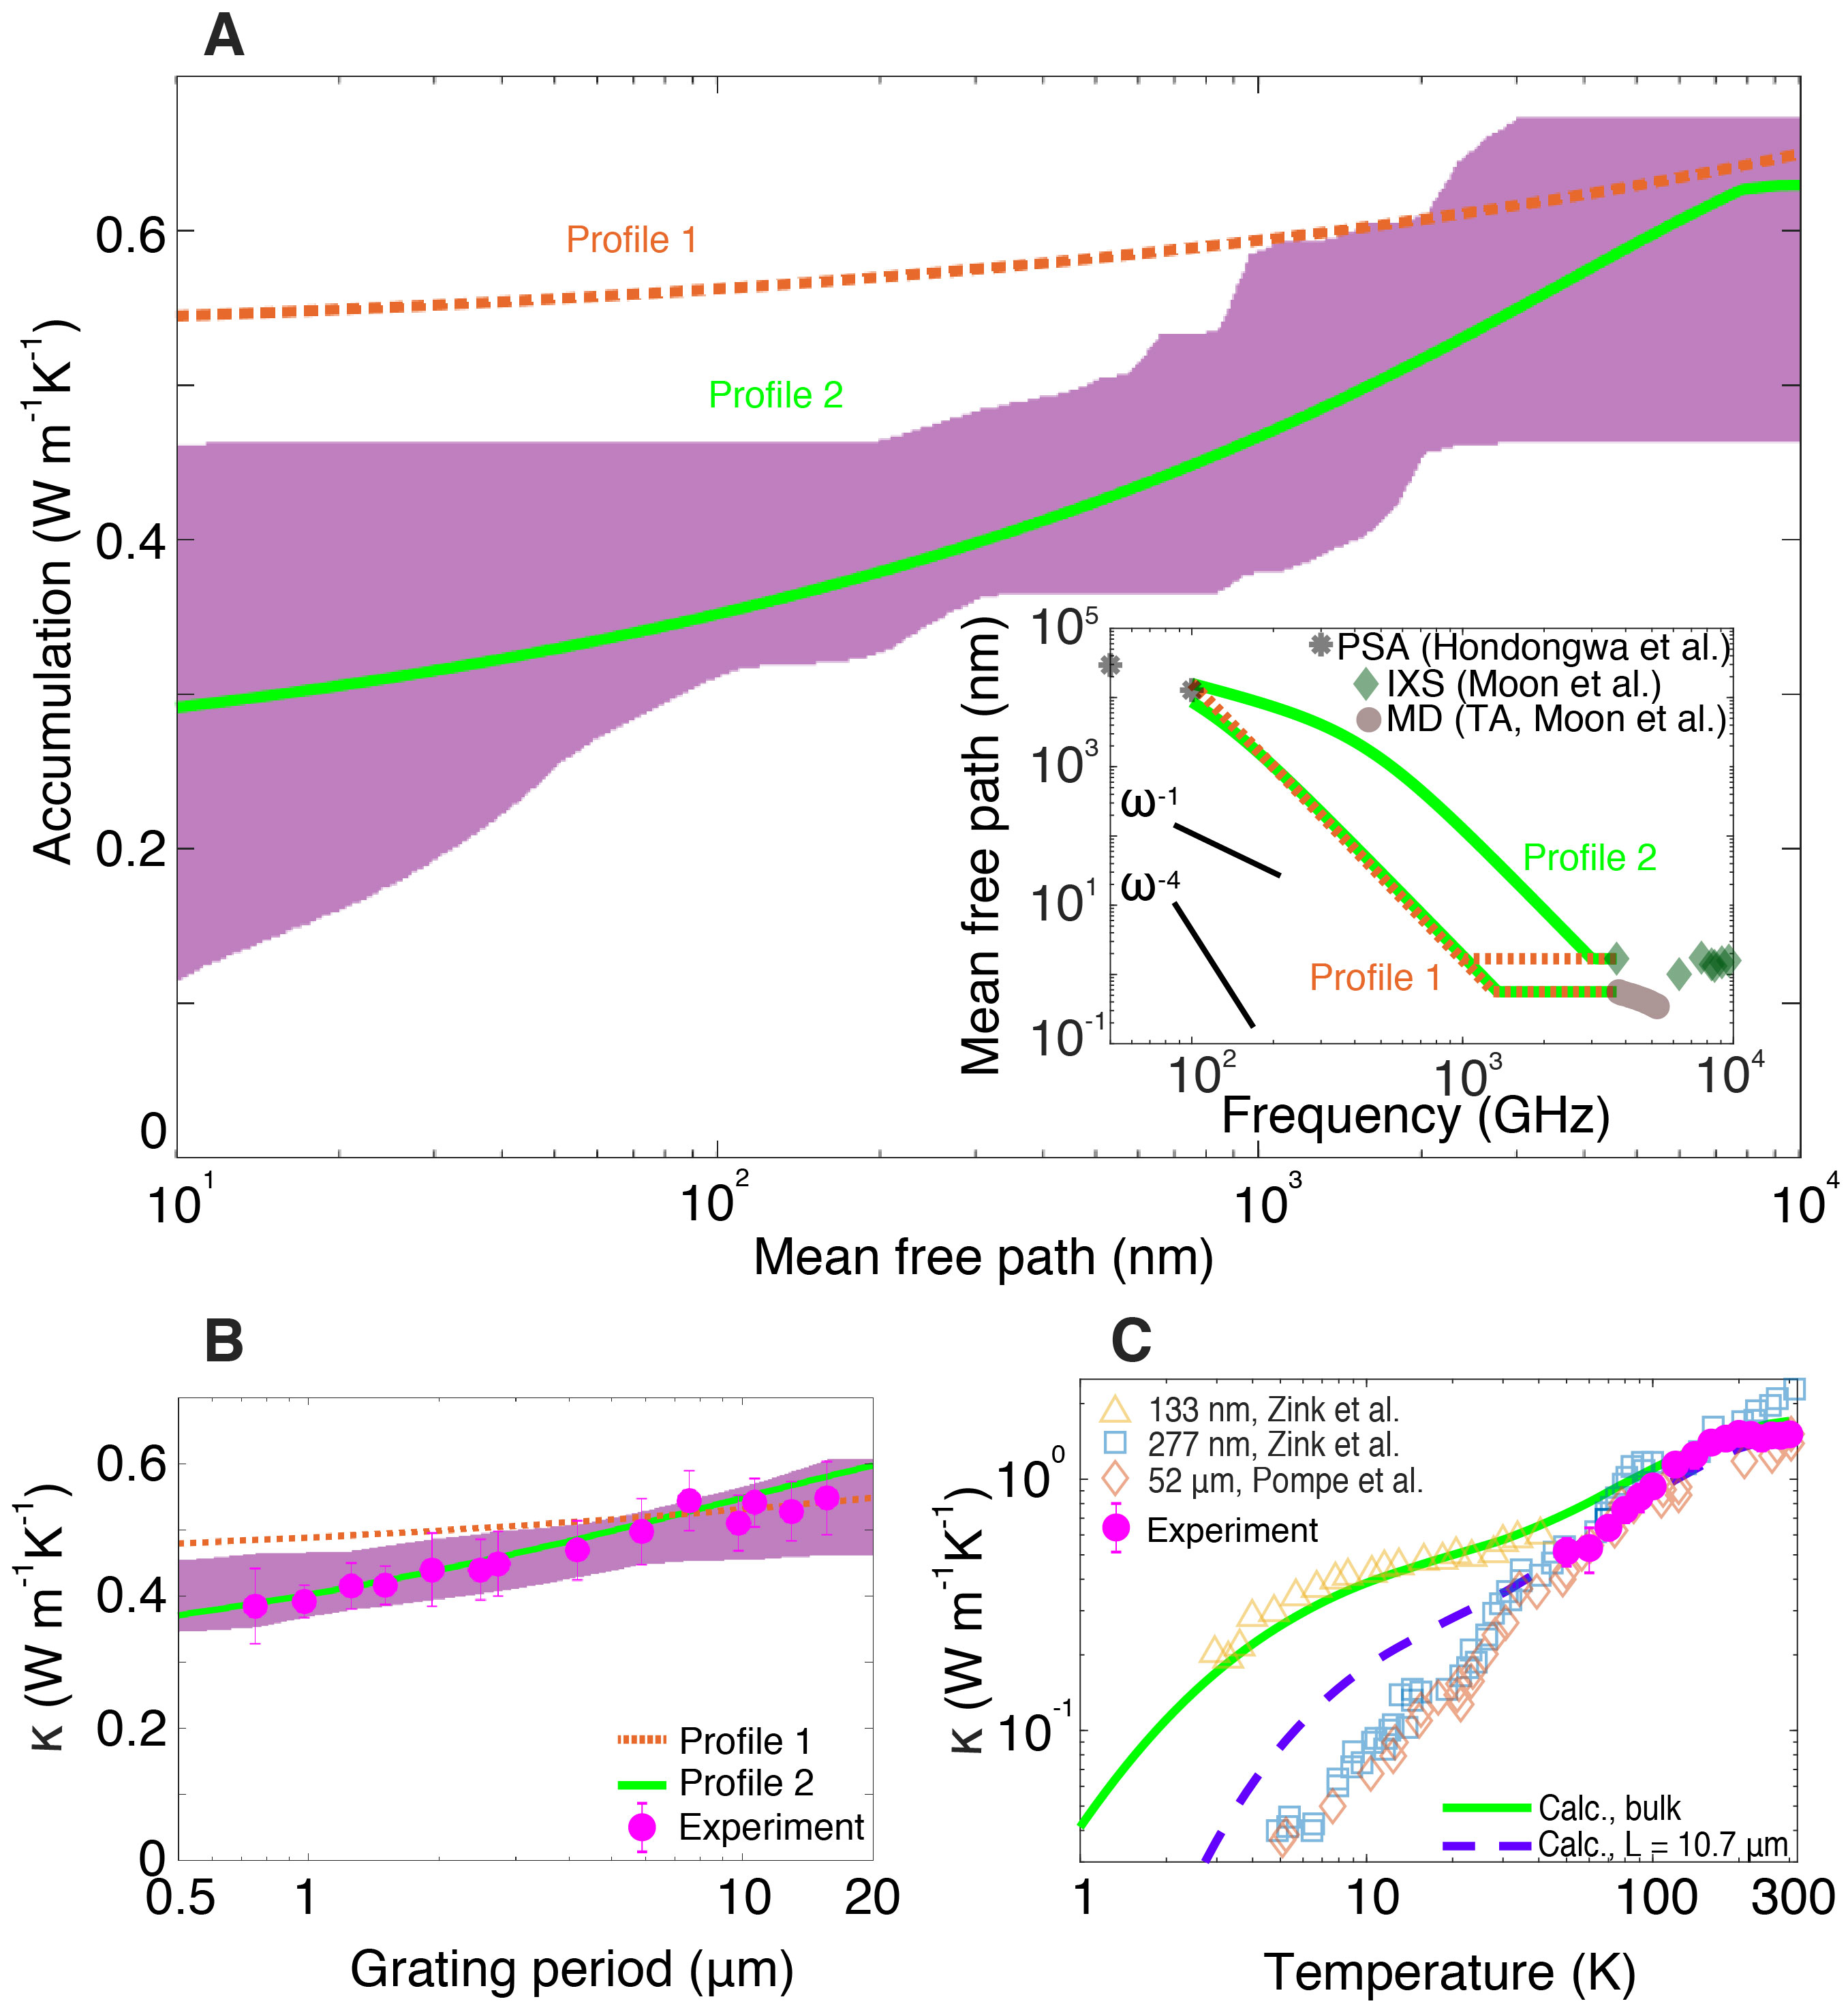
We calculated the MFP accumulation function that is consistent with these measurements using the method of Ref. Robbins et al. (2019). More precisely, the posterior probability distribution of the thermal conductivity accumulation function along with credible intervals were obtained for each temperature using Bayesian inference with a Metropolis–Hastings Markov chain Monte Carlo algorithm. The posterior distribution bounded by the 99% credible interval at 60 K is shown as the shaded region in Fig. 3A. The figure shows that the percentage of the heat carried by excitations with MFPs larger than 1 m is 31 %, qualitatively agreeing with the recent observation that more than 50% of the heat is carried by MFPs exceeding 100 nm Pan et al. (2020).
We now use the thermal conductivity accumulation function along with independent data from IXS, picosecond acoustics, and other sources to constrain the frequency-dependence of the damping. The strategy is to construct a low-energy Debye model for the thermal conductivity and identify the frequency-dependent MFPs that can simultaneously explain all of the available data. Following Ref. Minnich (2012), the measured thermal conductivity can be expressed as
| (1) |
where indexes the polarization, , , is the isotropic suppression function in Refs. Minnich (2012); Maznev et al. (2011), is the cutoff frequency for collective acoustic excitations, and is the contribution from excitations above the Ioffe-Regel (IR) cutoff frequency. The Debye heat capacity of acoustic excitations is calculated from the group velocities which are known, isotropic, and independent of temperature Moon et al. (2019, 2018). The first term of Eq. 1 is a Debye model for the thermal conductivity of an isotropic solid that includes the effect of non-diffusive thermal transport over a grating period.
The desired quantity is , or the MFP versus frequency for the LA and TA polarizations. The grating period dependence of the thermal conductivity provides constraints on , and independent data provides further constraints. First, the linewidths of LA excitations at frequencies above 3.7 THz are known from IXS measurements and are independent of temperature Moon et al. (2019). As the TA linewidths are not accessible with IXS, we use the values from MD simulations as these values for the LA branch quantitatively agreed with IXS measurements. These values allow the thermal conductivity of collective excitations above THz to be obtained from Eq. 1; at room temperature this contribution is .
Second, the attenuation lengths at hypersonic frequencies GHz can be obtained from picosecond acoustics. The room temperature value is available from Ref. Hondongwa et al. (2011). We performed additional measurements of the acoustic attenuation at temperatures from 30 - 300 K using this method as described in Supplementary Information Sec. III, and the values are on the order of 10 - 20 m in this temperature range.
The lack of temperature dependence of the damping at both 100 GHz and THz suggests that the MFPs at intermediate frequencies should also be independent of temperature. This requirement, the PSA and IXS measurements, the measured thermal conductivity versus grating period at the 5 temperatures in this study, and the known frequency-dependencies of damping mechanisms in glasses, impose tight constraints on the frequency-dependence of the damping in the sub-THz frequencies. The inset of Fig. 3A shows two candidate MFP profiles that satisfy these constraints for the LA and TA branches. Power law dependencies are assumed and combined using Matthiessen’s rule. Profile 1 transitions from a constant value to corresponding to Rayleigh scattering, while profile 2 transitions from constant to at THz and then to at GHz.
The thermal conductivity accumulation versus MFP at 60 K computed from these profiles is given in Fig. 3A. In this figure, was chosen to match the measured thermal conductivity for m to facilitate comparison. Profile 2 exhibits better agreement with the posterior distribution, with profile 1 exhibiting a weaker trend with MFP compared to the posterior distribution.
The thermal conductivity versus grating period for the posterior distribution and both profiles is shown in Fig. 3B. Profile 2 again yields better agreement with the trend of thermal conductivity versus grating period compared to profile 1. An alternate profile that increases as immediately at 3.7 THz yields a thermal conductivity that exceeds the experimental values at all temperatures (not shown). We find that profiles consistent with profile 2 are best able to explain the magnitude and grating period dependence of the thermal conductivity. Specifically, the MFPs must remain constant as frequency decreases and then increase rapidly as . To agree with the PSA data, the trend must then switch to or . From the TG data, we are unable to determine this latter trend owing to the influence of boundary scattering in the 500 nm thick membrane; however, independent picosecond acoustic measurements at 50 GHz and 100 GHz indicate that the damping varies as Hondongwa et al. (2011). Considering the weak dependence of the damping on temperature, this observation suggests the damping at GHz is due to density fluctuations which is predicted to exhibit an trend Walton (1974).
We provide further evidence in support of profile 2 by calculating the bulk thermal conductivity versus temperature with these MFPs and comparing it to the measured values in the present work and Refs. Zink et al. (2006); Pompe and Hegenbarth (1988). Figure 3C shows that the computed bulk thermal conductivity agrees with the measurements of Ref. Pompe and Hegenbarth (1988). However, discrepancies are observed between the computed bulk thermal conductivity and the data of this work and Ref. Zink et al. (2006). Accounting for the maximum grating period used in the present experiments ( m), suppressing the contribution of phonons of MFP exceeding this length scale yields good agreement with our data and qualitative agreement with Ref. Zink et al. (2006). Therefore, the trends of their measurements could be attributed to extrinsic boundary scattering limiting the maximum MFP rather than intrinsic damping mechanisms. The value of specularity parameter required to produce micron-scale MFPs for the nm thick membrane used in their work is using ; this specularity agrees well with that measured at surfaces terminating crystalline silicon Klitsner and Pohl (1987).
Evidence in support of the trend at GHz can be obtained by extrapolating the MFP inferred from the dominant phonon approximation with the data of Ref. Pompe and Hegenbarth (1988). The dominant heat-carrying phonon frequency at K is GHz Zeller and Pohl (1971); taking their measured thermal conductivity and the computed heat capacity of acoustic excitations at 3 K ( , and , respectively) along with the average sound velocity ( ), the average MFP of the dominant phonon can be obtained using m. If the MFP trend follows at these frequencies, the MFP from Ref. Pompe and Hegenbarth (1988) at 3 K implies a MFP of m at 50 - 100 GHz, close to the PSA measurements of the present work. This analysis thus supports the magnitude, frequency dependence, and weak temperature dependence of the reconstructed MFPs.
We now reconstruct the MFP profile that best explains the data and is consistent with profile 2. Given the above constraints, the MFPs are characterized by only two parameters: the transition frequencies from to for both acoustic polarizations, and . The remaining unknown parameter is (T), which may depend on temperature. We let this function follow the temperature dependence of the heat capacity, Feldman et al. (1993). Then, we obtain the MFPs that best explain the TG data by numerically optimizing these parameters to fit the TG data at all temperatures. The comparison between the computed and measured thermal conductivity is provided in Supplementary Information Sec. II, and good agreement is observed at all temperatures. Further discussion of the choices of , , and that are compatible with the data is given in Supplementary Information Sec. IV; the trend of MFP with frequency remains the same for all of these parameter sets.
The reconstructed MFPs for the LA and TA polarizations are shown in Fig. 4. To gain physical insight into the damping mechanisms in aSi, we compare the characteristics of the reconstructed MFPs with those reported for vitreous silica, an extensively studied glass with representative measurements provided in Fig. 4. The frequency-dependence of the MFPs in aSi agrees well with these and other measurements Baldi et al. (2010); Zhu et al. (1991); Devos et al. (2008); Vacher and Pelous (1976); Benassi et al. (2005); Dietsche and Kinder (1979); Zaitlin and Anderson (1975b); Graebner et al. (1986). The Rayleigh scattering trend for both glasses occurs in the THz range with a transition to a weaker power law in the sub-THz frequencies. Thus, the frequency-dependence of acoustic damping in aSi shares several features in common with other glasses.
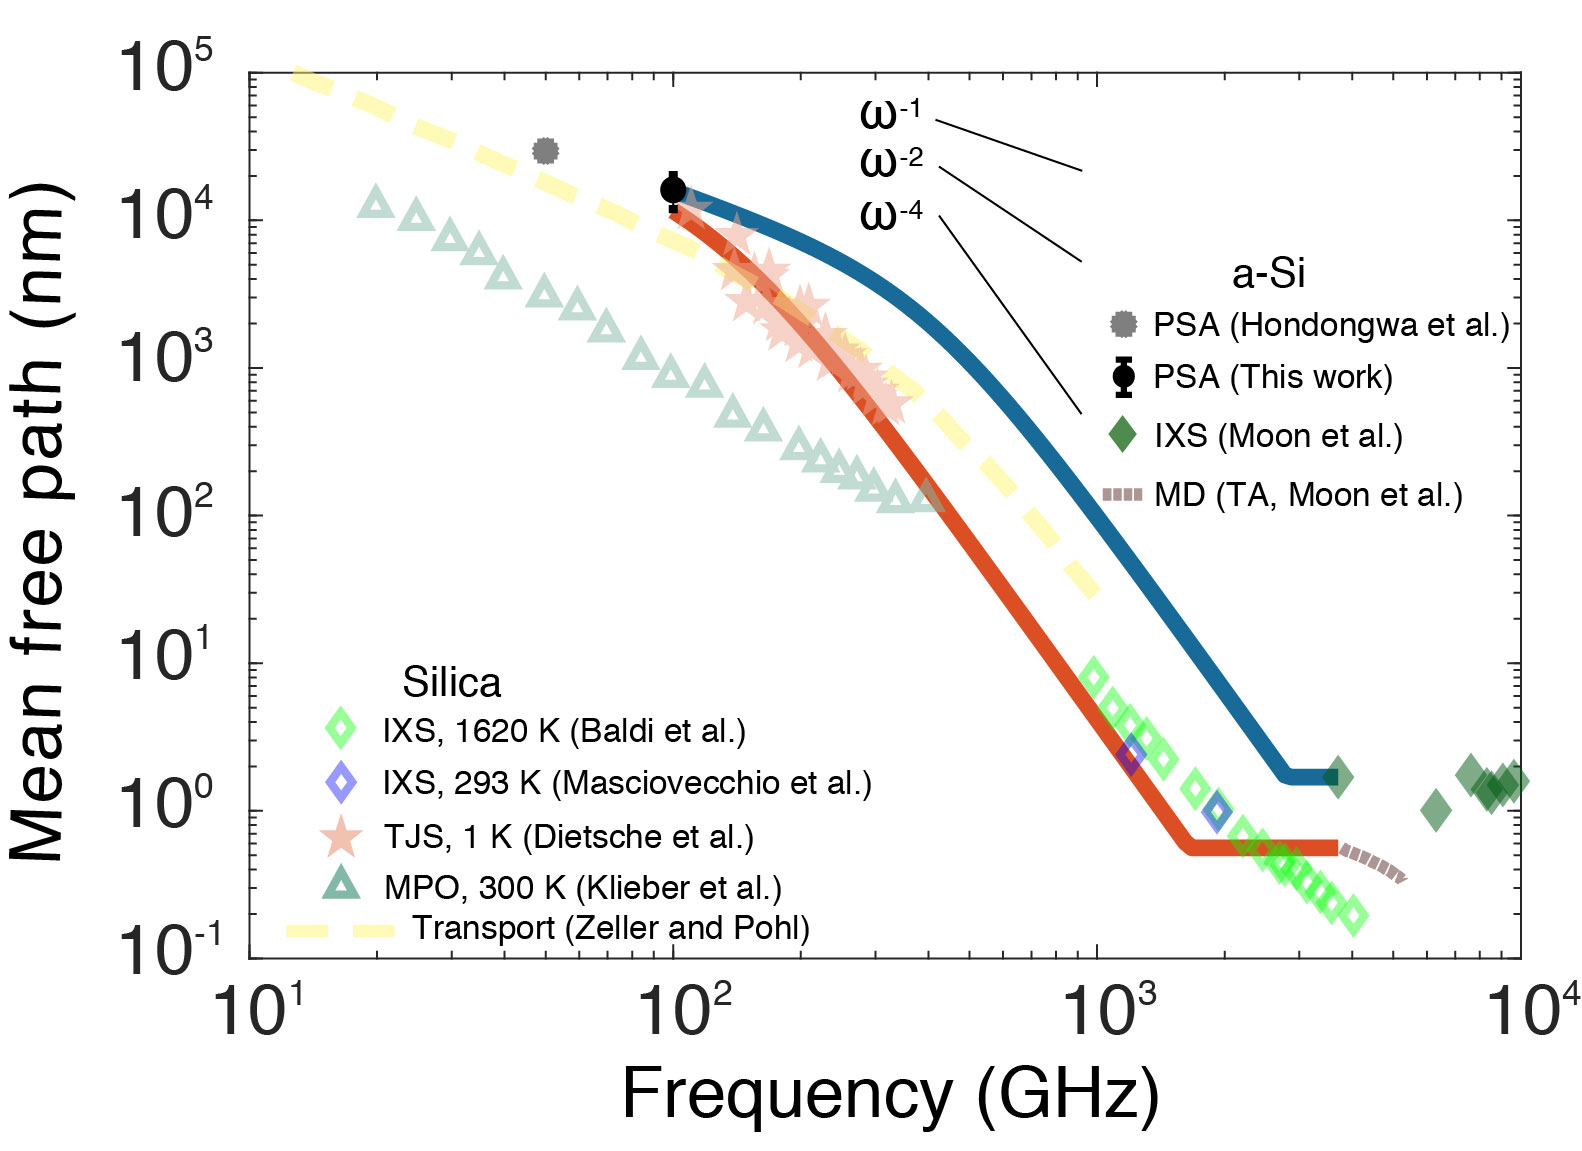
However, comparing the attenuation between vitreous silica and aSi, differences emerge. First, acoustic damping in aSi exhibits little temperature dependence. Although Ref. Zink et al. (2006) reported a dependence of the MFP, their measurements may have been affected by extrinsic boundary scattering as discussed above. In contrast, the damping in vitreous silica exhibits a strong temperature dependence as observed in Fig. 4, highlighting the role of anharmonic and TLS damping in vitreous silica.
Other differences become clear on closer examination. Comparing the LA MFPs at THz, the attenuation due to Rayleigh scattering is weaker in aSi by around a factor of 5, expected as aSi is a monatomic glass with less atomic disorder. Further, at room temperature the trend yields to a trend at GHz in vitreous silica while the same transition occurs at GHz in aSi. At cryogenic temperatures K for vitreous silica, the transition frequencies in both materials are comparable. This difference indicates weaker damping by mechanisms such as TLS or anharmonic damping in amorphous Si and has an important consequence: excitations with MFPs in the micron range occur at frequencies of GHz in aSi versus GHz in vitreous silica at room temperature owing to the steep slope of Rayleigh scattering. The heat capacity of excitations in the former frequency range is larger by a factor of . The result is that in aSi, heat-carrying excitations at room temperature have micron-scale MFPs, while the MFPs of excitations in the same frequency band for vitreous silica are smaller by an order of magnitude. Excitations in vitreous silica with micron-scale MFPs have too low frequency to transport substantial heat at room temperature. Remarkably, the attenuation observed in aSi up to room temperature is of the same order as that measured in vitreous silica at 1 K, highlighting the unusually weak acoustic damping in aSi.
Our conclusions on the origin of damping of sub-THz excitations in aSi are consistent with these prior studies of other glasses but are not consistent with the conclusions of numerical studies of excitations below the IR frequency He et al. (2011); Larkin and McGaughey (2014); Fabian and Allen (1996, 1999); Sääskilahti et al. (2016). In these studies, the Hamiltonian for atoms in a supercell is diagonalized in the harmonic approximation to yield normal modes. The original studies of Allen and Feldman used these normal modes to classify excitations in glasses as propagons, diffusons, and locons depending on the properties of the eigenvectors Feldman et al. (1993). The lifetimes of these modes are obtained using normal mode decomposition and molecular dynamics Ladd et al. (1986); McGaughey and Kaviany (2004). With these approaches, these studies have generally concluded that damping in aSi varies as for frequencies around THz and below. From this trend, the damping mechanism has been postulated to involve anharmonicity Larkin and McGaughey (2014); Sääskilahti et al. (2016) and to exhibit a temperature dependence Fabian and Allen (1996).
We first address the classification of acoustic excitations. Various numerical Fabian and Allen (1996); Allen et al. (1999); Larkin and McGaughey (2014) and experimental works Braun et al. (2016) have noted a transition in the character of vibrations in aSi around THz, leading to the introduction of “diffusons” as non-propagating yet delocalized vibrations in Refs. Fabian and Allen (1996); Allen et al. (1999). In contrast, our work attributes this transition to a change in frequency-dependent damping of collective acoustic excitations. The crossover from propagons and diffusons at THz coincides with the transition from Rayleigh scattering to the Kittel regime in the present work and thus can be explained without the definition of a new type of vibration. The IR crossover for the transition from collective excitations to incoherent excitations, which occurs well above 1-2 THz in amorphous Si, is sufficient to describe the different characters of excitations in glasses.
The second inconsistency is the prediction by normal-mode analysis of the frequency-dependence () and anharmonic origin of damping in the few THz frequency range. Specifically, the MFPs predicted from normal mode analysis are on the order of 10 - 20 nm at THz and vary as (see Fig. 4B of Ref. Larkin and McGaughey (2014)), which cannot explain the measurements of the present work. In particular, extrapolating the 20 nm value at 1 THz to 100 GHz as yields m, which is smaller by a factor of 10 compared to the PSA measurements at the same frequency (10 - 20 m, Ref. Hondongwa et al. (2011) and this work). Here, the inconsistency appears to arise from the implicit assumption of the normal mode decomposition that the heat-carrying excitations in glasses are the normal modes of the supercell. This assumption is not compatible with basic many-body physics and scattering theory, which instead gives the proper definition and lifetime of a collective excitation of a many-body system using the self-energy and the single-particle Green’s function Coleman (2015). Rather than normal modes, a physical picture of acoustic excitations of a glass that is compatible with this framework is that originally postulated by Kittel Kittel (1949) in the continuum limit and later by Zeller and Pohl Zeller and Pohl (1971), in which a glass is imagined to consist of a fictitious atomic lattice along with perturbations representing the mass and force constant disorder in the actual glass. The undamped excitations of the fictitious atomic lattice acquire a lifetime owing to the disorder of the actual glass. The dispersion and lifetimes of these excitations can be measured experimentally using inelastic scattering, as has been performed for many glasses in the past decades Baldi et al. (2010); Moon et al. (2019); Monaco and Giordano (2009); Rufflé et al. (2006); Masciovecchio et al. (1996); Sette et al. (1998). In contrast, the lifetimes of normal modes do not appear to be experimentally accessible or physically meaningful as they are unable to explain the thermal conductivity measurements presented here.
In summary, we report measurements of the thermal conductivity accumulation function of aSi and reconstruction of the MFPs versus frequency using picosecond acoustics and transient grating spectroscopy. The reconstructed MFPs lack a temperature dependence and exhibit a trend characteristic of structural scattering by point defects and density fluctuations. This result is at variance with numerical studies based on normal mode analysis but is broadly consistent with prior studies of vitreous silica and other glasses. The micron-scale MFPs of heat-carrying excitations at room temperature are found to arise from the weak anharmonic and two-level system damping of sub-THz excitations, leading to room temperature attenuation coefficients comparable to those of other glasses at cryogenic temperatures.
Acknowledgements.
The authors acknowledge discussions with A. B. Robbins and B. C. Daly. This work was supported by the 2018 GIST-Caltech Research Collaboration.References
- Malinovsky et al. [1990] V. K Malinovsky, V. N Novikov, P. P Parshin, A. P Sokolov, and M. G Zemlyanov. Universal form of the low-energy (2 to 10 meV) vibrational spectrum of glasses. Europhysics Letters (EPL), 11(1):43–47, jan 1990. doi: 10.1209/0295-5075/11/1/008. URL https://doi.org/10.1209%2F0295-5075%2F11%2F1%2F008.
- Liu and v Löhneysen [1996] X Liu and H. v Löhneysen. Specific-heat anomaly of amorphous solids at intermediate temperatures (1 to 30 k). Europhysics Letters (EPL), 33(8):617–622, mar 1996. doi: 10.1209/epl/i1996-00388-9. URL https://doi.org/10.1209%2Fepl%2Fi1996-00388-9.
- Jäckle et al. [1976] J. Jäckle, L. Piché, W. Arnold, and S. Hunklinger. Elastic effects of structural relaxation in glasses at low temperatures. Journal of Non-Crystalline Solids, 20(3):365–391, May 1976. ISSN 0022-3093. doi: 10.1016/0022-3093(76)90119-8. URL http://www.sciencedirect.com/science/article/pii/0022309376901198.
- Phillips [1972] W. A. Phillips. Tunneling states in amorphous solids. Journal of Low Temperature Physics, 7(3):351–360, 1972. doi: 10.1007/BF00660072. URL https://doi.org/10.1007/BF00660072.
- HUNKLINGER and ARNOLD [1976] S. HUNKLINGER and W. ARNOLD. 3 - ultrasonic properties of glasses at low temperatures. volume 12 of Physical Acoustics, pages 155 – 215. Academic Press, 1976. doi: https://doi.org/10.1016/B978-0-12-477912-9.50008-4. URL http://www.sciencedirect.com/science/article/pii/B9780124779129500084.
- Anderson et al. [1972] P. W. Anderson, B. I. Halperin, and C. M. Varma. Anomalous low-temperature thermal properties of glasses and spin glasses. The Philosophical Magazine: A Journal of Theoretical Experimental and Applied Physics, 25(1):1–9, 1972. doi: 10.1080/14786437208229210. URL https://doi.org/10.1080/14786437208229210.
- Zaitlin and Anderson [1975a] M. P. Zaitlin and A. C. Anderson. An explanation for the plateau in the thermal conductivity of non-crystalline solids. physica status solidi (b), 71(1):323–327, 1975a. doi: 10.1002/pssb.2220710132. URL https://onlinelibrary.wiley.com/doi/abs/10.1002/pssb.2220710132.
- Baldi et al. [2010] G. Baldi, V. M. Giordano, G. Monaco, and B. Ruta. Sound Attenuation at Terahertz Frequencies and the Boson Peak of Vitreous Silica. Physical Review Letters, 104(19):195501, May 2010. doi: 10.1103/PhysRevLett.104.195501. URL https://link.aps.org/doi/10.1103/PhysRevLett.104.195501.
- Moon et al. [2019] Jaeyun Moon, Raphaël P. Hermann, Michael E. Manley, Ahmet Alatas, Ayman H. Said, and Austin J. Minnich. Thermal acoustic excitations with atomic-scale wavelengths in amorphous silicon. Phys. Rev. Materials, 3:065601, Jun 2019. doi: 10.1103/PhysRevMaterials.3.065601. URL https://link.aps.org/doi/10.1103/PhysRevMaterials.3.065601.
- Monaco and Giordano [2009] Giulio Monaco and Valentina M. Giordano. Breakdown of the Debye approximation for the acoustic modes with nanometric wavelengths in glasses. Proceedings of the National Academy of Sciences, 106(10):3659–3663, March 2009. ISSN 0027-8424, 1091-6490. doi: 10.1073/pnas.0808965106. URL https://www.pnas.org/content/106/10/3659.
- Rufflé et al. [2006] B. Rufflé, G. Guimbretière, E. Courtens, R. Vacher, and G. Monaco. Glass-specific behavior in the damping of acousticlike vibrations. Phys. Rev. Lett., 96:045502, Jan 2006. doi: 10.1103/PhysRevLett.96.045502. URL https://link.aps.org/doi/10.1103/PhysRevLett.96.045502.
- Masciovecchio et al. [1996] C. Masciovecchio, G. Ruocco, F. Sette, M. Krisch, R. Verbeni, U. Bergmann, and M. Soltwisch. Observation of large momentum phononlike modes in glasses. Phys. Rev. Lett., 76:3356–3359, Apr 1996. doi: 10.1103/PhysRevLett.76.3356. URL https://link.aps.org/doi/10.1103/PhysRevLett.76.3356.
- Sette et al. [1998] Francesco Sette, Michael H. Krisch, Claudio Masciovecchio, Giancarlo Ruocco, and Giulio Monaco. Dynamics of glasses and glass-forming liquids studied by inelastic x-ray scattering. Science, 280(5369):1550–1555, 1998. ISSN 0036-8075. doi: 10.1126/science.280.5369.1550. URL https://science.sciencemag.org/content/280/5369/1550.
- Dietsche and Kinder [1979] W. Dietsche and H. Kinder. Spectroscopy of Phonon Scattering in Glass. Physical Review Letters, 43(19):1413–1417, November 1979. doi: 10.1103/PhysRevLett.43.1413. URL https://link.aps.org/doi/10.1103/PhysRevLett.43.1413.
- Vacher et al. [1980] R. Vacher, H. Sussner, and S. Hunklinger. Brillouin scattering in vitreous silica below 1 k. Phys. Rev. B, 21:5850–5853, Jun 1980. doi: 10.1103/PhysRevB.21.5850. URL https://link.aps.org/doi/10.1103/PhysRevB.21.5850.
- Vacher and Pelous [1976] R. Vacher and J. Pelous. Behavior of thermal phonons in amorphous media from 4 to 300 k. Phys. Rev. B, 14:823–828, Jul 1976. doi: 10.1103/PhysRevB.14.823. URL https://link.aps.org/doi/10.1103/PhysRevB.14.823.
- Benassi et al. [2005] P. Benassi, S. Caponi, R. Eramo, A. Fontana, A. Giugni, M. Nardone, M. Sampoli, and G. Viliani. Sound attenuation in a unexplored frequency region: Brillouin ultraviolet light scattering measurements in . Phys. Rev. B, 71:172201, May 2005. doi: 10.1103/PhysRevB.71.172201. URL https://link.aps.org/doi/10.1103/PhysRevB.71.172201.
- Zhu et al. [1991] T. C. Zhu, H. J. Maris, and J. Tauc. Attenuation of longitudinal-acoustic phonons in amorphous at frequencies up to 440 ghz. Phys. Rev. B, 44:4281–4289, Sep 1991. doi: 10.1103/PhysRevB.44.4281. URL https://link.aps.org/doi/10.1103/PhysRevB.44.4281.
- Devos et al. [2008] A. Devos, M. Foret, S. Ayrinhac, P. Emery, and B. Rufflé. Hypersound damping in vitreous silica measured by picosecond acoustics. Phys. Rev. B, 77:100201, Mar 2008. doi: 10.1103/PhysRevB.77.100201. URL https://link.aps.org/doi/10.1103/PhysRevB.77.100201.
- Kittel [1949] Charles Kittel. Interpretation of the thermal conductivity of glasses. Phys. Rev., 75:972–974, Mar 1949. doi: 10.1103/PhysRev.75.972. URL https://link.aps.org/doi/10.1103/PhysRev.75.972.
- Freeman and Anderson [1986] J. J. Freeman and A. C. Anderson. Thermal conductivity of amorphous solids. Phys. Rev. B, 34:5684–5690, Oct 1986. doi: 10.1103/PhysRevB.34.5684. URL https://link.aps.org/doi/10.1103/PhysRevB.34.5684.
- Goodson et al. [1994] K. E. Goodson, M. I. Flik, L. T. Su, and D. A. Antoniadis. Prediction and Measurement of the Thermal Conductivity of Amorphous Dielectric Layers. Journal of Heat Transfer, 116(2):317–324, 05 1994. ISSN 0022-1481. doi: 10.1115/1.2911402. URL https://doi.org/10.1115/1.2911402.
- Zeller and Pohl [1971] R. C. Zeller and R. O. Pohl. Thermal conductivity and specific heat of noncrystalline solids. Phys. Rev. B, 4:2029–2041, Sep 1971. doi: 10.1103/PhysRevB.4.2029. URL https://link.aps.org/doi/10.1103/PhysRevB.4.2029.
- Graebner et al. [1986] J. E. Graebner, B. Golding, and L. C. Allen. Phonon localization in glasses. Phys. Rev. B, 34:5696–5701, Oct 1986. doi: 10.1103/PhysRevB.34.5696. URL https://link.aps.org/doi/10.1103/PhysRevB.34.5696.
- Von Haumeder et al. [1980] M. Von Haumeder, U. Strom, and S. Hunklinger. Acoustic Anomalies in Amorphous Thin Films of Si and Si. Physical Review Letters, 44(2):84–87, January 1980. doi: 10.1103/PhysRevLett.44.84. URL https://link.aps.org/doi/10.1103/PhysRevLett.44.84.
- Liu et al. [1997] Xiao Liu, B. E. White, Jr., R. O. Pohl, E. Iwanizcko, K. M. Jones, A. H. Mahan, B. N. Nelson, R. S. Crandall, and S. Veprek. Amorphous solid without low energy excitations. Phys. Rev. Lett., 78:4418–4421, Jun 1997. doi: 10.1103/PhysRevLett.78.4418. URL https://link.aps.org/doi/10.1103/PhysRevLett.78.4418.
- Wieczorek et al. [1989] L. Wieczorek, H. J. Goldsmid, and G. L. Paul. Thermal Conductivity of Amorphous Films, pages 235–241. Springer US, Boston, MA, 1989. ISBN 978-1-4613-0761-7. doi: 10.1007/978-1-4613-0761-7˙22. URL https://doi.org/10.1007/978-1-4613-0761-7_22.
- Kuo et al. [1992] B. S. W. Kuo, J. C. M. Li, and A. W. Schmid. Thermal conductivity and interface thermal resistance of si film on si substrate determined by photothermal displacement interferometry. Applied Physics A, 55(3):289–296, 1992. doi: 10.1007/BF00348399. URL https://doi.org/10.1007/BF00348399.
- Moon et al. [2002] Seungjae Moon, Mutsuko Hatano, Minghong Lee, and Costas P. Grigoropoulos. Thermal conductivity of amorphous silicon thin films. International Journal of Heat and Mass Transfer, 45(12):2439–2447, June 2002. ISSN 00179310. doi: 10.1016/S0017-9310(01)00347-7. URL http://linkinghub.elsevier.com/retrieve/pii/S0017931001003477.
- Liu et al. [2009] Xiao Liu, J. L. Feldman, D. G. Cahill, R. S. Crandall, N. Bernstein, D. M. Photiadis, M. J. Mehl, and D. A. Papaconstantopoulos. High thermal conductivity of a hydrogenated amorphous silicon film. Phys. Rev. Lett., 102:035901, Jan 2009. doi: 10.1103/PhysRevLett.102.035901. URL https://link.aps.org/doi/10.1103/PhysRevLett.102.035901.
- Kwon et al. [2017] Soonshin Kwon, Jianlin Zheng, Matthew C. Wingert, Shuang Cui, and Renkun Chen. Unusually high and anisotropic thermal conductivity in amorphous silicon nanostructures. ACS Nano, 11(3):2470–2476, 2017. doi: 10.1021/acsnano.6b07836. URL https://doi.org/10.1021/acsnano.6b07836. PMID: 28117979.
- Braun et al. [2016] Jeffrey L. Braun, Christopher H. Baker, Ashutosh Giri, Mirza Elahi, Kateryna Artyushkova, Thomas E. Beechem, Pamela M. Norris, Zayd C. Leseman, John T. Gaskins, and Patrick E. Hopkins. Size effects on the thermal conductivity of amorphous silicon thin films. Phys. Rev. B, 93:140201, Apr 2016. doi: 10.1103/PhysRevB.93.140201. URL https://link.aps.org/doi/10.1103/PhysRevB.93.140201.
- Pan et al. [2020] Ying Pan, Jiawei Zhou, and Gang Chen. Quantifying thermal transport in amorphous silicon using mean free path spectroscopy. Phys. Rev. B, 101:144203, Apr 2020. doi: 10.1103/PhysRevB.101.144203. URL https://link.aps.org/doi/10.1103/PhysRevB.101.144203.
- Allen et al. [1999] Philip B. Allen, Joseph L. Feldman, Jaroslav Fabian, and Frederick Wooten. Diffusons, locons and propagons: Character of atomie yibrations in amorphous si. Philosophical Magazine B, 79(11-12):1715–1731, 1999. doi: 10.1080/13642819908223054. URL https://doi.org/10.1080/13642819908223054.
- Fabian and Allen [1996] Jaroslav Fabian and Philip B. Allen. Anharmonic decay of vibrational states in amorphous silicon. Phys. Rev. Lett., 77:3839–3842, Oct 1996. doi: 10.1103/PhysRevLett.77.3839. URL https://link.aps.org/doi/10.1103/PhysRevLett.77.3839.
- Larkin and McGaughey [2014] Jason M. Larkin and Alan J. H. McGaughey. Thermal conductivity accumulation in amorphous silica and amorphous silicon. Phys. Rev. B, 89:144303, Apr 2014. doi: 10.1103/PhysRevB.89.144303. URL https://link.aps.org/doi/10.1103/PhysRevB.89.144303.
- Sääskilahti et al. [2016] K. Sääskilahti, J. Oksanen, J. Tulkki, A. J. H. McGaughey, and S. Volz. Vibrational mean free paths and thermal conductivity of amorphous silicon from non-equilibrium molecular dynamics simulations. AIP Advances, 6(12):121904, 2016. doi: 10.1063/1.4968617. URL https://doi.org/10.1063/1.4968617.
- Zink et al. [2006] B. L. Zink, R. Pietri, and F. Hellman. Thermal conductivity and specific heat of thin-film amorphous silicon. Phys. Rev. Lett., 96:055902, Feb 2006. doi: 10.1103/PhysRevLett.96.055902. URL https://link.aps.org/doi/10.1103/PhysRevLett.96.055902.
- Hondongwa et al. [2011] D. B. Hondongwa, B. C. Daly, T. B. Norris, B. Yan, J. Yang, and S. Guha. Ultrasonic attenuation in amorphous silicon at 50 and 100 ghz. Phys. Rev. B, 83:121303, Mar 2011. doi: 10.1103/PhysRevB.83.121303. URL https://link.aps.org/doi/10.1103/PhysRevB.83.121303.
- Minnich [2012] A. J. Minnich. Determining phonon mean free paths from observations of quasiballistic thermal transport. Phys. Rev. Lett., 109:205901, Nov 2012. doi: 10.1103/PhysRevLett.109.205901. URL https://link.aps.org/doi/10.1103/PhysRevLett.109.205901.
- Ravichandran et al. [2018] Navaneetha K. Ravichandran, Hang Zhang, and Austin J. Minnich. Spectrally resolved specular reflections of thermal phonons from atomically rough surfaces. Phys. Rev. X, 8:041004, Oct 2018. doi: 10.1103/PhysRevX.8.041004. URL https://link.aps.org/doi/10.1103/PhysRevX.8.041004.
- Robbins et al. [2019] Andrew B. Robbins, Stavros X. Drakopoulos, Ignacio Martin-Fabiani, Sara Ronca, and Austin J. Minnich. Ballistic thermal phonons traversing nanocrystalline domains in oriented polyethylene. Proceedings of the National Academy of Sciences, 116(35):17163–17168, 2019. ISSN 0027-8424. doi: 10.1073/pnas.1905492116. URL https://www.pnas.org/content/116/35/17163.
- Maznev et al. [1998] A. A. Maznev, K. A. Nelson, and J. A. Rogers. Optical heterodyne detection of laser-induced gratings. Opt. Lett., 23(16):1319–1321, Aug 1998. doi: 10.1364/OL.23.001319. URL http://ol.osa.org/abstract.cfm?URI=ol-23-16-1319.
- Queen et al. [2013] D. R. Queen, X. Liu, J. Karel, T. H. Metcalf, and F. Hellman. Excess specific heat in evaporated amorphous silicon. Phys. Rev. Lett., 110:135901, Mar 2013. doi: 10.1103/PhysRevLett.110.135901. URL https://link.aps.org/doi/10.1103/PhysRevLett.110.135901.
- Maznev et al. [2011] A. A. Maznev, Jeremy A. Johnson, and Keith A. Nelson. Onset of nondiffusive phonon transport in transient thermal grating decay. Phys. Rev. B, 84:195206, Nov 2011. doi: 10.1103/PhysRevB.84.195206. URL https://link.aps.org/doi/10.1103/PhysRevB.84.195206.
- Moon et al. [2018] Jaeyun Moon, Benoit Latour, and Austin J. Minnich. Propagating elastic vibrations dominate thermal conduction in amorphous silicon. Phys. Rev. B, 97:024201, Jan 2018. doi: 10.1103/PhysRevB.97.024201. URL https://link.aps.org/doi/10.1103/PhysRevB.97.024201.
- Walton [1974] D. Walton. Random-network model, density fluctuation, and thermal conductivity of glasses. Solid State Communications, 14(4):335 – 339, 1974. ISSN 0038-1098. doi: https://doi.org/10.1016/0038-1098(74)90913-2. URL http://www.sciencedirect.com/science/article/pii/0038109874909132.
- Pompe and Hegenbarth [1988] G. Pompe and E. Hegenbarth. Thermal conductivity of amorphous si at low temperatures. physica status solidi (b), 147(1):103–108, 1988. doi: https://doi.org/10.1002/pssb.2221470109. URL https://onlinelibrary.wiley.com/doi/abs/10.1002/pssb.2221470109.
- Klitsner and Pohl [1987] Tom Klitsner and R. O. Pohl. Phonon scattering at silicon crystal surfaces. Phys. Rev. B, 36:6551–6565, Oct 1987. doi: 10.1103/PhysRevB.36.6551. URL https://link.aps.org/doi/10.1103/PhysRevB.36.6551.
- Feldman et al. [1993] Joseph L. Feldman, Mark D. Kluge, Philip B. Allen, and Frederick Wooten. Thermal conductivity and localization in glasses: Numerical study of a model of amorphous silicon. Phys. Rev. B, 48:12589–12602, Nov 1993. doi: 10.1103/PhysRevB.48.12589. URL https://link.aps.org/doi/10.1103/PhysRevB.48.12589.
- Zaitlin and Anderson [1975b] M. P. Zaitlin and A. C. Anderson. Phonon thermal transport in noncrystalline materials. Phys. Rev. B, 12:4475–4486, Nov 1975b. doi: 10.1103/PhysRevB.12.4475. URL https://link.aps.org/doi/10.1103/PhysRevB.12.4475.
- Masciovecchio et al. [1997] C. Masciovecchio, G. Ruocco, F. Sette, P. Benassi, A. Cunsolo, M. Krisch, V. Mazzacurati, A. Mermet, G. Monaco, and R. Verbeni. High-frequency propagating modes in vitreous silica at 295 k. Phys. Rev. B, 55:8049–8051, Apr 1997. doi: 10.1103/PhysRevB.55.8049. URL https://link.aps.org/doi/10.1103/PhysRevB.55.8049.
- Klieber et al. [2011] C. Klieber, E. Peronne, K. Katayama, J. Choi, M. Yamaguchi, T. Pezeril, and Keith A. Nelson. Narrow-band acoustic attenuation measurements in vitreous silica at frequencies between 20 and 400 ghz. Applied Physics Letters, 98(21):211908, 2011. doi: 10.1063/1.3595275. URL https://doi.org/10.1063/1.3595275.
- He et al. [2011] Yuping He, Davide Donadio, and Giulia Galli. Heat transport in amorphous silicon: Interplay between morphology and disorder. Applied Physics Letters, 98(14):144101, 2011. doi: 10.1063/1.3574366. URL https://doi.org/10.1063/1.3574366.
- Fabian and Allen [1999] Jaroslav Fabian and Philip B. Allen. Theory of sound attenuation in glasses: The role of thermal vibrations. Phys. Rev. Lett., 82:1478–1481, Feb 1999. doi: 10.1103/PhysRevLett.82.1478. URL https://link.aps.org/doi/10.1103/PhysRevLett.82.1478.
- Ladd et al. [1986] Anthony J. C. Ladd, Bill Moran, and William G. Hoover. Lattice thermal conductivity: A comparison of molecular dynamics and anharmonic lattice dynamics. Phys. Rev. B, 34:5058–5064, Oct 1986. doi: 10.1103/PhysRevB.34.5058. URL https://link.aps.org/doi/10.1103/PhysRevB.34.5058.
- McGaughey and Kaviany [2004] A. J. H. McGaughey and M. Kaviany. Quantitative validation of the boltzmann transport equation phonon thermal conductivity model under the single-mode relaxation time approximation. Phys. Rev. B, 69:094303, Mar 2004. doi: 10.1103/PhysRevB.69.094303. URL https://link.aps.org/doi/10.1103/PhysRevB.69.094303.
- Coleman [2015] Piers Coleman. Introduction to Many-Body Physics. Cambridge University Press, 2015. doi: 10.1017/CBO9781139020916. URL https://doi.org/10.1017/CBO9781139020916.