Optimal materials for maximum near-field radiative heat transfer
Abstract
We consider the space of all causal bulk materials, 2D materials, and metamaterials for maximum near-field radiative heat transfer (RHT). Causality constrains the bandwidth over which plasmonic response can occur, explaining two key traits in ideal materials: small background permittivities (minimal high-energy transitions in 2D materials), and Drude-like free-carrier response, which together optimally yield 10X enhancements beyond the theoretical state-of-the-art. We identify transparent conducting oxides, III-Nitrides, and graphene as materials that should offer nearly ideal near-field RHT rates, if doped to exhibit plasmonic resonances at what we term “near-field Wien frequencies.” Deep-subwavelength patterning can provide marginal further gains, at the expense of extremely small feature sizes. Optimal materials have moderate loss rates and plasmonic response at for temperature, suggesting a new opportunity for plasmonics at mid- to far-infrared wavelengths, with low carrier concentrations and no requirement to minimize loss.
I Introduction
In this Article, we identify optimal materials and metamaterials for maximum near-field radiative heat transfer (RHT) between large-area planar bodies. We optimize over the space of all causality-allowed material-permittivity or conductivity distributions and discover the possibility for heat-transfer coefficients at the level of at separations (and temperature), more than 10X higher than the current theoretical state-of-the-art Song et al. (2015a); Mulet et al. (2002). These bounds enable identification of three key characteristics of optimal materials: small background permittivities (or, for 2D materials, minimal high-energy electronic transitions), moderate loss rates, and single-pole Drude-like response with effective surface-plasmon wavelength. These three criteria are not all satisfied by any of the typical bulk materials proposed for near-field RHT; for example, doped Silicon Basu et al. (2009); Liu et al. (2014); Fernández-Hurtado et al. (2017) has a large background permittivity, while polar dielectrics Caldwell Joshua et al. (2015); Francoeur et al. (2008) have non-Drude-like, highly dispersive narrow-band response. Among bulk materials, we identify transparent conducting oxides (TCOs) and III-Nitrides at low to medium carrier concentrations () as particularly promising material classes, with the capability to exhibit record RHT rates and to approach within a factor of 2 of the causality-based bounds. Among metamaterials, we show that hyperbolic effective-medium response is nonideal, and that although patterned-cylindrical-hole structures can enable slight enhancements to RHT response, they may require unrealistic feature sizes to do so. We use a gap-surface-mode analysis to provide physical intuition supporting the ideal material characteristics, and we derive a “near-field Wien’s Law” to prescribe the optimal resonance frequencies at any temperature. Because near-field local densities of states cannot scale with the square of frequency, , like far-field plane-wave states do, the optimal near-field resonance frequencies are significantly red-shifted relative to the classical Wien frequencies, yielding optimal HTC rates of as a function of temperature . Interestingly, the optimal causal 2D materials can have slightly superior HTCs to their bulk counterparts, and realistic 2D plasmonic materials at low carrier concentrations or Fermi levels and moderate loss rates also offer the prospect for record-level near-field RHT rates. From a materials perspective, these results offer a new opportunity for plasmonics: instead of pushing for near-zero loss and the highest possible carrier concentrations to exhibit near-visible-frequency resonances Boltasseva and Atwater (2011), optimal materials have moderate loss rates and support mid- to far-infrared resonances arising from low to moderate carrier concentrations. More broadly, these optimal characteristics we present can provide guidelines for material choices and designs for a wide range of thermal applications in the near-field, such as thermophotovoltaics Karalis and Joannopoulos (2017); Fiorino et al. (2018a); Vaillon et al. (2019); Papadakis et al. (2020); Zhao et al. (2017), heat-assisted magnetic recording Challener et al. (2009); Bhargava and Yablonovitch (2015), nanolithography Pendry (1999), and thermal management Ben-Abdallah and Biehs (2014); Otey et al. (2010); Khandekar et al. (2018); Fiorino et al. (2018b).
In recent years, near-field RHT rates significantly higher than the blackbody limit have been measured between , SiC, gold, and doped Si in pioneering experiments Song et al. (2015a); Shen et al. (2009); St-Gelais et al. (2016); Song et al. (2016); DeSutter et al. (2019); Fiorino et al. (2018a, c); Kloppstech et al. (2017), inspiring a search for the best material and structure combinations for near-field RHT Song et al. (2015b); Miller et al. (2015); Jin et al. (2017); Biehs et al. (2012); Ben-Abdallah and Joulain (2010); Venkataram et al. (2020); Tang et al. (2020). Polar dielectrics seem sensible for their strong surface phonon polaritonic resonances in the infrared. plates, in particular, could in theory yield HTC of about at separations Song et al. (2015a). Yet, as we will show, the limited bandwidth available in polar dielectrics hinders their ability for further increases in HTC. Traditional plasmonic materials and doped semiconductors have also been explored Song et al. (2016); Kralik et al. (2012); DeSutter et al. (2019). But in order to tailor their surface plasmon polariton resonance wavelengths to match the optimal ones, the near-field “thermal wavelengths” for polaritonic materials have to be derived first, which is one of the goals of our work. Advanced material-growth and nanofabrication techniques have enabled wavelength- to deep-subwavelength-scale patterning of materials St-Gelais et al. (2016); Yu and Capasso (2014). Both hyperbolic metamaterials and in-plane structured metamaterials have been theoretically shown to offer RHT performances better than those of the bulk Biehs et al. (2012); Fernández-Hurtado et al. (2017); Iizuka and Fan (2018); Liu and Zhang (2015); Liu et al. (2014). As predicted by rigorous-coupled-wave-analysis computations, at , air-hole patterned doped Si at carrier concentration of can offer comparable HTC value to that from at , and even better relative values for larger separations until Fernández-Hurtado et al. (2017).
A fundamental question yet to be answered is which material properties enable maximal HTC between two extended structures at any given temperature. Specific instances of this question have been explored theoretically and computationally Iizuka and Fan (2016); Wang et al. (2009); Nefzaoui et al. (2013); Liu and Zhang (2015); Liu et al. (2014). References Iizuka and Fan (2016); Chalabi et al. (2014) provide modal analyses of gap surface waves, though without intuition about integrated broadband radiative response and optimal material properties. Numerical optimizations for single-pole permittivity lineshapes of materials have been done Wang et al. (2009); Nefzaoui et al. (2013), but without contextualization in the broader landscape of material possibilities, and without guidance relating the optimal single-pole parameters to temperatures, gap distances, and related system parameters. Moreover, none of these works consider optimality criteria of 2D materials. Still they help us better delineate our questions: what is the best material for near-field RHT out of all causality-allowed materials, including multiple-pole bulk materials and 2D materials? Can we theoretically explain the optimal parameters? How do the optimal parameters vary with temperature? We start by doing numerical optimizations in search of the optimal linear permittivity for bulk materials and 2D conductivity for 2D materials at , with passivity as the only constraint (Sec. II). The results provide not only the largest possible HTC, but also intuitions of optimal material characteristics, which for both bulk and 2D materials entails that small-background-permittivity single-Drude-pole plasmonic materials with moderate loss could provide the ideal lineshape, and that the ideal frequency of peak spectral contribution is about . Through gap surface resonance modal analyses, and rigorous computations of HTC, the temperature-independent optimal material properties can be intuitively explained (Sec. III). As for the optimal resonance frequency (frequency of peak spectral contribution in the case of 2D materials), which varies with the operating temperature, we apply an analysis similar to that leading to Wien’s Law for blackbodies, and derive near-field versions that account for the spectral profiles of LDOS. These near-field laws define the optimal resonance frequencies as a function of temperature for bulk materials, with a linear scaling factor significantly smaller than that of a blackbody (Sec. IV). Optimal HTC also scales linearly with temperature, different from the cubic dependence in the far-field case. Furthermore, we study the effects of deep-subwavelength patterning under the framework of effective medium theory (EMT), and suggest the optimal schemes and parameters for nanostructuring. Large reductions in carrier concentrations can be provided by in-plane patterning of cylindrical air-holes, yielding enhancement in HTC for originally sub-optimal materials. However, originally optimal materials still provide good, if not better HTC values without nanopatterning, in which sense deep-subwavelength patterning only makes sense if one had to begin with highly sub-optimal materials, and feature sizes well below the gap distance can be fabricated (Sec. V). Similar optimizations over all causality-consistent 2D conductivity for 2D materials present findings which are excitingly similar to those of bulk materials and can be explained likewise. Despite quite different gap surface resonance modal dispersions for bulk and 2D materials in the plane–plane configuration, the optimal 2D material is the direct 2D analog of the optimal bulk material, as it has a single Drude pole, a moderate loss rate, and minimal higher-energy electronic transitions. (Sec. VI). Among common materials, we predict that TCOs, III-Nitrides with small background permittivities, bulk or 2D, as well as other 2D doped semiconductors and 2D semimetals with predominantly single-Drude-pole 2D conductivity, once synthesized and engineered to possess low to medium carrier concentrations and moderate loss levels, could potentially approach the optimal permittivity or the optimal 2D conductivity, and yield HTC 5X better than for a wide range of gap separations (Sec. VII).
II Ideal causality-allowed for maximum HTC
In this section, we formulate the optimization of heat-transfer coefficients (HTCs) over all causality-allowed material permittivities . We start with the standard expressions for computing HTC via modal-photon-exchange functions (Sec. II.1) and list common permittivity lineshapes (Sec. II.2, Drude, Drude–Lorentz, etc.). In Sec. II.3, we describe the Kramers–Kronig-based representation of all causality-consistent permittivities, and we show that numerical optimizations identify key material characteristics that are optimal for near-field RHT. We concentrate on HTC in this section to isolate the effects of a single temperature, which makes it useful for comparisons across the literature, and as discussed in Sec. IV our results translate seamlessly to RHT between two bodies with arbitrary temperature differences.
II.1 HTC between planar structures
The canonical configuration of extended near-field RHT consists of two parallel half-spaces (or two parallel planar structures for 2D materials) separated by a vacuum gap with thickness much smaller than the characteristic thermally excited wavelength Ottens et al. (2011); Pendry (1999); Mulet et al. (2002). For materials with translation and rotation symmetry in the plane parallel to the surfaces (isotropic or anisotropic out of plane), HTC is calculated with a double-integration over all plane-wave channels at frequency and surface-parallel wavenumber . The infinitesimal temperature difference between the two bodies manifests in a temperature derivative of the Planck distribution , where and is the Boltzmann constant. Then the HTC is given by Joulain et al. (2005)
| (1) |
for any polarization. For evanescent waves, the variable is a modal photon exchange rate that is proportional to the transmission probability through each plane-wave channel, with the -component of wavevector in vacuum denoted as and reflectivity from vacuum gap to medium 1 or medium 2 as . We refer to the wavenumber-integrated quantity as the “spectral photon exchange.”
II.2 Common permittivity lineshapes
Metals, doped semiconductors, and polar dielectrics are all materials of interest for large near-field RHT. Their permittivity lineshapes arise from electronic transitions (intraband and interband), optical phonons, and related processes determining optical properties for most materials Yu and Manuel (2016); Kaxiras and Joannopoulos (2019).
The simplest Drude lineshape can often describe intraband transitions, and is given by Kaxiras and Joannopoulos (2019); Raman et al. (2013)
| (2) |
The background permittivity arises from electronic transitions with frequencies much higher than thermally interesting ones. (Whether it multiplies the second term or not amounts to a simple redefinition of the parameter .) The plasma frequency , the amplitude or strength of the oscillator, is a measure of free-carrier density (generalized to incorporate background permittivity and effective mass):
| (3) |
where is the free-carrier effective mass. From electron scattering rate one can define a dimensionless loss rate .
A Drude–Lorentz lineshape, which describes, for example, interband transitions and optical-phonon contributions, is given by Yu and Manuel (2016); Caldwell Joshua et al. (2015)
| (4) |
where the frequency is the band-to-band transition frequency (or transverse-optical-phonon frequency) and the oscillator strength is now denoted by . Knowledge of the ratio of the static dielectric constant to specifies the ratio , which follows from Eq. (4) and is known as the Lyddane-Sachs-Teller relation Lyddane et al. (1941).
II.3 Numerical optimization of for HTC at
Any causal physical material permittivity must satisfy the Kramers–Kronig relations Lucarini (2010) that relate the real part at one frequency to an integral of the imaginary part (or vice versa) over all frequencies ():
| (5) |
where the integral is a principal-value integral. Notice the suggestive form of the integrand of Eq. (5), which is similar to a lossless Drude–Lorentz oscillator with integration variable as the effective transition frequencies of a continuum of oscillators. As we show in the SM, this correspondence can be formalized: for a discretization of the Kramers–Kronig relation into local basis functions, one can write the permittivity as a sum of Drude–Lorentz oscillators with infinitesimal loss rates:
| (6) |
where from above. Such a representation is completely general, and applies for arbitrarily high loss levels in a material. (Lossless Drude–Lorentz oscillators have delta-function imaginary parts with arbitrarily large amplitudes, which can be derived from Eq. (6) in the limit, cf. SM.) A similar representation can be derived via a Mittag–Leffler expansion, albeit with possibly lossy oscillators and without consideration of higher-order poles Sehmi et al. (2017); Shepherd (2019). In some scenarios, one may use alternative oscillator types (e.g. Gauss–Lorentz Orosco and Coimbra (2018)) which, for a small number of oscillators, may be a better approximation of certain dielectric functions. But ultimately any such permittivity must be representable by Eq. (6).
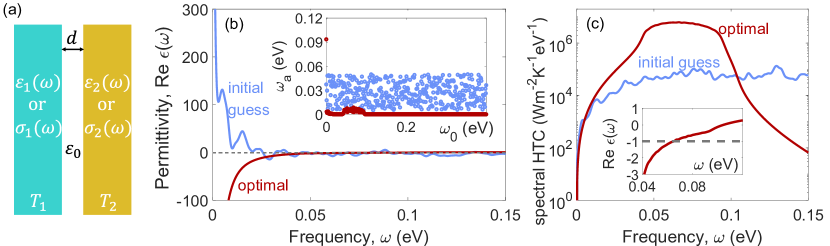
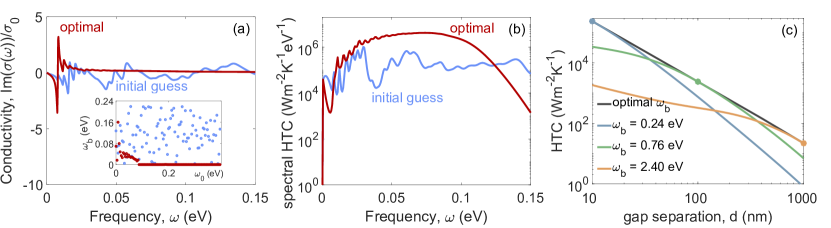
Optimizing HTC over all causality-allowed permittivities can then be done by optimizing Eq. (1) over all possible oscillator strengths and frequencies (with infinitesimal loss rates ) for the two materials involved. We allowed for the possibility of different materials for the two bodies, but the optimizations always converged on identical permittivity profiles. For a single material, we optimize over these parameters by choosing a large number (hundreds) of oscillator frequencies to cover the full relevant bandwidth. Then we do a gradient-descent-based local optimization of Eq. (1) over the corresponding hundred-plus values, using semi-analytical expressions of the HTC gradients with respect to all parameters (cf. SM). To avoid poor-quality local optima, we typically run the optimizations in two stages: first with a smaller number of parameters starting from a random initial guess, and then using “successive refinement” Mutapcic et al. (2009) to polish the optimal solution with a very large number of parameters (cf. SM for more details). The optimizations typically converge within a few hundred iterations. Figure 1 depicts the initial and final permittivity distributions of a 400-oscillator optimization, with a random initial permittivity profile (blue) that converges to a smooth Drude-dominant profile by the end of the optimization. We repeated this process with many random starting points and found that lineshapes nearly identical to that shown in Fig. 1 appear to be globally optimal or nearly so. The ideal lineshape has a Drude pole () with large oscillator strength, , that is the dominant feature of the lineshape. (The optimal oscillator strength scales with temperature, as discussed in Sec. IV.) The inset of Fig. 1 shows the oscillator weights: there are typically a few other low-energy oscillators () with small but nonzero oscillator strengths, which provide small adjustments to the lineshape to broaden the resonant bandwidth, with all remaining oscillator strengths converging to zero (cf. SM). The HTC from such simple lineshapes is approximately , a record level for separations and temperatures.
Natural questions, then, are why the Drude lineshape is superior to more complex possibilities, why the optimal oscillator strength is , and whether real materials can approach the optimal HTC values. In the next sections, we develop simple theoretical explanations of these questions. We start with the question of the optimal lineshape.
III The ideal permittivity profile: Drude with small and moderate
In this section we pinpoint the physical underpinnings for the optimal Drude lineshape. We focus on three ideas: why Drude is better than Drude–Lorentz or more complex lineshapes, why a small background permittivity is better than large ones, and why moderate loss rates are also important. For the first two, minimal dispersion in the permittivity is the key controlling factor; it is not possible for a material to exhibit a resonant surface-plasmon permittivity of over an infinite bandwidth (also due to causality constraints Gustafsson and Sjöberg (2010)), but Drude materials with small background permittivities appear to offer the largest possible such bandwidths. With respect to the loss rate, moderate losses are optimal because there are tradeoffs between the source amplitudes and resonant amplifications that result in specific, moderate ranges of optimal loss rates.
III.1 Small background permittivities
The surface wave at an interface between a polaritonic material and air exhibits a modal dispersion relation for the wavenumber given by Maier (2007)
| (7) |
The largest confinement, which occurs for the largest , occurs as approaches -1 from below, in the low-loss limit. This condition also holds for two-interface geometries, e.g. metal–insulator–metal, where in the high-wavenumber limit the two interfaces effectively decouple Maier (2007). Moreover, one can show (cf. SM of Miller et al. (2015)) that the same condition of is the condition at which peak HTC occurs between planar layers in the low-loss limit, as the high confinement leads to the strongest resonant energy transfer. Thus maximum HTC requires the largest possible bandwidth over which . (Or, more precisely Shim et al. (2020), for which .) This bandwidth cannot be infinite: causality, again manifest through the Kramers–Kronig relations, dictates limits to the largest bandwidth for which a specific negative permittivity can be achieved Gustafsson and Sjöberg (2010). Our numerical computations of Sec. II.3 imply that Drude lineshapes offer nearly the largest possible bandwidth for which .
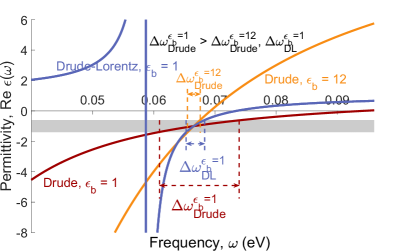
Figure 2 demonstrates why a Drude material with small background permittivity provide the largest bandwidth with . Three permittivity lineshapes are depicted: Drude with small background permittivity (red), Drude with large background permittivity (orange), and Drude–Lorentz with small background permittivity (blue). The shaded grey region covers real permittivity values between and , for clear visual indication of bandwidth. The Drude–Lorentz bandwidth is quite small due to the nonzero transition frequency; ascends from at a nonzero frequency, and does so much faster than a Drude material, exhibiting large dispersion and thus small bandwidth. A large background permittivity has a similar effect. As can be seen in Fig. 2, as well as from Eq. (2), a large background permittivity increases the slope of the permittivity lineshape at every frequency, hence increasing its dispersion and reducing its bandwidth. By contrast, the Drude lineshape with small background permittivity exhibits the least amount of dispersion and the largest bandwidth.
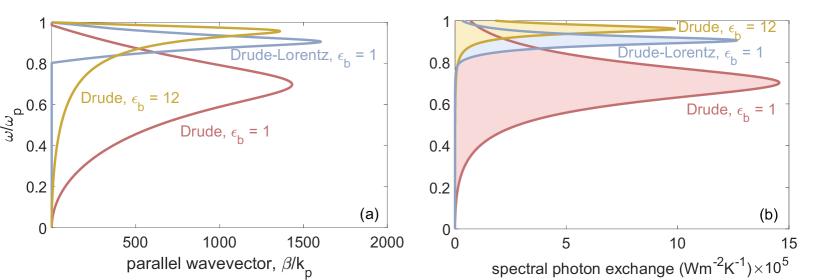
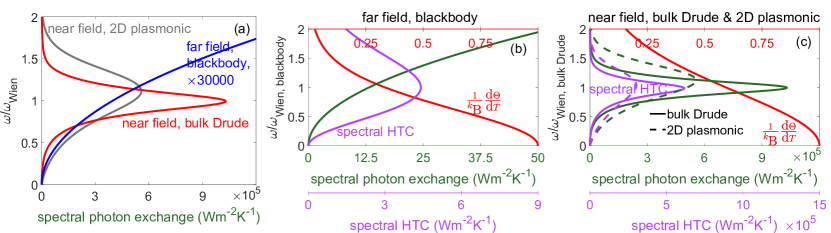
Further quantitative support of the importance of Drude-type response and small background permittivity is given in Fig. 3. Figure 3(a) shows the modal dispersion relations Maier (2007) between two half spaces with the three lineshapes as in Fig. 2, each with its optimal loss rate in terms of HTC. Figure 3(b) shows the spectral photon exchange, i.e. the temperature-independent part of the HTC integrand. The close correspondence between (a) and (b) confirms the suitability of using modal analysis to interpret the modal and spectral components of HTC. At their respective optimal loss rates, the largest achievable values are similar, indicating similar levels of spatial confinement on resonance. Yet one can see that the larger bandwidth of the small-background-permittivity Drude material provides a substantial advantage over the other materials.
Large, nonideal background permittivities usually occur in heavy elements or their compounds, which have many high-energy inner-shell electrons. This indicates the possible superiority of light materials, with small attendant background permittivities, a suggestion that is substantiated in our investigation of optimal real materials in Sec. VII.
III.2 Moderate loss
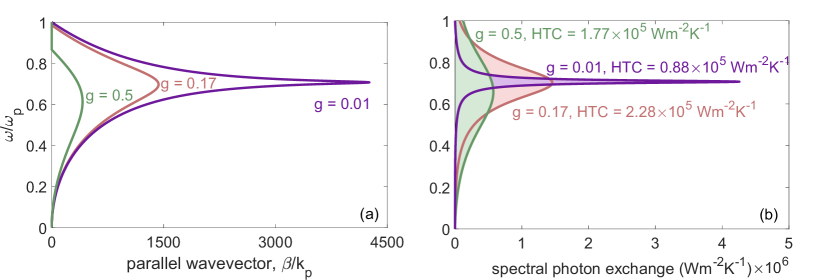
The second key factor of the optimal lineshape is a moderate loss rate . Figure 4 compares modal dispersions and spectral photon exchanges among three different choices of : 0.01, 0.17, and 0.5. Large broadens the spectral contributions, but gives few high- states or small LDOS on resonance, seen from the dispersion. Meanwhile, small provides huge LDOS on resonance, at the cost of very narrow peak-HTC bandwidth. The very large loss rates, while penalized less than very small loss rates, show sub-optimal HTC due to their small peak values. The best integrated broadband response comes from intermediate values of , which equals 0.17 for gap separation of . Our result of moderate loss as optimal confirms coupled-mode predictions of such a trend Iizuka and Fan (2018).
IV Wien frequencies for near-field energy exchange between real materials
The final optimal Drude parameter to explain is the plasma frequency , whose optimum is for 300K HTC. This optimal value is closely linked to the precise temperature spectrum of the sources under consideration, and in this section we derive a linear relation between the two.
For two macroscopic bodies in the far field, Wien’s displacement law states that the radiated energy of a blackbody is maximized at a frequency linearly proportional to its temperature Mehra and Rechenberg (2001); Heald (2003). The radiated energy is , where in this case is interpreted as a photon emissivity rate. A key distinction in the far-field case is that the term is proportional to the photon density of states, which scales as the square of frequency, Christensen (2019)). This quadratic scaling is critical to the determination of the Wien peak, blue-shifting the maximum-emission peak relative to the peak of the Planck distribution. One can similarly define a “Wien” peak for maximum far-field HTC, simply replacing with . The optimal frequency for maximum HTC again scales linearly with temperature. One can generalize this further to radiative heat transfer between two bodies, with temperatures and , yielding slight corrections to the linear relationship. From Wien’s Law, the intuition has developed that the thermal wavelength is about 8– near temperatures Heald (2003), but this intuition is only valid for the far field. In the near field, the wavelengths for peak thermal exchange are significantly longer.
In the near field, the spectral photon exchange (which replaces blackbody emissivity in the frequency integral) can exhibit extraordinarily large peaks due to the access to high-confinement near-field waves, but it cannot exhibit scaling . In contrast to the divergent density of propagating photon states, there is a known sum rule requiring that the integrated near-field local density of states must be finite Shim et al. (2019); Sanders and Manjavacas (2018). For a Drude material, the spectral photon exchange and the local density of states exhibit peaks at a resonant frequency where the real part of the permittivity is -1, i.e. , as seen in the red curve of Fig. 5(a). For room temperature and higher, the bandwidth of the Drude-material photon transmission is typically much smaller than the width of the thermal spectrum, such that the overlap between the two is essentially the integral of the spectral photon exchange multiplied by the value of the Planck distribution at , contrasted in Fig. 5(b,c). This implies that the optimal will maximize the product of two quantities: the integrated energy exchange, and the value of . The Planck distribution actually peaks at zero frequency. Yet a Drude material with infinitesimal resonant frequency will necessarily have near-zero bandwidth, and is nonideal. At higher frequencies, the bandwidth increases, though the Planck distribution starts to decrease. In the SM, we show that one can derive transcendental equations relating the optimal for heat transfer, which defines the Wien frequency , relative to temperature, leading to an HTC “near-field Wien frequency,” , given by
| (8) |
This optimal resonance frequency directly determines the optimal plasma frequency: ; if we insert Eq. (8) into this relation and choose , we find an optimal plasma frequency of , exactly matching that discovered by the computational optimization of Sec. II.3. Moreover, with these optimal resonance frequencies and the optimal lineshape, the maximum possible HTC values scale linearly with temperature, given by
| (9) |
Thus we have an explanation for the optimal plasma frequency and for the maximal HTC value, which is determined by the combination of bringing a large integrated spectral photon exchange as close as possible to zero frequency, where the Planck distribution peaks.
At high enough temperatures, for example for the configurations, these maximum near-field radiative HTCs exceed conductive HTCs in the ballistic regime under standard conditions for temperature and pressure Müller et al. (2017)(cf. SM), as shown Fig. 6(c). Any given material (dashed lines) will not show linear temperature scaling itself, but the envelope of optimal materials (solid red line) exhibit exactly the predicted linear scaling.

A similar analysis can be done for radiative heat transfer (RHT) between two bodies of the same material at temperatures and , with . For (an exact analog of the conventional Wien-law condition), the optimal Wien frequency for near-field RHT is given by (cf. SM)
| (10) |
In the near field, the optimal Wien frequency is equivalent to the optimal Wien wavelength, regardless of whether the integrand is written in terms of frequency or wavelength. This stands in stark contrast to the far-field case, where the Wien peak is different in the two cases, due to the inverse relationship between the two that enters the differential in addition to the integrand itself Heald (2003). This does not occur in the near field thanks to the analytical structure of the HTC and heat-transfer expressions in which the integration parameter is effectively ; since , there is no distinction whether parametrizing the radiation laws with or .
Figure 6 plots the optimal Wien frequencies, and their corresponding Wien wavelengths, for both near- and far-field HTC (a) and RHT (b). One can see the linear scaling relations that emerge in the near-field cases, and the significantly smaller slopes that lead to much longer optimal wavelengths than for far-field blackbodies. Even for temperatures as high as , the optimal resonance wavelength is . For HTC at , the optimal plasma frequency of translates to an optimal Wien frequency of , which corresponds to an optimal operating wavelength of .
V Deep-subwavelength, possibly anisotropic, structured metamaterials
Metamaterials, which exhibit effective properties different from their constituent materials Cui et al. (2010), are a natural platform for potentially achieving maximal near-field HTC and RHT. Metamaterials with isotropic effective permittivities naturally fall under the umbrella of Eq. (6) and may exhibit HTC values close to the optimal at separations and temperatures, but cannot surpass them. Yet anisotropic effective permittivities, as seen e.g. in hyperbolic metamaterials Biehs et al. (2012); Guo et al. (2012); Liu et al. (2014), are not subject to the isotropic representation of Eq. (6) and could potentially exhibit superior performance.
We performed an extensive set of computational optimizations of three classes of Maxwell–Garnett effective-medium metamaterials, cf. SM, and summarize our findings according to the class of structures under consideration:
-
1.
Isotropic, periodic holes: the materials retain isotropic optical properties. With air fill fraction represented by , the effective permittivity is:
(11) As detailed in the supplementary, reducing the electronic density of plasmonic materials brings down both the effective and effective . For non-ideal materials with and that are too high, isotropic air holes can greatly help. They cannot improve materials that are already ideal.
-
2.
Periodic cylinders: cylinders oriented perpendicular to the surfaces lead to a difference in the permittivities along the ordinary and extraordinary axes. The ordinary-axis permittivity is the same as that for isotropic periodic holes, and many resonance properties are similar. There can be a little improvement from anisotropic bands, but the effect is minor and not obvious.
-
3.
Thin-film stacks (hyperbolic metamaterials): deep-subwavelength, periodic multi-layer stacks lead to hyperbolic dispersion bands. However, the hyperbolic resonances are far less tightly confined to the surface compared to plasmon or phonon surface polaritons, resulting in smaller HTC. The thin-film stacks are inferior to periodic cylinders.
We refer to the SM for a detailed effective-medium theory (EMT) description of the effective permittivities arising from these patterning schemes and a comparison of their optimal HTC values. In Sec. VII we compare estimates of optimal nanostructured materials to optimal bulk materials. Our central finding is that patterning can provide marginal improvements, but at the expense of significant fabrication complexity due to the tiny required feature sizes. Moreover, all of the effective-medium-theory values become approximate (and likely overestimates) at the small separation distances of primary interest, further diminishing the possible improvements via such patterning.
VI 2D Materials
Reduced material dimensionality leads to qualitatively different polaritonic response. The plasmon-polariton dispersion relation for a 2D plasmonic material Ilic et al. (2012), for example, is quite different from that of a bulk plasmonic half space Maier (2007), with the resonant frequency scaling as the square root of the wavenumber Christensen (2019), , instead of asymptotically approaching a constant value. Yet we still find that optimal 2D materials exhibit narrow-band RHT response relative to blackbodies, offering many similarities to their optimal bulk counterparts. In this section, we carry out similar numerical optimizations and analyses as those in the bulk case, and comparatively present the results for 2D materials by identifying the direct analogs and highlighting the differences with the optimal bulk Drude materials.
For a 2D material, causality implies a conductivity of the form (cf. SM),
| (12) |
which is the analog of the bulk-material representation, Eq. (6). The is a dummy-variable thickness (assumed to be throughout) such that the have dimensions of frequency, and is canceled in the sum rule for : (Christensen (2019)). 2D materials, including 2D insulators (e.g. undoped 2D hBN Dai et al. (2014)), 2D semiconductors (e.g. 2D transition metal dichalcogenides like Li et al. (2014), and 2D black phosphorous Low et al. (2014)), 2D semimetals (e.g. graphene Jablan et al. (2009), borophene Verma et al. (2017)) and 2D metals (e.g. atomically thin metals Maniyara et al. (2019); Moresco et al. (1999)), exhibit 2D phonons/interband transitions Rivera et al. (2019), leading to the Drude–Lorentz terms (with non-zero ), and the latter two classes, in addition, also possess 2D plasmons/intraband transitions, leading to Drude terms (with ) Xia et al. (2014); Mak et al. (2012). By the same process as for bulk materials, we use gradient descent to optimize over the set of conductivities represented by Eq. (12), and we find analogous results: the optimal profile is dominated by a single-pole conductivity, as shown in Fig. 7(a), and compared to the initial guess, the optimal profile provides spectral HTC contributions at a rather broad range of low-energy frequencies, as shown in Fig. 7(b). Although the dominant oscillator is not strictly Drude type, its frequency is nearly zero (). The other oscillators either have very small amplitudes if their oscillator frequencies are small, or have exactly if their oscillator frequencies are large. The optimal HTC level is , larger even than the optimal bulk-material HTC. Even for a completely 2D plasmonic material, i.e., with single 2D Drude oscillator optimized for so that , HTC can be as large as , as highlighted by the blue marker in Fig. 7(c). For every other , the optimal Drude oscillator amplitudes , and hence 2D carrier concentrations , need to be re-optimized in order to match the optimal gap surface wave modal dispersions, as opposed to being essentially constant in the case of bulk Drude materials. Yet interestingly, the optimized 2D material parameters provide HTCs that scale with exactly the same way as the optimal bulk material, as seen from Fig. 9. We detail the gap-distance dependence of the optimal and of 2D plasmonic materials in the SM. These findings suggest that these structures may be approaching some universal, material-dimension-independent fundamental limit.
The bulk-material intuition of Sec. III carries over to 2D materials: the Drude pole, or Drude–Lorentz pole with negligible () is ideal because it maximizes the bandwidth of large RHT response, and the optimal loss rate is a moderate value that trades off strong confinement (low loss) with large bandwidth (high loss). In addition, 2D material performances are also affected by the substrate. Substrates with refractive index higher than that of vacuum lead to decreased confinement (cf. SM) and are therefore nonideal. The Wien frequencies for RHT and HTC are quite similar to those of bulk materials, with a slight blue shift due to the wider bandwidth arising from the dispersion of two sheets of 2D materials at the optimal loss rate, as shown in Fig. 5(a,c). We include a plot of the optimal 2D-material Wien frequencies in the SM.
VII Candidate materials for Maximum near-field RHT
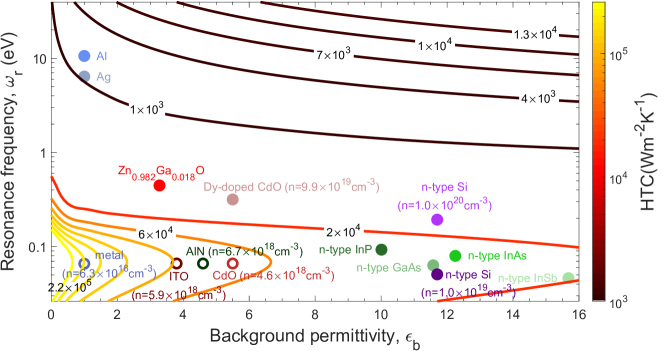
Here we synthesize the optimal bulk- and 2D-material results of the previous sections to identify the best candidate materials for maximal HTC and RHT. For bulk-material HTC at , we found three key properties: Drude-like response with resonant wavelengths of , small background permittivity and moderate loss rates ( 0.02 to 0.18, decreasing as increases). Loss rates and background permittivities can be tabulated for a wide variety of materials. In Fig. 8 we plot HTC level curves as a function of resonant frequency and background permittivity , overlaid with a wide variety of possible materials. Noble metals (Ag, Al) and alternative plasmonic materials such as GZO (Ga-doped ZnO) and Dy-doped CdO have resonant frequencies that are too large, while semiconductors such as Si and GaAs can be doped to the right resonant frequencies but exhibit background permittivities that are too large. Lightly doped TCOs and III-Nitrides are particularly promising material classes that present themselves as potentially optimal.
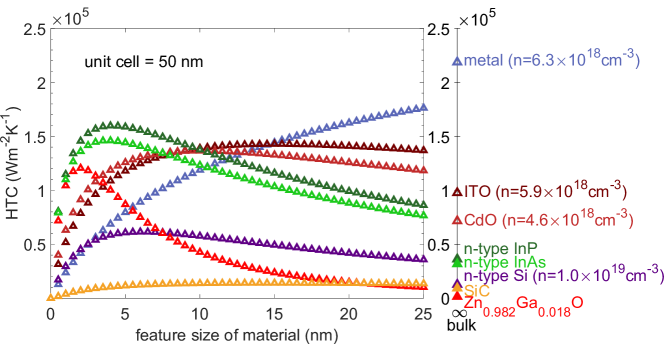
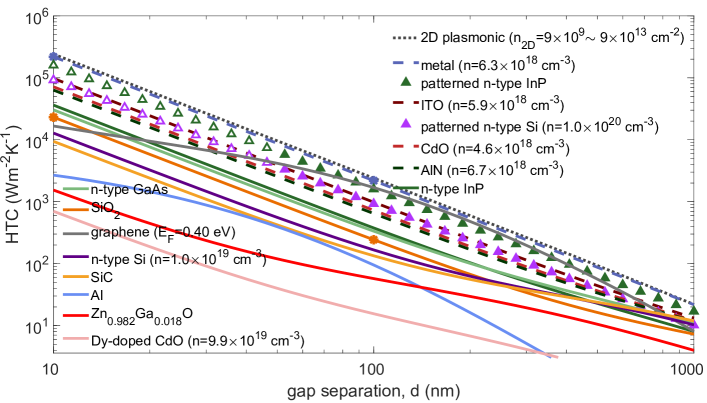
Figure 9 compares the theoretical HTC values for many bulk and 2D materials, as well as the optimal possible values, which are shown as the dashed (bulk) and dotted (2D material) lines. The previous theoretical state-of-the-art for unpatterned bulk materials, using , is depicted with orange markers. Doped III-V’s such as GaAs and InP, even with their high background permittivities, can already show enhancements beyond , given published permittivity data Chochol et al. (2017); Kitamura et al. (2007). Yet the real gains to be had are with the lighter materials, such as AlN, CdO, and ITO. If these materials can be doped to the optimal carrier concentrations listed in Fig. 9, they can exhibit 5X enhancements beyond the current state-of-the-art. (The optimal carrier concentrations tend to range from 3 to multiplied by .) Patterning in sub-optimal materials such as n-type InP and n-type Si can lead to slight further enhancements, discussed below, though the feasibility of effective-medium theory for describing such response is dubious at separations below for the given choice of temperature and unit cell size, as indicated by the open markers. 2D materials are particularly promising: purely plasmonic response can exhibit broad resonant bandwidth and strong confinement at the same time. For example, graphene with Fermi level (optical conductivity fromFalkovsky (2008)) is shown to exhibit near-optimal HTC values at separations on the order of , though a key distinction from the optimal bulk materials is that the optimal oscillator amplitude and therefore the optimal 2D carrier concentration vary with the separation distance. Agnostic of the bandgap and electronic dispersion of the 2D materials, the optimal and the corresponding maximal HTCs can be identified for each as shown in Fig. 7(c) and SM. These HTCs along the dotted grey line in Fig. 9 are higher than those from any other materials. For linear Dirac electronic dispersion, as in graphene, the optimal carrier concentration optimal is . Graphene holds potential for optical response over a great range of electromagnetic spectrum from radio waves to visible frequencies Mak et al. (2012), and its optical conductivity is well-studied in literature, with the infrared spectral range dominated by intraband transitions Falkovsky (2008); Jablan et al. (2009); Mak et al. (2008), making it the exemplary 2D material in our study. However, as the optical properties of other 2D plasmonic materials, 2D semiconductors and semimetals in particular, are better characterized, it is likely that they may offer similar or superior performance to graphene.
Figure 10 confirms the pros and cons of metamaterial patterning. In Sec. V we found that periodic cylindrical holes offer strong performance in a lithography-compatible form factor, and in Fig. 10 we consider the effects of such patterns on HTC values at . For a unit cell size of , about the largest possible that could conceivably exhibit effective-medium behavior at the separations of interest in the near field, we find that HTC for each material tends to peak at feature sizes on the order of . For these feature sizes the significant air fraction reduces the background permittivity and increases the HTC bandwidth. Yet one can see that these effects are marginal, and that the optimal bulk values (hollow triangles on the right-hand axis) offer nearly the same HTC values in much simpler architectures.
VIII Looking forward
In this article, we identified the optimal material characteristics for maximum near-field RHT rate and HTC. Our results suggest two key avenues for future exploration: synthesis and characterization of mid- to far-infrared Drude plasmonic materials with small background permittivities, and identification of optimal patterning schemes outside of the realm of effective-medium theory.
The first avenue, centering around the development of mid- to far-infrared plasmonic materials, stems from the three properties that we identify as critical to maximal HTC for bulk materials: small background permittivity (Sec. III.1), moderate loss rate (Sec. III.2), and a resonance frequency (where ) corresponding to wavelength at , and which scales linearly with temperature (Sec. IV). TCOs and III-Nitrides with moderate carrier concentrations should be nearly ideal, and validation will be important as there has been little investigation into engineering plasmonic material properties at such long wavelengths. Moreover, since moderate loss is superior to low loss, new materials should be available that might traditionally have been too lossy for other plasmonics applications.
Meanwhile, 2D plasmonic materials with a single-Drude-pole optical conductivity (and thus negligible high-frequency Drude–Lorentz poles) can offer record-level near-field HTCs at their optimal carrier concentrations and loss rates. 2D semiconductors and 2D semimetals with strong 2D plasmons and the ability to support highly-confined broadband resonances in the infrared may be great materials to start with. Our analysis suggests engineering efforts devoted to optimizing the spectral bandwidth and broadband confinement of gap surface resonances of 2D materials near the prescribed near-field Wien frequencies, through either doping, gate-biasing, introducing heterostructures and nano-patterning. Being naturally surface passivated and thus easy for various integration methods with existing building blocks and devices Liu et al. (2019); Bae et al. (2019), 2D materials offer great promise in future energy technologies. Serendipitously, these bulk and 2D material candidates we propose not only offer possibilities to maximize near-field RHT efficiencies but also provide platforms for tunable thermal applications with the array of available switching and dynamic control approaches Ito et al. (2017); Papadakis et al. (2019); Ilic et al. (2018); Yu et al. (2017); Zhao et al. (2015); Vasudev et al. (2013); Xiong et al. (2012); Orton and Foxon (1998).
The second avenue to explore is that of wavelength-scale patterning, which lies between the two regimes studied in this paper (bulk materials and sub-wavelength-scale patterning of metamaterials). We showed that subwavelength-scale patterning, resulting in effective-medium properties, can lead to further gains in maximal RHT and HTC, but that such gains come at the expense of very small features relative to their bulk counterparts and only very modest rate increases. Thus for wavelength-scale patterning the open questions are two-fold: will the larger size scale of the patterning relieve the stringent feature-size constraints imposed by effective-medium theory, and, in tandem, will it enable substantially larger HTCs and RHT rates beyond the values predicted here? Given the significant recent work in both large-scale, computational “inverse design” Miller (2012); Molesky et al. (2018); Yao et al. (2020); Chung and Miller (2020); Jin et al. (2020), as well as analytical and computational bounds to optical response Miller et al. (2015, 2016); Shim et al. (2019); Kuang et al. (2020); Venkataram et al. (2020); Angeris et al. (2019), conclusively answering such questions should be feasible in the near future.
IX Acknowledgments
This work was supported by the Army Research Office under grant number W911NF-19-1-0279.
References
- Song et al. (2015a) B. Song, Y. Ganjeh, S. Sadat, D. Thompson, A. Fiorino, V. Fernández-Hurtado, J. Feist, F. J. Garcia-Vidal, J. C. Cuevas, P. Reddy, and E. Meyhofer, Nature Nanotechnology 10, 253 (2015a).
- Mulet et al. (2002) J.-P. Mulet, K. Joulain, R. Carminati, and J.-J. Greffet, Microscale Thermophysical Engineering 6, 209 (2002).
- Basu et al. (2009) S. Basu, B. J. Lee, and Z. M. Zhang, Journal of Heat Transfer 132 (2009).
- Liu et al. (2014) X. Liu, R. Zhang, and Z. Zhang, International Journal of Heat and Mass Transfer 73, 389 (2014).
- Fernández-Hurtado et al. (2017) V. Fernández-Hurtado, F. J. García-Vidal, S. Fan, and J. C. Cuevas, Phys. Rev. Lett. 118, 203901 (2017).
- Caldwell Joshua et al. (2015) D. Caldwell Joshua, L. Lindsay, V. Giannini, I. Vurgaftman, L. Reinecke Thomas, A. Maier Stefan, and J. Glembocki Orest, Nanophotonics 4, 44 (2015).
- Francoeur et al. (2008) M. Francoeur, M. P. Mengüç, and R. Vaillon, Applied Physics Letters 93, 043109 (2008).
- Boltasseva and Atwater (2011) A. Boltasseva and H. A. Atwater, Science 331, 290 (2011).
- Karalis and Joannopoulos (2017) A. Karalis and J. D. Joannopoulos, Scientific Reports 7, 14046 (2017).
- Fiorino et al. (2018a) A. Fiorino, L. Zhu, D. Thompson, R. Mittapally, P. Reddy, and E. Meyhofer, Nature Nanotechnology 13, 806 (2018a).
- Vaillon et al. (2019) R. Vaillon, J.-P. Pérez, C. Lucchesi, D. Cakiroglu, P.-O. Chapuis, T. Taliercio, and E. Tournié, Opt. Express 27, A11 (2019).
- Papadakis et al. (2020) G. T. Papadakis, S. Buddhiraju, Z. Zhao, B. Zhao, and S. Fan, Nano Letters 20, 1654 (2020).
- Zhao et al. (2017) B. Zhao, K. Chen, S. Buddhiraju, G. Bhatt, M. Lipson, and S. Fan, Nano Energy 41, 344 (2017).
- Challener et al. (2009) W. A. Challener, C. Peng, A. V. Itagi, D. Karns, W. Peng, Y. Peng, X. Yang, X. Zhu, N. J. Gokemeijer, Y. T. Hsia, G. Ju, R. E. Rottmayer, M. A. Seigler, and E. C. Gage, Nature Photonics 3, 220 (2009).
- Bhargava and Yablonovitch (2015) S. Bhargava and E. Yablonovitch, IEEE Transactions on Magnetics 51, 1 (2015).
- Pendry (1999) J. B. Pendry, Journal of Physics: Condensed Matter 11, 6621 (1999).
- Ben-Abdallah and Biehs (2014) P. Ben-Abdallah and S.-A. Biehs, Phys. Rev. Lett. 112, 044301 (2014).
- Otey et al. (2010) C. R. Otey, W. T. Lau, and S. Fan, Phys. Rev. Lett. 104, 154301 (2010).
- Khandekar et al. (2018) C. Khandekar, R. Messina, and A. W. Rodriguez, AIP Advances 8, 055029 (2018).
- Fiorino et al. (2018b) A. Fiorino, D. Thompson, L. Zhu, R. Mittapally, S.-A. Biehs, O. Bezencenet, N. El-Bondry, S. Bansropun, P. Ben-Abdallah, E. Meyhofer, and P. Reddy, ACS Nano 12, 5774 (2018b).
- Shen et al. (2009) S. Shen, A. Narayanaswamy, and G. Chen, Nano Letters 9, 2909 (2009).
- St-Gelais et al. (2016) R. St-Gelais, L. Zhu, S. Fan, and M. Lipson, Nature Nanotechnology 11, 515 (2016).
- Song et al. (2016) B. Song, D. Thompson, A. Fiorino, Y. Ganjeh, P. Reddy, and E. Meyhofer, Nature Nanotechnology 11, 509 (2016).
- DeSutter et al. (2019) J. DeSutter, L. Tang, and M. Francoeur, Nature Nanotechnology 14, 751 (2019).
- Fiorino et al. (2018c) A. Fiorino, D. Thompson, L. Zhu, B. Song, P. Reddy, and E. Meyhofer, Nano Letters 18, 3711 (2018c).
- Kloppstech et al. (2017) K. Kloppstech, N. Könne, S.-A. Biehs, A. W. Rodriguez, L. Worbes, D. Hellmann, and A. Kittel, Nature Communications 8, 14475 (2017).
- Song et al. (2015b) B. Song, A. Fiorino, E. Meyhofer, and P. Reddy, AIP Advances 5, 053503 (2015b).
- Miller et al. (2015) O. D. Miller, S. G. Johnson, and A. W. Rodriguez, Physical Review Letters 115, 204302 (2015).
- Jin et al. (2017) W. Jin, R. Messina, and A. W. Rodriguez, Opt. Express 25, 14746 (2017).
- Biehs et al. (2012) S.-A. Biehs, M. Tschikin, and P. Ben-Abdallah, Phys. Rev. Lett. 109, 104301 (2012).
- Ben-Abdallah and Joulain (2010) P. Ben-Abdallah and K. Joulain, Phys. Rev. B 82, 121419 (2010).
- Venkataram et al. (2020) P. S. Venkataram, S. Molesky, W. Jin, and A. W. Rodriguez, Phys. Rev. Lett. 124, 013904 (2020).
- Tang et al. (2020) L. Tang, J. DeSutter, and M. Francoeur, ACS Photonics 7, 1304 (2020).
- Kralik et al. (2012) T. Kralik, P. Hanzelka, M. Zobac, V. Musilova, T. Fort, and M. Horak, Phys. Rev. Lett. 109, 224302 (2012).
- Yu and Capasso (2014) N. Yu and F. Capasso, Nature Materials 13, 139 (2014).
- Iizuka and Fan (2018) H. Iizuka and S. Fan, Phys. Rev. Lett. 120, 063901 (2018).
- Liu and Zhang (2015) X. Liu and Z. Zhang, ACS Photonics 2, 1320 (2015).
- Iizuka and Fan (2016) H. Iizuka and S. Fan, Journal of Applied Physics 120, 194301 (2016).
- Wang et al. (2009) X. J. Wang, S. Basu, and Z. M. Zhang, Journal of Physics D: Applied Physics 42, 245403 (2009).
- Nefzaoui et al. (2013) E. Nefzaoui, Y. Ezzahri, J. Drévillon, and K. Joulain, The European Physical Journal Applied Physics 63, 30902 (2013).
- Chalabi et al. (2014) H. Chalabi, E. Hasman, and M. L. Brongersma, Opt. Express 22, 30032 (2014).
- Ottens et al. (2011) R. S. Ottens, V. Quetschke, S. Wise, A. A. Alemi, R. Lundock, G. Mueller, D. H. Reitze, D. B. Tanner, and B. F. Whiting, Phys. Rev. Lett. 107, 014301 (2011).
- Joulain et al. (2005) K. Joulain, J.-P. Mulet, F. Marquier, R. Carminati, and J.-J. Greffet, Surface Science Reports 57, 59 (2005).
- Yu and Manuel (2016) P. Yu and C. Manuel, Fundamentals of semiconductors: physics and materials properties (Springer, 2016).
- Kaxiras and Joannopoulos (2019) E. Kaxiras and J. D. Joannopoulos, Quantum theory of materials (Cambridge University Press, 2019).
- Raman et al. (2013) A. Raman, W. Shin, and S. Fan, Phys. Rev. Lett. 110, 183901 (2013).
- Lyddane et al. (1941) R. H. Lyddane, R. G. Sachs, and E. Teller, Phys. Rev. 59, 673 (1941).
- Lucarini (2010) V. Lucarini, Kramers-Kronig relations in optical materials research (Springer, 2010).
- Sehmi et al. (2017) H. S. Sehmi, W. Langbein, and E. A. Muljarov, Phys. Rev. B 95, 115444 (2017).
- Shepherd (2019) R. A. Shepherd, Phys. Rev. A 99, 053822 (2019).
- Orosco and Coimbra (2018) J. Orosco and C. F. M. Coimbra, Appl. Opt. 57, 5333 (2018).
- Mutapcic et al. (2009) A. Mutapcic, S. Boyd, A. Farjadpour, S. G. Johnson, and Y. Avniel, Engineering Optimization 41, 365 (2009).
- Gustafsson and Sjöberg (2010) M. Gustafsson and D. Sjöberg, New Journal of Physics 12, 043046 (2010).
- Maier (2007) S. A. Maier, Plasmonics (Springer Science Business Media, LLC, 2007).
- Shim et al. (2020) H. Shim, Z. Kuang, and O. D. Miller, arXiv:2004.13132 (2020).
- Mehra and Rechenberg (2001) J. Mehra and H. Rechenberg, The historical development of quantum theory (Springer, 2001).
- Heald (2003) M. A. Heald, American Journal of Physics 71, 1322 (2003).
- Christensen (2019) T. Christensen, From classical to quantum plasmonics in three and two dimensions (Springer, 2019).
- Shim et al. (2019) H. Shim, L. Fan, S. G. Johnson, and O. D. Miller, Phys. Rev. X 9, 011043 (2019).
- Sanders and Manjavacas (2018) S. Sanders and A. Manjavacas, ACS Photonics 5, 2437 (2018).
- Müller et al. (2017) B. Müller, R. Incardone, M. Antezza, T. Emig, and M. Krüger, Phys. Rev. B 95, 085413 (2017).
- Cui et al. (2010) T. J. Cui, D. R. Smith, and R. Liu, Metamaterials: theory, design, and applications (Springer, 2010).
- Guo et al. (2012) Y. Guo, C. L. Cortes, S. Molesky, and Z. Jacob, Applied Physics Letters 101, 131106 (2012).
- Ilic et al. (2012) O. Ilic, M. Jablan, J. D. Joannopoulos, I. Celanovic, H. Buljan, and M. Soljačić, Phys. Rev. B 85, 155422 (2012).
- Rakić et al. (1998) A. D. Rakić, A. B. Djurišić, J. M. Elazar, and M. L. Majewski, Appl. Opt. 37, 5271 (1998).
- Cleary et al. (2012) J. W. Cleary, M. Snure, K. D. Leedy, D. C. Look, K. Eyink, and A. Tiwari, in Proc. SPIE 8545, Optical Materials and Biomaterials in Security and Defence Systems Technology IX (2012).
- Sanjurjo et al. (1983) J. A. Sanjurjo, E. López-Cruz, P. Vogl, and M. Cardona, Phys. Rev. B 28, 4579 (1983).
- Fu and Zhang (2006) C. Fu and Z. Zhang, International Journal of Heat and Mass Transfer 49, 1703 (2006).
- Chochol et al. (2017) J. Chochol, K. Postava, M. Čada, M. Vanwolleghem, M. Mičica, L. Halagačka, J.-F. Lampin, and J. Pištora, Journal of the European Optical Society-Rapid Publications 13, 13 (2017).
- Law et al. (2013) S. Law, L. Yu, A. Rosenberg, and D. Wasserman, Nano Letters 13, 4569 (2013).
- Law et al. (2014) S. Law, R. Liu, and D. Wasserman, Journal of Vacuum Science & Technology B 32, 052601 (2014).
- Sachet et al. (2015) E. Sachet, C. T. Shelton, J. S. Harris, B. E. Gaddy, D. L. Irving, S. Curtarolo, B. F. Donovan, P. E. Hopkins, P. A. Sharma, A. L. Sharma, J. Ihlefeld, S. Franzen, and J.-P. Maria, Nature Materials 14, 414 (2015).
- Dai et al. (2014) S. Dai, Z. Fei, Q. Ma, A. S. Rodin, M. Wagner, A. S. McLeod, M. K. Liu, W. Gannett, W. Regan, K. Watanabe, T. Taniguchi, M. Thiemens, G. Dominguez, A. H. C. Neto, A. Zettl, F. Keilmann, P. Jarillo-Herrero, M. M. Fogler, and D. N. Basov, Science 343, 1125 (2014).
- Li et al. (2014) W. Li, A. G. Birdwell, M. Amani, R. A. Burke, X. Ling, Y.-H. Lee, X. Liang, L. Peng, C. A. Richter, J. Kong, D. J. Gundlach, and N. V. Nguyen, Phys. Rev. B 90, 195434 (2014).
- Low et al. (2014) T. Low, A. S. Rodin, A. Carvalho, Y. Jiang, H. Wang, F. Xia, and A. H. Castro Neto, Phys. Rev. B 90, 075434 (2014).
- Jablan et al. (2009) M. Jablan, H. Buljan, and M. Soljačić, Phys. Rev. B 80, 245435 (2009).
- Verma et al. (2017) S. Verma, A. Mawrie, and T. K. Ghosh, Phys. Rev. B 96, 155418 (2017).
- Maniyara et al. (2019) R. A. Maniyara, D. Rodrigo, R. Yu, J. Canet-Ferrer, D. S. Ghosh, R. Yongsunthon, D. E. Baker, A. Rezikyan, F. J. García de Abajo, and V. Pruneri, Nature Photonics 13, 328 (2019).
- Moresco et al. (1999) F. Moresco, M. Rocca, T. Hildebrandt, and M. Henzler, Phys. Rev. Lett. 83, 2238 (1999).
- Rivera et al. (2019) N. Rivera, T. Christensen, and P. Narang, Nano Letters 19, 2653–2660 (2019).
- Xia et al. (2014) F. Xia, H. Wang, D. Xiao, M. Dubey, and A. Ramasubramaniam, Nature Photonics 8, 899 (2014).
- Mak et al. (2012) K. F. Mak, L. Ju, F. Wang, and T. F. Heinz, Solid State Communications 152, 1341 (2012).
- Ben-Abdallah et al. (2009) P. Ben-Abdallah, K. Joulain, J. Drevillon, and G. Domingues, Journal of Applied Physics 106, 044306 (2009).
- Kitamura et al. (2007) R. Kitamura, L. Pilon, and M. Jonasz, Appl. Opt. 46, 8118 (2007).
- Falkovsky (2008) L. A. Falkovsky, Journal of Physics: Conference Series 129, 012004 (2008).
- Mak et al. (2008) K. F. Mak, M. Y. Sfeir, Y. Wu, C. H. Lui, J. A. Misewich, and T. F. Heinz, Phys. Rev. Lett. 101, 196405 (2008).
- Liu et al. (2019) Y. Liu, Y. Huang, and X. Duan, Nature 567, 323 (2019).
- Bae et al. (2019) S.-H. Bae, H. Kum, W. Kong, Y. Kim, C. Choi, B. Lee, P. Lin, Y. Park, and J. Kim, Nature Materials 18, 550 (2019).
- Ito et al. (2017) K. Ito, K. Nishikawa, A. Miura, H. Toshiyoshi, and H. Iizuka, Nano Letters 17, 4347 (2017).
- Papadakis et al. (2019) G. T. Papadakis, B. Zhao, S. Buddhiraju, and S. Fan, ACS Photonics 6, 709 (2019).
- Ilic et al. (2018) O. Ilic, N. H. Thomas, T. Christensen, M. C. Sherrott, M. Soljačić, A. J. Minnich, O. D. Miller, and H. A. Atwater, ACS Nano 12, 2474 (2018).
- Yu et al. (2017) S. Yu, X. Wu, Y. Wang, X. Guo, and L. Tong, Advanced Materials 29, 1606128 (2017).
- Zhao et al. (2015) H. Zhao, Y. Wang, A. Capretti, L. D. Negro, and J. Klamkin, IEEE Journal of Selected Topics in Quantum Electronics 21, 192 (2015).
- Vasudev et al. (2013) A. P. Vasudev, J.-H. Kang, J. Park, X. Liu, and M. L. Brongersma, Opt. Express 21, 26387 (2013).
- Xiong et al. (2012) C. Xiong, W. H. P. Pernice, and H. X. Tang, Nano Letters 12, 3562 (2012).
- Orton and Foxon (1998) J. W. Orton and C. T. Foxon, Reports on Progress in Physics 61, 1 (1998).
- Miller (2012) O. D. Miller, Photonic Design: From Fundamental Solar Cell Physics to Computational Inverse Design, Ph.D. thesis, University of California, Berkeley (2012).
- Molesky et al. (2018) S. Molesky, Z. Lin, A. Y. Piggott, W. Jin, J. Vucković, and A. W. Rodriguez, Nature Photonics 12, 659 (2018).
- Yao et al. (2020) W. Yao, M. Benzaouia, O. D. Miller, and S. G. Johnson, arXiv:2005.05374 (2020).
- Chung and Miller (2020) H. Chung and O. D. Miller, Opt. Express 28, 6945 (2020).
- Jin et al. (2020) W. Jin, W. Li, M. Orenstein, and S. Fan, arXiv:2005.04840 (2020).
- Miller et al. (2016) O. D. Miller, A. G. Polimeridis, M. T. H. Reid, C. W. Hsu, B. G. DeLacy, J. D. Joannopoulos, M. Soljačić, and S. G. Johnson, Opt. Express 24, 3329 (2016).
- Kuang et al. (2020) Z. Kuang, L. Zhang, and O. D. Miller, arXiv:2002.00521 (2020).
- Angeris et al. (2019) G. Angeris, J. Vučković, and S. P. Boyd, ACS Photonics 6, 1232 (2019).