We have developed the Physics Inventory of Quantitative Literacy (PIQL) as a tool to measure students’ quantitative literacy in the context of introductory physics topics. We present the results from various quantitative analyses used to establish the validity of both the individual items and the PIQL as a whole. We show how examining the results from classical test theory analyses, factor analysis, and item response curves informed decisions regarding the inclusion, removal, or modification of items. We also discuss how the choice to include multiple-choice/multiple-response items has informed both our choices for analyses and the interpretations of their results. We are confident that the most recent version of the PIQL is a valid and reliable instrument for measuring students’ physics quantitative literacy in calculus-based introductory physics courses at our primary research site. More data are needed to establish its validity for use at other institutions and in other courses.
Toward a valid instrument for measuring physics quantitative literacy
I Introduction
Physics Quantitative Literacy (PQL) is defined as the interconnected skills, attitudes, and habits of mind that together support the sophisticated use of elementary mathematics in the context of physics Thompson (2010); Ojose (2011); White Brahmia et al. (2020a); Olsho et al. (2019). Developing PQL is a desired outcome of physics instruction, but valid measures of reasoning about quantities and their relationships in physics contexts are absent from research-based assessment instruments in introductory physics. We have developed the Physics Inventory of Quantitative Literacy (PIQL) to address this need Olsho et al. (2019). The PIQL is a reasoning inventory that probes the quantification typically used in introductory physics that has a potential impact analogous to the early concept inventories in physics education research that catalyzed curriculum development efforts by raising awareness of broad instructional goals that are not being met Hake (1998); Von Korff et al. (2016); Madsen et al. (2017).
In introductory physics, PQL involves using simple mathematics in sophisticated ways. Reasoning about ratios and proportions, covariation, and signed quantities/negativity are at the heart of quantification in introductory physics Thompson et al. (2014); Thompson (2010); Thompson and Saldanha (2003). The PIQL was designed based on these three facets of quantification, with many items being drawn from previous research in mathematics and physics education Carlson et al. (2010); Boudreaux et al. (2015); Brahmia (2015); Brahmia et al. (2016a, b); Brahmia and Boudreaux (2016, 2017).
(a) (b)
Over the past two years we have engaged in an iterative process of data collection and analysis, item development, and test revision to establish the validity of the PIQL for use in calculus-based introductory physics courses. In the following sections we discuss the methods we used to analyze the data, how we interpreted the results, and the decisions we made to improve the PIQL. Our focus is on using a variety of quantitative measures to gain a holistic view of the PIQL to optimize our ability to measure student reasoning. We present the results from each analysis individually, but our decisions to modify individual items and the PIQL as a whole were based on the collective results from all of them.
II Inventory Development and Data Sources
The prototype version of the PIQL focused primarily on measuring students reasoning about ratios and proportions Brahmia (2015); Brahmia et al. (2016a, b) and signed quantities/negativity Brahmia and Boudreaux (2016, 2017); White Brahmia et al. (2018, 2019). This 18-item protoPIQL also included two items on covariation taken (with permission) from the Precalculus Conceptual Assessment (PCA) Carlson et al. (2010). Revisions were made to improve the validity and reliability of the PIQL, reduce redundancies, and ensure that all three facets of PQL were represented. Later versions of the PIQL include 20 or 21 items.
Data for this study were collected at the beginning of each term (before instruction) in three calculus-based introductory physics courses at a large public research university in the northwestern US. Previous results have shown that overall score distributions on the PIQL are not significantly different in the three courses Smith et al. (2018, 2019a), and this trend has persisted throughout all versions of the PIQL; therefore, we have combined all data collected in each term for this study. Due to our iterative revisions, the items on the PIQL in each of the six data sets are slightly different; we label the data sets by their version of the PIQL: protoPIQL, v1.0, v1.1, v2.0, v2.1, and v2.2. Data were collected from approximately 1000 students for each version.
III Quantitative validation using Classical Test Theory
We used various quantitative analyses to measure the validity and reliability of each version of the PIQL. Using Classical Test Theory (CTT) we calculated the difficulty and discrimination parameters for each item; we want to have a wide range of difficulty values with most items between 0.2 and 0.8 (representing the fraction of students who answer each item correctly), and we want most discrimination values to be above 0.3 (representing the difference in CTT difficulty between the top and bottom 27% of students) Wiersma and Jurs (1990). We also calculated Cronbach’s as a measure of reliability; a value of at least 0.7 indicates that the test is reliable for measuring the performance of groups of students on a single-construct test, and a value of at least 0.8 indicates that the test is reliable for measuring the performance of individual students Doran (1980).
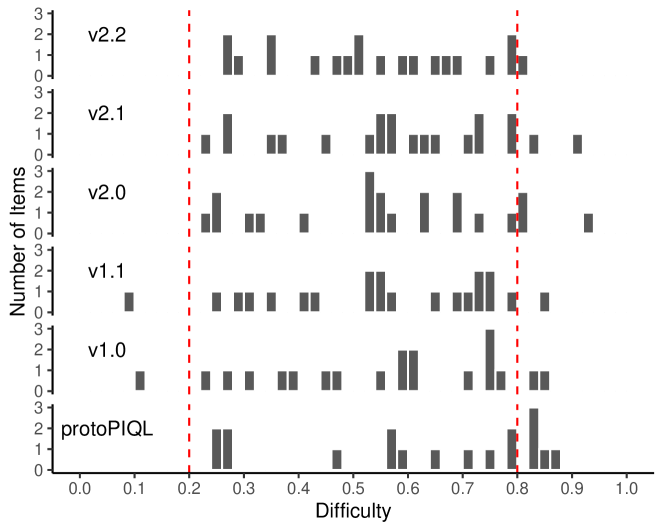
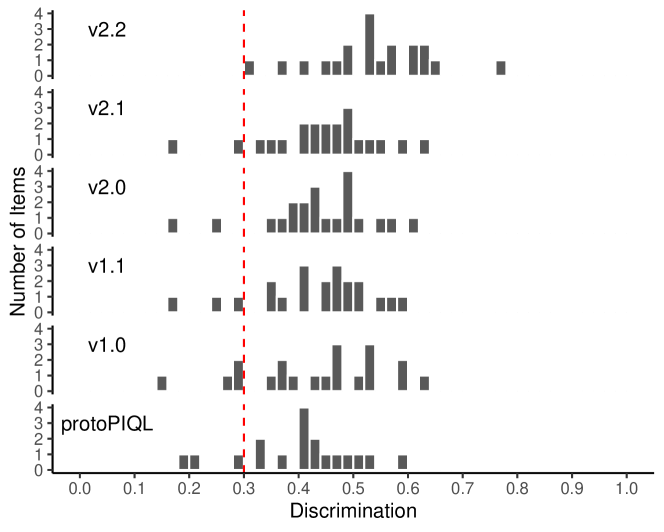
Figure 1 shows the distributions of the CTT difficulty and discrimination parameters for each version of the PIQL. Five of the items in the protoPIQL were considered too easy (difficulty above 0.8), and three items had discrimination values below 0.3; moreover, there was a gap in the middle of the difficulty distribution with only one item having a difficulty in the range between 0.3 and 0.55. Due to these results, we chose to use only nine of these items in subsequent versions of the PIQL, with one of them being periodically modified. For PIQL v1.0, 11 items were added based on previous research on all three of our PQL facets Brahmia (2015); Brahmia et al. (2016a, b); Brahmia and Boudreaux (2016, 2017); White Brahmia et al. (2018, 2019); Carlson et al. (2010), which resulted in a much broader distribution of CTT difficulty values. One additional proportional reasoning item was added to PIQL v1.1; for PIQL v2.0 two covariation items were replaced by newly developed items based on research in mathematics education Moore et al. (2013); Hobson and Moore (2017); Paoletti and Moore (2017); two items were slightly modified for v2.1; one item was removed for PIQL v2.2 due to consistently high difficulty and low discrimintation parameters.
Taken together, these revisions have resulted in a 20-item instrument with a broad range of difficulty values (only one of which is above the desired upper limit of 0.8), and all items having discrimination values above 0.3. Six of the 20 having large discrimination (above 0.6), meaning that high-scoring students are much more likely to answer these questions correctly than low-scoring students. Additionally, Cronbach’s has also increased: on the protoPIQL, which does not meet the threshold for measuring either groups of students or individuals; however, on PIQL v2.2, which meets both thresholds. The distribution of difficulty values for PIQL v2.2 is a little higher than we think would be ideal (average of 0.54), but we have chosen to keep some of the easier items because we recognize that the students in our data set may have had more prior exposure to mathematics and physics instruction than is typical of the introductory physics student population Kanim and Cid (2017). We consider the changes in parameter values to indicate that we have created a valid and reliable inventory for measuring PQL for students in calculus-based introductory physics courses.
IV Analyzing Data from Multiple-Choice/ Multiple-Response Items
We consider PQL to be a conceptual blend between physics concepts and mathematical reasoning Fauconnier and Turner (2002); White Brahmia et al. (2020b). In order to measure the complexity of ideas that students bring from both of these input spaces, we have chosen to include some multiple-choice/multiple-response (MCMR) items in which students are instructed to “select all statements that must be true” from a given list, and to “choose all that apply” (emphasis in the original text). The MCMR item format has the potential to reveal more information about students’ thinking than standard single-response items, but it also poses problems with data analysis, as typical analyses of multiple-choice tests (such as CTT) assume single-response items.
For MCMR items, dichotomous scoring methods require a student to choose all correct responses and only correct responses to be considered correct. For example, item 18 on PIQL v2.2 has two correct answer choices: D and G. In a dichotomous scoring scheme a student who picks only answer D would be scored the same way as a student who chooses answers E and F (incorrect). This ignores the nuance and complexity of students’ response patterns within (and between) items. As such, the CTT results for these items are not entirely representative of students’ responses.
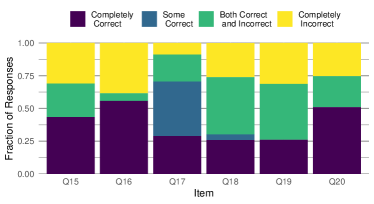
In an effort to move beyond the constraints of dichotomous scoring for MCMR items, we have developed a four-level scoring scale in which we categorize students’ responses as Completely Correct, Some Correct (if at least one but not all correct response choices are chosen), Both Correct and Incorrect (if at least one correct and one incorrect response choices are chosen), and Completely Incorrect Smith et al. (2018, 2019a). Figure 2 shows the results of using this four-level scoring scale to categorize student responses to the six MCMR items on PIQL v2.2. The dark purple Completely Correct bars are equivalent to CTT difficulty; however, Fig. 2 also shows us that at least 60% of students provide at least one correct response to each item (Completely Correct, Some Correct, and Both Correct and Incorrect combined), although this is often coupled with an incorrect response (6%–44% of students categorized as Both Correct and Incorrect). This tells a very different story than the CTT results, which group the Some Correct, Both, and Completely Incorrect categories together into a broad Incorrect category.
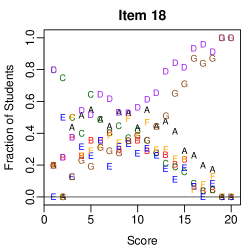
These four-level scoring results also reveal differences hidden by dichotomous scoring. For example, on PIQL v2.2 two items (Q17 and Q18) have more than one correct answer choice. Figure 2 shows that approximately the same number of students answers these items completely correctly, but Q17 has a much higher fraction of students in the Some Correct category. Students are much more likely to include one of the incorrect responses to Q18 than they are for Q17. The items with multiple correct answers also present a new question: is it better for a student to choose Some Correct answers or Both Correct and Incorrect answers? The answer may depend on the specifics of each item and the associated answer choices.Future work will include analyzing data from MCMR items to develop a more sophisticated scoring scheme.
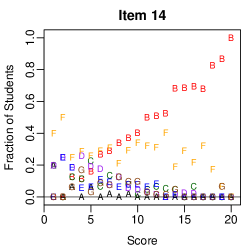
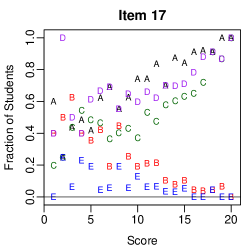
To further examine the responses students give to individual PIQL items we use Item Response Curves (IRCs), which show the fraction of students who choose each answer choice as a function of the students’ overall score on the PIQL Morris et al. (2006, 2012); Walter and Morris (2016); Ishimoto et al. (2017). IRCs have been used with single-response tests to rank incorrect responses and to compare different student populations with regard to both correct and incorrect answer choices Walter and Morris (2016); Ishimoto et al. (2017). We find IRCs particularly helpful for examining student responses to items with multiple correct answers.
Figure 3 shows three IRCs with different behavior. Item 14 is a single-response item with correct answer B. Even fairly high-scoring students persist in choosing a particular incorrect answer F. Item 17 has three correct responses (A, C, D), with A being the most commonly chosen, and C being the least commonly chosen. Few students at any score level choose E, and fewer than 20% of students who score above average (10.8) choose either incorrect response (B, E). Item 18 is particularly interesting in that all responses are chosen by 20%–60% of students in the middle score range (8-12). This supports the results from Fig. 2 that students are likely to choose both a correct and an incorrect response to Q18.
Both the four-level scoring scheme and the IRCs provide more information than traditional CTT analyses and allow us to see patterns in students’ responses that go beyond typical dichotomous scoring methods. We have used these to gain a deeper qualitative picture of student performance on each PIQL item, and these have been very valuable for deciding which items to keep, eliminate, or modify.
V Exploring the substructure of the PIQL
The PIQL was initially developed to probe student reasoning about ratios and proportions, covariation, and signed quantities/negativity. In the language of factor analysis, this would imply that the PIQL was originally intended to have a three-factor structure. Since the intended factor structure of the PIQL was well understood at the beginning of its development, confirmatory factor analysis (CFA) was used at the onset, in conjunction with exploratory factor analysis (EFA). CFA is a model-driven statistical method whose goal is to identify the adequacy of a proposed factor model to response data from the instrument being analyzed Brown (2015). EFA is a data-driven statistical method whose goal is to uncover the underlying dependencies between observed variables Lawley and Maxwell (1963). For all versions of the PIQL, CFA determined that the proposed, facet-driven, factor model was not an adequate representation of the PIQL’s latent trait structure Smith et al. (2019b). The target threshold for CFA is to have goodness-of-fit statistics such as the Confirmatory Fit Index (CFI) and Tucker-Lewis Fit Index (TLI) above a threshold of 0.9 Eaton and Willoughby (2018). For all versions of the PIQL the CFI and TLI were below 0.8 when using the facet-driven factor model.
Given that the CFA results do not fit with the proposed mode, we moved on to a more in-depth investigation using EFA. The goal of using EFA was to determine if the PIQL has any substructure, and how closely any substructure aligns with the three facets of PQL. The results from parallel analysis suggested that 3–4 meaningful factors could be extracted for the earlier versions of the PIQL (protoPIQL, v1.0, and v1.1) Weng and Cheng (2005); however, when examining these structures, they were found to be inconsistent with the originally intended factors, based on the three facets of PQL Smith et al. (2019b). During this initial development of the PIQL, EFA models of versions v1.0 and v1.1 each contained a factor that only contained the same two items. These two items were found to have item loadings on the same factor of above 0.8, compared to the next highest loading value of approximately 0.5. These items’ loadings remained essentially the same when they appeared sequentially on v1.0 and when they were separated and placed onto different pages of the instrument in v1.1. This suggested these items were redundant, which lead to the removal of one of the items from the PIQL in future iterations.
Analyses of the most recent versions of the PIQL (v2.0, v2.1, and v2.2) suggest the instrument is now unidimensional, with no strong substructure amongst the items. Results from EFA parallel analysis suggested that these versions of the PIQL could be adequately described by a single factor. Additional evidence to support this conclusion was obtained by performing CFA on v2.1 and v2.2 of the PIQL using a unidimensional model, with measures of goodness-of-fit suggesting that the unidimensional model adequately fit the student response data. Specifically, the CFI and TLI were above 0.93 for both versions under CFA using a unidimensional model. Additionally, the standardized root mean square of the residuals was below 0.04, and the root mean square of the error of approximation was below 0.04 Eaton and Willoughby (2018). This suggests that removing one of the redundant items identified in v1.0 and v1.1, resulted in the collapse of the PIQL’s multiple factor structure into one that is unidimensional. This may also have been affected by replacing two of the covariation items from v1.1.
A major confounding feature of these results is that the factor loadings were determined based on dichotomously scored items. As shown in Fig. 2, up to 65% of students who choose correct responses to MCMR items may be scored as incorrect because either they didn’t choose all of the correct responses or they also chose an incorrect response. As such, the factor loadings may not accurately capture the relationships between students’ responses for cases involving MCMR items.
To preserve the nuance and complexity of students’ response patterns within (and between) items we used module analysis for multiple-choice responses to examine the network of student responses to PIQL items Brewe et al. (2016). Module analysis uses community detection algorithms to identify modules (a.k.a. communities, etc.) within networks of responses to multiple-choice items. We chose to analyze a network of only correct responses to PIQL items. The benefit of this method is that we can examine the patterns that arise from students’ selections of each individual correct response, which preserves some of the complexity of MCMR items.
Earlier module analyses of v1.0 and v1.1 using various community detection algorithms on full data sets suggested that there was some substructure in the PIQL. Again, these results did not agree with the three facets that the PIQL was intended to measure and also did not align well with the results of EFA Smith et al. (2019b, 2020). Recent developments in the application of module analysis within PER have enabled a deeper and more refined analysis of the module structure of the PIQL Wells et al. (2019). Using Modified Module Analysis (MMA) on the final two versions of the PIQL, with a locally adaptive network sparsification (LANS) in place of a global cutoff sparsification, resulted in no discernible substructure between the items on the instrument Wells et al. (2019); Foti et al. (2011). This corroborates the conclusions of EFA and CFA that the PIQL is not measuring multiple constructions and is thus a unidimensional instrument.
VI Conclusions
Our goal is to develop a valid and reliable instrument to measure PQL for students in calculus-based introductory physics courses. Results from classical test theory show that after several revisions the items on the PIQL have a broad range of difficulty values, and all items have acceptable levels of discrimination. The reliability of the PIQL has been established with Cronbach’s , which meets the typically accepted criterion for measuring both properties of groups and properties of individuals.
Results from exploratory and confirmatory factor analysis and modified module analysis show that the PIQL is a unidimensional instrument that measures a single construct. We interpret this construct as being Physics Quantitative Literacy. These results show that student responses to PIQL items do not separate cleanly along the lines of ratios and proportions, covariation, and signed quantities/negativity, suggesting that these three facets of PQL (which are discernible to experts) may develop simultaneously in students.
We have supplemented rigorous psychometric analyses with four-level scoring methods for MCMR items and IRCs, which provide additional information about students’ choices of both correct and incorrect responses. These analyses played a vital role in informing our decisions when revising the PIQL. Future work will include developing more sophisticated analyses that can include the nuance of MCMR data into CTT-style analyses.
Additional manuscripts will detail the work we have done to qualitatively validate both individual PIQL items and the inventory as a whole using interviews of both students and experts. As a result of all our analyses, we are comfortable asserting that the PIQL is a valid and reliable instrument for use in calculus-based introductory physics courses at our primary research site. Our next steps will include establishing its validity in broader contexts by collecting data from students in calculus-based introductory courses at other institutions, as well as from students in algebra-based and conceptual physics courses, in order to increase the potential of the PIQL to catalyze meaningful curriculum development efforts.
Acknowledgements.
This work is supported by the National Science Foundation under awards DUE-1832836, DUE-1832880, DUE-1833050, and DGE-1762114.References
- Thompson (2010) Patrick W Thompson, “Quantitative reasoning and mathematical modeling,” New perspectives and directions for collaborative research in mathematics education , 33 (2010).
- Ojose (2011) Bobby Ojose, “Mathematics Literacy: Are We Able To Put The Mathematics We Learn Into Everyday Use?” Journal of Mathematics Education 4, 89–100 (2011).
- White Brahmia et al. (2020a) Suzanne White Brahmia, Alexis Olsho, Trevor I Smith, and Andrew Boudreaux, “Framework for the natures of negativity in introductory physics,” Phys. Rev. Phys. Educ. Res. 16, 010120 (2020a).
- Olsho et al. (2019) Alexis Olsho, Suzanne White Brahmia, Andrew Boudreaux, and Trevor I Smith, “The physics inventory of quantitative reasoning: Assessing student reasoning about sign,” in Proceedings of the 22nd Annual Conference on Research in Undergraduate Mathematics Education., edited by A Weinberg, D Moore-Russo, H Soto, and M Wawro (Oklahoma City, OK, 2019) pp. 992–997.
- Hake (1998) Richard R Hake, “Interactive-engagement versus traditional methods: A six-thousand-student survey of mechanics test data for introductory physics courses,” American Journal of Physics 66, 64–74 (1998).
- Von Korff et al. (2016) Joshua Von Korff, Benjamin Archibeque, K Alison Gomez, Sarah B Mckagan, Eleanor C Sayre, Edward W Schenk, Chase Shepherd, and Lane Sorell, “Secondary analysis of teaching methods in introductory physics: A 50 k-student study,” American Journal of Physics 84, 969–974 (2016).
- Madsen et al. (2017) Adrian Madsen, Sarah B McKagan, and Eleanor C Sayre, “Resource Letter {RBAI}-1: Research-Based Assessment Instruments in Physics and Astronomy,” American Journal of Physics 85, 245–264 (2017).
- Thompson et al. (2014) Patrick W Thompson, Marilyn P Carlson, Cameron Byerley, and Neil Hatfield, “Schemes for Thinking with Magnitudes: A Hypothesis about Foundational Reasoning Abilities in Algebra,” in Epistemic Algebraic Students: Emerging Models of Students’ Algebraic Knowing Papers from an Invitational Conference (2014) p. 1.
- Thompson and Saldanha (2003) Patrick W Thompson and L Saldanha, “Fractions and multiplicative reasoning,” in Research companion to Principles and Standards for School Mathematics, edited by Jeremy Kilpatrick, W. Gary Martin, and Deborah Schifter (National Council of Teachers of Mathematics, 2003) Chap. 7, pp. 95–113.
- Carlson et al. (2010) Marilyn Carlson, Michael Oehrtman, and Nicole Engelke, “The precalculus concept assessment: A tool for assessing students’ reasoning abilities and understandings,” Cognition and Instruction 28, 113–145 (2010).
- Boudreaux et al. (2015) Andrew Boudreaux, Stephen Kanim, and Suzanne Brahmia, “Student facility with ratio and proportion: Mapping the reasoning space in introductory physics,” arXiv preprint arXiv:1511.08960 (2015).
- Brahmia (2015) S Brahmia, “Developing expert mathematization in the introductory physics course: an impedance mismatch,” in Proceedings of 2nd International Conference On Research, Implementation And Education Of Mathematics And Sciences (2nd ICRIEMS) (2015).
- Brahmia et al. (2016a) S Brahmia, A Boudreaux, and S. E. Kanim, “Obstacles to Mathematization in Introductory Physics,” ArXiv e-prints (2016a).
- Brahmia et al. (2016b) Suzanne Brahmia, Andrew Boudreaux, and Stephen E Kanim, “Developing Mathematical Creativity with Physics Invention Tasks,” arXiv e-prints , arXiv:1602.02033 (2016b).
- Brahmia and Boudreaux (2016) Suzanne S Brahmia and Andrew Boudreaux, “Exploring student understanding of negative quantity in introductory physics contexts,” in Proceedings of the 19th Annual Conference of RUME (2016) p. 79.
- Brahmia and Boudreaux (2017) Suzanne Brahmia and Andrew Boudreaux, “Signed Quantities: Mathematics Based Majors Struggle to Make Meaning,” in Proceedings of the 20th Annual Conference on Research in Undergraduate Mathematics Education, The Special Interest Group of the Mathematical Association of Americ, edited by Aaron Weinberg, Chris Rasmussen, Jeffrey Rabin, Megan Wawro, and Stacy Brown (San Diego, CA, 2017).
- White Brahmia et al. (2018) Suzanne White Brahmia, Alexis Olsho, Trevor I Smith, and Andrew Boudreaux, “NoNIP: Natures of Negativity in Introductory Physics,” in Physics Education Research Conference 2018, PER Conference, edited by Adrienne Traxler, Ying Cao, and Steven Wolf (Washington, DC, 2018).
- White Brahmia et al. (2019) Suzanne White Brahmia, Alexis Olsho, Trevor I Smith, and Andrew Boudreaux, “A framework for the natures of negativity in introductory physics,” in Proceedings of the 22nd Annual Conference on Research in Undergraduate Mathematics Education., edited by A Weinberg, D Moore-Russo, H Soto, and M Wawro (Oklahoma City, OK, 2019) pp. 68–75.
- Smith et al. (2018) Trevor I Smith, Suzanne W Brahmia, Alexis Olsho, Andrew Boudreaux, Philip Eaton, Paul J Kelly, Kyle J Louis, Mitchell A Nussenbaum, and Louis J Remy, “Developing a reasoning inventory for measuring physics quantitative literacy,” arXiv preprint arXiv:1901.03351 (2018).
- Smith et al. (2019a) Trevor I Smith, Suzanne White Brahmia, Alexis Olsho, and Andrew Boudreaux, “Developing a reasoning inventory for measuring physics quantitative literacy,” in Proceedings of the 22nd Annual Conference on Research in Undergraduate Mathematics Education., edited by A Weinberg, D Moore-Russo, H Soto, and M Wawro (Oklahoma City, OK, 2019) pp. 1181–1182.
- Wiersma and Jurs (1990) William Wiersma and Stephen G Jurs, Educational measurement and testing, 2nd ed. (Allyn & Bacon, 1990).
- Doran (1980) Rodney L Doran, Basic Measurement and Evaluation of Science Instruction. (National Science Teachers Association, 1980).
- Moore et al. (2013) Kevin C Moore, Teo Paoletti, and Stacy Musgrave, “Covariational reasoning and invariance among coordinate systems,” Journal of Mathematical Behavior 32, 461–473 (2013).
- Hobson and Moore (2017) Natalie L F Hobson and Kevin C Moore, “Exploring Experts’ Covariational Reasoning,” in 20th Annual Conference on Research in Undergraduate Mathematics Education (Moore & Thompson, 2017) pp. 664–672.
- Paoletti and Moore (2017) Teo Paoletti and Kevin C Moore, “The parametric nature of two students’ covariational reasoning,” Journal of Mathematical Behavior 48, 137–151 (2017).
- Kanim and Cid (2017) Stephen Kanim and Ximena C Cid, “The demographics of physics education research,” arXiv preprint arXiv:1710.02598 (2017).
- Fauconnier and Turner (2002) Gilles Fauconnier and Mark Turner, The Way We Think: Conceptual Blending and the Mind’s Hidden Complexities (Basic Books, New York, 2002).
- White Brahmia et al. (2020b) Suzanne White Brahmia, Alexis Olsho, Andrew Boudreaux, Trevor I. Smith, and Charlotte Zimmerman, “A Conceptual Blend Analysis of Physics Quantitative Literacy Reasoning Inventory Items,” in Proceedings of the 23rd Annual Conference on Research in Undergraduate Mathematics Education (accepted for publication) (2020).
- Morris et al. (2006) Gary A Morris, Lee Branum-Martin, Nathan Harshman, Stephen D Baker, Eric Mazur, Suvendra Dutta, Taha Mzoughi, and Veronica McCauley, “Testing the test: Item response curves and test quality,” American Journal of Physics 74, 449–453 (2006).
- Morris et al. (2012) Gary A Morris, Nathan Harshman, Lee Branum-Martin, Eric Mazur, Taha Mzoughi, and Stephen D Baker, “An item response curves analysis of the Force Concept Inventory,” American Journal of Physics 80, 825–831 (2012).
- Walter and Morris (2016) Paul J Walter and Gary Morris, “Assessing Student Learning and Improving Instruction with Transition Matrices,” in Physics Education Research Conference 2016, PER Conference, edited by D L Jones, L Ding, and A Traxler (Sacramento, CA, 2016) pp. 376–379.
- Ishimoto et al. (2017) Michi Ishimoto, Glen Davenport, and Michael C Wittmann, “Use of item response curves of the Force and Motion Conceptual Evaluation to compare Japanese and American students’ views on force and motion,” Phys. Rev. Phys. Educ. Res. 13, 20135 (2017).
- Brown (2015) Timothy A Brown, Confirmatory Factor Analysis for Applied Research, 2nd ed. (The Guilford Press, 2015) pp. 72–75.
- Lawley and Maxwell (1963) D N Lawley and A E Maxwell, Factor analysis as a statistical method (Butterworths London, 1963) pp. viii, 117 p.
- Smith et al. (2019b) Trevor I. Smith, Philip Eaton, Suzanne White Brahmia, Alexis Olsho, Andrew Boudreaux, Chris DePalma, Victor LaSasso, Scott Straguzzi, and Christopher Whitener, “Using psychometric tools as a window into students’ quantitative reasoning in introductory physics,” in Physics Education Research Conference 2019, PER Conference, edited by Ying Cao, Steven Wolf, and Michael Bennett (Provo, UT, 2019).
- Eaton and Willoughby (2018) Philip Eaton and Shannon D Willoughby, “Confirmatory factor analysis applied to the Force Concept Inventory,” Phys. Rev. Phys. Educ. Res. 14, 10124 (2018).
- Weng and Cheng (2005) Li-Jen Weng and Chung-Ping Cheng, “Parallel Analysis with Unidimensional Binary Data,” Educational and Psychological Measurement 65, 697–716 (2005).
- Brewe et al. (2016) Eric Brewe, Jesper Bruun, and Ian G Bearden, “Using module analysis for multiple choice responses: A new method applied to Force Concept Inventory data,” Phys. Rev. Phys. Educ. Res. 12, 20131 (2016).
- Smith et al. (2020) Trevor I. Smith, Suzanne White Brahmia, Alexis Olsho, and Andrew Boudreaux, “Physics Students’ Implicit Connections Between Mathematical Ideas,” in Proceedings of the 23rd Annual Conference on Research in Undergraduate Mathematics Education (accepted for publication) (2020).
- Wells et al. (2019) James Wells, Rachel Henderson, John Stewart, Gay Stewart, Jie Yang, and Adrienne Traxler, “Exploring the Structure of Misconceptions in the Force Concept Inventory with Modified Module Analysis,” arXiv e-prints , arXiv:1905.06176 (2019).
- Foti et al. (2011) Nicholas J Foti, James M Hughes, and Daniel N Rockmore, “Nonparametric Sparsification of Complex Multiscale Networks,” PLOS ONE 6, 1–10 (2011).