X-ray Spectroscopy of the -ray Brightest Nova V906 Car (ASASSN-18fv)
Abstract
Shocks in -ray emitting classical novae are expected to produce bright thermal and non-thermal X-rays. We test this prediction with simultaneous NuSTAR and Fermi/LAT observations of nova V906 Car, which exhibited the brightest GeV -ray emission to date. The nova is detected in hard X-rays while it is still -ray bright, but contrary to simple theoretical expectations, the detected 3.5–78 keV emission of V906 Car is much weaker than the simultaneously observed MeV emission. No non-thermal X-ray emission is detected, and our deep limits imply that the -rays are likely hadronic. After correcting for substantial absorption ( cm-2), the thermal X-ray luminosity (from a 9 keV optically-thin plasma) is just % of the -ray luminosity. We consider possible explanations for the low thermal X-ray luminosity, including the X-rays being suppressed by corrugated, radiative shock fronts or the X-rays from the -ray producing shock are hidden behind an even larger absorbing column ( cm-2). Adding XMM-Newton and Swift/XRT observations to our analysis, we find that the evolution of the intrinsic X-ray absorption requires the nova shell to be expelled 24 days after the outburst onset. The X-ray spectra show that the ejecta are enhanced in nitrogen and oxygen, and the nova occurred on the surface of a CO-type white dwarf. We see no indication of a distinct super-soft phase in the X-ray lightcurve, which, after considering the absorption effects, may point to a low mass of the white dwarf hosting the nova.
keywords:
stars: novae – stars: white dwarfs – stars: individual: V906 Car1 Introduction
1.1 X-ray emission of classical novae
A nova explosion is powered by nuclear fusion that ignites at the bottom of a hydrogen-rich shell on the surface of an accreting white dwarf in a binary star system (Bode & Evans, 2008; Starrfield et al., 2016). Recent summaries of their observational appearance across the electromagnetic spectrum were presented by Poggiani (2018) and Della Valle & Izzo (2020). Specifically, the X-ray emission is produced during the following stages of a nova event (Mukai, 2017; Hernanz & Sala, 2010; Krautter, 2008):
-
1.
A soft X-ray flash should be produced by the optically-thick ejecta (i.e., “fireball") during the first hours of explosion, before the fireball expands and cools sufficiently to shift the peak of its emission from X-ray to UV and optical bands (Schwarz et al., 2001; Krautter, 2002; Ness et al., 2007). So far, the attempts to observe the fireball X-ray emission have not resulted in an unambiguous detection (Morii et al., 2016; Kato et al., 2016). Morii et al. (2013) interpret the X-ray transient MAXI J0158744 as the nova fireball, while Li et al. (2012) suggest the X-rays are produced by interaction of the nova shell with the Be-type donor wind. The ongoing all-sky X-ray surveys with MAXI/GSC (Negoro et al., 2016) and SRG/eROSITA (Merloni et al., 2012; Predehl et al., 2016) have a chance to detect a nova fireball.
- 2.
- 3.
- 4.
-
5.
When accretion restarts after the nova explosion, X-ray emission is produced in the region where accreting matter hits the white dwarf (the boundary layer between the disk and the surface in non-magnetic white dwarfs or the accreting column in magnetic ones). This is the accretion-powered X-ray emission found in cataclysmic variables (Mukai 2017, Takei et al. 2011).
The X-ray emission, including that powered by shocks, is widely assumed to be thermal. However, detection of continuum GeV -ray emission from novae (Abdo et al., 2010; Ackermann et al., 2014; Cheung et al., 2016; Franckowiak et al., 2018) implies efficient particle acceleration by shocks (e.g. Blandford, 1994; Caprioli & Spitkovsky, 2014; Slane et al., 2015). The accelerated particles produce -rays through the hadronic (pion production and decay) and/or leptonic (direct acceleration of electrons and inverse Compton scattering of ambient photons or relativistic bremsstrahlung) mechanisms (Metzger et al., 2015; Martin et al., 2018) – the same mechanisms invoked to explain high-energy emission from jetted active galactic nuclei known as “blazars” (Boettcher, 2010). If the hadronic scenario is responsible for the -ray production, novae should be sources of neutrinos that may be reachable for the next generation detectors (Metzger et al., 2016). In both hadronic and leptonic models, the relativistic particles may also contribute to non-thermal emission in X-rays (Vurm & Metzger, 2018) and emit synchrotron radiation in the radio band (Vlasov et al., 2016).
It is also possible to produce non-thermal X-rays through Compton degradation of MeV line emission from decaying radioactive isotopes such as 22Na (Suzuki & Shigeyama 2010, see also references in Orio et al. 2001 and the discussion in § 2.1). The MeV line emission has long been predicted, but never observed (Hernanz & José, 2006; Hernanz, 2014; Jose, 2016).
The X-ray emission is absorbed by the expanding nova ejecta and, to an usually lesser extent, by the interstellar medium. The contributions of intrinsic and interstellar absorption may be disentangled as the intrinsic absorption decreases with time as the nova ejecta disperse (e.g. Mukai & Ishida, 2001; Page et al., 2015). The time it takes for the nova ejecta to thin out and reveal the underlying SSS may be used (together with the expansion velocity determined from optical spectroscopy) to estimate the nova ejecta mass (Schwarz et al., 2011; Henze et al., 2014).
1.2 X-rays from -ray detected novae
Surprisingly, no X-rays below 10 keV (the energy band where most X-ray observatories, including Swift/XRT and XMM-Newton, operate) have been observed from classical novae (i.e., novae with dwarf companions) while the novae were detected in -rays (Metzger et al. 2014, Gordon et al. 2020, in prep.). This might be explained if the soft X-rays are absorbed by the dense nova ejecta in the first weeks following explosion (see § 3.3). Interestingly, novae with red giant donors, like V407 Cyg, are detected in X-rays simultaneously with the GeV emission, likely due to the shock being external—between the ejecta and the giant companion’s wind—rather than internal to the nova ejecta (Nelson et al., 2012; Orlando & Drake, 2012).
Thanks to its high sensitivity above 10 keV, NuSTAR (§ 1.3) can penetrate dense nova ejecta and constrain the X-ray luminosity simultaneously with the GeV detection by Fermi/LAT. V339 Del and V5668 Sgr were the first classical novae observed with NuSTAR while they were still bright in GeV -rays (§ 3.4); contrary to expectation, both resulted in non-detections (Mukai et al. 2020, in prep.). The first detection of X-rays simultaneous with -rays for a classical nova finally came with V5855 Sgr, but deepened the mystery of the missing X-rays (Nelson et al., 2019). Observed 12 days after eruption, the X-rays were consistent with highly-absorbed thermal plasma (see e.g. Ghisellini, 2013), and the ratio of unabsorbed X-ray to -ray luminosity was (monochromatic flux ratio in units; § 3.4). This ratio was surprisingly low, because we expect only a small fraction (10%) of the shock energy to be transferred to the -ray emitting non-thermal particles (see § 3.4.2 and Metzger et al., 2015). Meanwhile, the shocks in novae are predicted to be dense and radiative, implying that the bulk of the shock energy should be efficiently radiated away, and the shock speeds of 1000 km s-1 imply that the bulk of this thermal emission should emerge in the X-ray band (Metzger et al., 2014; Metzger et al., 2015). A possible explanation for the low value of in V5855 Sgr is suppression of X-rays at nova shock fronts (Nelson et al., 2019). If the shocks are dense and radiative, the shock front becomes subject to instabilities and develops a corrugated structure that can lead to post-shock temperatures a factor of lower than expected (Steinberg & Metzger, 2018). In that case, the shock luminosity is expected to emerge at longer wavelengths (i.e., optical/infrared) (Metzger et al., 2014; Steinberg & Metzger, 2020). Notably, correlated variations between the optical and -ray lightcurves of novae have now been observed in two (possibly three, Munari et al. 2017) systems—including the subject of this paper, V906 Car—supporting this model (Li et al. 2017; Aydi et al. 2020).
Was the low value of in V5855 Sgr unusual amongst novae? We know that the -ray properties of novae are diverse, with 100 MeV luminosities spanning at least a factor of 30 (Franckowiak et al., 2018). And yet, we do not understand the cause of this diversity, or the full range of conditions in nova shocks. These open questions led us to observe V906 Car with NuSTAR while it was detected with Fermi/LAT—the results of which we present here.
1.3 Orbital observatories
Our current understanding of nova X-ray emission comes primarily from XMM-Newton (e.g. Hernanz & Sala, 2005) and Swift (Ness et al., 2007; Schwarz et al., 2011; Ness, 2012) observations. NuSTAR has high sensitivity to very hard X-rays and is just starting to reveal the behaviour of novae above 10 keV. Fermi/LAT detection of GeV emission from V407 Cyg (Abdo et al., 2010) sparked a renewed interest in novae. Here we briefly summarize the technical capabilities of these space missions.
The Nuclear Spectroscopic Telescope Array (NuSTAR) (Harrison et al., 2013b) was launched into a low-Earth orbit on 2012 June 13, equipped with two identical focusing X-ray telescopes sensitive to photons with energies 3–79 keV (Madsen et al., 2015). It provides two orders of magnitude higher sensitivity (and an order of magnitude higher angular resolution) compared to the coded aperture mask instruments Swift/BAT and INTEGRAL sensitive to this energy range. Its exceptional sensitivity makes new classes of objects, including classical novae, accessible for study in the hard X-ray regime. The 10 m-long extendible mast separating the X-ray optics and detector units limits the speed at which the observatory can repoint, so NuSTAR performs long observations of a single field interrupted by Earth occultations, before repointing to another field (much like the Hubble Space Telescope).
The Neil Gehrels Swift Observatory (Swift) has been operating in low-Earth orbit since 2004 November 20 (Gehrels et al., 2004). While originally designed for observations of -ray bursts and their afterglows, it became an essential tool for multiwavelength studies across various branches of astronomy. Its unique ability to quickly repoint makes it practical to perform monitoring observations of multiple sources and allows Swift to use efficiently its time for observations (except for the South Atlantic Anomaly passages), switching to a new target when the previous one goes into Earth occultation. Swift is equipped with the coded aperture mask, wide field-of-view Burst Alert Telescope (BAT; Barthelmy et al., 2005) collecting very hard 15–150 keV X-rays, the focusing X-ray Telescope (XRT; Burrows et al., 2005) being sensitive to 0.3-10 keV X-rays, and the Ultra-Violet/Optical Telescope (UVOT; Roming et al., 2005).
XMM-Newton was launched on 1999 December 10 into a highly elliptical orbit allowing for long uninterrupted observations (Jansen et al., 2001). The observatory can perform high-resolution X-ray grating spectroscopy in the range 0.33–2.1 keV (6–38 Å) using its Reflection Grating Spectrometer (RGS) instruments (den Herder et al., 2001). It is also equipped for traditional medium-resolution spectroscopy with a pair of EPIC-MOS111European Photon Imaging Camera - Metal Oxide Semiconductor (Turner et al., 2001) and the EPIC-pn222European Photon Imaging Camera with the pn-type detector (Strüder et al., 2001). imaging cameras covering a wider energy range of 0.2–10 keV. The EPIC-MOS and EPIC-pn cameras differ in the detector array geometry, electronics (resulting in different readout times) and quantum efficiency (front- and back-illuminated design, respectively). The observatory also operates the Optical Monitor telescope (Mason et al., 2001) that is similar to the Swift/UVOT. All XMM-Newton instruments are normally operating simultaneously (the photons not intercepted by the RGS gratings are collected by the EPIC-MOS cameras, while the EPIC-pn camera is fed by its own X-ray mirror assembly).
Fermi Gamma-ray Space Telescope was launched into low-earth orbit on 2008 June 11. Its main instrument, the Large Area Telescope (LAT; Atwood et al. 2009; Abdo et al. 2009; Ackermann et al. 2012) is a pair-conversion detector sensitive to -rays in the energy range 20 MeV–300 GeV. Its collecting area and 2.4 sr field of view are far superior to the contemporary GeV telescopes AGILE (Tavani et al., 2009, 2008) and DAMPE (Chang et al., 2017) and their predecessor – EGRET, the spark chamber detector on board the Compton Gamma Ray Observatory (Thompson et al., 1993). Fermi/LAT normally performs an all-sky survey every day, but see § 2.7.
| ObsID | Epoch | Start | Stop | Exposure | Exposure | Net count rate | Net count rate |
|---|---|---|---|---|---|---|---|
| (days) | UT | UT | FPMA (ks) | FPMB (ks) | FPMA (cts/s) | FPMB (cts/s) | |
| 80301306002 | 36 | 2018-04-20 14:46 | 2018-04-22 02:01 | 48.8 | 48.5 | ||
| 90401322002 | 57 | 2018-05-11 16:26 | 2018-05-12 18:01 | 47.5 | 47.4 |
Column designation: Col. 1 – observation identification number; Col. 2 – time since outburst; Col. 3 and 4 – start and stop time of the observation (interrupted by Earth occultations and South Atlantic Anomaly passes); Col. 5 and 6 – total on-source exposure time for FPMA and FPMB, respectively; Col. 7 and 8 – source count rate (background-subtracted) for FPMA and FPMB, respectively.
1.4 V906 Car (2018)
V906 Car (Nova Carinae 2018, ASASSN-18fv) was discovered on 2018 March 20.32 UT (Stanek et al., 2018) by the ASAS-SN survey (Shappee et al., 2014; Kochanek et al., 2017) as a new saturated object (<10 mag) near the Carina Nebula. No previous outbursts were found by ASAS-SN or among the numerous amateur images of the Carina region (Toumilovitch et al., 2018). The initial spectroscopic observations by Strader et al. (2018) on March 21 and Izzo et al. (2018) on March 22 were unable to distinguish between the possibilities of the object being a classical nova, a luminous red nova (e.g. Pastorello et al., 2019), or a young stellar object outburst (e.g. Hartmann & Kenyon, 1996). The main source of confusion were the low velocities derived from the emission lines at early times. Luckas (2018) obtained another spectrum on March 21 and interpreted it as that of a classical nova in the iron curtain phase. The infrared spectrum obtained by Rabus & Prieto (2018) on April 1 was consistent with a Fe II-type nova, according to the classification scheme of Williams (1992).
By a lucky coincidence, V906 Car was within the field of view of the BRITE cubesat constellation (Weiss et al., 2014; Pablo et al., 2016; Popowicz et al., 2017), as it was performing photometry of a nearby red giant HD 92063 (see also § 2.3 and 2.4; Kuschnig et al. 2018). We adopt 2018 March 16.13 UTC (HJD2458193.63) as the nova explosion time derived from the BRITE lightcurve by (Aydi et al., 2020, see their Supplementary Figure 2). The adopted is consistent with the reported non-detection by Evryscope two hours earlier (Corbett et al., 2018). The optical lightcurve of V906 Car, peaking at 5.9 mag, showed an unusual series of fast flares superimposed on the slowly evolving nova lightcurve.
As of 2020 June, V906 Car is the brightest -ray nova observed by Fermi/LAT to date (Jean et al., 2018), reaching peak 0.1–300 GeV flux of photons cm-2 s-1 in a 12 h integration centred on 2018 April 14.25 UT ( days; § 2.7; Aydi et al. 2020). Remarkably, a series of distinct flares was resolved in the Fermi/LAT lightcurve that coincided with the optical flares observed by BRITE. This led Aydi et al. (2020) to conclude that these flares are manifestations of shocks. V906 Car was also the first nova detected by the AGILE mission (Piano et al., 2018) observing at the MeV band similar to Fermi/LAT.
V906 Car was observed by INTEGRAL starting on 2018 April 23 ( days), with the aim of searching for the MeV -ray nucleosynthesis lines predicted in novae333https://www.cosmos.esa.int/web/integral/news-2018, one of the long-standing goals of the INTEGRAL mission (Hernanz et al., 2002; Siegert et al., 2018). No MeV line detections were reported. High-cadence optical photometry was obtained with INTEGRAL/OMC, revealing variations of up to 0.3 mag on time-scales of several hours to one day (Domingo et al., 2018).
McLoughlin et al. (2020) report dense monitoring of Fe ii and [O i] features in the optical spectrum of V906 Car. The authors argue that these spectral features might be originating in a rotating circumbinary disc. Pavana et al. (2020) also report spectroscopy of V906 Car concluding that the nova ejecta are clumpy and have an overall asymmetric bipolar geometry.
V906 Car was also observed at radio wavelengths with the Australia Telescope Compact Array (ATCA) resulting in an initial non-detection on 2018 April 03 ( days; Ryder et al., 2018). The mJy-level radio emission was detected first on 2018 May 13 ( days) and reached its peak in late 2019 (Aydi et al., 2020).
1.5 Galactic extinction towards V906 Car
Optical spectroscopy allowed Aydi et al. (2020) to estimate the interstellar reddening towards V906 Car using the diffuse interstellar bands (Friedman et al., 2011) and the Na i D absorption features (Poznanski et al., 2012). Combining these two methods, the authors found . Assuming the standard value of (Schultz & Wiemer, 1975), this corresponds to a -band extinction of mag.
An alternative method of estimating extinction to a nova is based on the typical intrinsic colour of when the nova is two magnitudes below its peak (the dispersion of is mag, van den Bergh & Younger, 1987). The nova light at this stage may be dominated by optically-thick free-free (blackbody) emission (Hachisu & Kato, 2014). According to Aydi et al. (2020), for V906 Car the observed around days, corresponding to a colour excess of – consistent with the spectroscopically-derived value within one sigma uncertainty of the intrinsic color. We adopt the spectroscopically-derived as it has lower uncertainty. It is also not clear whether the method based on intrinsic colour is applicable to V906 Car, considering the major contribution of shock-powered optical emission (Aydi et al., 2020).
We note that Pavana et al. (2020), relying on a different Na i D equivalent width–reddening calibration and the expected nova color around maximum light, arrive at a much higher value. This value, however, would imply the Galactic X-ray absorbing column is much higher than that we derive from XMM-Newton observations, as described in § 2.3.
To estimate the expected Galactic X-ray absorbing column to V906 Car, we utilize the relation proposed by Güver & Özel (2009) between the optical extinction and the hydrogen column density:
| (1) |
This value should be a lower limit on the total X-ray absorbing column, as the nova ejecta produce large intrinsic absorption (§ 3.3). The derived is consistent with the value derived from our late-time XMM-Newton spectroscopy (Table 3). The total H i column density in the direction of V906 Car derived from Galactic surveys of the 21 cm emission line is cm-2 (Kalberla et al., 2005; Bajaja et al., 2005), so the nova is in front of 80% of the Galactic absorbing column. Comparison of the estimated for V906 Car to the total optical V-band extinction in its direction (3.6 mag; Schlafly & Finkbeiner, 2011) also suggests that the nova is nearby. Aydi et al. (2020) adopted a distance to V906 Car of 4 kpc based on the uncertain Gaia parallax measurement (Bailer-Jones et al., 2018) and the Galactic 3D extinction map of Chen et al. (2019).
1.6 Scope of this work
We present a joint analysis of NuSTAR, XMM-Newton, Swift and Fermi observations of V906 Car. We fit the model describing the observed X-ray spectra and constrain the elemental abundances in the nova ejecta. We compare the simultaneous hard X-ray (NuSTAR) and -ray (Fermi/LAT) observations to identify the physical origin of the high-energy emission in this nova, and discuss the possible location of the X-ray emitting shock. In Section 2, we describe the observations of V906 Car performed with the instruments introduced in § 1.3. In Section 3, we estimate physical parameters of the nova, and summarize our findings in Section 4.
Throughout this paper we adopt a significance level : we reject spectral models that have a probability of obtaining the observed or a more extreme value of the test statistic by chance444see e.g. Chapter 5 of Wall & Jenkins (2003) and https://en.wikipedia.org/wiki/P-value. We use as the test statistic as we deal with well-sampled spectra (§ 2.1). We express the abundances of the chemical elements by the number of atoms relative to the number of hydrogen atoms following the XSPEC convention (§ 3.1). The quoted uncertainties of the model parameters are at level. For power law emission, we define the spectral index as where is the spectral flux density and is the frequency; meanwhile the corresponding index in the distribution of the number of incoming photons as a function of energy is , where is called the photon index and . The same power law expressed in spectral energy distribution units (SED; Gehrels 1997) is . When referring to “GeV -rays” we imply emission in the Fermi/LAT band (0.1–300 GeV).
2 Observations and analysis
2.1 NuSTAR spectroscopy
NuSTAR observed V906 Car during two epochs: and d. The nova is clearly detected with 1563 and 4046 counts in the source region (two focal plane modules combined) in the first and second epoch, respectively. The observing log is presented in Table 1. We use nupipeline and nuproducts commands from HEASoft 6.26.1 to extract source and background spectra from the focal plane modules A (FPMA) and B (FPMB). A circular extraction region with radius of 30 was centred on the X-ray image of the nova using ds9 (Joye & Mandel, 2003). The centring was done for FPMA and FPMB event files separately. The background was extracted from five circular regions of the same size that were manually placed near the nova on the same CZT (Arnaud et al., 2011) chip. We checked that the specific choice of the background region does not affect the results. We use grppha to mark channels 0–46 and 1910–4095 as “bad”, restricting the energy range to 3.5–78.0 keV and grouping the source spectra to contain at least 25 counts per bin. The spectra together with the redistribution matrix (RMF; describes the probability of a count being registered at a certain energy channel as a function of the photon energy) and auxiliary response (ARF; describes the detector effective area as a function of energy) calibration files provided by the pipeline are loaded into XSPEC 12.10.0c (Arnaud, 1996) for further analysis.
| vphabs | k | FeCoNi | CNO | 3.5–78.0 keV Flux | 3.5–78.0 keV Flux0 | ||
| (days) | ( cm-2) | (keV) | abundances | abundances | (erg cm-2 s-1) | (erg cm-2 s-1) | |
| Solar abundances model: , , | |||||||
| 36 | 1.0 | 1.0 | |||||
| 57 | —"— | —"— | |||||
| Fe-deficient model: , , | |||||||
| 36 | 1.0 | ||||||
| 57 | —"— | —"— | |||||
| CNO-overabundance model: , , | |||||||
| 36 | 1.0 | ||||||
| 57 | —"— | —"— | |||||
| XMM-derived abundances model: , , | |||||||
| 36 | 0.10 | , , | |||||
| 57 | —"— | ||||||
| XMM abundances and fixed Galactic column model: , , | |||||||
| 36 | 0.10 | , , | |||||
| 57 | —"— | ||||||
| Two-temperature plasma model: , , | |||||||
| 36 | , | 0.10 | , , | ||||
| 57 | , | —"— | |||||
| Power-law model: , , | |||||||
| 36 | 0.10 | , , | |||||
| 57 | —"— | ||||||
The preferred model is marked in boldface. Column designation: Col. 1 – observation time, in units of days since outburst; Col. 2 – equivalent hydrogen column density; Col. 3 – plasma temperature; Col. 4 – abundances of Fe, Co and Ni (tied together) relative to the solar values; Col. 5 – abundances of C, N and O (tied together for the first two models) relative to the solar values; Col. 6 – normalization factor of FPMB relative to FPMA; Col. 7 – absorbed model flux in the energy range 3.5–78.0 keV; Col. 8 – unabsorbed 3.5–78.0 keV flux.
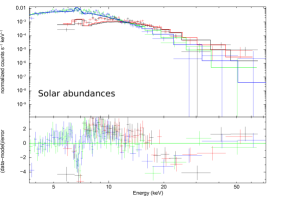
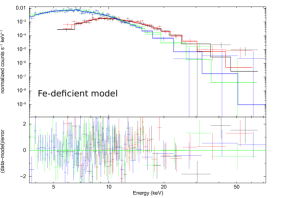
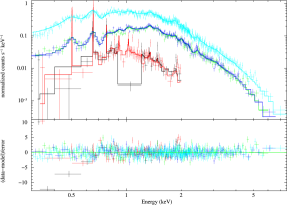
To fit the NuSTAR observations we first choose the absorbed optically-thin thermal equilibrium plasma model attenuated by photoelectric absorption: XSPEC model constant*vphabs*vapec. We simultaneously fit all four spectra (FPMA and FPMB spectra obtained at two epochs) allowing for absorbing column (vphabs), temperature and normalization factor of vapec variations between epochs. The normalization factor between the FPMA and FPMB spectra (represented by the constant term) is also allowed to vary between the two epochs. The best-fitting model parameters, together with their estimated uncertainties, are listed in Table 2.
The observed X-ray spectrum cannot be fit by an absorbed thermal plasma if we assume solar abundances (top left panel of Fig. 1). The value we find (3.1; Table 2) corresponds to the null hypothesis probability of . The data systematically depart from the model predictions around 6.7 and 20-30 keV, which makes it even less likely to occur by chance compared to the simple statistics that does not take into account correlations in residuals (c.f. the ‘alarm’ statistic of Tamuz et al., 2006). Throughout this work we always assume the same abundances for the emitter and absorber (with the exception of Galactic absorbing component that we consider separately below).
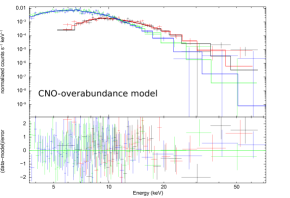
At least two variations of the absorbed thermal plasma model are compatible with the observations. The first is a model with Fe abundance (by number) of times the solar value (top right panel of Fig. 1). Fe is present in the nova ejecta (as we clearly see Fe lines in the optical spectrum; Luckas 2018; Aydi et al. 2020) but it may be under-abundant with respect to solar values. The second model that provides a good fit to the NuSTAR spectrum has solar Fe abundance and overabundance of CNO elements by a factor of (bottom left panel of Fig. 1). Novae are known to show overabundance of CNO elements (Williams, 1985; Livio & Truran, 1994; Gehrz et al., 1998; Schwarz et al., 2001, and the discussion in § 3.1).
The results in Table 2 do not depend strongly on the specific choice of solar abundances (we used the latest abundances from Asplund et al. 2009 available in XSPEC, but also tested the values from Wilms et al. 2000 and Lodders 2003). We found that our spectral fits minimally depend on the choice of absorption model, comparing tbvarabs (Wilms et al., 2000) to vphabs (Balucinska-Church & McCammon, 1992). We also fit an alternative thermal plasma emission model (vmekal; Mewe et al. 1985; Liedahl et al. 1995), and found the difference with the vapec model fit was within the statistical errors. An acceptable fit (, , ) can be achieved with the simple thermal bremsstrahlung model bremss (Kellogg et al., 1975), implying the absence of obvious emission features in the NuSTAR spectra. We prefer the vapec model (Brickhouse et al., 2005) over bremss as this model is more physically motivated (we expect the line emission to be present at some low level, see § 2.3).
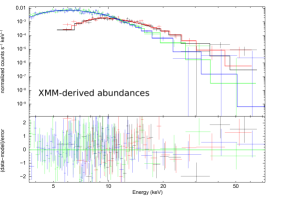
We also fit the NuSTAR spectra with an absorbed thermal plasma model (vphabs*vapec), fixing the abundances set to the values derived from our XMM-Newton observations described in § 2.3 and Table 3 (see the bottom right panel of Fig. 1). The C abundance that is not well constrained from the XMM-Newton spectroscopy was set to the solar value. We checked that the fit remains essentially the same if we set the C abundance to 0. The Co and Ni abundances were set equal to Fe. The resulting plasma temperature (k) and unabsorbed flux are close to the ones suggested by the CNO-overabundance model, while the absorbing column is best fit by a value intermediate between the CNO-overabundance and Fe-deficient models (Table 2). To estimate the errors in k and resulting from uncertainties in abundances, we vary the N and O abundances within the errors of the XMM-Newton spectrum fitting (Table 3), while for Fe we vary the abundances between 0.0 and 0.1 and C in the range 0.0–1.0. These input parameter variations result in best-fitting values in the range cm-2 for the first epoch and cm-2 for the second epoch (these are full ranges of the obtained best-fitting values, not confidence intervals). The corresponding k range is 8.63–8.70 keV and 4.32–4.35 keV for the first and second epochs, respectively. Comparing the ranges of k and values obtained with various abundances to the best-fitting values and their uncertainties for the models listed in Table 2, one can see that the temperatures are largely insensitive to the choice of abundances, while the values strongly depend on that choice.
As the joint NuSTAR and Swift/XRT observations of the recurrent nova V745 Sco by Orio et al. (2015) were fit with two-temperature plasma, we tried adding a second vapec component to our NuSTAR model (constant*phabs*vphabs*vapec; Table 2; phabs component describes the fixed Galactic , as discussed below). The fit suggests that a very bright component (0.3–78.0 keV flux of erg cm-2 s-1 and erg cm-2 s-1, for the first and second epochs, respectively) can be hidden behind the inferred absorbing column, if this second emission component is soft (k keV). The presence of this low-energy component is not required to obtain a statistically acceptable fit so its flux is highly uncertain and consistent with being zero. The dramatic decrease in the best-fitting flux of this hypothetical low-energy component between the two epochs likely reflects the improving constraints on the soft emission resulting from the decreasing absorbing column, rather than any real change in the emission. The addition of the soft vapec component does not change the parameters of the hard vapec component; they remain essentially the same as in Table 2 for the single-component emission.
As many novae show super-soft emission at some point in their X-ray evolution (§ 1.1, § 3.6), we also try to replace the low-energy vapec component with a black body. This dramatically changes the fit, splitting the flux nearly equally between the vapec and bbody components. For both epochs, the best-fitting temperature of the blackbody component is keV—so high as to be unphysical for optically-thick emission on a white dwarf (SSS are not expected to exceed k keV; Wolf et al. 2013).
Spectral fits to Swift/XRT observations of V906 Car (§ 2.5) covering a wide time range (§ 2.4) do not require a second emission component and can be described as a single absorbed thermal plasma with temperature and absorbing column that gradually decrease with time. We take this as reassurance that there is no need to artificially introduce a second emission component for fitting the NuSTAR observations.
To constrain non-thermal X-rays, we fit the spectrum with an absorbed power-law model vphabs*pow (i.e., assuming that all X-ray emission is non-thermal—see the discussion in § 3.4.1). The fit yields values of , , —slightly below our adopted significance level of . The photon index for the best-fitting power-law model (Table 2) is (§ 3.4.1). The associated absorbing column for the power law model is higher (by a factor of 1.5 for the XMM abundances model) than for the optically thin plasma model.
Finally, following Nelson et al. (2019), we test the possibility that the NuSTAR emission is an (absorbed) combination of an optically-thin thermal plasma emission and non-thermal emission represented by a power-law (vapec+pow). From our absorbed plasma model fits, we see that a power-law component is not required to obtain an acceptable fit to the data; therefore, the model flux and photon index are not constrained if both the photon index and normalization factor are left free to vary. To circumvent this, we consider three fixed values of the photon index: , and . In all cases the contribution of the power-law component is constrained at % of the thermal component flux listed in Table 2.
These tested photon index values are the ones expected for the low-energy tail of the GeV emission, as discussed in § 3.4.1. A different mechanism that may produce non-thermal X-ray emission in novae (that should operate independently of the process responsible for the GeV emission) is the Compton degradation of MeV -rays produced by radioactive decay (see § 1.1; Livio et al., 1992; Suzuki & Shigeyama, 2010; Hernanz, 2014). Gomez-Gomar et al. (1998) predict flat or inverted (rising) continuum spectra below 100 keV for the Comptonized photons in both CO and ONe novae (which differ by the set of parent radioactive decay lines). As with the low-energy tail of the GeV emission, the observed soft spectrum disfavours Comptonization of the radioactive lines as the source of X-ray emission from V906 Car in the NuSTAR band. Nelson et al. (2019) argue that the Compton optical depth in a nova is not sufficient for Compton degradation to produce a detectable hard X-ray flux. In summary, all the expected mechanisms behind non-thermal emission should produce a hard spectrum, while in fact the observed spectrum is soft, consistent with being thermal.
Finally, we construct an “XMM abundances and fixed Galactic column” model constant*phabs*vphabs*vapec that includes a single emission component (vapec) and incorporates our knowledge of the elemental abundances (§ 3.1) and Galactic (phabs; § 1.5). We choose this as the preferred model (marked in boldface in Table 2) for the NuSTAR spectra of V906 Car.
2.2 NuSTAR variability search
We checked for the presence of variability within the two NuSTAR observations that lasted 127 and 92 ks wall time (total time including interruptions), respectively (Table 1). The regular interruptions were caused by the Earth occultations of the source. For each of the two observations we generated source and background lightcurves with nuproducts using 5806 s bin size (corresponding to one NuSTAR orbital revolution). The background lightcurve was scaled and subtracted from the source lightcurve using lcmath. We then performed the test to determine if the lightcurves are consistent with the null hypothesis that the source flux does not change during the observation given the errorbars. For a discussion of the test in the context of variability search, see de Diego (2010); Sokolovsky et al. (2017). The test is sensitive to any kind of variability, both periodic and irregular.
We find that the null hypothesis cannot be rejected at the level, i.e., we found no significant variability within the individual NuSTAR observations. The r.m.s. scatter of the NuSTAR lightcurves is 0.008 cts/s (18%) and 0.007 cts/s (6%) for the first and the second epoch, respectively. If there is any low-level variability in the source during the times of our observations, the variability amplitude is lower than the above values. Our analysis probes the variability time-scales from to ks (variability related to orbital motion of the binary system might be expected on these time-scales). Investigation of variability on a shorter time-scale is limited by S/N, while the upper bound on the detectable variability time-scale is set by the duration of our observations. We leave the search for short time-scale periodic signals (that could be associated with white dwarf rotation) outside the scope of this paper, as we do not expect the X-ray emitting nova shock to be physically tied to the white dwarf surface (for example - its magnetic pole).
2.3 XMM-Newton spectroscopy
We requested an XMM-Newton target-of-opportunity observation to distinguish between the CNO-overabundant and Fe-deficient models that both fit the NuSTAR spectra well, but differ in the predicted value by almost two orders of magnitude (§ 2.1). A 51 ks observation (ObsID:0831790401) was conducted on 2018 December 16 ( d). The observation was only partially ( 10-20% of the total effective exposure time) affected by high level of solar particles and all X-ray instruments collected useful data (EPIC cameras: pn, MOS1, and MOS2; RGS cameras: RGS1 and RGS2). The Optical Monitor had to be blocked due to the presence of the bright star HD 92063 in its field of view, only 2 from V906 Car (this was the star monitored by BRITE and it also affected the Swift/XRT observations; § 1.4, § 2.4). The presence of HD 92063 required the use of the thick optical blocking filter with the EPIC cameras. The data analysis was performed through the XMM-Newton Science Analysis System (SAS) v17.0.0, using calibration files available in 2018 December. The EPIC data were grouped to have spectra with at least 25 counts per bin for each camera; for the RGS data the value was at least 5 counts per bin. The spectral fit, with XSPEC 12.9.1m, assumed the C-Statistic and Chi-Squared for the fit and test statistics, respectively.
The X-rays from V906 Car were clearly detected with all EPIC and RGS instruments (Fig. 2). The average EPIC-pn count rate was cts/s at the 0.3-8 keV energy range, that corresponds to a total number of background corrected counts of 32679 for the 40350 s of the exposure under low level of solar particle contamination. An X-ray source of this brightness should not produce any significant pile-up in any of the XMM-Newton instruments and, in fact, there is no evidence of pile-up in the EPIC data from the sas/epatplot task.
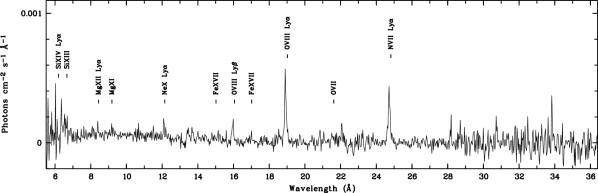
The RGS spectra show a continuum and prominent emission lines, while there is no evidence of absorption lines (Fig. 3). Noticeably, among the emission lines there are the lines of N vii (K, analogous to the Lyman line of hydrogen) and O viii (K and K), suggesting a high abundance of these elements.
The EPIC spectra (Fig. 2) do not show the 1 keV “bump” expected from a number of Fe L-shell lines (analogous to the Balmer series), and there is no sign of the Fe K feature – suggesting sub-solar Fe abundance (§ 3.1). The C abundance could not be reliably constrained from the RGS data as the estimate would rely on the C vi Lyman line at 33.7 Å (0.368 keV) in the rest frame, that is located in the noisy part of the spectrum. However, for the solar C/N abundance ratio, the C vi line should be stronger than the detected N vii (24.8 Å, 0.500 keV) line (e.g. Audard et al., 2001) and should have been visible in our RGS spectrum (Fig. 3). The absence of the C vi line, combined with the clear presence of the N vii line imply that the C/N ratio is sub-solar.
The results of a joint fit to EPIC (0.3–8 keV) and RGS (0.65–2 keV) spectra of the absorbed thermal plasma model phabs*vphabs*bvapec with the addition of Gaussian lines are presented in Table 3. The adopted abundance table was that of Asplund et al. (2009). The Gaussian lines accounted for excesses that we associate with triplets of resonance (r), intercombination (i), forbidden (f) lines of the He-like ions of Mg xi, Ne ix, O vii, N vi. The fitted line parameters are presented in Table 4. The likely source of the discrepancy between what is predicted by the bvapec component and what is observed and associated to the triplets is that the single-temperature equilibrium plasma is too crude an approximation of real physical conditions in the nova ejecta that cannot fully describe the grating data.
We use a combination of solar abundances absorber (phabs) and variable–abundances absorber (vphabs) to account for the Galactic and intrinsic contributions to the total column density, respectively. We let the absorption column parameter for both absorbing components, expressed in the equivalent of hydrogen column (), to vary freely during the fit. The resulting Galactic from X-rays is consistent at the 1 confidence level with the value estimated from optical extinction (§ 1.5), while the model shows that a non-negligible amount of material is also absorbing X-rays within the nova shell (Table 3).
The emission lines in Fig. 3 appear blueshifted. This indicates that the bulk of the plasma responsible for the emission seen in X-rays is moving towards us. Its radial velocity may be estimated from the redshift parameter of the bvapec component in the model. A value of km s-1 was derived from fitting the same data excluding the energy ranges where the Gaussian lines had to be inserted in the final fit. Then this value was held fixed for the fit reported in Table 3. Interestingly, had the optical lines been blueshifted by the same velocity, that would have been easily noticeable in spectroscopic observations by Aydi et al. (2020), but no such shift was observed555Systemic velocity of km s-1 would be obvious in the optical spectra collected before the maximum light while the lines are not very broad (the dips of the P Cygni profiles were at km s-1). On d, the FWHM of the Balmer lines was km s-1 centered at km s-1 (Aydi et al., 2020).. We do not have a conclusive explanation for this discrepancy, but it seems to be due to opacity and/or asymmetries in the ejecta. One possibility is that the ejecta are opaque to X-rays and we see only the approaching side of the expanding X-ray plasma, while it is fully transparent to photons in the optical by . Alternatively, the X-ray emitting ejecta could be highly asymmetric, with the approaching part emitting much more than the receding part.
A similar blueshift of X-ray emission lines was observed with Chandra by Nelson et al. (2008) in the red giant donor recurrent nova RS Oph and by Peretz et al. (2016) in the classical GeV-bright nova V959 Mon. Nelson et al. (2020, in prep.) confirm the blueshift with Suzaku spectroscopy of V959 Mon. The opacity-based explanation of blueshifted emission lines in V959 Mon suggested by Peretz et al. (2016) is similar to that of the blueshifted absorption lines observed in the SSS spectra of other novae (Ness, 2012). Nelson et al. (2008) speculated that transient highly blueshifted C vi and N vi lines seen in RS Oph may be associated with the asymmetric synchrotron-emitting jet observed with VLBI (Rupen et al., 2008).
We use the bvapec model instead of vapec to account for the velocity- and thermal-broadened emission lines that become important when fitting the grating (RGS) spectra of V906 Car. The line width for the final fit (Table 3) was fixed to the value derived from the preliminary fit that excluded data in the problematic regions where the Gaussian lines had to be added. The line broadening derived from the preliminary fit was km s-1 (Gaussian sigma is the parameter of the bvapec model) corresponding to the full width at half maximum km s-1.
As with the NuSTAR spectra (§ 2.1), we tried to add a blackbody emission component to the optically thin thermal plasma model described in Table 3. The resulting blackbody temperature is unphysically high k keV. We interpret it as the absence of any SSS emission during the XMM-Newton observation. The optically thin plasma plus blackbody model also does not fit Swift/XRT data taken around this time (§ 2.5).
| Parameter | Value | Comment |
|---|---|---|
| phabs | ||
| (1021 cm-2) | 2.4 | |
| vphabs | ||
| (1021 cm-2) | 0.12 | |
| bvapec | ||
| T (keV) | 1.07 | |
| redshift | fixed | |
| velocity (km s-1) | 378 | fixed |
| N/N⊙ | 345 | |
| O/O⊙ | 29 | |
| Ne/Ne⊙ | 2.2 | |
| Mg/Mg⊙ | 0.6 | |
| Si/Si⊙ | 1.1 | |
| Fe/Fe⊙ | 0.1 | |
| 1.15 | ||
| d.o.f. | 1837 |
| Lines | Energy | Wavelength | Line flux | |
|---|---|---|---|---|
| (keV) | (Å) | photons cm-2 s-1 | ||
| Mg xi | r | 9.169 | 1.356 | |
| i | 9.235 | 1.346 | ||
| f | 9.314 | 1.335 | ||
| Ne ix | r | 13.447 | 0.925 | |
| i | 13.551 | 0.918 | ||
| f | 13.698 | 0.908 | ||
| O vii | r | 21.602 | 0.576 | |
| i | 21.802 | 0.570 | ||
| f | 22.097 | 0.563 | ||
| N vi | r | 28.792 | 0.432 | |
| i | 29.074 | 0.428 | ||
| f | 29.531 | 0.421 |
2.4 Swift/XRT monitoring
Swift observed V906 Car on 45 epochs between 2018 March 21 ( d) and 2019 June 8 ( d). The first three observations on 2018 March 21, April 22, and May 11 resulted in non-detections. The less-sensitive Windowed Timing mode had to be used in the first two observations to reduce optical loading while the nova was still optically bright. During the third observation, the XRT was automatically switching between the Windowed Timing (17 s exposure) and Photon Counting (277 s exposure) modes. V906 Car was clearly detected in the 42 following observations (starting from 2018 May 17, d), all performed in the Photon Counting mode with a typical exposure time of 1.5 ks (46.7 ks total exposure). The observations on 2018 September 30 and 2018 November 18 have low signal-to-noise, as the XRT image of the source was crossed by a bad CCD column reducing the number of detected photons.
We use the standard circular source extraction region with a radius of 20 pix centred at the position derived from Swift/UVOT astrometry (§ 2.6). For the background we use an annulus centred on the source position with an inner radius of 77 pix and outer radius of 101 pix. This non-standard background extraction region was chosen to avoid the two nearby X-ray sources (clearly visible in the stacked image) and the cluster of optical photons from the nearby bright () star HD 92063. We use only grade 0 events in the analysis in order to minimize optical loading.
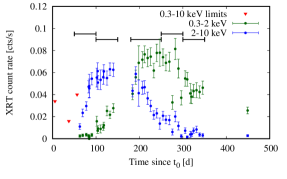
Fig. 4 presents the Swift/XRT lightcurve of V906 Car in the soft (0.3–2 keV) and hard (2–10 keV) bands. The hard flux is steeply rising following the initial detection on 2018 May 11 ( d), reaches a plateau around 2018 June 14 (), and then declines after 2018 September 23 ( d). The soft flux gradually rises from 2018 June 25 ( d) until 2018 October 8 ( d), then—after a standstill—it starts to decline on 2018 December 9 ( d). The peak full band (0.3-10 keV) count rate was reached on 2018 October 14 ( d) at cts s-1, and is sufficiently low that no pile-up correction is required.
| Epoch | vphabs | k | 0.3–10.0 keV Flux | d.o.f. | ||
| (days) | ( cm-2) | (keV) | (erg cm-2 s-1) | |||
| Model phabs*vphabs*vapec | ||||||
| 050–100 | 0.64 | 12 | 0.81 | |||
| 100–150 | 0.99 | 32 | 0.48 | |||
| 180–250 | 1.06 | 40 | 0.37 | |||
| 250–300 | 1.11 | 18 | 0.33 | |||
| 300–350 | 1.00 | 14 | 0.45 | |||
| Model phabs*vphabs*bbody | ||||||
| 050–100 | 0.42 | 12 | 0.96 | |||
| 100–150 | 0.82 | 32 | 0.76 | |||
| 180–250 | 1.19 | 40 | 0.19 | |||
| 250–300 | 1.83 | 18 | 0.02 | |||
| 300–350 | 3.33 | 14 | 0.00 | |||
Column designation: Col. 1 – time since outburst; Col. 2 – equivalent hydrogen column density; Col. 3 – plasma or blackbody temperature; Col. 4 – absorbed 0.3–10.0 keV flux; Col. 5 – reduced ; Col. 6 – number of degrees of freedom; Col. 7 – Null hypothesis probability.
2.5 Swift/XRT spectroscopy
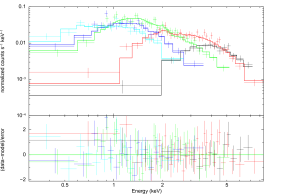
To follow the spectral evolution of V906 Car, we construct five spectra by combining Swift/XRT observations taken within day intervals marked in Fig. 4 (see Table 5). The spectra are presented in Fig. 5. We binned individual Swift/XRT observations to increase the photon statistics (e.g. Nelson et al., 2012), but we note the X-ray spectrum is changing within each bin. This may degrade the quality of the fits reported in Table 5. The bin width of days was chosen as a compromise between the photon statistics and the rate of spectral changes.
We fit the data with absorbed thermal plasma models (phabs*vphabs*vapec) and absorbed blackbody models (phabs*vphabs*bbody), fixing the elemental abundances in the vphabs and vapec components to the values derived from our XMM-Newton spectroscopy (§2.3; Table 3) and the Galactic absorption phabs (having the solar abundances) to the expected value (§1.5). The intrinsic absorbing column () and plasma/blackbody temperature (k), as well as the emitting component flux, are left as free parameters. The column densities reported in Table 2 and Table 5 refer only to the variable intrinsic vphabs absorption component. The absorbed blackbody fit suggests no intrinsic absorption after d, but fails to provide a good fit for the last two Swift spectra (day 250–300 and 300–350). In addition, the blackbody temperatures are unphysically high for an SSS (Wolf et al., 2013). The absorbed optically-thin plasma fits all five spectra well, and provide a physically appropriate model for the X-ray emission. The optically thin model is also supported by the NuSTAR (§2.1) and XMM-Newton (§2.3) observations. Therefore, we assume that the emission was dominated by the optically-thin component at all times.
2.6 Swift/UVOT lightcurve and astrometry
Most of the optical/UV photometry collected with UVOT during the Swift monitoring was not useful due to high coincidence losses on the bright source. Only starting from d does the source become sufficiently faint to perform photometry in the uvm2 band. The UV lightcurve shows a smooth decline from uvm2=10.44 mag on 2018 October 14 ( d) to uvm2=11.78 mag on 2019 June 8 ( d). The photometric error is dominated by the uncertainty in the coincidence-loss correction and is expected to be at the level of a few percent. We used these uvm2 images obtained during the decline phase to measure the astrometric position of V906 Car relative to UCAC3 stars within the UVOT field of view (Zacharias et al., 2010). We measured the nova position with the uncertainty of 0.1 (estimated from the scatter of measurements from multiple images):
10:36:15.42 -59:35:54.0 J2000.
2.7 Fermi/LAT monitoring
Aydi et al. (2020) performed detailed analysis of Fermi/LAT observations of V906 Car, establishing it as the brightest -ray emitting nova observed to date, detected during 2018 April 8–30. Unfortunately, the observations were cut short by the failure of the solar panel drive on 2018 March 16 (around ) that sent the Fermi spacecraft to “safe mode” with the scientific instruments powered off. The LAT observations resumed on 2018 April 8 ( d), but were interrupted again for the period 2018 May 1–13 (45–58 days after ) by a Fermi pointing pattern (needed to keep the stuck solar panel illuminated) that was unfavourable for observations of V906 Car.
Using the power law with exponential cut-off model for the -ray spectrum presented in Aydi et al. (2020) and restricting the LAT exposure to the exact time range of the first NuSTAR observation (Table 1), we derive a significant -ray detection of V906 Car (test statistic , or detection; Mattox et al. 1996). Its 100 MeV–300 GeV photon flux is photons cm-2 s-1, and erg cm-2 s-1 at photon energy h MeV, where h is the Planck constant.
The second NuSTAR observation (Table 1) was performed a day before LAT resumed observations of the V906 Car region. So, instead of using strictly simultaneous data, we use the LAT data collected right after the coverage gap, between 2018 May 13 17:01:00 and May 15 04:16 UT (same exposure time as the duration of the first NuSTAR observation including interruptions). The LAT observations resulted in a non-detection of V906 Car (), with an upper limit on the 100 MeV–300 GeV photon flux of photons cm-2 s-1 and erg cm-2 s-1 at h MeV.
3 Discussion
3.1 Ejecta abundances
It has long been recognized that nova ejecta are often enriched in heavy elements, compared to the composition of matter accreted from the donor star (e.g., Truran & Livio, 1986; Gehrz et al., 1998; Helton et al., 2012). This chemical enrichment is attributed to mixing between the accreted material and the white dwarf itself (Starrfield et al., 2008). Computer simulations have demonstrated that this mixing probably occurs at the onset of the thermonuclear runaway due to Kelvin-Helmholtz instabilities (Casanova et al., 2011, 2016; Casanova et al., 2018). Thermonuclear burning in the nova event proceeds through the CNO cycle, and may change the relative abundances of C, N and O, but will not increase the overall abundance of the CNO elements (Starrfield et al., 1972; Truran & Livio, 1986). The super-solar N/C ratio found in V906 Car (§ 2.3) demonstrates that the plasma emitting the soft X-ray lines has undergone non-equilibrium CNO burning. The plasma was ejected while in the 14N bottleneck (e.g. Imbriani et al., 2004). Optical spectroscopy often finds in novae an overabundance of nitrogen by two orders of magnitude and oxygen by one order of magnitude compared to solar values, respectively (Gehrz et al., 1998; Arkhipova et al., 2002; Downen et al., 2013). However, different authors sometimes report quite different abundances for the same nova (for example, compare the abundances for V1974 Cyg reported by Austin et al., 1996; Hayward et al., 1996; Arkhipova et al., 1997; Vanlandingham et al., 2005); the same is true for the few X-ray derived abundances (e.g. Rauch et al., 2010; Nemeth, 2010).
The chemical composition of the nova ejecta is strongly affected by the composition of the white dwarf, because we do not generally expect the material accreted from the donor star to have super-solar CNO abundances or to be hydrogen-deficient. Therefore, the white dwarf material is being ablated during a nova eruption (e.g. Shara et al., 2018) and we can draw conclusions about the composition of the white dwarf by observing nova ejecta.
Depending on its zero-age main sequence mass and mass transfer due to binary evolution, the white dwarf hosting nova eruptions may have either a CO or ONe composition. Our XMM-Newton spectroscopy of V906 Car implies CNO abundances that are a factor of 100 super-solar, but near-solar abundance of Ne (Table 3). This suggests that the V906 Car host is a CO white dwarf. The dust formation episode exhibited 50–100 days after outburst is consistent with a CO white dwarf (Aydi et al., 2020), as dust formation is more common in nova ejecta enriched in CO than in ONe (Evans & Rawlings, 2008). The CO composition is consistent with a low mass of the white dwarf hinted at by the non-detection of the super-soft emission (§ 3.6). The XMM-Newton spectroscopy also suggests sub-solar Fe abundance (Table 3).
3.2 The absence of the Fe K feature
We found no evidence of the Fe K emission in V906 Car. This is not surprising given that the absence of Fe K emission in the X-ray spectra of novae is a long-standing puzzle. At 6.7 keV, this feature probes shock-heated plasma. The two clear examples of novae with no Fe K emission are V382 Vel (§ 4.3 in Mukai & Ishida 2001; also no Fe L-shell emission found by Ness et al. 2005) and V959 Mon (Nelson et al. 2020, in prep.). The weakness of the Fe K emission may result from a low abundance of iron in nova ejecta, a high abundance of CNO that would enhance the continuum making the Fe K line relatively weaker, or from a non-equilibrium ionization state of the emitting plasma. The Fe II optical spectroscopic type reported for V382 Vel by della Valle et al. (1999) and Steiner et al. (1999) led Mukai & Ishida (2001) to the conclusion that a non-equilibrium ionization state is responsible for the weakness of the iron line. V959 Mon was a neon nova with sub-solar iron abundance (Shore et al., 2013). Novae occurring in symbiotic star systems that include a giant (rather than main sequence) companion to the white dwarf show strong Fe K emission (RS Oph and V745 Sco; Nelson et al. 2008; Ness et al. 2009; Orio et al. 2015; Delgado & Hernanz 2019). Such emission was also observed in V2491 Cyg by Takei et al. (2009), Takei et al. (2011), but the nature of the companion star in this system is uncertain. In many cases, the composition of the emitting plasma (rather than its ionization state) determines the strength of the Fe K emission.
3.3 Ejecta mass
Observational estimates of how much material is ejected by novae provide a fundamental test of nova models. Ejecta masses, when combined with the Galactic nova rate, constrain the contribution of novae to the chemical evolution of the Galaxy, especially isotopes like 7Li, 13C, 15N, 17O (Downen et al., 2013; Li et al., 2016; Molaro et al., 2016). The abundances of these isotopes allow laboratory identification of nova dust grains in meteorites (Iliadis et al., 2018).
We can use values derived from the X-ray spectral fitting as a function of time after outburst to estimate the ejecta mass. We assume that the source of X-rays is embedded deep into the ejecta, shining through most of it (§ 3.5). The ejecta are modelled as a “Hubble flow”, where the mass is expelled in a single impulse and is uniformly distributed over a range of velocities spanning from to . This corresponds to the mass density (e.g., Seaquist & Bode, 2008). For , we take the maximum expansion velocity measured from the wavelength difference between the absorption dip and the emission peak of the P Cygni profiles of Balmer lines, km s-1 (measured around d; Aydi et al. 2020, Harvey et al. 2020, in prep.). In the Hubble flow model the slower moving ejecta will dominate the at later epochs, when the faster moving ejecta have dispersed; the total ejecta mass in this model critically depends on the choice of . Following Chomiuk et al. (2014b) we assume which is in the middle of the range of values reported in the literature from modelling the multi-frequency radio lightcurves of novae (Seaquist & Bode, 2008; Weston et al., 2016a, b; Finzell et al., 2018); see Appendix A.
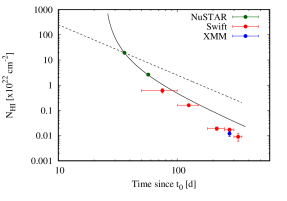
We apply the Hubble flow model to the evolution derived from the NuSTAR spectra fitted with the preferred model (Fig. 6). Assuming that the ejecta began expanding at , there is no acceptable fit to the evolution (see dashed line in Fig. 6). A good fit can be achieved if we assume that the mass was ejected at d (solid curve in Fig. 6). Other novae have shown evidence for ejection of mass delayed weeks to months after the start of outburst: V2362 Cyg (Kimeswenger et al., 2008; Lynch et al., 2008; Arai et al., 2010), T Pyx (Nelson et al., 2014; Chomiuk et al., 2014b) and V959 Mon (Chomiuk et al. 2014a; Linford et al. 2015, Nelson et al. 2020 in prep.). In this model, the ejecta mass is M⊙ assuming spherical symmetry and the range of expansion velocities between km s-1 and . The ejecta mass estimate strongly depends on these assumptions. Setting km s-1 (the slow component observed by Aydi et al. 2020) would decrease the ejecta mass estimate by a factor of 20. Setting would increase the mass estimate by a factor of four. In the above ejecta mass calculation we counted only the hydrogen atoms. The hydrogen mass should be multiplied by a factor of 1.90 for the derived nova abundances (Table 3; the factor would be 1.36 for the solar abundances of Asplund et al. 2009).
Taking into account the chemical composition of the ejecta and setting is needed to reconcile the above X-ray absorption-based ejecta mass estimate with the lower limit of M⊙ derived from radio observations of V906 Car by Aydi et al. (2020) and the optical spectroscopy-based estimate of M⊙ by Pavana et al. (2020). Alternatively, the discrepancy may be attributed to the X-ray emitting region being located above a considerable part of the ejecta (§ 3.5) or ejecta being asymmetric (our line of sight may have less-than-average amount of X-ray absorbing material). Ejecta mass estimates from the radio lightcurve and optical spectroscopy are also subject to their own model assumptions (such as clumpiness and temperature distribution).
Our conclusion about the delayed ejection depends on the assumption of a one-time ejection with a range of velocities. Other scenarios may not require the delayed ejection and imply substantially different ejecta mass given the same observed . The mass may be continuously ejected over an extended period of time. The ejecta may experience (a period of) continuous acceleration (e.g. slow circumbinary material gradually pushed away by the fast white dwarf wind). The ejecta may be asymmetric. The observation that values measured with Swift and XMM-Newton up to d generally follow the trend predicted by the delayed one-time ejection model fitting NuSTAR observations on d and d (Fig. 6) suggests, that this simple model may be a reasonable approximation of the actual ejection.
3.4 The ratio
The ratio between the X-ray luminosity, , and -ray luminosity, , provides insights into the physics of shocks in novae.
3.4.1 Non-thermal X-rays
Vurm & Metzger (2018) discuss the possibility of non-thermal X-rays in novae, predicting the spectral slope (; § 1.6) in the hard X-ray band ( keV). The observed NuSTAR spectrum of V906 Car is very soft, having when fit with a single power-law (§ 2.1). This supports the interpretation that the observed X-ray emission is thermal, rather than non-thermal. Another key prediction of Vurm & Metzger (2018) is the existence of a lower limit on the ratio of non-thermal X-ray to -ray fluxes. In units the limits are for a leptonic origin of -rays, and for the hadronic model.
Table 6 summarizes the available measurements. NuSTAR observations of novae V339 Del and V5668 Sgr, carried out during the GeV-bright phase, yielded non-detections in the hard X-ray band (Mukai et al. in prep.). Vurm & Metzger (2018) used these upper limits on the ratio to suggest that the hadronic rather than leptonic mechanism is responsible for the -ray emission of novae. Nelson et al. (2019) observed the nova V5855 Sgr with NuSTAR twelve days after eruption, while it was still detected in -rays by Fermi/LAT. V5855 Sgr is the first nova in which keV X-rays and -rays were detected simultaneously. The NuSTAR spectrum of V5855 Sgr is mostly featureless and can be fit by either an absorbed bremsstrahlung (all emission in NuSTAR band is thermal) or an absorbed power law (all emission is nonthermal) model. Nelson et al. (2019) prefer the thermal emission model by invoking the spectral slope argument (that low-energy tail of GeV emission should result in a hard NuSTAR spectrum while the best-fitting power law has ). Therefore, the ratio measured by Nelson et al. (2019) is considered by the authors an upper limit on any non-thermal emission (Table 6). This upper limit in V5855 Sgr is consistent with both the leptonic and hadronic scenarios (Vurm & Metzger, 2018).
3.4.2 Thermal X-rays
Thermonuclear reactions heat the white dwarf atmosphere, but only to temperatures keV (Wolf et al., 2013), which is identified with super-soft X-ray emission (§ 1.1). Thermal emission of novae with k keV is attributed to optically-thin shock-heated plasma. The Rankine–Hugoniot conditions for a strong shock propagating in monoatomic gas (with polytropic exponent 5/3) relate the post-shock temperature () to the shock velocity ():
| (2) |
(Equation (30) of Metzger et al. 2014), where is the proton mass, is the Boltzmann constant, is the mean molecular weight. For the fully ionized gas with the solar abundances as derived by Asplund et al. (2009), . Meanwhile, for the nova abundances from Table 3. From (2) we conclude that decreased from 2400 to 1700 km s-1 between the two NuSTAR epochs (Table 2). The shock velocity of 2400 km s-1 observed on day 36 is consistent with the velocity of the fastest wind, which starts around day 23 and remains visible in the optical line profile until at least day 35 (Aydi et al., 2020). The hypothetical second emitting component with k keV considered in the two temperature plasma model described in § 2.1 would correspond to km s-1. We point out that is different from the ejecta expansion velocity, unless the ejecta slam into pre-existing low-velocity material. If the shock is formed at the interface between the slow and fast wind, would correspond to the velocity difference between the two components.
Radiative shocks should produce thermal X-ray emission that is at least 1–2 orders of magnitude brighter (in units) than the GeV emission of the non-thermal particles (Metzger et al., 2015). This is in sharp contrast with our NuSTAR observations, which show that the X-ray emission is almost two orders of magnitude fainter than the Fermi/LAT emission: (§ 3.4.1). A similar discrepancy is reported by Nelson et al. (2019) for V5855 Sgr and even stronger ones are implied by the non-detections of V339 Del and V5668 Sgr (Table 6; Mukai et al. in prep.). Thermal X-rays from the radiative shock can be suppressed thanks to a corrugated shock front geometry (Steinberg & Metzger, 2018) or by redistributing emission thanks to Compton scattering in a highly non-spherical nova ejecta (Nelson et al., 2019). Each of the two effects can suppress the X-ray emission by an order of magnitude, which is still not sufficient to account for the 3–4 orders of magnitude difference between the predictions (Metzger et al., 2015) and observations (Table 6).
The inferred properties of the shock producing the observed thermal X-rays are inconsistent with the inferred properties of the shock accelerating the GeV -ray emitting particles. Earlier, Vlasov et al. (2016) suggested the presence of different shock systems responsible for the thermal X-ray and non-thermal radio emission in novae. The correlated optical and GeV variability seen in two novae by Li et al. (2017) and Aydi et al. (2020), together with GeV-to-optical flux ratios , imply that the majority of GeV-emitting shock energy eventually emerges as radiation. The shock should produce most of its thermal output in X-rays that get absorbed and eventually escape as optical photons (see Sec. 3.1 in Metzger et al., 2014). X-rays from the GeV-emitting shock may be completely hidden from our NuSTAR observations if the emission is sufficiently soft (k keV corresponding to km s-1) and if it disappears before Swift observations can probe these low energies (thanks to decreasing intrinsic absorption), after d.
3.5 Location of the X-ray emitting shock
The location of the X-ray emitting shock with respect to the binary system, the expanding nova ejecta and the -ray emitting shock is unclear. Here we discuss a few possibilities.
Metzger et al. (2014) consider the collision of nova ejecta with a dense external shell and suggest the forward shock as the source of X-rays. There is no widely accepted observational evidence for the existence of dense circumbinary material in classical nova systems (with a dwarf donor; Harrison et al. 2013a; Hoard et al. 2014, but see McLoughlin et al. 2020), however such material clearly exists in symbiotic systems (with giant donors; e.g., Seaquist & Taylor 1990).
Optical spectroscopy has long indicated that, in many cases, nova outbursts produce multiple ejections with different velocities (e.g., McLaughlin, 1944; Friedjung, 1966, 2011; Aydi et al., 2019). Aydi et al. (2020b in prep.) argue that the presence of at least two physically distinct outflows is a common feature of novae. Collision between a high-velocity wind that catches up with a low-velocity ejection launched earlier may produce the shock. A specific variation on the multiple outflows scenario was proposed by Chomiuk et al. (2014a) based on radio imaging of the -ray-detected nova V959 Mon. In this scenario, a slow equatorial outflow is launched at the time of the nova outburst, and is later followed by a fast wind driven by the intense radiation from the white dwarf. The slow outflow is drawn from the puffed-up nova envelope that may remain gravitationally bound to the system, and gradually expands due to energy input from the binary system’s orbital motion (Pejcha et al., 2016), in analogy to the common envelope phase in binary system evolution (Livio et al., 1990; Ivanova et al., 2013). The shocks in this scenario form at the interface between the white dwarf wind and the equatorial outflow.
One could also imagine that the accretion disc around a white dwarf could survive the nova explosion. The presence of accretion discs was reported in novae during the SSS phase (Sala et al., 2010; Walter & Battisti, 2011; Mason & Walter, 2014; Aydi et al., 2018). The shock may form at the interface between the white dwarf wind and the accretion disk. The orbital motion of the donor star within the expanded atmosphere of the nuclear-burning white dwarf may create a bow shock. The expected orbital velocity km s-1 is smaller than the shock velocity derived from the plasma temperature (Eqn. 2) and it should not decrease with time (§ 3.4.2).
Finally, it has been well established that radiation-driven winds of massive stars are clumpy (Martínez-Núñez et al., 2017; Sundqvist et al., 2018). Interaction of the dense clumps with the surrounding low-density wind and with each other produce strong shocks (Owocki et al., 1988; Feldmeier et al., 1997). A hot nuclear-burning white dwarf should drive an intense wind. The combination of bound-free and line opacities is driving the wind of hot massive stars, while in the even hotter novae the dominating opacity mechanism should be Thomson scattering (Shaviv, 2001a). At super-Eddington luminosities found in novae, the Thomson scattering-supported wind should be inhomogeneous, as it originates in an unstable atmosphere (Shaviv, 2001b). Indeed, the ejecta of novae are well-known to be clumpy, as demonstrated by resolved imaging (O’Brien & Bode, 2008) and spectroscopic observations (e.g., Williams, 1994; Shore et al., 2013; Mason et al., 2018). Multiple shocks associated with multiple clumps distributed across the ejecta may give rise to nova X-ray emission (Williams, 2016)—but in this case we might expect shocks at a range of absorbing columns, including some that are relatively unabsorbed even at early times. Nelson et al. (2008) consider this scenario for the X-ray emission of RS Oph with the shocked clumps originating either in the nova ejecta or in the red giant companion wind (red giant winds are reported to be clumpy; Crowley 2006; Espey & Crowley 2008; with maser observations indicating volume filling factors ; Richards et al. 2012).
As we have an estimate of the shock velocity (§ 3.4.2), the X-ray variability time-scale, , can give us a clue about the size of the X-ray emitting region, . The absence of variability on a ks time-scale (§ 2.2) suggests, that on day 36 the X-ray emitting region was 1 AU in size. Alternatively, the emitting region(s) might be small, but produce a stable flux of X-rays, or variations from a large number of emitting regions might average out (Feldmeier et al., 1997).
3.6 The missing SSS phase
A notable feature of V906 Car is the absence of a pronounced boundary between hard and super-soft X-ray emission observed in many other novae (Schwarz et al., 2011; Ness, 2012; Page et al., 2013, 2019). This is apparent from both the spectral fits (Table 5, Fig. 5) and from the absence of an abrupt increase in soft X-rays in Fig. 4. Instead, the soft X-rays gradually brighten as the hard X-rays gradually fade.
The duration, temperature and luminosity of the SSS emission depend on the mass of the white dwarf. Higher mass white dwarfs tend to produce brighter, hotter and more short-lived SSS compared to their low-mass counterparts (Henze et al., 2011; Wolf et al., 2013; Wolf, 2017). The absence of SSS emission in V906 Car suggests that it either ended before the nova ejecta became transparent to soft X-rays (a short-lived SSS implies a high mass of the white dwarf) or that the SSS emission was sufficiently faint and soft to be completely hidden by the Galactic absorption (§ 1.5) implying a low-mass white dwarf. The support the latter possibility comes from the CO composition of the white dwarf (§ 3.1) together with the slow decline of the nova (Yaron et al., 2005; Shara et al., 2017) and the slow ejecta velocities observed from the optical spectral lines (Kovetz & Prialnik, 1985; Friedjung, 1992; Kato & Hachisu, 1994) which are associated with a low-mass white dwarf.
Another speculative possibility is that the shock-heated region may be so close to the white dwarf (i.e., the surviving accretion disc scenario in § 3.5) that shock energy may contribute to heating the outer layers of the white dwarf. In this scenario, shocks and nuclear burning heat essentially the same region of plasma near the surface of the white dwarf, blurring the boundary between the shock-powered and SSS emission. The blackbody fits to the Swift/XRT spectra after d result in k keV (Table 5), i.e. qualifying as SSS emission (according to an observational definition; § 1.1, 3.4.2), but are still considerably hotter than the emission expected even from a very massive white dwarf (Wolf et al., 2013).
4 Conclusions
We conducted a joint analysis of NuSTAR, XMM-Newton, Swift and Fermi/LAT observations of nova V906 Car. The observation 36 days after the explosion was only the second simultaneous NuSTAR/Fermi detection (out of four classical novae observed – Table 6). Our conclusions can be summarized as follows:
- •
-
•
The nova ejecta have highly non-solar abundances, consistent with ejection from the surface of a CO white dwarf (§ 3.1).
-
•
V906 Car does not show distinct SSS emission, which may be an indication of a low white dwarf mass (§ 3.6). Instead, the X-ray spectral evolution of V906 Car can be described as a single optically-thin thermal emission component of gradually decreasing temperature hidden behind a column density that is also decreasing with time (§ 2.5).
-
•
The evolution of the absorbing column with time (Fig. 6) implies that M⊙ (corrected for heavy element abundances; § 3.3) were ejected 24 days after the start of the eruption. Gradual acceleration of the ejecta and ejection over a prolonged period of time are the alternative to the late ejection scenario.
-
•
The absence of variability on ks time-scale in the NuSTAR band suggests that the X-ray emitting region is larger than 1 AU (§ 3.5).
-
•
Contrary to theoretical expectations, the thermal hard X-ray emission observed by NuSTAR is much fainter (in units) than the simultaneous GeV -ray emission (; § 3.4). V906 Car is the fourth -ray emitting nova to demonstrate such low (Table 6). The low X-ray luminosity may indicate that the shocks responsible for the X-ray emission are not the same as the ones accelerating GeV-emitting particles, that X-rays are suppressed in nova radiative shocks, that particle acceleration is surprising efficient, and/or that the radiative shock approximation is not applicable to these shocks (§ 3.4.2).
-
•
The non-thermal hard X-ray emission contribution is constrained at . This rules out leptonic models of the nova GeV emission (§ 3.4.1).
Future Very Long Baseline Interferometry (VLBI) radio observations may image synchrotron emission of the accelerated particles and pinpoint the location and geometry of -ray and X-ray emitting shocks (however, free-free absorption and synchrotron self-absorption may hamper early radio imaging). Simultaneous GeV and hard X-ray observations of future novae may provide further insights into the “missing X-rays” problem (both thermal and non-thermal). The ultimate proof for hadronic mechanism of the GeV emission will be detection of neutrino emission from a nova.
Data availability
The processed data underlying this work are available at the request to the first author and here666http://scan.sai.msu.ru/~kirx/data/V906_Car__public_data/. The raw data are publicly available at NuSTAR, XMM-Newton, Swift and Fermi science archives.
Acknowledgements
KVS thanks Dr. Victoria Grinberg for drawing attention to the problem of clumpy stellar winds and Dr. Marina Orio for pointing out the report of possible X-ray fireball detection. We thank the anonymous referee for the very useful comments. This material is based upon work supported by the National Science Foundation under Grant No. AST-1751874. We acknowledge support for this work from NASA grants Fermi/80NSSC18K1746 and NuSTAR/80NSSC19K0522 and from a Cottrell Scholarship from the Research Corporation. KLP acknowledges support from the UK Space Agency. JS acknowledges support from the Packard Foundation. KLL is supported by the Ministry of Science and Technology of the Republic of China (Taiwan) through grant 108-2112-M-007-025-MY3. IV acknowledges support by the Estonian Research Council grants IUT26-2 and IUT40-2, and by the European Regional Development Fund (TK133).
References
- Abdo et al. (2009) Abdo A. A., et al., 2009, Astroparticle Physics, 32, 193
- Abdo et al. (2010) Abdo A. A., et al., 2010, Science, 329, 817
- Ackermann et al. (2012) Ackermann M., et al., 2012, ApJS, 203, 4
- Ackermann et al. (2014) Ackermann M., et al., 2014, Science, 345, 554
- Arai et al. (2010) Arai A., et al., 2010, PASJ, 62, 1103
- Arkhipova et al. (1997) Arkhipova V. P., Esipov V. F., Sokol G. V., 1997, Astronomy Letters, 23, 713
- Arkhipova et al. (2002) Arkhipova V. P., Burlak M. A., Esipov V. F., 2002, Astronomy Letters, 28, 100
- Arnaud (1996) Arnaud K. A., 1996, in Jacoby G. H., Barnes J., eds, Astronomical Society of the Pacific Conference Series Vol. 101, Astronomical Data Analysis Software and Systems V. p. 17
- Arnaud et al. (2011) Arnaud K., Smith R., Siemiginowska A., 2011, Handbook of X-ray Astronomy
- Asplund et al. (2009) Asplund M., Grevesse N., Sauval A. J., Scott P., 2009, ARA&A, 47, 481
- Atwood et al. (2009) Atwood W. B., et al., 2009, ApJ, 697, 1071
- Audard et al. (2001) Audard M., Behar E., Güdel M., Raassen A. J. J., Porquet D., Mewe R., Foley C. R., Bromage G. E., 2001, A&A, 365, L329
- Austin et al. (1996) Austin S. J., Wagner R. M., Starrfield S., Shore S. N., Sonneborn G., Bertram R., 1996, AJ, 111, 869
- Aydi et al. (2018) Aydi E., et al., 2018, MNRAS, 480, 572
- Aydi et al. (2019) Aydi E., et al., 2019, arXiv e-prints, p. arXiv:1903.09232
- Aydi et al. (2020) Aydi E., et al., 2020, Nature Astronomy,
- Bailer-Jones et al. (2018) Bailer-Jones C. A. L., Rybizki J., Fouesneau M., Mantelet G., Andrae R., 2018, AJ, 156, 58
- Bajaja et al. (2005) Bajaja E., Arnal E. M., Larrarte J. J., Morras R., Pöppel W. G. L., Kalberla P. M. W., 2005, A&A, 440, 767
- Balucinska-Church & McCammon (1992) Balucinska-Church M., McCammon D., 1992, ApJ, 400, 699
- Barthelmy et al. (2005) Barthelmy S. D., et al., 2005, Space Sci. Rev., 120, 143
- Blandford (1994) Blandford R. D., 1994, ApJS, 90, 515
- Bode & Evans (2008) Bode M. F., Evans A., 2008, Classical Novae
- Boettcher (2010) Boettcher M., 2010, arXiv e-prints, p. arXiv:1006.5048
- Brickhouse et al. (2005) Brickhouse N. S., Desai P., Hoogerwerf R., Liedahl D. A., Smith R. K., 2005, in Smith R., ed., American Institute of Physics Conference Series Vol. 774, X-ray Diagnostics of Astrophysical Plasmas: Theory, Experiment, and Observation. pp 405–407, doi:10.1063/1.1960961
- Burrows et al. (2005) Burrows D. N., et al., 2005, Space Sci. Rev., 120, 165
- Caprioli & Spitkovsky (2014) Caprioli D., Spitkovsky A., 2014, ApJ, 783, 91
- Casanova et al. (2011) Casanova J., José J., García-Berro E., Shore S. N., Calder A. C., 2011, Nature, 478, 490
- Casanova et al. (2016) Casanova J., José J., García-Berro E., Shore S. N., 2016, A&A, 595, A28
- Casanova et al. (2018) Casanova J., José J., Shore S. N., 2018, A&A, 619, A121
- Chang et al. (2017) Chang J., et al., 2017, Astroparticle Physics, 95, 6
- Chen et al. (2019) Chen B. Q., et al., 2019, MNRAS, 483, 4277
- Cheung et al. (2016) Cheung C. C., et al., 2016, ApJ, 826, 142
- Chomiuk et al. (2014a) Chomiuk L., et al., 2014a, Nature, 514, 339
- Chomiuk et al. (2014b) Chomiuk L., et al., 2014b, ApJ, 788, 130
- Corbett et al. (2018) Corbett H., Law N., Goeke E., Ratzloff J., Howard W., Fors O., del Ser D., Quimby R. M., 2018, The Astronomer’s Telegram, 11467, 1
- Crowley (2006) Crowley C., 2006, PhD thesis, School of Physics, Trinity College Dublin, Dublin 2, Ireland Ireland
- Delgado & Hernanz (2019) Delgado L., Hernanz M., 2019, MNRAS, 490, 3691
- Della Valle & Izzo (2020) Della Valle M., Izzo L., 2020, A&ARv, 28, 3
- Domingo et al. (2018) Domingo A., Hernanz M., Kuulkers E., Kuin P., 2018, The Astronomer’s Telegram, 11677, 1
- Downen et al. (2013) Downen L. N., Iliadis C., José J., Starrfield S., 2013, ApJ, 762, 105
- Drake et al. (2014) Drake J. J., Starrfield S., Osborne J.-U. N. J. P., Page K., Shore S. N., Wagner R. M., Woodward C. E., 2014, The Astronomer’s Telegram, 5920
- Espey & Crowley (2008) Espey B. R., Crowley C., 2008, Mass-loss from Red Giants. p. 166
- Evans & Rawlings (2008) Evans E., Rawlings J. M. C., 2008, in Bode M. F., Evans A., eds, Classical Novae. pp 308–334
- Feldmeier et al. (1997) Feldmeier A., Puls J., Pauldrach A. W. A., 1997, A&A, 322, 878
- Finzell et al. (2018) Finzell T., et al., 2018, ApJ, 852, 108
- Franckowiak et al. (2018) Franckowiak A., Jean P., Wood M., Cheung C. C., Buson S., 2018, A&A, 609, A120
- Friedjung (1966) Friedjung M., 1966, MNRAS, 132, 317
- Friedjung (1992) Friedjung M., 1992, A&A, 262, 487
- Friedjung (2011) Friedjung M., 2011, A&A, 536, A97
- Friedman et al. (2011) Friedman S. D., et al., 2011, ApJ, 727, 33
- Gehrels (1997) Gehrels N., 1997, Nuovo Cimento B Serie, 112B, 11
- Gehrels et al. (2004) Gehrels N., et al., 2004, ApJ, 611, 1005
- Gehrz et al. (1998) Gehrz R. D., Truran J. W., Williams R. E., Starrfield S., 1998, PASP, 110, 3
- Ghisellini (2013) Ghisellini G., 2013, Radiative Processes in High Energy Astrophysics. 0 Vol. 873, doi:10.1007/978-3-319-00612-3,
- Gomez-Gomar et al. (1998) Gomez-Gomar J., Hernanz M., Jose J., Isern J., 1998, MNRAS, 296, 913
- Güver & Özel (2009) Güver T., Özel F., 2009, MNRAS, 400, 2050
- Hachisu & Kato (2014) Hachisu I., Kato M., 2014, ApJ, 785, 97
- Harrison et al. (2013a) Harrison T. E., Hamilton R. T., Tappert C., Hoffman D. I., Campbell R. K., 2013a, AJ, 145, 19
- Harrison et al. (2013b) Harrison F. A., et al., 2013b, ApJ, 770, 103
- Hartmann & Kenyon (1996) Hartmann L., Kenyon S. J., 1996, ARA&A, 34, 207
- Hasinger (1994) Hasinger G., 1994, Reviews in Modern Astronomy, 7, 129
- Hayward et al. (1996) Hayward T. L., et al., 1996, ApJ, 469, 854
- Helton et al. (2012) Helton L. A., et al., 2012, ApJ, 755, 37
- Henze et al. (2011) Henze M., et al., 2011, A&A, 533, A52
- Henze et al. (2014) Henze M., et al., 2014, A&A, 563, A2
- Hernanz (2014) Hernanz M., 2014, in Woudt P. A., Ribeiro V. A. R. M., eds, Astronomical Society of the Pacific Conference Series Vol. 490, Stellar Novae: Past and Future Decades. p. 319 (arXiv:1305.0769)
- Hernanz & José (2006) Hernanz M., José J., 2006, New Astron. Rev., 50, 504
- Hernanz & Sala (2005) Hernanz M., Sala G., 2005, in Hameury J. M., Lasota J. P., eds, Astronomical Society of the Pacific Conference Series Vol. 330, The Astrophysics of Cataclysmic Variables and Related Objects. p. 447 (arXiv:astro-ph/0410105)
- Hernanz & Sala (2010) Hernanz M., Sala G., 2010, Astronomische Nachrichten, 331, 169
- Hernanz et al. (2002) Hernanz M., et al., 2002, in Hernanz M., José J., eds, American Institute of Physics Conference Series Vol. 637, Classical Nova Explosions. pp 435–439, doi:10.1063/1.1518243
- Heywood et al. (2005) Heywood I., O’Brien T. J., Eyres S. P. S., Bode M. F., Davis R. J., 2005, MNRAS, 362, 469
- Hjellming (1996) Hjellming R. M., 1996, in Taylor A. R., Paredes J. M., eds, Astronomical Society of the Pacific Conference Series Vol. 93, Radio Emission from the Stars and the Sun. p. 174
- Hjellming et al. (1979) Hjellming R. M., Wade C. M., Vandenberg N. R., Newell R. T., 1979, AJ, 84, 1619
- Hoard et al. (2014) Hoard D. W., et al., 2014, ApJ, 786, 68
- Iliadis et al. (2018) Iliadis C., Downen L. N., José J., Nittler L. R., Starrfield S., 2018, ApJ, 855, 76
- Imbriani et al. (2004) Imbriani G., et al., 2004, A&A, 420, 625
- Ivanova et al. (2013) Ivanova N., et al., 2013, A&ARv, 21, 59
- Ivinson et al. (1993) Ivinson R. J., Hughes D. H., Lloyd H. M., Bang M. K., Bode M. F., 1993, MNRAS, 263, L43
- Izzo et al. (2018) Izzo L., et al., 2018, The Astronomer’s Telegram, 11468, 1
- Jansen et al. (2001) Jansen F., et al., 2001, A&A, 365, L1
- Jean et al. (2018) Jean P., Cheung C. C., Ojha R., van Zyl P., Angioni R., 2018, The Astronomer’s Telegram, 11546
- Jose (2016) Jose J., 2016, Stellar Explosions: Hydrodynamics and Nucleosynthesis, doi:10.1201/b19165.
- Joye & Mandel (2003) Joye W. A., Mandel E., 2003, New Features of SAOImage DS9. p. 489
- Kahabka & van den Heuvel (1997) Kahabka P., van den Heuvel E. P. J., 1997, ARA&A, 35, 69
- Kalberla et al. (2005) Kalberla P. M. W., Burton W. B., Hartmann D., Arnal E. M., Bajaja E., Morras R., Pöppel W. G. L., 2005, A&A, 440, 775
- Kato & Hachisu (1994) Kato M., Hachisu I., 1994, ApJ, 437, 802
- Kato et al. (2016) Kato M., et al., 2016, ApJ, 830, 40
- Kellogg et al. (1975) Kellogg E., Baldwin J. R., Koch D., 1975, ApJ, 199, 299
- Kimeswenger et al. (2008) Kimeswenger S., Dalnodar S., Knapp A., Schafer J., Unterguggenberger S., Weiss S., 2008, A&A, 479, L51
- Kochanek et al. (2017) Kochanek C. S., et al., 2017, PASP, 129, 104502
- Kovetz & Prialnik (1985) Kovetz A., Prialnik D., 1985, ApJ, 291, 812
- Krautter (2002) Krautter J., 2002, in Hernanz M., José J., eds, American Institute of Physics Conference Series Vol. 637, Classical Nova Explosions. pp 345–354, doi:10.1063/1.1518228
- Krautter (2008) Krautter J., 2008, in Bode M. F., Evans A., eds, Classical Novae. pp 232–251
- Kuschnig et al. (2018) Kuschnig R., et al., 2018, The Astronomer’s Telegram, 11508, 1
- Li et al. (2012) Li K. L., et al., 2012, ApJ, 761, 99
- Li et al. (2016) Li F., Zhu C., Lü G., Wang Z., 2016, PASJ, 68, 39
- Li et al. (2017) Li K.-L., et al., 2017, Nature Astronomy, 1, 697
- Liedahl et al. (1995) Liedahl D. A., Osterheld A. L., Goldstein W. H., 1995, ApJ, 438, L115
- Linford et al. (2015) Linford J. D., et al., 2015, ApJ, 805, 136
- Livio & Truran (1994) Livio M., Truran J. W., 1994, ApJ, 425, 797
- Livio et al. (1990) Livio M., Shankar A., Burkert A., Truran J. W., 1990, ApJ, 356, 250
- Livio et al. (1992) Livio M., Mastichiadis A., Oegelman H., Truran J. W., 1992, ApJ, 394, 217
- Lodders (2003) Lodders K., 2003, ApJ, 591, 1220
- Luckas (2018) Luckas P., 2018, The Astronomer’s Telegram, 11460
- Lynch et al. (2008) Lynch D. K., et al., 2008, AJ, 136, 1815
- Madsen et al. (2015) Madsen K. K., et al., 2015, ApJS, 220, 8
- Martin et al. (2018) Martin P., Dubus G., Jean P., Tatischeff V., Dosne C., 2018, A&A, 612, A38
- Martínez-Núñez et al. (2017) Martínez-Núñez S., et al., 2017, Space Sci. Rev., 212, 59
- Mason & Walter (2014) Mason E., Walter F. M., 2014, Lesson Learned from (some) Recurrent Novae. p. 199
- Mason et al. (2001) Mason K. O., et al., 2001, A&A, 365, L36
- Mason et al. (2018) Mason E., Shore S. N., De Gennaro Aquino I., Izzo L., Page K., Schwarz G. J., 2018, ApJ, 853, 27
- Mattox et al. (1996) Mattox J. R., et al., 1996, ApJ, 461, 396
- McLaughlin (1944) McLaughlin D. B., 1944, Popular Astronomy, 52, 109
- McLoughlin et al. (2020) McLoughlin D., Blundell K. M., Lee S., 2020, MNRAS, 494, 743
- Merloni et al. (2012) Merloni A., et al., 2012, arXiv e-prints,
- Metzger et al. (2014) Metzger B. D., Hascoët R., Vurm I., Beloborodov A. M., Chomiuk L., Sokoloski J. L., Nelson T., 2014, MNRAS, 442, 713
- Metzger et al. (2015) Metzger B. D., Finzell T., Vurm I., Hascoët R., Beloborodov A. M., Chomiuk L., 2015, MNRAS, 450, 2739
- Metzger et al. (2016) Metzger B. D., Caprioli D., Vurm I., Beloborodov A. M., Bartos I., Vlasov A., 2016, MNRAS, 457, 1786
- Mewe et al. (1985) Mewe R., Gronenschild E. H. B. M., van den Oord G. H. J., 1985, A&AS, 62, 197
- Molaro et al. (2016) Molaro P., Izzo L., Mason E., Bonifacio P., Della Valle M., 2016, MNRAS, 463, L117
- Morii et al. (2013) Morii M., et al., 2013, ApJ, 779, 118
- Morii et al. (2016) Morii M., Yamaoka H., Mihara T., Matsuoka M., Kawai N., 2016, PASJ, 68, S11
- Mukai (2017) Mukai K., 2017, PASP, 129, 062001
- Mukai & Ishida (2001) Mukai K., Ishida M., 2001, ApJ, 551, 1024
- Mukai et al. (2014) Mukai K., et al., 2014, in Woudt P. A., Ribeiro V. A. R. M., eds, Astronomical Society of the Pacific Conference Series Vol. 490, Stellar Novae: Past and Future Decades. p. 327
- Munari et al. (2017) Munari U., Hambsch F. J., Frigo A., 2017, MNRAS, 469, 4341
- Negoro et al. (2016) Negoro H., et al., 2016, PASJ, 68, S1
- Nelson et al. (2008) Nelson T., Orio M., Cassinelli J. P., Still M., Leibowitz E., Mucciarelli P., 2008, ApJ, 673, 1067
- Nelson et al. (2012) Nelson T., Donato D., Mukai K., Sokoloski J., Chomiuk L., 2012, ApJ, 748, 43
- Nelson et al. (2014) Nelson T., et al., 2014, ApJ, 785, 78
- Nelson et al. (2018) Nelson T., Mukai K., Sokoloski J. L., Metzger B., Chomiuk L., Linford J., Vurm I., 2018, The Astronomer’s Telegram, 11608, 1
- Nelson et al. (2019) Nelson T., et al., 2019, ApJ, 872, 86
- Nemeth (2010) Nemeth P., 2010, PhD thesis, Florida Institute of Technology
- Ness (2012) Ness J. U., 2012, Bulletin of the Astronomical Society of India, 40, 353
- Ness et al. (2005) Ness J.-U., Starrfield S., Jordan C., Krautter J., Schmitt J. H. M. M., 2005, MNRAS, 364, 1015
- Ness et al. (2007) Ness J.-U., Schwarz G. J., Retter A., Starrfield S., Schmitt J. H. M. M., Gehrels N., Burrows D., Osborne J. P., 2007, ApJ, 663, 505
- Ness et al. (2009) Ness J. U., et al., 2009, AJ, 137, 3414
- O’Brien & Bode (2008) O’Brien T. J., Bode M. F., 2008, in Bode M. F., Evans A., eds, Classical Novae. pp 285–307
- O’Brien et al. (1994) O’Brien T. J., Lloyd H. M., Bode M. F., 1994, MNRAS, 271, 155
- Orio et al. (2001) Orio M., et al., 2001, MNRAS, 326, L13
- Orio et al. (2015) Orio M., Rana V., Page K. L., Sokoloski J., Harrison F., 2015, MNRAS, 448, L35
- Orlando & Drake (2012) Orlando S., Drake J. J., 2012, MNRAS, 419, 2329
- Owocki et al. (1988) Owocki S. P., Castor J. I., Rybicki G. B., 1988, ApJ, 335, 914
- Pablo et al. (2016) Pablo H., et al., 2016, PASP, 128, 125001
- Page et al. (2013) Page K. L., Osborne J. P., Wagner R. M., Beardmore A. P., Shore S. N., Starrfield S., Woodward C. E., 2013, ApJ, 768, L26
- Page et al. (2015) Page K. L., et al., 2015, MNRAS, 454, 3108
- Page et al. (2019) Page K. L., Beardmore A. P., Osborne J. P., 2019, arXiv e-prints, p. arXiv:1908.02004
- Pastorello et al. (2019) Pastorello A., et al., 2019, A&A, 630, A75
- Pavana et al. (2020) Pavana M., Raj A., Bohlsen T., Anupama G. C., Gupta R., Selvakumar G., 2020, MNRAS, 495, 2075
- Pejcha et al. (2016) Pejcha O., Metzger B. D., Tomida K., 2016, MNRAS, 461, 2527
- Peretz et al. (2016) Peretz U., Orio M., Behar E., Bianchini A., Gallagher J., Rauch T., Tofflemire B., Zemko P., 2016, ApJ, 829, 2
- Piano et al. (2018) Piano G., et al., 2018, The Astronomer’s Telegram, 11553, 1
- Poggiani (2018) Poggiani R., 2018, arXiv e-prints, p. arXiv:1803.11529
- Popowicz et al. (2017) Popowicz A., et al., 2017, A&A, 605, A26
- Poznanski et al. (2012) Poznanski D., Prochaska J. X., Bloom J. S., 2012, MNRAS, 426, 1465
- Predehl et al. (2016) Predehl P., et al., 2016, in Space Telescopes and Instrumentation 2016: Ultraviolet to Gamma Ray. p. 99051K, doi:10.1117/12.2235092
- Rabus & Prieto (2018) Rabus M., Prieto J. L., 2018, The Astronomer’s Telegram, 11506, 1
- Rauch et al. (2010) Rauch T., Orio M., Gonzales-Riestra R., Nelson T., Still M., Werner K., Wilms J., 2010, ApJ, 717, 363
- Ribeiro et al. (2014) Ribeiro V. A. R. M., et al., 2014, ApJ, 792, 57
- Richards et al. (2012) Richards A. M. S., Etoka S., Gray M. D., Lekht E. E., Mendoza-Torres J. E., Murakawa K., Rudnitskij G., Yates J. A., 2012, A&A, 546, A16
- Rohrbach et al. (2009) Rohrbach J. G., Ness J. U., Starrfield S., 2009, AJ, 137, 4627
- Roming et al. (2005) Roming P. W. A., et al., 2005, Space Sci. Rev., 120, 95
- Roy et al. (2012) Roy N., et al., 2012, Bulletin of the Astronomical Society of India, 40, 293
- Rupen et al. (2008) Rupen M. P., Mioduszewski A. J., Sokoloski J. L., 2008, ApJ, 688, 559
- Ryder et al. (2018) Ryder S. D., Kool E. C., Chomiuk L., 2018, The Astronomer’s Telegram, 11504, 1
- Sala et al. (2010) Sala G., Hernanz M., Ferri C., Greiner J., 2010, in Comastri A., Angelini L., Cappi M., eds, American Institute of Physics Conference Series Vol. 1248, X-ray Astronomy 2009; Present Status, Multi-Wavelength Approach and Future Perspectives. pp 197–198, doi:10.1063/1.3475202
- Schlafly & Finkbeiner (2011) Schlafly E. F., Finkbeiner D. P., 2011, ApJ, 737, 103
- Schultz & Wiemer (1975) Schultz G. V., Wiemer W., 1975, A&A, 43, 133
- Schwarz et al. (2001) Schwarz G. J., Shore S. N., Starrfield S., Hauschildt P. H., Della Valle M., Baron E., 2001, MNRAS, 320, 103
- Schwarz et al. (2011) Schwarz G. J., et al., 2011, ApJS, 197, 31
- Seaquist & Bode (2008) Seaquist E. R., Bode M. F., 2008, in Bode M. F., Evans A., eds, Classical Novae. pp 141–166
- Seaquist & Taylor (1990) Seaquist E. R., Taylor A. R., 1990, ApJ, 349, 313
- Shappee et al. (2014) Shappee B. J., et al., 2014, ApJ, 788, 48
- Shara et al. (2017) Shara M. M., et al., 2017, ApJ, 839, 109
- Shara et al. (2018) Shara M. M., Prialnik D., Hillman Y., Kovetz A., 2018, ApJ, 860, 110
- Shaviv (2001a) Shaviv N. J., 2001a, MNRAS, 326, 126
- Shaviv (2001b) Shaviv N. J., 2001b, ApJ, 549, 1093
- Shore et al. (2013) Shore S. N., De Gennaro Aquino I., Schwarz G. J., Augusteijn T., Cheung C. C., Walter F. M., Starrfield S., 2013, A&A, 553, A123
- Siegert et al. (2018) Siegert T., et al., 2018, A&A, 615, A107
- Slane et al. (2015) Slane P., Bykov A., Ellison D. C., Dubner G., Castro D., 2015, Space Sci. Rev., 188, 187
- Sokolovsky et al. (2017) Sokolovsky K. V., et al., 2017, MNRAS, 464, 274
- Stanek et al. (2018) Stanek K. Z., et al., 2018, The Astronomer’s Telegram, 11454, 1
- Starrfield et al. (1972) Starrfield S., Truran J. W., Sparks W. M., Kutter G. S., 1972, ApJ, 176, 169
- Starrfield et al. (2008) Starrfield S., Iliadis C., Hix W. R., 2008, in Bode M. F., Evans A., eds, Classical Novae. pp 77–101
- Starrfield et al. (2016) Starrfield S., Iliadis C., Hix W. R., 2016, PASP, 128, 051001
- Steinberg & Metzger (2018) Steinberg E., Metzger B. D., 2018, MNRAS, 479, 687
- Steinberg & Metzger (2020) Steinberg E., Metzger B. D., 2020, MNRAS, 491, 4232
- Steiner et al. (1999) Steiner J. E., Campos R., Cieslinski D., 1999, IAU Circ., 7185, 2
- Strader et al. (2018) Strader J., Chomiuk L., Holoien T. W. S., Prieto J. L., Stanek K. Z., Shappee B. J., Dong S., 2018, The Astronomer’s Telegram, 11456, 1
- Strüder et al. (2001) Strüder L., et al., 2001, A&A, 365, L18
- Sundqvist et al. (2018) Sundqvist J. O., Owocki S. P., Puls J., 2018, A&A, 611, A17
- Suzuki & Shigeyama (2010) Suzuki A., Shigeyama T., 2010, ApJ, 723, L84
- Takei et al. (2009) Takei D., Tsujimoto M., Kitamoto S., Ness J.-U., Drake J. J., Takahashi H., Mukai K., 2009, ApJ, 697, L54
- Takei et al. (2011) Takei D., Ness J.-U., Tsujimoto M., Kitamoto S., Drake J. J., Osborne J. P., Takahashi H., Kinugasa K., 2011, PASJ, 63, S729
- Tamuz et al. (2006) Tamuz O., Mazeh T., North P., 2006, MNRAS, 367, 1521
- Tavani et al. (2008) Tavani M., et al., 2008, Nuclear Instruments and Methods in Physics Research A, 588, 52
- Tavani et al. (2009) Tavani M., et al., 2009, A&A, 502, 995
- Thompson et al. (1993) Thompson D. J., et al., 1993, ApJS, 86, 629
- Toumilovitch et al. (2018) Toumilovitch O., Blane D., Rijsdijk C., 2018, Monthly Notes of the Astronomical Society of South Africa, 77, 25
- Truran & Livio (1986) Truran J. W., Livio M., 1986, ApJ, 308, 721
- Turner et al. (2001) Turner M. J. L., et al., 2001, A&A, 365, L27
- Vanlandingham et al. (2005) Vanlandingham K. M., Schwarz G. J., Shore S. N., Starrfield S., Wagner R. M., 2005, ApJ, 624, 914
- Vlasov et al. (2016) Vlasov A., Vurm I., Metzger B. D., 2016, MNRAS, 463, 394
- Vurm & Metzger (2018) Vurm I., Metzger B. D., 2018, ApJ, 852, 62
- Wall & Jenkins (2003) Wall J. V., Jenkins C. R., 2003, Practical Statistics for Astronomers. 0 Vol. 3
- Walter & Battisti (2011) Walter F. M., Battisti A., 2011, in American Astronomical Society Meeting Abstracts #217. p. 338.11
- Weiss et al. (2014) Weiss W. W., et al., 2014, PASP, 126, 573
- Wendeln et al. (2017) Wendeln C., Chomiuk L., Finzell T., Linford J. D., Strader J., 2017, ApJ, 840, 110
- Weston (2016) Weston J. H. S., 2016, PhD thesis, Columbia University
- Weston et al. (2016a) Weston J. H. S., et al., 2016a, MNRAS, 457, 887
- Weston et al. (2016b) Weston J. H. S., et al., 2016b, MNRAS, 460, 2687
- Williams (1985) Williams R. E., 1985, in Danziger I. J., Matteucci F., Kjar K., eds, European Southern Observatory Conference and Workshop Proceedings Vol. 21, European Southern Observatory Conference and Workshop Proceedings. pp 225–232
- Williams (1992) Williams R. E., 1992, AJ, 104, 725
- Williams (1994) Williams R. E., 1994, ApJ, 426, 279
- Williams (2016) Williams R., 2016, in Journal of Physics Conference Series. p. 042001, doi:10.1088/1742-6596/728/4/042001
- Wilms et al. (2000) Wilms J., Allen A., McCray R., 2000, ApJ, 542, 914
- Wolf (2017) Wolf W. M., 2017, PhD thesis, University of California, Santa Barbara
- Wolf et al. (2013) Wolf W. M., Bildsten L., Brooks J., Paxton B., 2013, ApJ, 777, 136
- Yaron et al. (2005) Yaron O., Prialnik D., Shara M. M., Kovetz A., 2005, ApJ, 623, 398
- Zacharias et al. (2010) Zacharias N., et al., 2010, AJ, 139, 2184
- de Diego (2010) de Diego J. A., 2010, AJ, 139, 1269
- della Valle et al. (1999) della Valle M., Pasquini L., Williams R., 1999, IAU Circ., 7193, 1
- den Herder et al. (2001) den Herder J. W., et al., 2001, A&A, 365, L7
- van den Bergh & Younger (1987) van den Bergh S., Younger P. F., 1987, A&AS, 70, 125
Appendix A Estimates of inner/outer shell velocity ratio for the “Hubble flow” model of nova ejecta
Estimates of ratio can be derived from modelling the multi-frequency radio lightcurve of thermal emission from a nova (see Hjellming et al. 1979; Seaquist & Bode 2008; Weston 2016 and appendix A in Finzell et al. 2018). Ribeiro et al. (2014) discussed the effects of the expected bipolar (dumbbell-shaped) geometry of the ejecta on the results of fitting the radio lightcurves with the simple spherically symmetric “Hubble flow” model. They found that the spherical model fits overpredict the ejecta mass by up to a factor of two and underpredict the shell thickness (proportional to the ratio) by up to an order of magnitude (so should be close to ). The magnitude of the discrepancy between the spherical and bipolar models depends mostly on the departure from spherical symmetry and only weakly on inclination. The clumpiness of the nova ejecta is an additional source of uncertainty in modelling (Roy et al., 2012). Shocks within the nova ejecta producing thermal (Metzger et al., 2014) and synchrotron (Vlasov et al., 2016; Steinberg & Metzger, 2020) emission may further complicate modelling of nova radio lightcurves. Table 7 summarizes the values reported in the literature.
| Nova | Reference | |
|---|---|---|
| V1324 Sco | Finzell et al. (2018) | |
| V959 Mon | Chomiuk et al. (2014a) | |
| V5589 Sgr | Weston et al. (2016b) | |
| V1723 Aql | Weston et al. (2016a) | |
| T Pyx | Nelson et al. (2014) | |
| V723 Cas | Heywood et al. (2005) | |
| V1974 Cyg | Hjellming (1996) | |
| V351 Pup | Wendeln et al. (2017) | |
| V838 Her | Hjellming (1996) | |
| V827 Her | Hjellming (1996) | |
| V1819 Cyg | Hjellming (1996) | |
| QU Vul | Hjellming (1996) | |
| V1500 Cyg | Hjellming et al. (1979) | |
| FH Ser | Hjellming et al. (1979) | |
| HR Del | Hjellming et al. (1979) |
a Ivinson et al. (1993) report .
b Hjellming (1996) found .
Column designation: Col. 1 – Nova name; Col. 2 – The velocity ratio derived from the “Hubble flow” model; Col. 3 – Citation.