Detection of Acoustic Plasmons in Hole-Doped Lanthanum and Bismuth Cuprate Superconductors Using Resonant Inelastic X-Ray Scattering
Abstract
High superconductors show a rich variety of phases associated with their charge degrees of freedom. Valence charges can give rise to charge ordering or acoustic plasmons in these layered cuprate superconductors. While charge ordering has been observed for both hole- and electron-doped cuprates, acoustic plasmons have only been found in electron-doped materials. Here, we use resonant inelastic X-ray scattering (RIXS) to observe the presence of acoustic plasmons in two families of hole-doped cuprate superconductors (La1.84Sr0.16CuO4 and Bi2Sr1.6La0.4CuO6+δ), crucially completing the picture. Interestingly, in contrast to the quasi-static charge ordering which manifests at both Cu and O sites, the observed acoustic plasmons are predominantly associated with the O sites, revealing a unique dichotomy in the behaviour of valence charges in hole-doped cuprates.
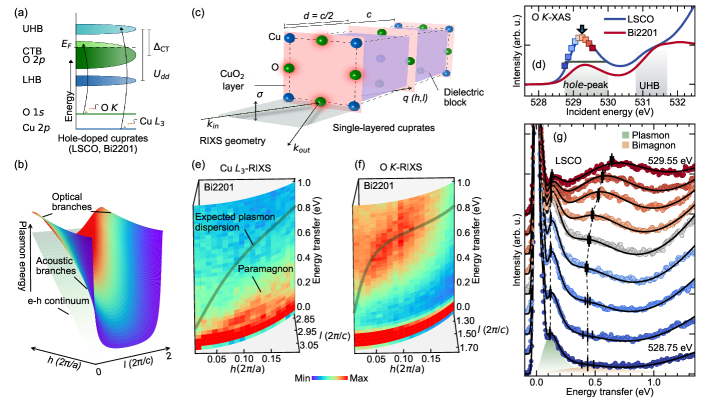
The electronic structure of high temperature superconducting layered-cuprates keimer2015nat may be understood in terms of a hybridisation between the Cu and O orbitals, and a strong on-site Coulomb repulsion between electrons on the Cu sites zaanen1985prl ; emery1987prl ; varma1987ssc ; armitage2010rmp . When holes are introduced (see Fig. 1(a)), they reside preferentially in the so-called “charge-transfer band” (CTB) which is composed primarily of O orbitals chen1991prl . In contrast, doped electrons enter the upper Hubbard band (UHB) and primarily reside on the Cu sites armitage2010rmp . Despite this asymmetry in the electronic structure, charge order, a complex phase of periodically modulated charge-carrier density, has been observed ubiquitously on both the electron- and hole-doped sides of the phase diagram comin2016arcmp .
Surprisingly, a more widely observed mode of collective charge density oscillation, the acoustic plasmon diaconescu2007nat , has been rather elusive for the cuprates. In contrast to three-dimensional (3D) metals, where long-range Coulomb interactions give rise to isotropic long-wavelength optical-like gapped plasmons, out-of-phase oscillations of charges in neighbouring planes of two-dimensional (2D) layered electron gases, form acoustic plasmons, whose energy tends to zero for small in-plane wavevectors (see Fig. 1(b)) fetter1973ap ; fetter1974ap . Due to confinement of the doped-charges to CuO2 planes and poor screening of out-of-plane Coulomb interactions by intervening dielectric blocks (see Fig. 1(c)), acoustic plasmons are also expected in the layered cuprates kresin1988prb ; greco2019cp ; markiewicz2008prb .
A remarkable discovery has been the recent observation of acoustic plasmons in electron-doped La2-xCexCuO4 (LCCO) and Nd2-xCexCuO4 hepting2018nat ; lin2020npj using Cu -RIXS. The excitations were found to have the strong out-of-plane dispersion expected for plasmons in layered systems. The situation in hole-doped cuprates, however, has remained rather controversial. While Cu -RIXS did not detect plasmons in several families lee2014np ; dellea2017prb ; miao2017pnas , O -RIXS did detect excitations in La2-x(Br,Sr)xCuO4 that were interpreted as incoherent intra-band transitions ishii2017prb . In zero-momentum optical investigation of Bi2Sr2CaCu2O8, apart from observation of optical plasmons at 1.1 eV, a low-energy non-Drude behaviour was contemplated to be due to a band of acoustic plasmons bozovic1990prb . However, electron energy-loss spectroscopy, a traditional probe for studying plasmons, observed only a high energy ( 1 eV) overdamped optical plasmon for small in-plane wavevectors in Bi2.1Sr1.9CaCu2O8+δ mitrano2018pnas . Acoustic plasmons in layered systems originate from the presence of conduction electrons and the long-range nature of the Coulomb interaction. Their absence in hole-doped cuprates would conflict with our general understanding of the collective behaviour of the doped-charges.
In this letter we report that acoustic plasmons are indeed present in hole-doped cuprates from an extensive O -RIXS study of La1.84Sr0.16CuO4 (LSCO) and Bi2Sr1.6La0.4CuO6+δ (Bi2201) over a wide range of in- and out-of-plane momenta. The discovery of acoustic plasmons in the hole-doped systems remarkably illustrates the universal existence of low-energy collective excitations besides phonons and spin-fluctuations across the cuprate phase diagram. Surprisingly, the observed acoustic plasmons are predominantly associated with the O sites in these hole-doped cuprates. Our results will therefore stimulate more studies of doped-hole charge dynamics, taking into account the three band model in the cuprates varma1987ssc ; emery1987prl .
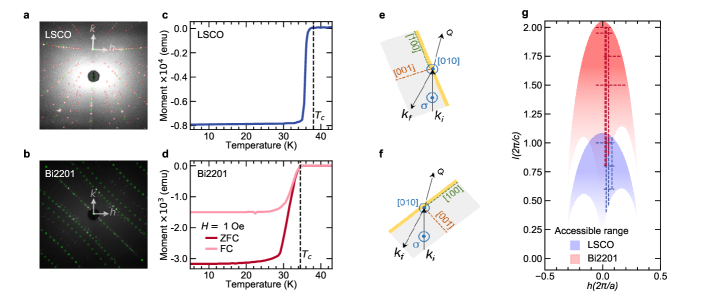
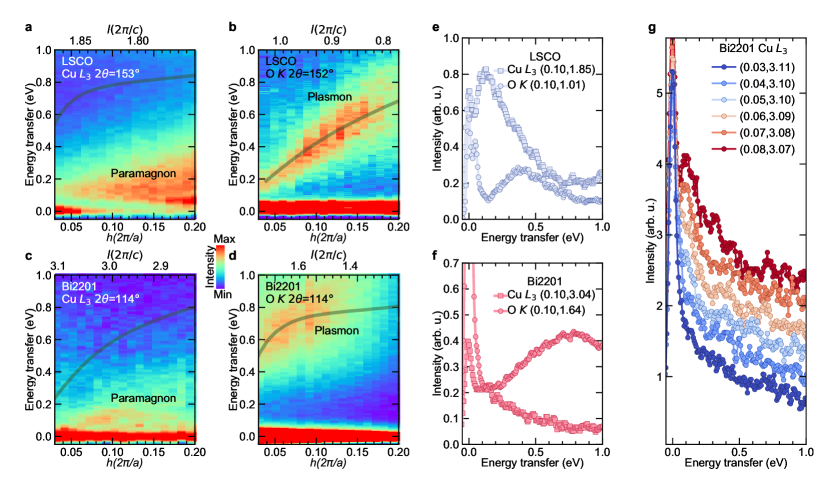
Spectroscopically, Cu - and O -RIXS directly probe the charge and magnetic excitations associated with the Cu 3 and O 2 orbitals, respectively, at the corresponding absorption peaks (Fig. 1(a)). In order to compare the excitations associated with the two orbitals, high-resolution RIXS spectra were collected at Cu - ( 0.045 eV) and O - ( 0.043 eV) edges, at I21-RIXS beam line, Diamond Light Source, United Kingdom i21web ; SM , in the scattering geometry shown in Fig. 1(c). All data presented here were obtained with incident polarisation (perpendicular to the scattering plane) to enhance the charge excitations hepting2018nat . Single crystals of LSCO and Bi2201 were cooled to their respective s of 38 K and 34.5 K,consistent with optimal hole-doping of , and X-ray absorptions (XAS) were collected in total electron yield mode (see Fig. 1(d)) SM . A survey was first made near the in-plane zone-centre with a fixed scattering angle on Bi2201 (Fig. 1(e, f)). The low-energy inelastic spectra at Cu resonance are dominated by paramagnons without any noticeable signs of plasmons, similar to reports on other hole-doped systems lee2014np ; dellea2017prb ; miao2017pnas . At the O -edge hole-peak chen1991prl however, a mode is found below 1 eV, dispersing towards the zero-energy.
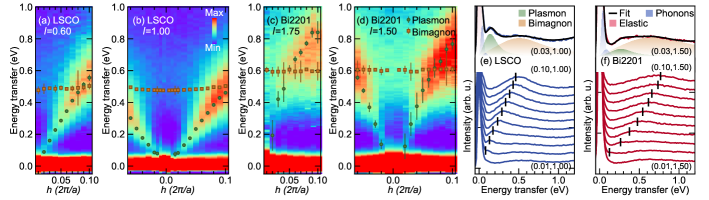
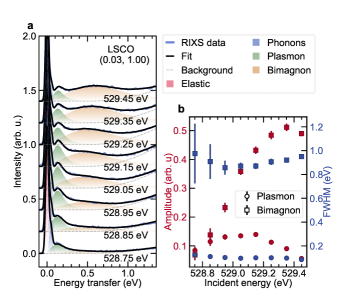
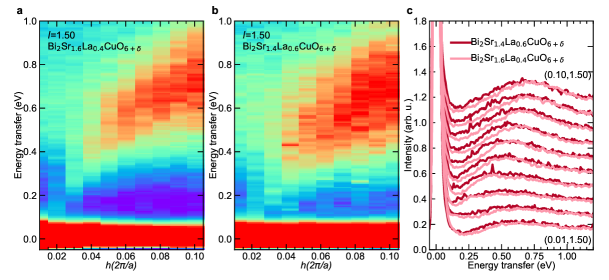
We next collected RIXS spectra by varying the incident energy () across the hole-peak in the O -XAS of LSCO at (, ) (Fig. 1(d)) chen1991prl , as shown in Fig. 1(g). We denote momentum transfers along -, - and -directions in reciprocal lattice units, where (, , ), if not stated explicitly. We find a broad feature at eV shifting towards higher energies with increasing . With doping, the probability of scattering from doped-charges in the intermediate state of RIXS increases bisogni2012prb . Moreover, energy-shift of the magnetic excitations associated with incoherent charge excitations is enhanced in -polarised RIXS minola2017prl . Thus, this feature can be ascribed to bimagnon excitations with an itinerant character bisogni2012prb .We find an additional sharp mode, at eV, whose energy remains constant with . This is a signature of its coherent nature lin2020npj and is in contrast with previous O -RIXS results ishii2017prb . This feature cannot be due to two-particle electron-hole like excitations, which are incoherent in nature. Neither can it be due to single-magnons or paramagnons since spin-flip processes are forbidden at the O -edge bisogni2012prb . To ascertain its origin, we explored further its dispersion in energy-momentum space.
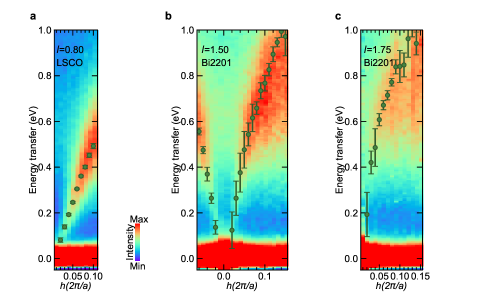
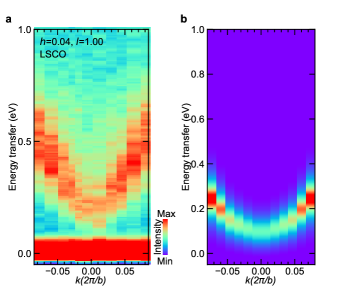
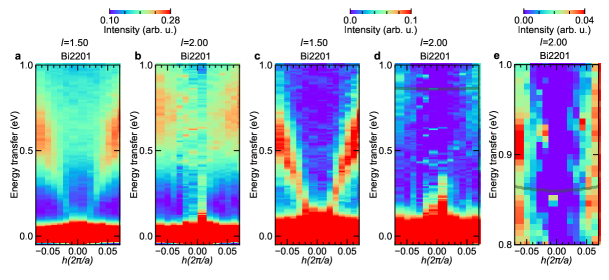
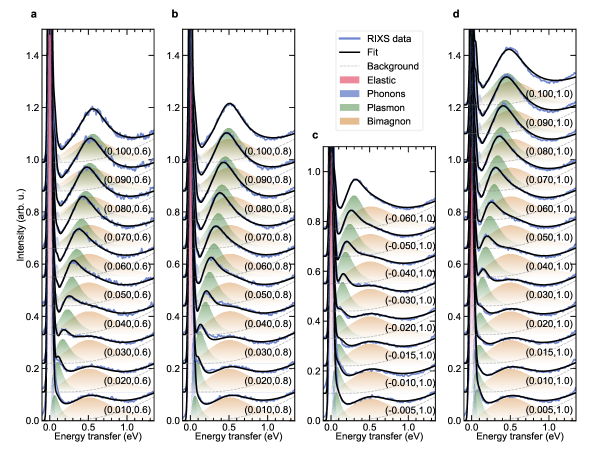
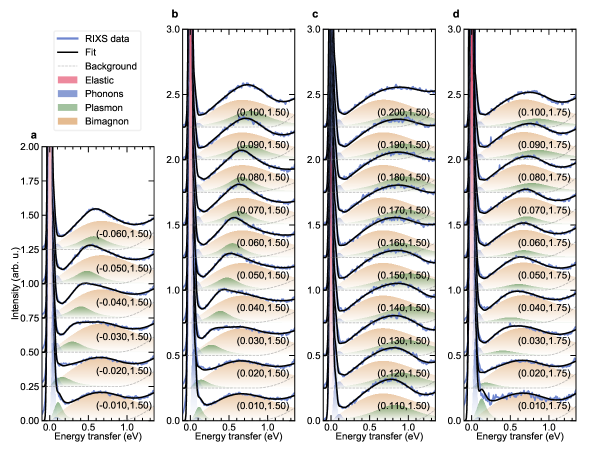
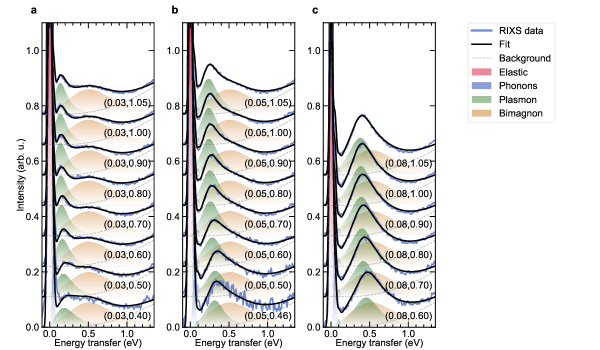
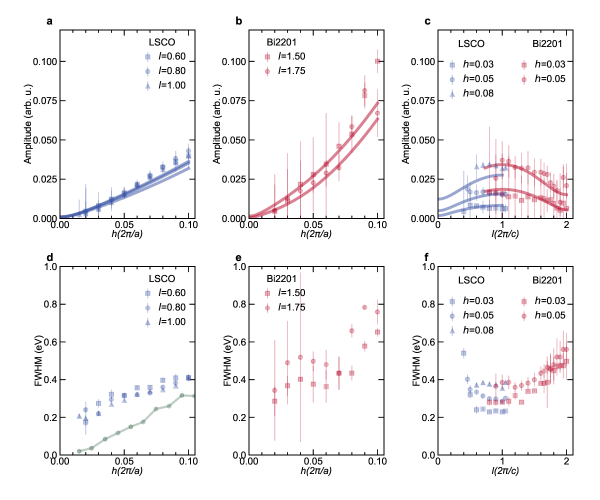
The broad feature seen in Fig. 1(g) is almost non-dispersive in the -direction further confirming its assignment as bimagnons bisogni2012prb . This can be seen from -maps collected at constant -values for LSCO and Bi2201 (Fig. 2). In contrast, the sharp mode disperses towards zero energy near the in-plane zone-centre in both systems. The RIXS spectra were fitted with a sum of Gaussians for the elastic line, phonons and damped harmonic oscillator functions for the sharp mode and the broad feature (Fig. 2(e-f)) SM . The dispersion and reduction of amplitude and width towards the in-plane zone-centre of this mode, is reminiscent of the acoustic plasmon behaviour observed in electron-doped LCCO hepting2018nat . The spectral weight of this mode moves to lower energy as the doping is reduced (see Supplementary Materials Fig. S15 SM ). This is expected and consistent with the behaviour of plasmons in LCCO hepting2018nat ; lin2020npj . However, the mode is strongly damped in comparison to LCCO (see Supplementary Materials Fig. S12 SM ), reflecting the stronger correlations (e.g. pseudogap) near optimal doping in hole-doped cuprates armitage2010rmp ; lin2020npj .
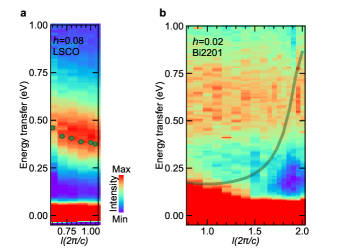
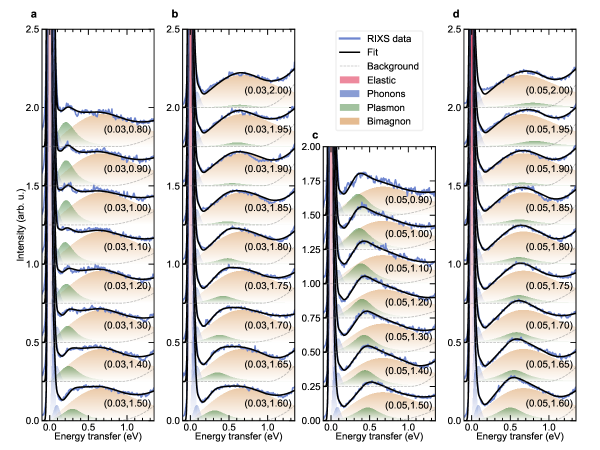
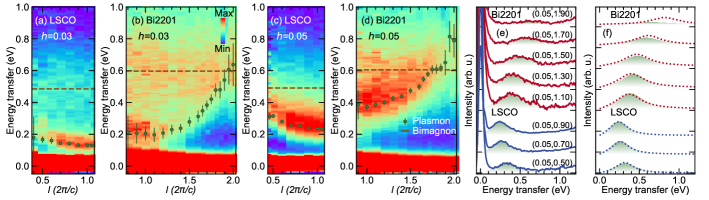
The most stringent test for identifying the mode as plasmons in these systems is their -dispersion. In the out-of-plane direction, plasmons in layered electron systems have a periodicity of (where is the interlayer spacing), which corresponds to in these systems, with a minimum in energy at (Fig. 1(c)). LSCO and Bi2201 have interlayer spacings differing by a factor of 2, allowing us to probe separate portions of this period. The sharp mode observed in Fig. 2, is found to disperse to a minimum energy value at for both systems. This can be seen in the (-maps collected at fixed -values shown in Fig. 3(a-d). This behaviour fundamentally proves the presence of acoustic plasmons in hole-doped cuprates. We can exclude the previous interpretation of these excitations as incoherent intra-band charge or electron-hole excitations which are 2D ishii2017prb , without significant -dependence greco2019cp . We note that a limited out-of-plane dispersion study has also been done recently on underdoped LSCO singh2020arx .
The cuprates are strongly correlated electron systems keimer2015nat . As such, it is interesting to compare our experimental results with the recently developed calculations of plasmons in the framework of a -- model greco2019cp , although generic plasmon behaviour can also be described by random-phase-approximation calculations kresin1988prb ; markiewicz2008prb . For discussing the nature and origin of the 3D charge excitations in LSCO and Bi2201 we employed the minimal layered -- model greco2019cp ; zhang1988prb ; SM :
| (1) | |||||
Here, represents the hopping parameter and the exchange parameter. The 3D form of long-range Coulomb interaction used in Eq. 1 in momentum space is becca1996prb :
| (2) |
where and with , the elementary charge and high frequency in-() and out-of-plane () dielectric constants.
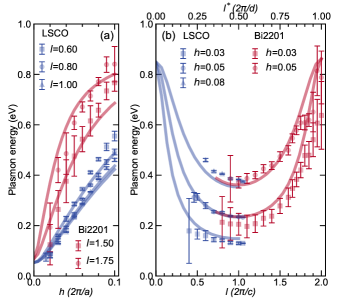
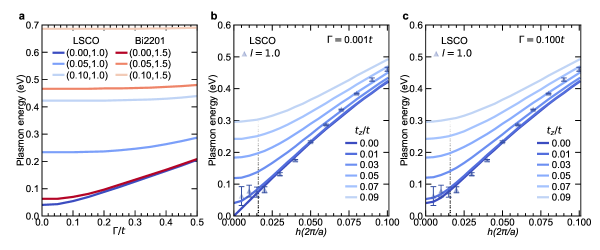
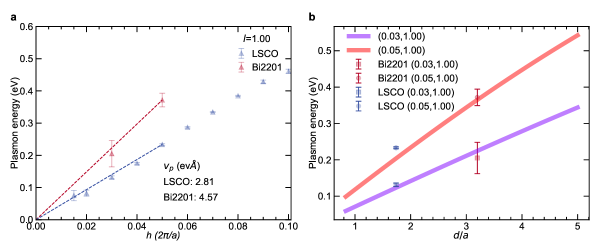
The imaginary part of charge susceptibility (, ), obtained from the model resembles well the spectral shape of the plasmons for both systems, as shown in Fig. 3(f) at different (, )-values. This demonstrates that the charge excitations in RIXS, although influenced by resonance and polarisation effects, can fundamentally be related to the charge-density response function. At -values close to 2, the much larger suppression of plasmons compared to theory could be due to their decay through the incoherent charge channels associated with bimagnons or through Umklapp scattering hepting2018nat . Severe suppression of the charge excitations in this region forbids us from detecting the optical plasmon branch in Bi2201 (see Supplementary Materials Fig. S6) SM . In Fig. 4(a, b) we show that both the - and -direction plasmon dispersions extracted by fitting the RIXS spectra for LSCO and Bi2201 are also represented well by the -- model optimised independently for each material. The higher acoustic plasmon velocities in Bi2201 than LSCO seen in Fig. 4(a, b), arise mainly due to the larger interlayer spacing, considering the two systems have similar carrier densities and Fermi velocities (see Supplementary Materials Section V) fetter1973ap ; hepting2018nat ; SM . Nevertheless, the remarkable similarity of the plasmon dispersions in the two different families suggests their ubiquitous existence in hole-doped cuprates.
In order to shed light on the possible existence of plasmons at Cu sites, we use the model described above to calculate the expected plasmon energies for both systems along the (, )-paths corresponding to the data for fixed scattering geometry. Neither in Bi2201 (Fig. 1(e)) nor in LSCO (Supplementary Materials Fig. S2) SM ), there is any spectral weight evident in Cu -RIXS spectra that can be assigned to plasmons lee2014np ; dellea2017prb . This contrasts with the strong plasmon signals observed at the O sites. The amplitude of plasmon is found to be highest close to for the O -RIXS (Fig. 3 and Supplementary Materials Fig. S12(c) SM ). In the Cu -RIXS experiments close to the in-plane zone-centre, we probe near for Bi2201 and near for LSCO. Plasmons were however, clearly observed in Cu -RIXS of electron-doped LCCO at similar -values as in LSCO hepting2018nat . The non-observance of plasmons at Cu sites in the present study of LSCO and Bi2201 could be therefore due to a combined effect of an -dependence of plasmon spectral weight and a strong O 2 character of the doped-charges chen1991prl ; zhang1988prb ; sakurai2011sci . Further studies are required to clarify such site-dependent behaviour, since in the Zhang-Rice singlet state scenario for hole-doped cuprates, a strong coupling is expected between the doped holes in the O orbitals and the intrinsic holes of the Cu orbitals zhang1988prb .
It is interesting to discuss our findings in the context of the charge order type of density modulation observed in hole-doped cuprates. When charge order is present, it has been observed using both Cu - and O -edge resonant X-ray scattering abbamonte2005np ; achkar2013prl ; li2020pnas , both for short ( Å) li2020pnas and long ( Å) abbamonte2005np correlation lengths. In common with other charge-density waves, the order has a valence charge modulation and associated atomic displacements johannes2008prb , making it possible to be observed by non-resonant X-ray scattering techniques forgan2015natcomm . Thus, it is likely that, in these systems, the charge ordering signal observed at the Cu absorption peak is primarily due to atomic displacements caused by electron-phonon coupling, while the dominant signal at the O hole-peak reflects directly the valence charge modulation achkar2013prl ; fink2009prbr . Due to the much higher frequencies of the dynamic plasmons, it may be that they couple weakly to the phonons, further reducing the possibility to observe any signature directly from the Cu 3 orbitals.
The general existence of acoustic plasmons besides phonons and spin-fluctuations in layered cuprates will lead to more investigations of charge dynamics in connection with the pseudogap phase, non-Fermi liquid behaviour and perhaps the superconductivity in cuprates keimer2015nat . Our results also suggest that the charge dynamics in hole-doped cuprates are mostly associated with the O sites, highlighting the importance of the three band model in the cuprates varma1987ssc ; emery1987prl . Going beyond, it would be interesting to utilise the site-sensitivity of the RIXS technique to characterise plasmon behaviour in other layered superconductors, like iron-pnictides paglione2010nat , having strong out-of-plane band dispersions, or the newly-found nickelates in which 2D Ni-3 states strongly hybridise with 3D rare-earth 5 states hepting2020nm .
Acknowledgements.
We thank W.-S. Lee, V. Kresin, J. Lorenzana and S. Johnston for insightful discussions. All data were taken at the I21 RIXS beamline of Diamond Light Source (United Kingdom) using the RIXS spectrometer designed, built and owned by Diamond Light Source. We acknowledge Diamond Light Source for providing the beamtime on Beamline I21 under proposals SP20709 and MM24587. Work at Bristol was supported by EPSRC Grant EP/R011141/1 and EP/L015544/1. H. Y. was supported by JSPS KAKENHI Grant No. JP18K18744 and JP20H01856. We acknowledge T. Rice for the technical support throughout the beamtimes. We also thank G. B. G. Stenning and D. W. Nye for help on the Laue instrument in the Materials Characterisation Laboratory at the ISIS Neutron and Muon Source.References
- (1) B. Keimer, S. A. Kivelson, M. R. Norman, S. Uchida, and J. Zaanen, Nature 518, 179 (2015).
- (2) J. Zaanen, G. A. Sawatzky, and J. W. Allen, Phys. Rev. Lett. 55, 418 (1985).
- (3) V. J. Emery, Phys. Rev. Lett. 58, 2794 (1987).
- (4) C. M. Varma, S. Schmitt-Rink, and E. Abrahams, Sol. State. Comm. 62, 681 (1987).
- (5) N. P. Armitage, P. Fournier, and R. L. Greene, Rev. Mod. Phys. 82, 2421 (2010).
- (6) C. T. Chen, F. Sette, Y. Ma, M. S. Hybertsen, E. B. Stechel, W. M. C. Foulkes et al., Phys. Rev. Lett. 66, 104 (1991).
- (7) R. Comin, and A. Damascelli, Ann. Rev. Cond. Matter Phys. 7, 369 (2016).
- (8) B. Diaconescu, et al., Nature 448, 57 (2007).
- (9) A. L. Fetter, Ann. Phys. 81, 367 (1973).
- (10) A. L. Fetter, Ann. Phys. 88, 1 (1974).
- (11) V. Z. Kresin, and H. Morawitz, Phys. Rev. B 37, 7854 (1988).
- (12) A. Greco, H. Yamase, and M. Bejas, Commun. Phys. 2, 3 (2019).
- (13) R. S. Markiewicz, M. Z. Hasan, and A. Bansil, Phys. Rev. B 77, 094518 (2008).
- (14) M. Hepting et al., Nature 563, 374 (2018).
- (15) J. Lin et al., npj Quantum Mater. 5, 4 (2020).
- (16) W. S. Lee et al., Nat. Phys. 10, 883 (2014).
- (17) G. Dellea, M. Minola, A. Galdi, D. Di Castro, C. Aruta, N. B. Brookes et al., Phys. Rev. B 96, 115117 (2017).
- (18) H. Miao et al., Proc. Natl Acad. Sci. USA 114, 12430 (2017).
- (19) K. Ishii, T. Tohyama, S. Asano, K. Sato, M. Fujita, S. Wakimoto et al., Phys. Rev. B 96, 115148 (2017).
- (20) I. Bozovic, Phys. Rev. B 42, 1969 (1990).
- (21) M. Mitrano et al., Proc. Natl. Acad. Sci. USA 115, 5392 (2018).
- (22) https://www.diamond.ac.uk/Instruments/Magnetic-Materials/I21.html
- (23) See Supplemental Material at [URL will be inserted by publisher] for sample information, RIXS experiments, additional RIXS data, description of the least-square data fitting and plasmon calculations using -- model.
- (24) V. Bisogni, M. Moretti Sala, A. Bendounan, N. B. Brookes, G. Ghiringhelli, and L. Braicovich, Phys. Rev. B 85, 214528 (2012).
- (25) M. Minola, Y. Lu, Y. Y. Peng, G. Dellea, H. Gretarsson, M. W. Haverkort et al., Phys. Rev. Lett. 119, 097001 (2017).
- (26) A. Singh et al., arXiv:2006.13424v1 (2020).
- (27) F. C. Zhang, and T. M. Rice, Phys. Rev. B 37, 3759(R) (1988).
- (28) F. Becca, M. Tarquini, M. Grilli, and C. Di Castro, Phys. Rev. B 54, 12443 (1996).
- (29) Y. Sakurai et al., Science 332, 698 (2011).
- (30) P. Abbamonte, A. Rusydi, S. Smadici, G. D. Gu, G. A. Sawatzky, and D. L. Feng, Nature Phys. 1, 155 (2005).
- (31) A. J. Achkar, F. He, R. Sutarto, J. Geck, H. Zhang, Y.-J. Kim, and D. G. Hawthorn, Phys. Rev. Lett. 110, 017001 (2013).
- (32) J. Li et al., Proc. Natl. Acad. Sci. USA 117, 16219 (2020).
- (33) M. D. Johannes, and I. I. Mazin, Phys. Rev. B 77, 165135 (2008).
- (34) E. M. Forgan et al., Nat. Comms. 6, 10064 (2015).
- (35) J. Fink et al., Phys. Rev. B 79, 100502(R) (2009).
- (36) J. Paglione, and R. L. Greene, Nat. Phys. 6, 645 (2010).
- (37) M. Hepting et al., Nat. Mater. 19, 381 (2020).
Supplementary Materials
I Sample growth, characterisation and preparation.
High-quality single crystals of La1.84Sr0.16CuO4 (LSCO) and Bi2Sr1.6La0.4CuO6+δ (Bi2201) were grown by floating-zone method. Bi2201 sample was annealed at 650 ∘C in O2 atmosphere for two days to improve sample homogeneity. Fig. S1(a) and (b) show the Laue diffraction patterns obtained from LSCO and Bi2201 respectively, for preliminary orientation. The orientations were further refined using in-situ diffraction, charge-order and superstructure (present in Bi2201 due to structural distortions in Bi-O layers) peaks prior to the collection of RIXS spectra. Lattice constants used for LSCO (Bi2201) are (3.86) Å and (24.69) Å. Superconducting transition temperatures s extracted from magnetisation measurements of LSCO (38 K) and Bi2201 (34.5 K) are shown in Fig. S1(c) and (d) and are consistent with optimal hole-doping of =0.16. While LSCO was cleaved in vacuum, Bi2201 was cleaved in air and immediately transferred to vacuum. The pressure inside the sample vessel was maintained at mbar. Samples were mounted such that the -axis and -axis lay in the horizontal scattering plane while the -axis was perpendicular to the scattering plane (see Fig. 1(c) of Main paper). Negative and positive values of in the RIXS maps presented in this work represent the grazing-incident and grazing-exit geometries respectively (Fig. S1(e, f)). Fig. S1(g) shows the accessible (, )-values at O -for LSCO and Bi2201 at I21. For each material, reduction in -value forces transition from a backward to forward scattering experimental geometry which enhances the elastic line, thereby limiting the lowest usable -to study plasmons. The zero-energy transfer position and resolution of the RIXS spectra were determined from subsequent measurements of elastic peaks from an adjacent carbon tape.
II Additional RIXS data
RIXS spectra were collected at both Cu -and O -RIXS for comparison of plasmons in LSCO and Bi2201 with a fixed scattering angle. Data collected from LSCO at the Cu absorption peak is shown in Fig. S2(a) and at the hole-peak of O -edge in Fig. S2(b). Data presented in Fig. 1 (e, f) of main paper on Bi2201 are also presented for a closer inspection in Fig. S2(c, d, f and g).
RIXS intensity map of LSCO for momentum transfer along the -direction at is shown in Fig. S3(a). The plasmon energies from these scans have been used in Fig. 4(a) of the main paper. Extended -scans are shown in Fig. S3(b, c) till , showing the continuous rise of the plasmon energies towards the excitations in Bi2201. RIXS intensity map of LSCO for momentum transfer along the -direction at is shown in Fig. S4(a). The plasmon energies from these scans have been used in Fig. 4(c) of the main paper. In Fig. S4(b) RIXS intensity map of Bi2201 for momentum transfer along the -direction at is shown. Although plasmon dispersion is visible for in Bi2201, the energies could not be extracted by fitting the data, due to either proximity to elastic line below or weak spectral weight above . The over-plotted continuous dispersion line obtained from -- model seemingly follows the plasmon spectral weight. Plasmon excitations were however observed along the directions in LSCO (see Fig. S5(a)) as expected from the 4-fold symmetry of orbitals in the CuO2 planes. As such, using the same parameters of the -- model optimised for plasmon dispersions along - and -directions, the plasmon excitations along the direction can be reproduced (see Fig. S5(b)). Due to the large -axis lattice parameter of Bi2201, we were able to probe close to , however, strong suppression of the charge excitations in this region, forbade us from observing the optical branch of plasmons (see Fig. S6). Although some residual spectral weight is visible for slightly higher -values at , the optical plasmon branch still remains intangible.
Close to the zone-centre, high energy-resolution scans are need to differentiate the plasmon peak from the elastic and the phonon peaks. This is important if one wants to study the validity of the -- model with interlayer hopping which predicts a zone-centre gap for the acoustic plasmons. From the current results we can only estimate the upper limit of the acoustic plasmon energies at the zone-centre to be eV for LSCO, setting interlayer hopping eV in this material (see Fig. S13).
III RIXS data fitting
RIXS data were normalised to the incident photon flux, and subsequently corrected for self-absorption effects using the procedure described in minola2015prl prior to fitting. A Gaussian lineshape with the experimental energy resolution was used to fit the elastic line. Gaussian lineshapes were also used to fit the low energy phonon excitations at eV and their overtones. The scattering intensities (, ) of the plasmons and bimagnons at given values of (, , ), dependent on the imaginary part of their respective dynamic susceptibilities (, ) were modelled as:
| (S1) |
where , and are the Boltzmann constant, temperature and the reduced Planck constant. A generic damped harmonic oscillator model can be used for the response function
| (S2) |
where and are the undamped frequency and the damping factor respectively. Eq. S2 can be equivalently written using an anti-symmetrised Lorentzian function,
| (S3) |
with peaks at for , given that , which was found to hold for the plasmon excitations observed in this study (see Fig. S12). In the results, we plotted the plasmon propagation energy as the peak of this function.
First we extracted the zone-centre energy, amplitude and width of the broad incoherent mode at and concluding this to be a bimagnon, fixed its amplitude and width for the whole (, )-range bisogni2012prb ; vernay2007prb . The energy values of the bimagnons were allowed to vary within meV for the RIXS spectra along -direction. For the RIXS spectra along -direction, bimagnon energies were kept fixed to the values obtained for corresponding -values from the -direction scans. This allowed us to decompose the inelastic spectra into two components with less ambiguity, especially for the -values where energies of the two modes were nearby. Significant correlations were however found below , between the elastic, phonon and plasmon amplitudes and energies, and hence the plasmon energy values determined in these regions are less conclusive. A high energy quadratic background was also included in the fitting model to account for the tailing contribution from -excitations above 1.5 eV.
The RIXS spectra fits of LSCO for incident energy detuned scans are shown in Fig. S7. Also in Fig. S7(b) are shown the change in plasmon and bimagnon amplitudes and widths as the incident energy is varied. The non-resonant behaviour of the bimagnon amplitude implies an incoherent character in sharp contrast to the plasmon. RIXS spectra fits of LSCO and Bi2201 for momentum transfer along the -direction are shown in Fig. S8 and S9, and along the -direction in Fig. S10 and S11 respectively. Plasmon amplitude and width variation along - and -directions in LSCO and Bi2201 from these fits are summarised in Fig. S12.
IV -- model
For discussing the nature and origin of three-dimensional (3D) charge excitations in LSCO and Bi2201 we employed the minimal layered -- model greco2019cp ; zhang1988prb :
| (S4) |
Here, represents the hopping parameter and the exchange parameter. The 3D form of long-range Coulomb interaction used in Eq. S4 in momentum space is becca1996prb :
| (S5) |
where and with , the elementary charge and high frequency in-() and out-of-plane () dielectric constants.
On each plane the hopping parameter takes a value between the first (second) nearest-neighbours sites on the square lattice and is the exchange interaction between the nearest-neighbours. Since hole-doped cuprates are correlated electron systems the - model is believed to be a minimal model of the CuO2 planes zhang1988prb . The fact that we deal with a correlated system is contained in and which are the creation and annihilation operators, respectively, of electrons with spin in the Fock space without any double occupancy. is the electron density operator and the spin operator. The 3D nature of the model originates from the presence of a hopping between the adjacent planes, and the long-range Coulomb interaction for a layered system. The form of in Eq. S4 in momentum space is given in Eq. S5 becca1996prb . Finally, the indices and run over the sites of a three-dimensional lattice, and indicates a pair of nearest-neighbour sites.
A theoretical treatment of this model is non-trivial because the Hamiltonian is defined in the restricted Hilbert space that prohibits non-double occupancy on each site, which complicate the commutation rules of the operators. In addition, there is no small parameter for perturbation. We implement a large- expansion foussats2004prb ; greco2016prb ; greco2019cp where the spin index is extended to a new index running from to . In order to get a finite theory in the limit , we rescale the hopping to , to and to , and is used as the small parameter to control the expansion. is put to in the end. Although the physical value is , the large- expansion has several advantages over usual perturbations theories. Applying the large- treatment greco2016prb the quasiparticles disperse in momentum space as
| (S6) |
where the in-plane and the out-of-plane dispersions are given by, respectively,
| (S7) |
and
| (S8) |
The functional form in is frequently invoked for cuprates andersen1995jpcs . Other forms for , however, do not change the qualitative features. Although the electronic dispersion looks similar to that in a free electron system, the hopping integrals , , and are renormalised by doping because of electron correlation effects. For both the optimally-doped materials we use .
The term in Eq. S7, which is proportional to , is the mean-field value of the bond variables introduced to decouple the exchange term through a Hubbard-Stratonovich transformation foussats2004prb ; greco2016prb . The value of is computed self-consistently together with the chemical potential for a given by using
| (S9) |
and
| (S10) |
where is the Fermi function, and and are the total number of lattice sites on the square lattice and the number of layers along the direction respectively. We take the number of layers equal to 30, which should be large enough, and set the temperature to zero.
As shown previously foussats2004prb ; greco2016prb ; greco2019cp , the charge-charge correlation function can be computed in the - space as
| (S11) |
Thus, is the element of the bosonic propagator where
| (S12) |
and the matrix indices and run from 1 to 6. is a bare bosonic propagator
| (S13) |
and are the bosonic self-energies,
| (S14) |
where the six-component vertex is given by
Here and are three dimensional wavevectors and is a bosonic Matsubara frequency. The factor comes from the sum over the fermionic channels. The channels involved in come from on-site charge fluctuations, fluctuations of a Lagrangian multiplier introduced to impose the non-double occupancy at any site, and fluctuations of the four bond variables which depend on greco2016prb ; foussats2004prb .
To describe plasmon excitations we compute the spectral weight of the density-density correlation function Im after analytical continuation
| (S15) |
Since influences the width of the plasmon, its effect on the plasmon peak position is strongest when it becomes comparable to undamped plasmon energy (overdamped condition). As observed in the experiment (see Fig. S12(d, e) and (f)), this condition may only be true close to the zone-centre for the acoustic plasmons. Plasmon energies calculated from the optimised models, as function of , plotted in Fig. S13(a) clearly demonstrates that plasmon dispersions have negligible effect at larger values. Here a small positive value was chosen for all the plasmon dispersion simulations. However to replicate the plasmon peak profiles observed in Fig. 3(f) of main paper, values of and were chosen for LSCO and Bi2201 respectively. A finite value of contains information of an extrinsic broadening due to the instrumental resolution, and an intrinsic broadening due to incoherent effects due to electronic correlations prelovsek1999prb .
The model Hamiltonian Eq. S4 contains several material dependant parameters. To reduce the number of tuning parameters in the model, we have used, if available, the most common values from literature. The exchange interaction is considered only inside the plane. The out-of-plane exchange term is much smaller than theo1988prb . The was taken as for both the materials given their similar values in the parent compounds hybertsen1990prb ; peng2017np ; lee2006rmp . It is important to mention here that plasmons are nearly unaffected by the value of . The optical plasmon () energy was fixed at 0.85 eV for both LSCO and Bi2201 as reported from optical measurements which are sensitive to only the momentum transfers heumen2009njp ; uchida1991prb ; suzuki1989prb . The nearest neighbour hopping parameter was fixed at 0.35 eV for both the materials ishii2017prb ; horio2018prl . We took the second-nearest neighbour hopping parameter , whose exact value is not known apart from reports that , to be for LSCO and for Bi2201 hashimoto2008prb ; pavarini2001prl ; greco2019cp ; horio2018prl . We however found that the overall nature of plasmon dispersions does not depend on a precise choice of the band parameters.
We found the optical plasmon energy to be proportional to of Eq. S5. Depending on the band parameters, we obtained the proportionality constant to be 0.41 for LSCO and 0.40 for Bi2201. With the band parameters fixed, the value of was tuned to get eV. Next, and values were optimised to best match the plasmon dispersions observed in the experiment. For LSCO (Bi2201), we obtained and to be 18.9 eV (52.5 eV) and 3.47 (8.14) respectively. This gave for LSCO (Bi2201), as () and as (). Microscopically therefore the relatively large values of and in Bi2201 come mainly from a large interlayer spacing . The interlayer hopping was tuned to match the plasmon energies for and an upper limit of was found for LSCO (see Fig. S13).
V Comparison of plasmon energies between LSCO and Bi2201
We observe that the plasmon energies of Bi2201 is much larger than that in LSCO close to (see Fig. 3 and Fig. 4(b) of main paper). Acoustic plasmon velocities () for LSCO and Bi2201 at estimated using linear fits to extracted -direction plasmon energies are shown in Fig. S14(a). The Bi2201 to LSCO ratio is found to be around 1.6, roughly matching the ratio of the interlayer spacing between them (1.88). The difference in the ratios could be due to the slightly different dielectric constants of the two materials (see Section IV), given the identical level of doping in the two systems. The larger interlayer spacing essentially enhances the 3D Coulomb interaction (Eq. 2 of main paper) of Bi2201 compared to LSCO and thereby raises its plasmon energies. Our -- model captures the effect of this interlayer spacing as can be seen from the theoretically calculated solid lines in Fig. 4(b) of main paper. This can also be viewed from the analytical form of plasmon energies of layered electron gases for small in-plane momenta giuliani2005book ; turkalov2003prb ,
| (S16) |
where, is the plasmon energy, is the doping, is the interlayer spacing, is the high frequency dielectric constant, and are the in- and out-of-plane momentum transfer values respectively. As shown in Fig. S14(b), the plasmon energies are strongly dependent on interlayer spacing, considering other parameters have similar values.
References
- (1) M. Minola et al., Phys. Rev. Lett. 114, 217003 (2015).
- (2) F. H. Vernay, M. J. P. Gingras, and T. P. Devereaux, Phys. Rev. B 75, 020403(R) (2007).
- (3) V. Bisogni, M. Moretti Sala, A. Bendounan, N. B. Brookes, G. Ghiringhelli, and L. Braicovich, Phys. Rev. B 85, 214528 (2012).
- (4) F. C. Zhang, and T. M. Rice, Phys. Rev. B 37, 3759(R) (1988).
- (5) A. Greco, H. Yamase, and M. Bejas, Commun. Phys. 2, 3 (2019).
- (6) F. Becca, M. Tarquini, M. Grilli, and C. Di Castro, Phys. Rev. B 54, 12443 (1996).
- (7) A. Greco, H. Yamase, and M. Bejas, Phys. Rev. B 94, 075139 (2016).
- (8) A. Foussats, and A. Greco, Phys. Rev. B 70, 205123 (2004).
- (9) O. K. Andersen, A. I. Liechtenstein, O. Jepsen, and F. J. Paulsen, Phys. Chem. Solids 56, 1573 (1995).
- (10) P. Prelovs̆ek, and P. Horsch, Phys. Rev. B 60, R3735(R) (1999).
- (11) T. Thio et al., Phys. Rev. B 38, 905(R) (1988).
- (12) M. S. Hybertsen, E. B. Stechel, M. Schluter, and D. R. Jennison, Phys. Rev. B 41, 11068 (1990).
- (13) Y. Y. Peng et al., Nat. Phys. 13, 1201 (2017).
- (14) P. A. Lee, N. Nagaosa, and X.-G. Wen, Rev. Mod. Phys. 78, 17 (2006).
- (15) E. van Heumen, W. Meevasanam, A. B. Kuzmenko, H. Eisaki, and D. van der Marel, New J. Phys. 11, 055067 (2009).
- (16) S. Uchida et al., Phys. Rev. B 43, 7942 (1991).
- (17) M. Suzuki, Phys. Rev. B 39, 2312 (1989).
- (18) K. Ishii, T. Tohyama, S. Asano, K. Sato, M. Fujita, S. Wakimoto et al., Phys. Rev. B 96, 115148 (2017).
- (19) M. Hashimoto et al., Phys. Rev. B 77, 094516 (2008).
- (20) M. Horio et al., Phys. Rev. Lett. 121, 077004 (2018).
- (21) E. Pavarini, I. Dasgupta, T. Saha-Dasgupta, O. Jepsen, and O. K. Andersen Phys. Rev. Lett. 87, 047003 (2001).
- (22) G. Giuliani and G. Vignale, Quantum Theory of the Electron Liquid (Cambridge University Press, 2005).
- (23) M. Turkalov, and A. J. Leggett, Phys. Rev. B 67, 094517 (2003).
- (24) M. Hepting et al., Nature 563, 374 (2018).