SPIDERS: overview of the X-ray galaxy cluster follow-up and the final spectroscopic data release
Abstract
SPIDERS (The SPectroscopic IDentification of eROSITA Sources) is a large spectroscopic programme for X-ray selected galaxy clusters as part of the Sloan Digital Sky Survey-IV (SDSS-IV). We describe the final dataset in the context of SDSS Data Release 16 (DR16): the survey overall characteristics, final targeting strategies, achieved completeness and spectral quality, with special emphasis on its use as a galaxy cluster sample for cosmology applications. SPIDERS now consists of about 27,000 new optical spectra of galaxies selected within 4,000 photometric red sequences, each associated with an X-ray source. The excellent spectrograph efficiency and a robust analysis pipeline yield a spectroscopic redshift measurement success rate exceeding 98%, with a median velocity accuracy of km s-1 (at ). Using the catalogue of 2,740 X-ray galaxy clusters confirmed with DR16 spectroscopy, we reveal the three-dimensional map of the galaxy cluster distribution in the observable Universe up to . We highlight the homogeneity of the member galaxy spectra among distinct regions of the galaxy cluster phase space. Aided by accurate spectroscopic redshifts and by a model of the sample selection effects, we compute the galaxy cluster X-ray luminosity function and we present its lack of evolution up to . Finally we discuss the prospects of forthcoming large multiplexed spectroscopic programmes dedicated to follow up the next generation of all-sky X-ray source catalogues.
keywords:
galaxies: clusters: general – cosmology: observations – X-rays: galaxies: clusters1 Introduction
Studies of the distribution of galaxy clusters in the universe rely on large and well-selected samples of astrophysical objects tracing the most massive nodes of the cosmic web. Large amounts of hot gas trapped within their deep matter potential wells make clusters of galaxies luminous X-ray sources (e.g. Jones & Forman, 1999). They appear as diffuse extended sources (Abell, 1958; Bahcall & Cen, 1993; Böhringer et al., 2004; Oguri et al., 2018; Ridl et al., 2017; Ricci et al., 2018; Wen & Han, 2018; Andreon et al., 2019; Gozaliasl et al., 2019), with galaxy overdensities extending out to over 10 Mpc (Trevisan et al., 2017). Galaxies within halos may have their properties affected by encounters with the hot gas (e.g., Popesso et al., 2015; Lotz et al., 2019; Owers et al., 2019).
Clusters of galaxies are rare objects, the more massive, the rarer. Their number density scales between and Mpc-3 for lower mass limits of and , respectively (e.g. Vikhlinin et al., 2009). X-ray surveys of the extragalactic sky fulfil the requirements of a large volume coverage, high completeness and high purity as required by cluster studies. Moreover, X-ray properties readily scale with the mass of the host systems (e.g., Kaiser, 1986); observations at high-energy are therefore particularly appealing for cosmological studies based on the halo mass function (e.g. Borgani et al., 1999; Henry et al., 2009; Mantz et al., 2010; Reiprich & Böhringer, 2002; Ilić et al., 2015; Böhringer et al., 2017; Schellenberger & Reiprich, 2017; Pacaud et al., 2018). Definitive assessment of the nature of the emitting sources, including a precise measurement of their redshifts, is provided by the three-dimensional association with their member galaxies, which is achieved in the most robust manner through spectroscopic redshift surveys in the optical domain. These allow measurements at a precision far below the typical velocity dispersions of their host halos.
Collecting large numbers of spectra of candidate member galaxies is an observational challenge requiring highly multiplexed, wide-aperture instrumentation supported by high-quality uniform photometric surveys to draw targets from. The SPIDERS (SPectroscopic IDentification of eROSITA Sources) programme within SDSS-IV (Blanton et al., 2017) addresses this need in the context of wide-area X-ray surveys. Sharing survey strategies with an observational cosmology project (the extended Baryon Oscillation Survey eBOSS, Dawson et al., 2016) makes possible the acquisition of a large number of spectroscopic redshifts for objects identified as counterparts of X-ray emitting sources. The main challenge resides in ensuring maximal completeness and wide uniformity of the datasets.
X-ray sources found outside of the Galactic plane can be divided into several categories: galaxy clusters, active galactic nuclei (AGN), X-ray emitting stars, compact objects, etc. (e.g., Voges et al., 1999; Evans et al., 2010; Rosen et al., 2016). Each class of object requires its own strategy in order to target the most likely optical counterpart, given the limited positional accuracies, depths, spectral resolution, etc. Numerous AGN candidates found as point-like sources in the Röntgen Satellite All-Sky Survey (RASS, Truemper, 1993) and the XMM-Newton Slew survey (Saxton et al., 2008) require maximum-likelihood or bayesian methods to enhance the chances of association with an infrared or optical AGN (Dwelly et al., 2017). Clusters of galaxies are scarcer and they possess extended morphologies on the X-ray sky; however it is difficult to distinguish an extended source from a point source below a certain flux level and beyond the instrumental angular resolution limit. The "red sequence" (e.g. Gladders & Yee, 2000), formed by passive galaxies in those massive halos, helps to characterise them. Multiband photometry of these galaxies provides an estimate of their redshift (e.g., by locating the 4000 Å break passing through filter passbands). This is the strategy adopted in SPIDERS for selecting clusters: two X-ray samples extracted from the RASS and the XMM-Newton archive are searched for optical red sequences in SDSS DR8 photometry (Aihara et al., 2011) using the redMaPPer algorithm (Rykoff et al., 2014).
A description of the parent SPIDERS galaxy cluster samples and targeting strategies is provided in Clerc et al. (2016) (hereafter C16). The target list was publicly released alongside SDSS Data Release 13 (DR13, Albareti et al., 2017) in the form of a Value-Added Catalogue111All VACs are accessible under this link: https://www.sdss.org/dr16/data_access/value-added-catalogs/. (VAC). C16 additionally describes the construction of an X-ray selected galaxy cluster sample using spectroscopic data from a pilot survey located in a sub-area of sky covering 300 (see Alam et al., 2015, for a description of the spectroscopic dataset). This work demonstrated the end-to-end feasibility of the SPIDERS project; the final catalogue of 230 systems is available as a VAC. This VAC highlighted key features of the sample, including its coverage of the mass-redshift plane and the availability of velocity dispersions. An updated catalogue of 520 systems with high optical richnesses was released in the form of a VAC as part of DR14 (Abolfathi et al., 2018) with a corresponding sky area of about . The DR14 catalogue forms the basis of studies on the richness-mass and luminosity-mass relations Capasso et al. (2019, 2020) and on properties of Brightest Cluster Galaxies (Furnell et al., 2018; Erfanianfar et al., 2019).
The present paper enlarges the scope of the survey and directly relates to DR16 (Ahumada et al., 2020). This data release contains the entire set of SPIDERS spectra. The motivation of this paper is to provide a detailed census of the data collected in the course of the project, to describe the various steps that led to the final catalogues and to expose salient features in the data, which includes a discussion on the statistical content of the galaxy cluster sample.
The outline of this paper is as follows. Section 2 describes the SPIDERS survey design, the updated targeting strategies, and the sensitivities of the relevant components. Sect. 3 provides a detailed assessment of the content of the DR16 spectroscopic data relevant to SPIDERS galaxy clusters. Sect. 4 discusses the adopted survey strategy, and we provide prospects for future massively multiplexed follow-up programmes. Unless otherwise stated, the cosmological model used in this paper is flat Cold Dark Matter with and km s-1 Mpc-1. Magnitudes are expressed in their native SDSS (AB) system (Fukugita et al., 1996).
2 The galaxy cluster survey
This section is an overview of the survey design and targeting strategies. We also describe the galaxy cluster selection function prior to spectroscopic observations.
2.1 Parent samples and target selection
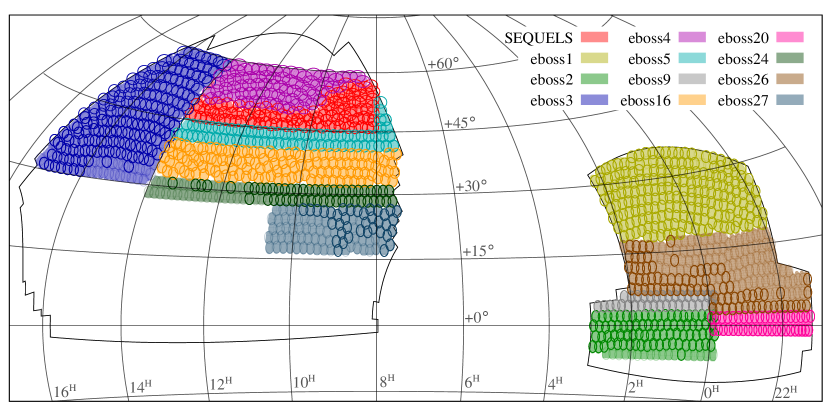
We refer the reader to C16 for an in-depth introduction to the CODEX and X-CLASS parent samples and the algorithms applied to select targets in optical imaging data. These targets are astronomical sources identified in photometric catalogues, a vast majority of them are galaxies. Figure 1 displays the area on the sky relevant to this section; i.e., the "chunks" eboss1-5, 9, 16, 20, 24, 26, 27 and SEQUELS (boss214, 217) where we effectively selected the targets relevant for the programme and acquired data throughout the survey. All targets described in this section have a target bit mask EBOSS_TARGET1 set to 31 in SDSS products; a few target subclasses were defined, described in the following paragraphs.
2.1.1 The CODEX sample and targeting
CODEX is a search for faint, X-ray extended sources in all-sky ROSAT data (RASS), coupling a wavelet algorithm to an automated optical cluster finder in the BOSS imaging area (Finoguenov et al., 2020). Specifically, two different X-ray source catalogues were produced by varying the wavelet threshold and the region of each significant source was searched for an optical counterpart (red-sequence) using the redMaPPer software (Rykoff et al., 2012, 2014). The two catalogues were then cross-matched and duplicates were eliminated.
The optical finder provides an estimate for the photometric redshift, , of the galaxy cluster – mainly based on the colours of the passive galaxies forming the detected red-sequence – and an optimized richness estimator , which scales with the number of galaxies exceeding a threshold stellar luminosity. Because of the relatively large uncertainty in the RASS source positions, reaching up to a few arcmin for extended sources, the constraint on the centre is relaxed and the algorithm optimally finds an optical centre within 3 arcmin of the X-ray position. Refined estimates for the cluster photometric redshift and richness, dubbed ’OPT’ (optical), are calculated using the new position.
A critical by-product of this procedure is a list of identified red-sequence members, each assigned a membership probability . This ranked list of probabilities, attached to each candidate X-ray selected cluster, forms the basis of the targeting strategy and confirmation process (C16).
As explained in C16, chunk eboss3 benefits from a slightly modified targeting scheme due to the higher density of X-ray sources in this area of sky. This scheme effectively favours confirmation of many low-mass systems at the expense of a lower number of members per individual cluster (Sect. 3.5).
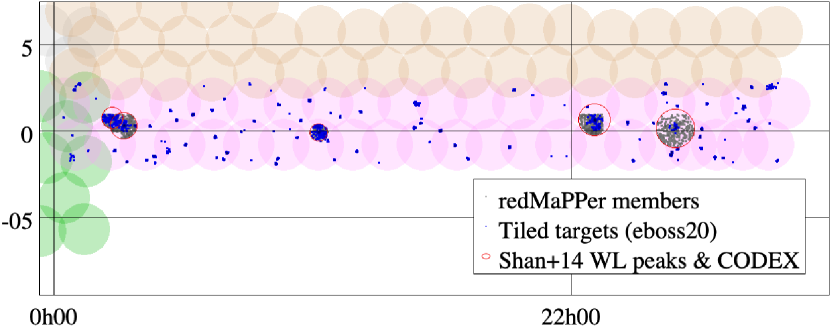
In chunk eboss20 we added red-sequence targets at larger cluster-centric radii than usual (up to five times the virial radius) in order to enable cluster mass determination through the caustic method (Diaferio, 1999). A few clusters were selected to this end, specifically weak-lensing detected clusters in the CFHT/Stripe82 imaging survey (Shan et al., 2014) with a match in the CODEX catalogue. Fig. 2 shows the distribution of targets on sky.
All targets described so far have bit mask EBOSS_TARGET2 set to 1.
A few improvements to the target selection were adopted, mainly intended to help confirm high-redshift systems in chunks eboss26 and eboss27. The following additional targets take advantage of deeper optical datasets overlapping the CODEX sample:
-
•
SPIDERS_CODEX_CLUS_CFHT: following the procedures described in Brimioulle et al. (2013), pointed CFHT/Megacam observations and CFHT-LS fields provide deep photometry. The redMaPPer (Rykoff et al., 2014) cluster finder detected 598 red-sequence galaxies selected as targets. Among them 515 are new additions to the original list of targets, thereby increasing by about one magnitude the depth probed in the small area of the sky covered by CFHT observations. The corresponding target bit mask EBOSS_TARGET2 is 6.
-
•
SPIDERS_CODEX_CLUS_PS1: a few high-redshift () CODEX cluster candidates were searched for red-sequence counterparts in PanStarrs PS1 (Flewelling et al., 2016). Our custom version of the Multi-Component Matched Filter (MCMF) tool (Klein et al., 2018) imposes a radial constraint of 2 Mpc for members based on the redMaPPer centre. Within this radial cut, each source is assigned a distance in colour-space (, and ) to a red-sequence model. Each source’s colour-distance is transformed into a colour-weight in every colour, which is then convolved with a Gaussian smoothing kernel to provide an estimate of the local density of red-sequence galaxies in the region of the cluster candidate. A total of 1,244 members are then selected by applying a threshold to the product of the weight and density within a radius of 1.5 Mpc from the optical centre with . They contribute 1,194 new objects to the original list of targets. The corresponding target bit mask EBOSS_TARGET2 is 7.
-
•
SPIDERS_CODEX_CLUS_DECALS: these targets are output of a custom red-sequence finder code applied to DeCALS photometric data222http://legacysurvey.org/decamls/ (Dey et al., 2019). 549 photometric members, matching the and colours of early-type galaxies, were selected from the region lying within 0.5 Mpc of the X-ray position, contributing 517 new targets to the original list. The corresponding target bit mask EBOSS_TARGET2 is 8.
2.1.2 The X-CLASS sample and targeting
The targeting of XMM-Newton serendipitous sources by SPIDERS is extensively described in C16. The targeting relies on a posteriori matching of redMaPPer detections down to richness and X-ray "Class 1" sources from the X-CLASS survey (Sadibekova et al., 2014). Target priorities were boosted relative to CODEX clusters to enhance their chance of being observed. The target bit mask EBOSS_TARGET2 is set to 5. Differences with respect to the CODEX sample are the scarcity of X-CLASS sources (pointed XMM observations cover a small sky area), the excellent positional accuracy of the X-ray detections (below ), and the uncontaminated nature of the sample (composed of truly extended X-ray objects). These characteristics make the spectroscopic confirmation of X-CLASS sample more straightforward.
2.2 Survey design
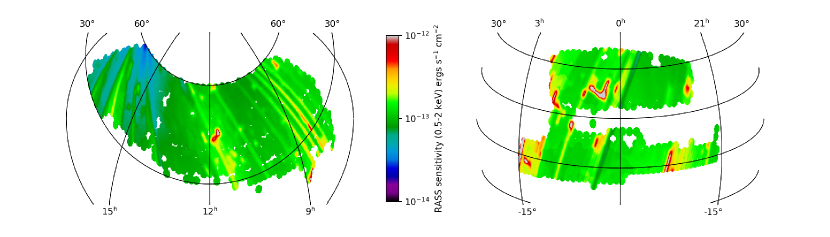
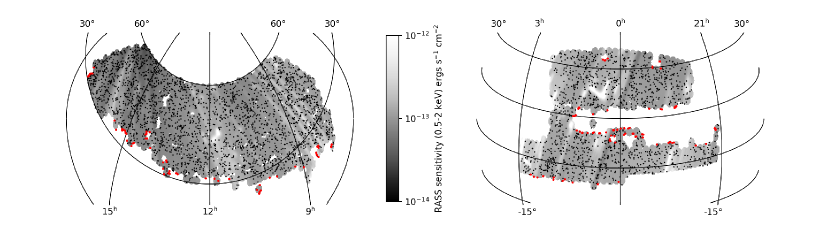
Figure 3 presents the sky coverage achieved after five years of survey, including the SEQUELS area acquired as part of SDSS-III (Albareti et al., 2017). The colour coding indicates the X-ray sensitivity of the ROSAT all-sky survey (RASS) from which the CODEX detections were drawn. The pixel size is approximately , equivalent to in the HEALPix333http://healpix.sourceforge.net sky pixelation scheme. Despite local inhomogeneities, the survey depth is rather uniform around ergs s-1 cm-2 in the (0.5 – 2) keV band. Note, however, the slight increase in depth at R.A. h, , close to the deep ROSAT North Ecliptic Pole (itself at R.A. h, ). As mentioned in the previous section, a modified targeting scheme is used to take advantage of the higher source number density in this area of sky.
In Fig. 3, each circle actually represents the footprint of an eBOSS spectroscopic plate. Only those plates acquired with average spectral signal-to-noise ratios reaching the quality threshold imposed by the survey are considered. The survey geometrical area subtends 5,350 deg2. Each of these 1,137 plates has diameter (7 geometrical area). Neighbouring plates substantially overlap; almost half of the geometrical area covered by one plate is common to one or several other plates. The plate distribution is slightly denser in the SEQUELS area (C16).
Each spectroscopic plate accommodates 1,000 spectroscopic fibres linked to the BOSS spectrographs (Smee et al., 2013) on the SDSS telescope (Gunn et al., 2006); a small fraction (a few percent) is dedicated to SPIDERS galaxy cluster targets, because of the low sky density of CODEX candidates (less than one per square degree). Most of the fibres are dedicated to the eBOSS programs (Quasars, Luminous Red Galaxies, Lyman- emitters, etc.), with some assigned to SPIDERS AGN targets and Time-Domain Spectroscopic Survey (MacLeod et al., 2018) sources. Because of the rarity of X-ray sources and the constraint imposed by strongly clustered SPIDERS galaxies, these objects received high priority in the process of assigning fibres to targets. Such a strategy ensured that a maximum of cluster targets could be assigned a fibre, especially at places where plates overlap, despite the large fibre collision radius () relative to arcminute-sized galaxy clusters.
2.3 Survey sensitivities prior to spectroscopic follow-up
2.3.1 The CODEX survey depths
The area sensitivity curves for the CODEX X-ray detections in the SPIDERS footprint is displayed in Fig. 4. The bottom panel splits the visualization across the various chunks (shown in Fig. 1). Such partitioning is arbitrary since the shapes of chunks were designed independently from any X-ray sensitivity consideration. This figure highlights the relatively narrow spread of their median flux limit, , around the value erg s-1 cm-2 among the multiple chunks, except for the eboss3 area which is slightly deeper ( erg s-1 cm-2).
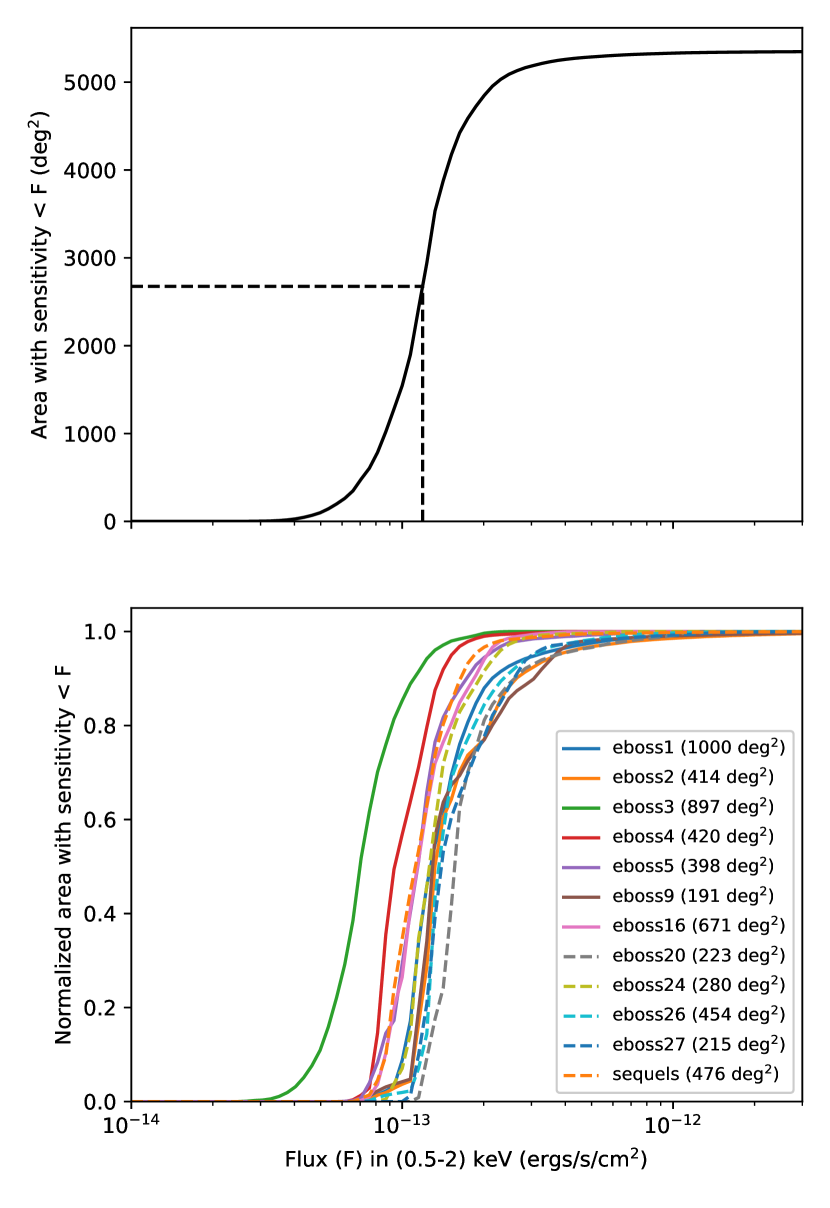
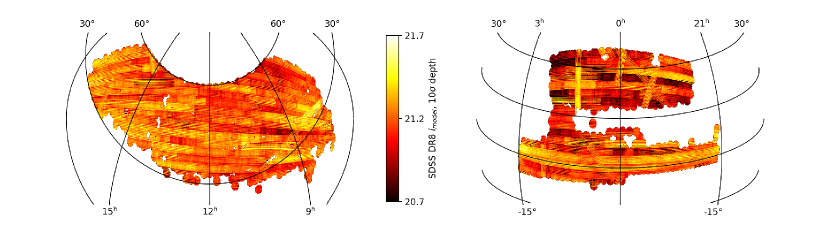
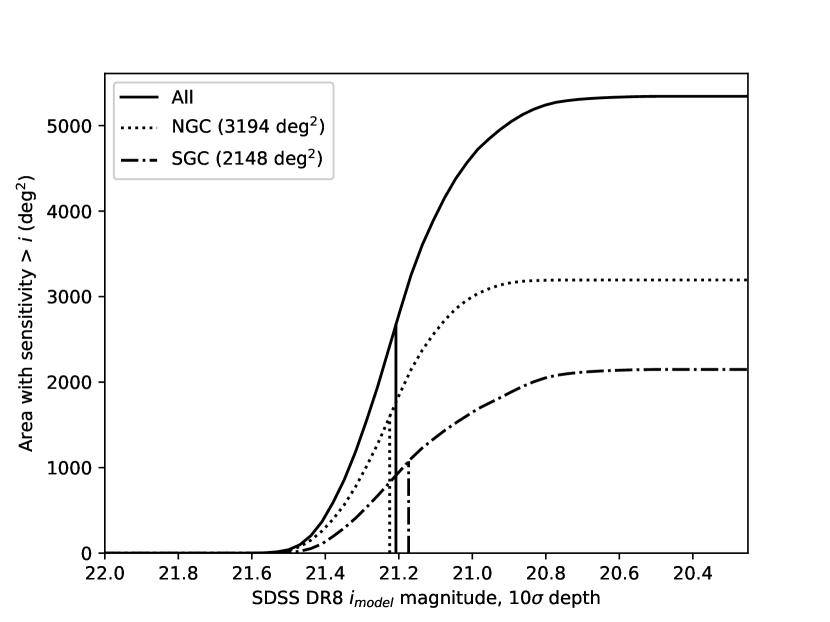
Figure 5 shows the sensitivity (the 10 depth in the band for galaxy sources444”Model” magnitudes are optimal measures of the flux using a matched galaxy model (Stoughton et al., 2002).) of the SDSS DR8 photometry on a scale of () restricted to the SPIDERS footprint. This map was extracted from the redMaPPer maps in HEALPix format555Retrievable at http://risa.stanford.edu/redmapper/ and is relevant for the version of the data and algorithms used in this work. The procedure followed in constructing these maps, as well as a discussion on their peculiar features, is given in Rykoff et al. (2015). It is beyond the scope of this paper to provide details of these photometric maps; rather, we emphasize here the typical 0.2 mag depth variation across the survey in the band. For the purpose of identifying counterparts to faint ROSAT sources, this is sufficiently uniform coverage. There is, however, a noticeable difference between the North Galactic Cap (NGC) and South Galactic Cap (SGC) parts of the sky, which impacts the spectroscopic observations of higher-redshift and lower-mass systems. This is more easily seen in Fig. 6, where the pixelated maps of Fig. 5 were used to compute the effective area as a function of limiting magnitude. The SGC has a slightly higher median limiting magnitude, and a tail towards shallower sky patches.
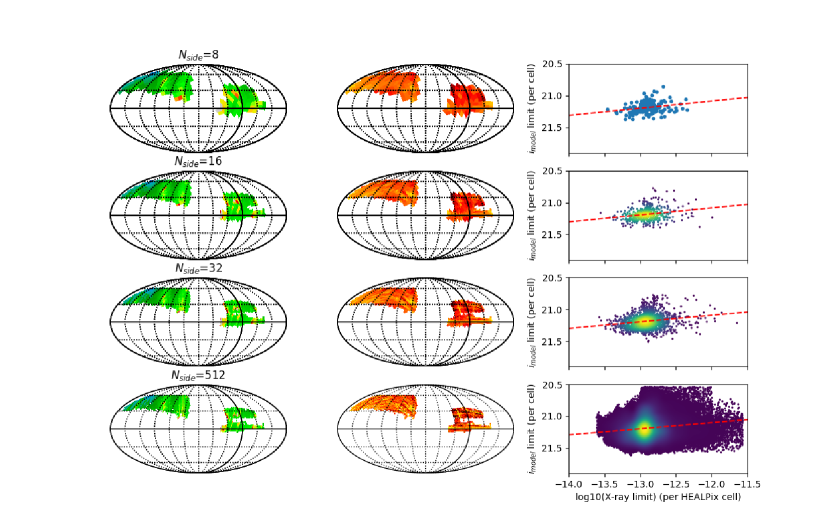
The sensitivities (both X-ray and optical) are essentially uniform across the survey area, which eases the calculation of a selection function for cosmology. Figure 7 explores spatial correlations between the X-ray and -band sensitivities across the survey area. We performed pixel-alignment and downsampled the HEALPix maps (Fig. 3 and 5) at various resolutions () by averaging sensitivities in adjacent pixels and maintaining the equal-area HEALPix gridding. Such a binning scheme is a crude approach in the presence of strong gradients in the sensitivity maps (e.g. holes in the X-ray exposure map); however, those features are relatively few. Matching the resulting maps pixel-to-pixel reveals that the X-ray and optical sensitivities are weakly correlated at all studied resolutions (third panel in the figure). Fits to the data points provide similar results at resolutions corresponding to all values of , with a slope and intercept 21.2 when expressed in terms of and . The absolute Spearman correlation coefficient ranges between 0.24, in the low-resolution case, and 0.12, in the high-resolution case; the p-value remains very small due to the high number of points. This analysis portrays a weak, albeit significant, correlation between the optical and X-ray survey sensitivities. This feature has been exploited in the targeting strategy and the spectroscopic confirmation of cluster candidates, for instance by imposing a uniform target magnitude limit () and performing visual validation of candidates independently from the exact location of a candidate on sky.
2.3.2 The X-CLASS survey depths
Clerc et al. (2012) presented a method for deriving the selection function of sources selected as ’C1’ extended sources in the XMM-Newton archive. This technique is supported by extensive end-to-end simulations of individual pointings coupled with the same source detection pipeline as in the data analysis. The ‘C1’ class (Pacaud et al., 2006) is defined as an almost pure selection of extended sources based solely on X-ray detection criteria (measured extent, extent likelihood specifically). In this approach, ‘pure’ means free from spurious detections and contamination by point-like sources, as long as the input conditions of the simulations are a faithful representation of real observing conditions. Overlaps of neighbouring pointings (each spanning on sky) are treated consistently with the catalogue construction (e.g. higher exposure pointings are favoured, while two pointings of similar exposure bear equal weights). In practice, selection functions pre-computed on a grid of pointing exposure time, local background level, and local Galactic absorption are interpolated and this provides the probability of detecting a galaxy cluster of core-radius (arcsec) and flux (in the 0.5–2 keV energy band) at a given sky location. The X-CLASS survey is significantly deeper than RASS; for instance, a galaxy cluster represented as a -model (Cavaliere & Fusco-Femiano, 1976) surface brightness profile with apparent core-radius and (0.5–2) keV flux erg s-1 cm-2 has about probability of being detected and classified as ‘C1’ in a 10 ks XMM observation with standard background levels.
Because the same imaging dataset is used in finding counterparts to X-CLASS sources as to CODEX sources, optical sensitivities are identical to those presented previously (e.g. Fig. 5); in particular, these optical sensitivities limit the accessible range of cluster redshifts to . The comparatively deeper X-ray survey thus enables probing lower mass clusters on average, almost reaching the group regime. Finally, recall that the matching procedure between X-ray and optical cluster detections slightly differs from that used to build the CODEX sample: it relies on a cross-match between two independent catalogues, while CODEX is a red-sequence search around each X-ray source. It is beyond the scope of this paper to quantify the subsequent selection introduced by the optical/X-ray cross-matching; the reader is referred to Sadibekova et al. (2014) for further details.
3 Galaxy cluster survey data
This section provides an overview of the final spectroscopic data and products obtained through the SPIDERS survey. We also review the main features of the galaxy cluster catalogues constructed from this sample, described in dedicated papers: Kirkpatrick et al. (subm) (hereafter K20) for CODEX and Clerc et al. (prep) for X-CLASS.
3.1 Tiling and fiber assignment
Tiling is the process that assigns spectroscopic fibres to targets in the most efficient manner. Survey tiling is performed simultaneously for all eBOSS subcomponents, including SPIDERS (Dawson et al., 2016); each chunk being treated independently from the others. Each survey subcomponent provides a list of prioritised targets to the algorithm, such targets are denoted as ‘submitted’. A submitted target may be present in more than one list. Targets which are assigned a spectroscopic fibre are denoted as ‘tiled’; these targets enter an observing queue at the telescope and they may eventually be observed. C16 provides a presentation of the tiling results with a perspective on galaxy cluster confirmation efficiency and the impact of the fibre collision radius. Most of these findings are unchanged for the chunks most recently tiled (eboss20/24/26/27). Due to both the requirement of high completeness and the low number density of sources, SPIDERS targets are assigned fibres with highest priorities; putative Brightest Central Galaxies are prioritised first among those. Besides the natural dimming of cluster galaxies with increasing redshift, strong observational constraints are imposed by the collision radius of fibres feeding the BOSS spectrographs. Typical SPIDERS galaxy cluster extents range from two to a few arcmin, and red-sequence galaxies are concentrated towards the cluster centre as their luminosity increases. Overlaps of spectroscopic plates allows one to revisit a certain area of sky twice (or more), thus slightly alleviating the issue of fibre collision.
Figure 8 presents numbers of targets grouped by their redMaPPer membership probability (). The histograms are computed for the area of sky surveyed by SPIDERS (5,350 deg2 as shown in Fig. 3). Roughly speaking, encapsulates information about the luminosity of a galaxy, its distance in colour-space from the red-sequence, and its physical distance to a cluster centre. By design of the targeting algorithm, is always greater than 0.05 for SPIDERS clusters. The target allocation completeness (shown in the top panel) is roughly constant at up to . The allocation completeness slightly decreases at high as a consequence of the finite fibre collision radius and the spatially concentrated nature of high- galaxies within a cluster. The middle panel represents the target selection completeness (ratio between the blue and red curves). The target selection algorithm is able to allocate a fibre to 10% of all photometric members with . This ratio continuously rises up to as approaches 1.
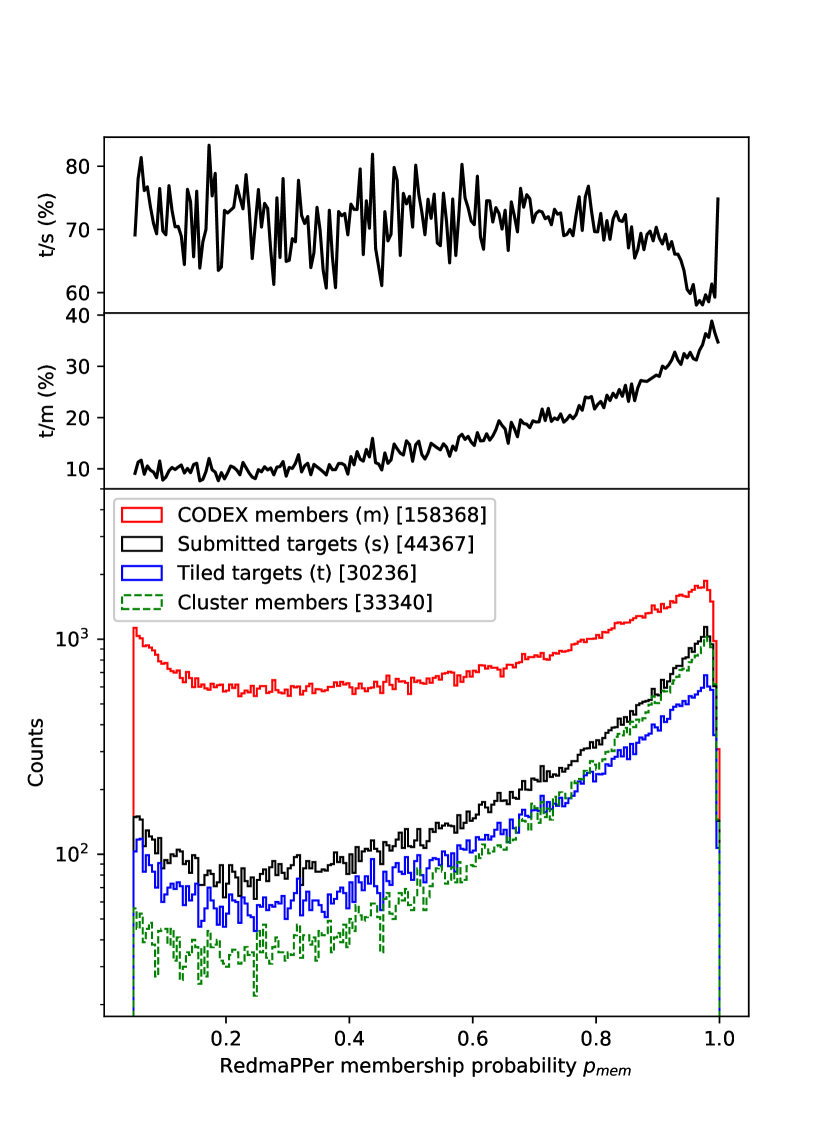
The number of tiled targets displayed in Fig. 8 (30,236) is slightly higher than the actual number of observed targets (29,609, see next section), even though they share identical sky footprints. Unobserved targets are of two kinds. Those located at the border of the survey footprint were assigned a fibre on a neighbouring spectroscopic plate that was not observed during the course of the survey (see also Fig. 14). Those located in the SEQUELS footprint were initially assigned a fibre and were discarded while applying the SPIDERS target algorithm (C16). We also show in Fig. 8 the number of spectroscopically identified cluster members (see Sect. 3.3). Their total number exceeds the number of tiled targets, because our final analysis makes use of data obtained prior to SPIDERS during previous SDSS projects.
3.2 Spectral quality and completeness of SPIDERS spectra
In this section we discuss specifically new targets acquired as part of the SPIDERS galaxy cluster survey. From the SDSS DR16 spectroscopic sample, we retrieve all those targets with bit flag EBOSS_TARGET1 set to 31 (SPIDERS targets) and EBOSS_TARGET2 set to 1 (CODEX cluster targets) or 5 (X-CLASS cluster targets). The overlap between the CODEX and X-CLASS cluster samples is non-zero, hence the overlap between the corresponding target classes. We also include in this discussion galaxy cluster targets acquired as part of the SEQUELS survey, released together with SDSS DR13 (Albareti et al., 2017) and reanalysed in DR16; these are obtained by selecting objects with bit flags EBOSS_TARGET0 and ANCILLARY_TARGET2 set to 21 and 53, respectively. To ensure removal of duplicate acquisitions, only objects with SPECPRIMARY set to 1 are considered.
Table 1 summarises the numbers of spectra obtained as part of the SPIDERS galaxy cluster program. The top section of this table relates to SPIDERS targets, the bottom to SEQUELS targets. The vast majority of SPIDERS cluster spectra are linked to a CODEX (RASS) target. A small overlap () with the SPIDERS AGN targets is noticeable, due to the different nature of the algorithms matching X-ray sources to optical sources for clusters and AGN. Consistent with the high overall signal-to-noise ratio of the spectra, only of the spectra have a ZWARNING_NOQSO > 0, indicative of a less reliable fit. Those spectra correspond to low signal-to-noise ratio spectra or absence of signal in the detectors, due e.g., to unplugged fibres.
| SPIDERS clusters spectra | 26817 | |
| - CODEX targets | 26016 | 97.0% |
| - XCLASS targets | 1134 | 4.2% |
| - SPIDERS AGN targets | 121 | 0.4% |
| - Reliable fit(a) | 26508 | 98.8% |
| - Reliable fit(a), type(b) "GALAXY" | 26399 | 98.4% |
| * with | 16940 | (64.2%) |
| * with | 9382 | (35.5%) |
| * with | 77 | (0.3%) |
| SEQUELS clusters spectra | 2792 | |
| - Reliable fit (a) | 2769 | 99.2% |
| - Reliable fit(a), type(b) "GALAXY" | 2761 | 98.9% |
| * with | 1850 | (67.0%) |
| * with | 909 | (32.9%) |
| * with | 2 | (%) |
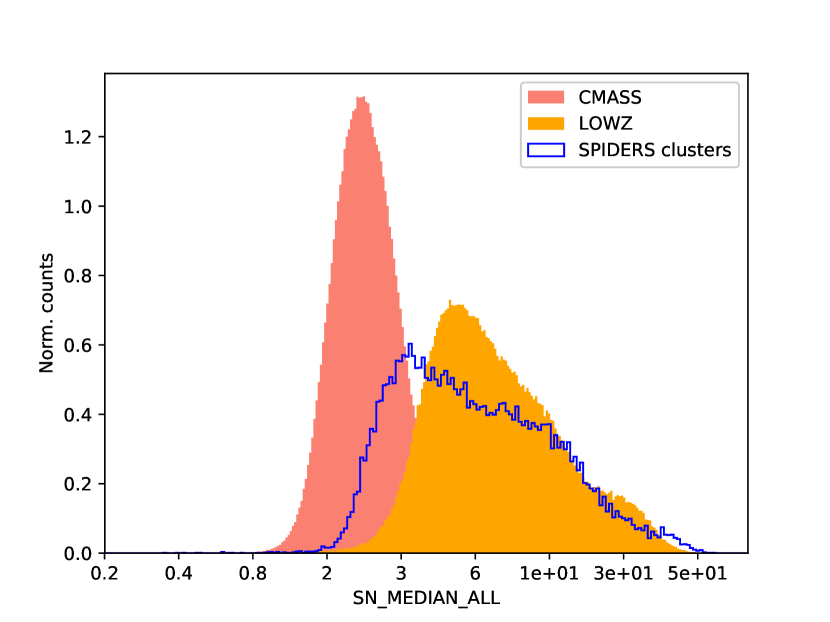
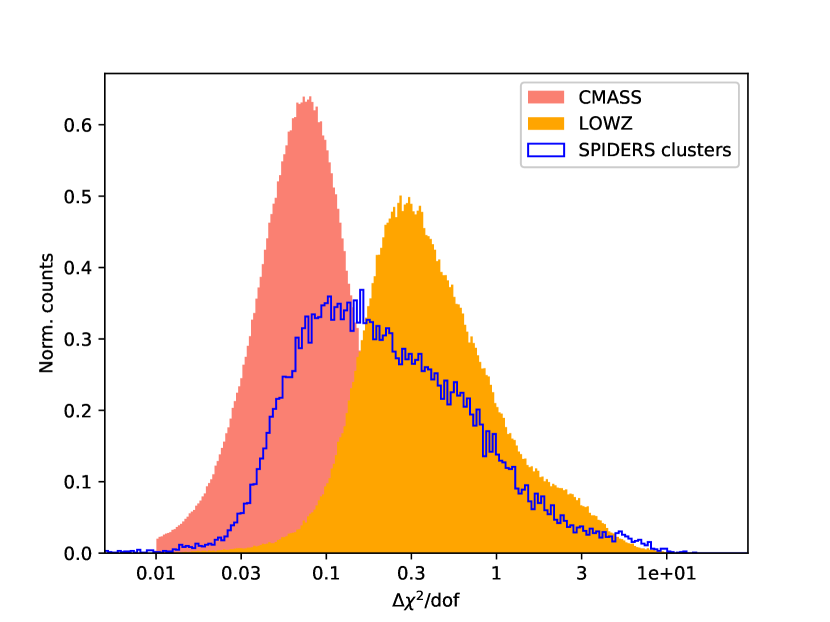
The histograms in Fig. 9 and Fig. 10 provide more detailed views of the quality of this new spectroscopic dataset in terms of the median signal-to-noise ratio of the spectra (SN_MEDIAN_ALL) and the value, respectively. The former is interpreted as a tracer of the quality of the spectra; the latter is the difference between the reduced of the best fit template and the second best fit template after exclusion of quasar templates from the fit and is therefore an indicator of the reliability of the template selected to determine the redshift of the target (Bolton et al., 2012). To ease the comparison, the distributions for the widely-used CMASS and LOWZ galaxy samples of SDSS-III/BOSS (Dawson et al., 2013) are displayed; SPIDERS spectral quality is located between these two samples and its distribution is broader.
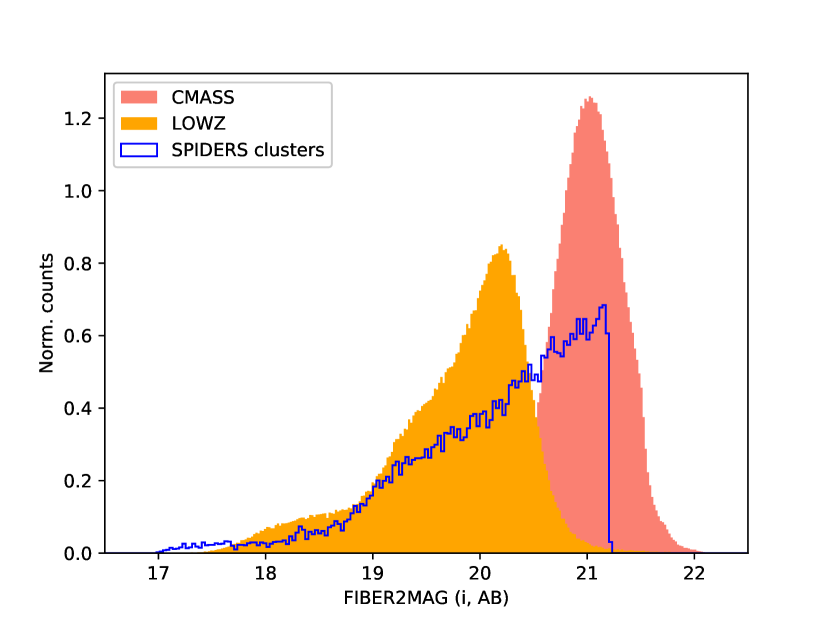
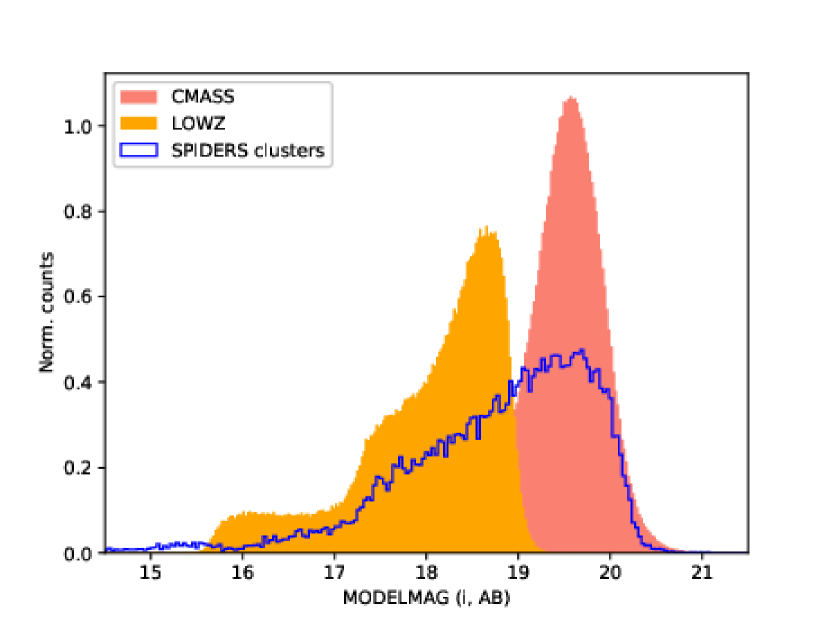
Figure 11 shows the distribution of "fiber2mag" magnitudes in the SDSS- filter for SPIDERS and CMASS/LOWZ targets. These values scale directly with the flux entering a spectroscopic fibre. By design, it exhibits a sharp cut-off at . The distribution is strongly skewed towards fainter sources, as expected from the shape of the luminosity function of cluster galaxies. The relative locations of this distribution compared to the CMASS and the LOWZ targets are consistent with the distributions shown on Figs. 9 and 10. This behaviour is a direct consequence of the homogeneity of the spectral types (passive galaxies mainly) and consistent with the flux being the main driver of the spectral quality. Finally, Figure 12 represents the SDSS "model" magnitude distribution of targets, more representative estimate of the total light emitted by the galaxies in the filter. The smoother cut-off is located around .
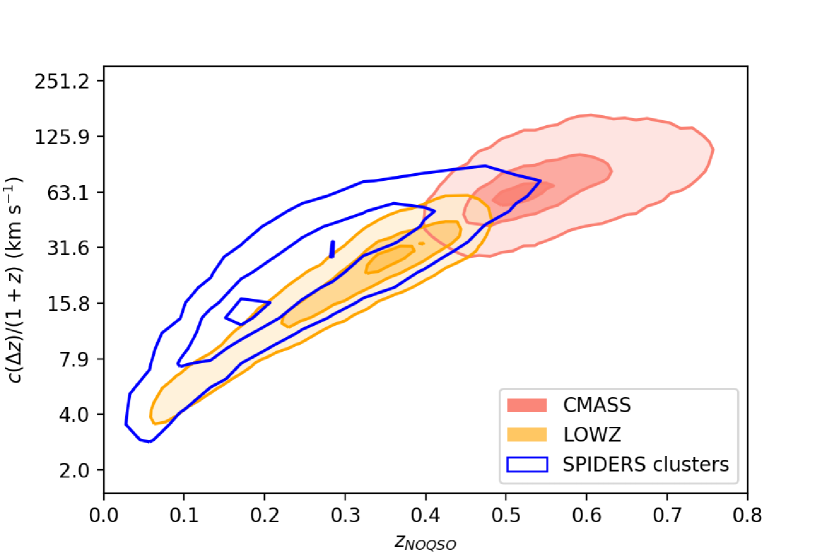
SPIDERS galaxy cluster confirmation relies on "_NOQSO" best-fitting values, which are obtained by discarding quasar (QSO) models from the spectral template library (Bolton et al., 2012). In particular, object redshift () and associated uncertainties () are extracted from columns Z_NOQSO and Z_ERR_NOQSO. Fig. 13 presents the distribution of targets in the - plane for the SPIDERS spectroscopic sample. On average, cluster targets reach and their redshift distribution peaks at . The typical redshift uncertainties () increase with redshift and are slightly higher than those of the LOWZ and CMASS samples. Again, this behaviour follows expectations from targeting satellite galaxies in massive halos. Following Bolton et al. (2012) and Dawson et al. (2016), the pipeline uncertainties on individual redshift estimates should be multiplied by a factor of up to 1.34 in order to match tests done with repeat observations in BOSS. The median uncertainty for SPIDERS cluster redshifts with a reliable fit is approximately 20 km s-1. This value is well below the typical 100–1000 km s-1 galaxy velocity dispersions in galaxy clusters. Less than 1% of the objects have uncertainties above 60 km s-1 and five objects show greater than 100 km s-1 uncertainties. Individual galaxy redshifts uncertainties are taken into account at the galaxy cluster catalogue production stage during visual inspection; extremely large values are usually interpreted as a redshift failure by inspectors and lead to discarding the corresponding object from the membership list (K20).
Each successful redshift determination is associated with a spectral template. The vast majority of best-fit templates correspond to the "GALAXY" type of SDSS (as indicated by the CLASS_NOQSO column in the DR16 spectroscopic sample). The 117 remaining spectra, among the 29277 reliably characterised ones, were fitted best with a "STAR" template at redshift zero. This relatively low fraction highlights the high-purity of the photometric classification and targeting algorithms.
The numbers presented in this section underscore the high overall spectral quality of the dataset acquired as part of the SPIDERS galaxy cluster program. The combined reliabilities of the eBOSS pipeline automated classification and redshift determination considerably ease the galaxy cluster construction process, since most of the individual galaxy spectra do not require further visual inspection. In addition, the spectroscopic success rate close to 100% makes the computation of the final selection function a relatively simple task; i.e., the survey strategy allows one to shift the effort on the galaxy cluster membership and confirmation rather than on the validation of individual galaxy redshifts.
3.3 The SPIDERS reference galaxy cluster sample
Combining SPIDERS spectra with observations acquired during previous SDSS campaigns provides a large homogeneous database of redshifts whose prime usage is X-ray galaxy cluster confirmation. We briefly introduce here both cluster catalogues constructed from this combined dataset. Details of their construction, content, access and usage is provided in separate papers, cited in the following paragraphs.
3.3.1 Sampling and completeness of cluster red-sequences
Figure 14 displays the sky location of individual cluster targets, with emphasis on spectroscopic completeness. Clusters missing one or several redshifts in their list of assigned targets are highlighted as red dots. These are mostly located at the border of the survey. At those positions, unobserved neighbouring spectroscopic plates can compensate for the missing data. The localised nature of incomplete systems and their low number is an outstanding result of the SPIDERS spectroscopic survey, enabling precise computation of the spectroscopic selection function of the final sample, thanks to the reproducible targeting process. The spectroscopic completeness of X-CLASS galaxy cluster candidates follows a similar pattern on the sky. Only 11 systems lack one or more redshifts among the 142 located within the survey footprint.
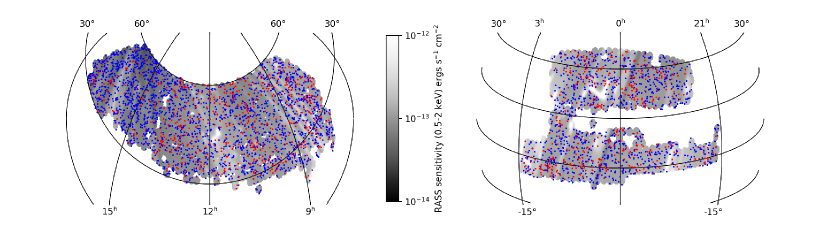
Figure 15 similarly represents candidate clusters, now colour-coded by the number of spectroscopic redshifts collected for their red-sequence. Such targets may eventually not belong to the final set of confirmed clusters. The typical (median) number of spectroscopic redshifts per red-sequence is nine. In this figure, clusters with at least 15 galaxy redshifts from the red sequence are plotted in red. It is clear from this figure that the eboss3 chunk, located at right ascensions between approximately 14h and 17h, significantly differs from the bulk of the survey. This result is a direct consequence of the targeting algorithm being adapted to the locally greater RASS sensitivities (Sect. 2.1), which led to redistributing the fixed number of allocated spectroscopic fibres onto a larger pool of CODEX cluster candidates. Such a trend is absent from the X-CLASS targeting strategy, which shows a constant number of thirteen (median) spectroscopic redshifts per red-sequence.
3.3.2 The CODEX/SPIDERS catalogue
Kirkpatrick et al. (subm) (K20) describe the CODEX galaxy cluster sample validated with SPIDERS spectroscopy. This sample consists of 2,740 unique X-ray systems confirmed by combining an automated membership assignment performed by an algorithm and a series of refinements issued from collaborative visual screening performed by eleven experts. A moderation process combines individual inspections and eventually determines a unique membership list (and a unique cluster redshift, velocity dispersion, X-ray luminosity, mass, etc.) for each confirmed system. A final cleaning and merging is performed manually; this action allows removal of obvious duplicates and flags merger systems. The redshift range of this sample is with a typical (statistical) uncertainty on each systemic redshift . The median number of spectroscopic members per system is 10 (the mean is 12) and ranges between 3 and 75. The median number of visual inspectors per validated system is three, and a minimum of two people validated a galaxy cluster. Scaling from their X-ray luminosities, the typical mass666Expressed here as , the mass within a radius . This is the radius enclosing an average density 200 times above the critical density at the cluster redshift. of those systems amounts to , although individually precise mass values cannot be obtained with solely this dataset in hand. Excluding systems with less than 15 spectroscopic members, the mean velocity dispersion of galaxies within the SPIDERS clusters is about 620 km s-1.
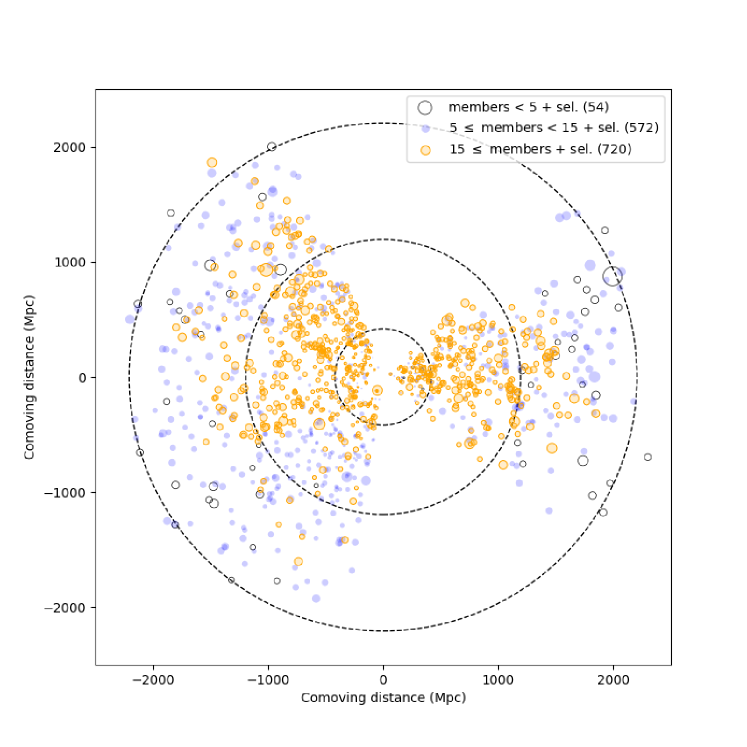
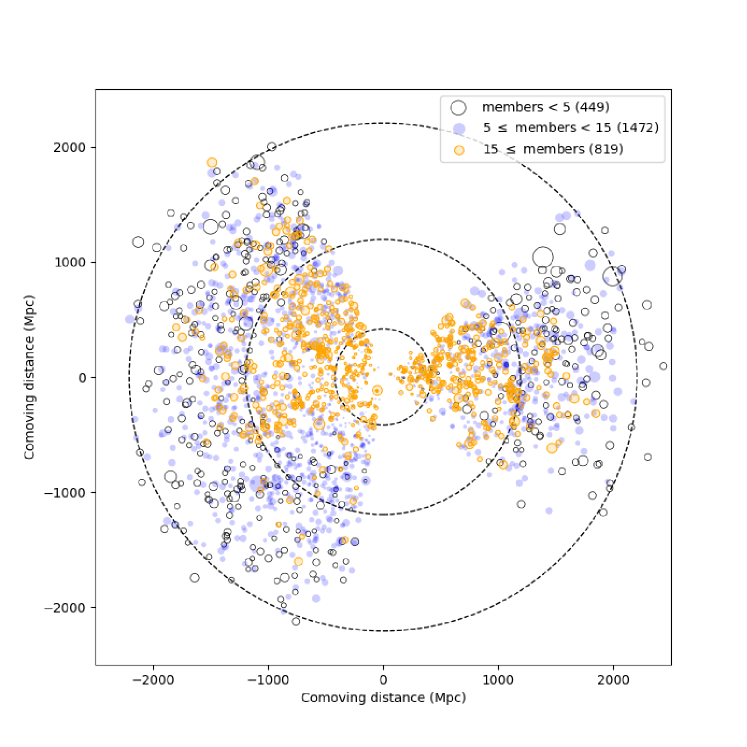
Fig. 16 provides an illustrative overview of the complete galaxy cluster catalogue. It represents each galaxy cluster by a circle whose size scales with its X-ray luminosity. The latter measurement may be impacted by various systematic uncertainties, among them contamination by AGN emission along the line of sight, possibly within the cluster itself. The locations of the systems are determined by their comoving distances from an observer located at (0, 0). The figure is drawn in the celestial equatorial plane. The left- and right-hand wedges correspond to the North and South Galactic caps, respectively. The colour coding indicates the number of spectroscopic members per system; the lower-left region of this plot comprises relatively less objects with . This area of the sky corresponds to the chunk eboss3 where spectroscopic fibres (available in a limited amount) were evenly distributed among the more numerous X-ray sources. Malmquist bias clearly appears in the figure; at higher redshifts, the typical luminosity of the systems increases due to selection effects.
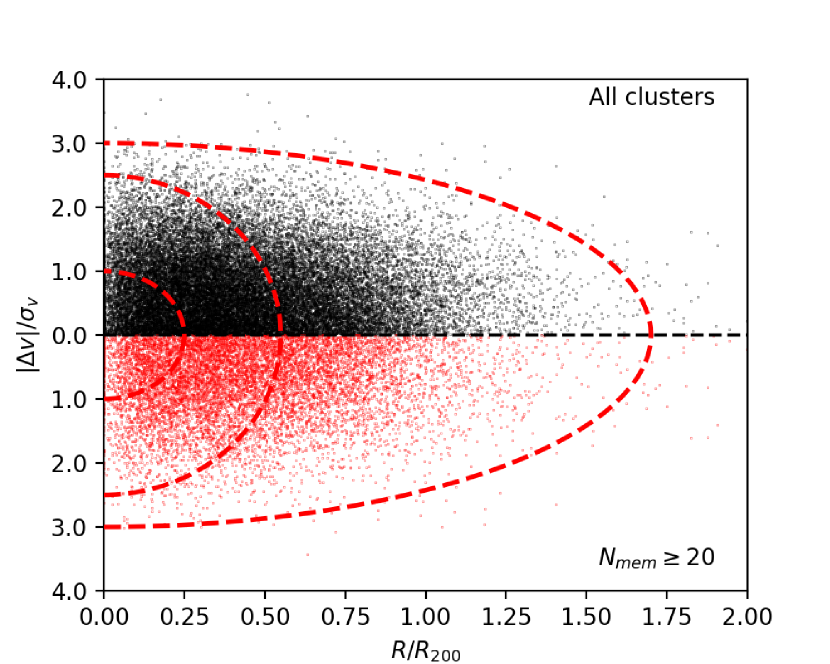
Thanks to the exquisite precision of each individual redshift measurement, it is possible to investigate the velocity dispersion of galaxies within the confirmed clusters. Figure 17 displays the projected phase-space distribution of galaxies identified as cluster members in the CODEX sample. The projected distance is normalised to the value of obtained from the relationship between X-ray luminosity and mass appropriate to these clusters. The velocity shift is normalised to the velocity dispersion measured from the velocity data itself, using the gapper or the biweight estimates (K20). In the upper panel, all confirmed clusters are considered, thereby mixing badly determined velocity dispersion values with better measured ones. In the bottom panel, only those clusters whose number of spectroscopically identified members exceeds 20 are represented. These clusters benefit from high-quality systemic redshift measurements and robust determinations of the velocity dispersions of their member galaxies. The reliability of the normalisation value mainly depends on the X-ray luminosity measurement itself and should also be considered with caution. Such distributions are key in determining dynamical mass estimates of clusters, as demonstrated in Capasso et al. (2019, 2020) for a subset of the SPIDERS catalogue. In these works, dynamical masses are obtained by fitting mass models to phase-space distributions similar to those shown in Fig. 17, after additional cleaning based on richness and red-sequence spectroscopic coverage.
3.3.3 The X-CLASS/SPIDERS catalogue
The X-CLASS galaxy cluster sample validated with SPIDERS spectroscopy consists of 124 unique systems identified and confirmed following a similar methodology to that for the CODEX clusters. However, some notable differences occur in the visual screening process, namely: i) only one inspector participated in the visual screening and ii) X-ray data carried heavier weight in the decision process. These differences are direct consequences of the increased angular resolution and positional accuracy of the XMM detections with respect to RASS. It is straightforward to co-locate optical data and X-ray data based on the centroid and extent of X-ray sources. Visual inspection thus reduces to checking the 2d+1d (sky+redshift) consistency between X-ray, red-sequence, and spectroscopic data.
The median number of spectroscopic members per confirmed galaxy cluster is 10; the mean is 12. These numbers are similar to those derived for the CODEX clusters. The mean redshift is and ranges from 0.04 to 0.60. Optical richness ranges from to , and a fraction of the sample overlaps the CODEX sample described in previous paragraph. Interestingly, all X-CLASS confirmed clusters are ‘C1’ detections, thus providing enough photons on XMM detectors to enable good centroid and surface brightness profile measurements, as well as luminosity and temperature measurements in fixed apertures for all systems (e.g. Adami et al., 2018).
3.4 Spectral properties of the cluster member population
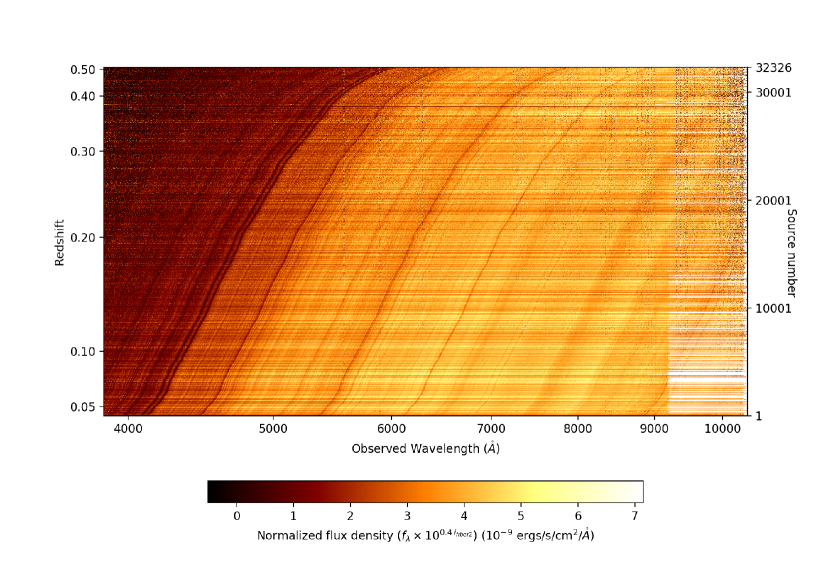
Figure 20 displays all individual spectra of galaxies identified as members of the CODEX sample, sorted by redshift. These objects were selected by imposing SCREEN_ISMEMBER_W greater than 0.75, meaning that more than 75% of visual inspectors identified those objects as members of a galaxy cluster (K20) A fraction of the spectra lack coverage beyond Å since their origin is in SDSS-I/II datasets, with limited bandwidth in comparison to the BOSS/eBOSS surveys. The displayed fluxes are rescaled with the fibre fluxes in the band. This figure highlights a homogeneous spectral dataset of red, passive galaxies with notable absorption features such as Ca H+K, G-band, Mg i, NaD, etc. Barely visible in this figure are a few galaxies with emission lines such as [O iii] and H, included ‘by chance’ or by targeting algorithms other than SPIDERS.
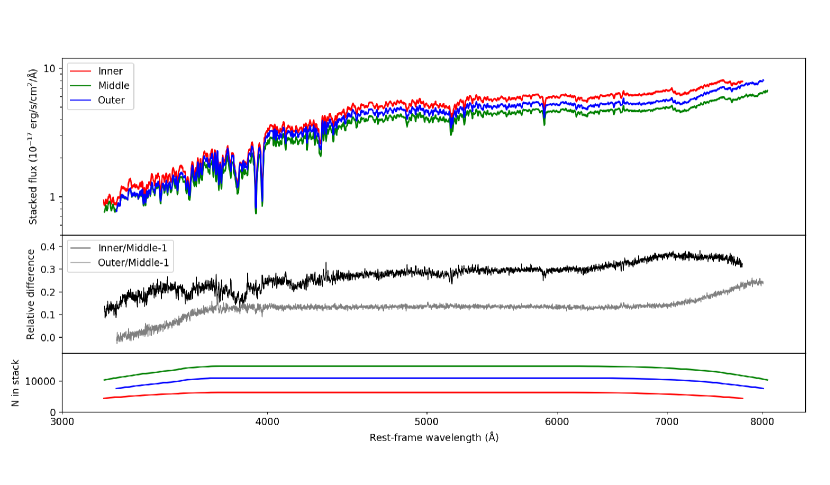
We fit stellar population models to stacks of SPIDERS red-sequence galaxies, following the empirical phase-space binning introduced in Muzzin et al. (2014). The bins are denoted ‘inner’, ‘middle’ and ‘outer’ as drawn in Fig. 17. Stacks of the observed galaxy spectra are displayed in Fig. 18. Although their definition is somewhat arbitrary, these bins are expected to correlate with time since infall onto the cluster (Muzzin et al., 2014). The stellar population models (Chabrier IMF, MILES library) and fitting routine used allow one to decompose the observed continuum into a set of stellar populations of different ages (Comparat et al., 2017; Wilkinson et al., 2017). Regardless of the phase-space bin location, the stellar population is dominated by old and high metallicity populations. More than 90% of the mass comes from stellar populations older than years. There is no hint of new star formation episodes. This result is consistent with Bruzual & Charlot (2003) models used for the red sequence selection in Rykoff et al. (2014).
3.5 Selection function of the confirmed sample and X-ray luminosity function
The set of galaxy clusters making the confirmed catalogue is a sample of the true underlying galaxy cluster population. The selection function is the statistical description of the link between both sets. Besides the geometrical selection on the sky, the sensitivity of the X-ray imaging to extended sources is the primary filter governing the selection. Then, the association to optical red-sequence galaxies enters as a secondary filter; it is a strong function of the richness and of the redshift of the galaxy concentrations. The spectroscopic follow-up, that is the chain of processes described in this paper, acts as an additional filter; it excludes systems with too few spectroscopic members. It is a complex function of the cluster properties, of the targeting algorithm and of the line of sight direction. Its computation is considerably simplified by taking advantage of the homogeneous and uniform coverage of SPIDERS. The spectroscopic selection is governed by the number of galaxies above a threshold luminosity, that is related to the cluster richness , and by the distance of the object to the observer, that is given by its redshift . K20 found the spectroscopic completeness of the sample can be expressed as a step function: a red sequence of galaxies in the CODEX survey is spectroscopically confirmed by SPIDERS if . Here is the redshift-dependent scaling adopted by redMaPPer to account for galaxies brighter than and fainter than the SDSS magnitude limit (Rykoff et al., 2014); it relates the raw galaxy counts to the richness estimate and the selection cut is easily interpreted in terms of the number of targetable galaxies in a cluster of a given richness . This number drops at as the SDSS limiting magnitude makes the fainter cluster galaxies undetectable. The factor encapsulates the effect of the target selection scheme, of fibre collisions, the photometric outlier rate, etc. The cleaning criteria derived by Finoguenov et al. (2020), based on the 10% RASS sensitivity, is a more conservative cut and reads : (see also Ider Chitham et al., subm, and Fig. 21).
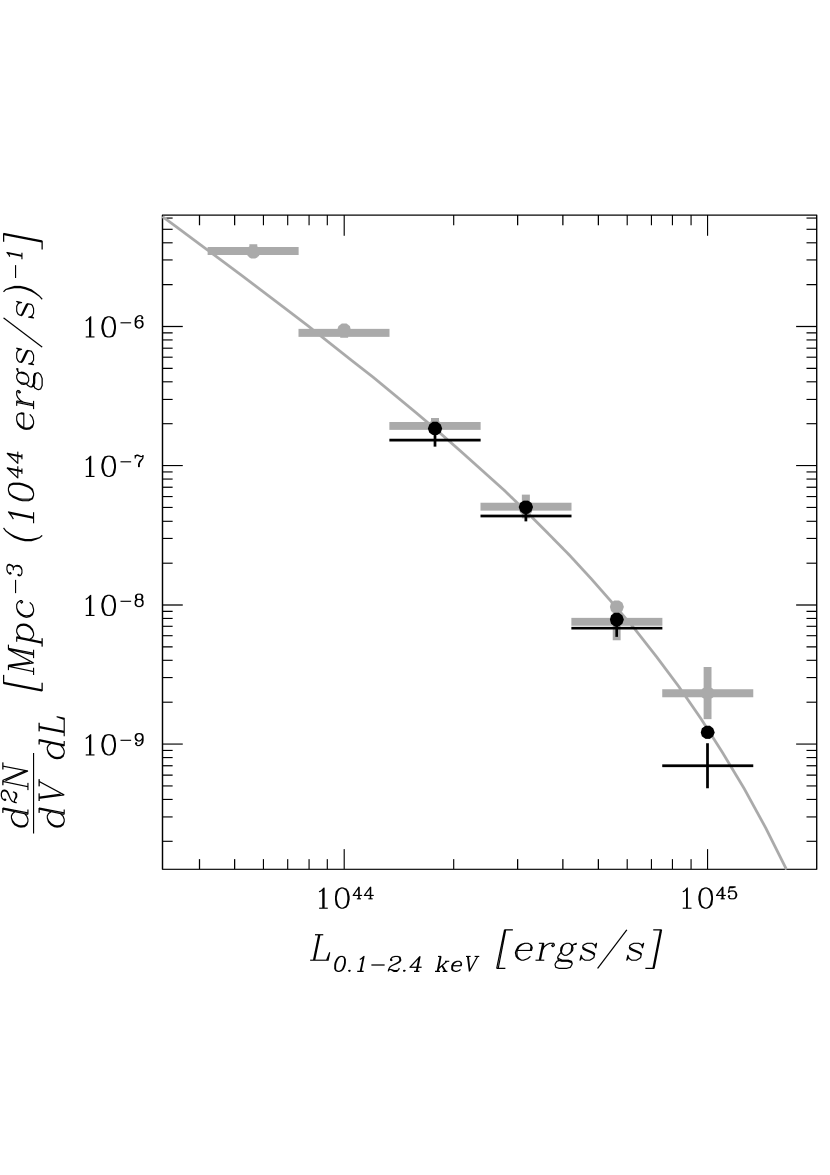
This selection function is used in modelling the survey and catalogue creation. Fig. 19 presents the X-ray luminosity function (XLF) derived from the CODEX galaxy cluster catalogue, using either spectroscopic redshifts or photometric (redMaPPer) redshifts. Only luminosity bins with completeness above 50% are retained. Calculations with spectroscopic redshifts (represented with crosses in the figure) incorporate removal of X-ray flux originating from AGN, stars and blazars, identified with the counterpart finding method ‘NWAY’ (Salvato et al., 2018) in the entire SPIDERS analysis region (Comparat et al., 2020). We only considered AGN with separations from the X-ray source smaller than and in any case smaller than the separation between the X-ray peak and the optical cluster.
The X-ray luminosity function shown in Figure 19 is not strongly impacted by the use of photometric redshifts (as expected) due to its slow evolution and the relatively large redshift bins used in this calculation. We found however that removal of spectroscopically identified AGN contribution has a significant impact on the shape of the XLF. While the effect remains moderate at low redshift (), at high redshift removal of AGN is essential. A 15% shift in the XLF induces a shift on cosmological parameters comparable in magnitude with the current uncertainties on cosmological parameters.
4 Discussion and conclusions
4.1 A highly multiplexed spectroscopic follow-up programme
SPIDERS represents an enormous investment of observing time, data processing, and management. It is, in several respects, unprecedented in the field of galaxy cluster studies, as witnessed by the following key numbers: close to 27,000 new redshifts were obtained in the project, distributed across more than 4,000 potentially massive halos within a volume approaching Gpc3 (comoving). Thanks to coherent data and information streams flowing from X-ray source detection down to final catalogues, its achievement is in large part due to the well-suited infrastructure of the SDSS-IV and eBOSS projects, including tools such as robust pipelines, uniform data bases, etc. This process is supported by significant team engagement and experience accumulated during years of operations.
The main objective of SPIDERS is to place cosmological constraints based on studies of the large-scale structure (e.g., Ider Chitham et al., subm). Such studies typically require large number statistics, precisely measured observables, and wide ranges of halo mass and redshift, with vigilant control over selection effects. Therefore, the focus of this project was on obtaining redshifts for as many X-ray clusters as possible, ensuring reasonable balance between signal-to-noise ratio of redshift measurements (i.e., number of spectra per cluster) and coverage of the mass-redshift plane. Our targeting design accounts for the instrumental and survey limitations: fibre collision radius, spectrograph limiting magnitude, and wavelength coverage, etc. We have demonstrated that such a strategy is successful in obtaining a high-quality, uniform set of galaxy redshifts out to (Fig. 20). Because such a set benefits from extremely reliable spectral classifications and redshift measurements, our design avoids inspection of individual spectra. Most of the manual workload is shifted onto verifying the cluster membership assessment preceded by an automated algorithm.
This visual inspection step plays a decisive role in the regime of low number of redshifts per cluster. Concerning SPIDERS/CODEX, all systems with optical richness above 10 have been visually inspected by at least two people (K20). In total, more than 15,000 distinct visual inspections were collected. Such a process is possibly impaired by biases inherent to human intervention. We believe, however, that chaining the automatic membership determination with two or more independent visual inspections does provide a robust determination, in line with most state-of-the-art X-ray cluster spectroscopic surveys (Guzzo et al., 2009; Adami et al., 2018; Sohn et al., 2018a). Developments are in progress to further automatise the cluster membership association process (e.g., using machine learning). For instance, learning from the set of visual inspections sourced by SPIDERS, one may easily imagine an algorithm capable of associating spectroscopic redshifts with red-sequence galaxies and, ultimately, with X-ray sources, accounting for the delicate physics at play in the large-scale structure: mergers of various mass ratios, multiple projections along the line-of-sight, hot gas/galaxy centring shifts, measurement uncertainties, etc.
A key ingredient in such a project consists in a red-sequence identifier able to provide not only an estimate for cluster richness and redshift, but also a photometric membership probability for individual galaxies in a uniform manner across the entire survey area. This aspect was made possible in SPIDERS through running redMaPPer (Rykoff et al., 2014) over the SDSS imaging area (Gunn et al., 1998; Doi et al., 2010). Indeed, identifying likely cluster members is crucial in guiding the selection of targets given a limited fibrehour budget. This aspect is particularly striking for the case of CODEX, where X-ray sources are extremely faint RASS sources with poor positional accuracies and barely existent morphological indices (centroid or size). The spectroscopy of X-CLASS sources is much more straightforward in this regard, since targeting and membership determination is informed by robust X-ray positions and morphologies. Nevertheless, photometric red-sequence pre-selection has noticeable limitations: the definitive pool of acquired cluster members is by no means representative of the cluster galaxy population. It is biased towards the most luminous, most central and most ‘typically passive’ galaxies (Fig. 18). It also renders the sample selection function dependent on optical survey depth and peculiarities (e.g., masked areas, Fig. 5). Such considerations translate into a technical challenge when computing correction effects, including Malmquist and Eddington biases (Finoguenov et al., 2020). Ultimately, these complications can be alleviated by a well-considered usage of densely sampled fields (e.g. Sohn et al., 2018b; Sohn et al., 2019), realistic numerical simulations (Comparat et al., 2020), and refined selection cuts, making analysis samples sufficiently immune to various selection biases.
4.2 Outlook and prospects for SDSS-V/BHM and eROSITA
SRG/eROSITA will repeatedly scan the entire sky and provide large numbers of targets for spectroscopic observation (Merloni et al., 2012; Predehl, 2017). Thanks to its X-ray quality, located mid-way between XMM-Newton and ROSAT, it is probable that targeting and data confirmation procedures will share similarities with the methods presented here in the context of SDSS-IV/SPIDERS. A number of improvements are foreseeable. These will take advantage of better resolved X-ray imaging, in particular, enabling precise colocation of the hot gas and galaxy (stellar) content of clusters out to large redshifts. Moreover, the increased depth of optical photometric datasets (McMahon et al., 2013; Flaugher et al., 2015; Shanks et al., 2015; Flewelling et al., 2016; Ibata et al., 2017; Dey et al., 2019; Kuijken et al., 2019) combined with the use of modern algorithms (red-sequence finders coupling X-ray and optical data, bayesian counterpart finders, machine/deep-learning methods, etc.) will enable better determination of targets and more accurate membership assessment.
The eFEDS programme will link SDSS-IV to SDSS-V, and it will lead to the spectroscopic identification of galaxy clusters detected in the CalPV programme of eROSITA (12 spectroscopic plates). eFEDS will constitute the first opportunity to improve on the methods outlined in this paper. After completion of the first full-sky scan, SDSS-V (Kollmeier et al., 2017) will obtain spectra of the brightest X-ray sources in the Northern and Southern hemispheres. The spectra of the fainter sources will be obtained through the 4MOST instrument on the ESO/VISTA telescope (Merloni et al., 2019; Finoguenov et al., 2019). Designing work- and data-flows able to retain knowledge of selection steps and confirmation biases, together with enabling massive confirmation of the most relevant sources for cosmological studies is at the heart of such endeavours. The completed SDSS-IV/SPIDERS project presented in this paper has pioneered a novel way and is opening the door for the coming scientific revolution promised by eROSITA on SRG.
Acknowledgements
The authors thank the referee for their comments which increased the quality of this paper. The authors thank E. Rykoff for providing the data of Fig. 5. Some of the results in this paper have been derived using the HEALPix (Górski et al., 2005) package, the Matplotlib package (Hunter, 2007) and Astropy,777http://www.astropy.org (Astropy Collaboration et al., 2013; Price-Whelan et al., 2018). This research has made use of "Aladin sky atlas" developed at CDS, Strasbourg Observatory, France (Bonnarel et al., 2000; Boch & Fernique, 2014). It has made use of TOPCAT (Taylor, 2005).
Based on observations obtained with XMM-Newton, an ESA science mission with instruments and contributions directly funded by ESA Member States and NASA.
This work was supported by CNES. AF, CK and JIC acknowledge travel support from FINCA. NC acknowledges travel support from the Institut Francais de Finlande, the Embassy of France in Finland, the French Ministry of Higher Education, Research and Innovation, the Finnish Society of Sciences and Letters and the Finnish Academy of Science and Letters. CK and NC acknowledge this research was supported by the DFG cluster of excellence ‘Origin and Structure of the Universe’ (www.universe-cluster.de). AS is supported by the ERC-StG ‘ClustersXCosmo’ grant agreement 716762, and by the FARE-MIUR grant ‘ClustersXEuclid’ R165SBKTMA.
Funding for the Sloan Digital Sky Survey IV has been provided by the Alfred P. Sloan Foundation, the U.S. Department of Energy Office of Science, and the Participating Institutions. SDSS-IV acknowledges support and resources from the Center for High-Performance Computing at the University of Utah. The SDSS web site is www.sdss.org.
SDSS-IV is managed by the Astrophysical Research Consortium for the Participating Institutions of the SDSS Collaboration including the Brazilian Participation Group, the Carnegie Institution for Science, Carnegie Mellon University, the Chilean Participation Group, the French Participation Group, Harvard-Smithsonian Center for Astrophysics, Instituto de Astrofísica de Canarias, The Johns Hopkins University, Kavli Institute for the Physics and Mathematics of the Universe (IPMU) / University of Tokyo, the Korean Participation Group, Lawrence Berkeley National Laboratory, Leibniz Institut für Astrophysik Potsdam (AIP), Max-Planck-Institut für Astronomie (MPIA Heidelberg), Max-Planck-Institut für Astrophysik (MPA Garching), Max-Planck-Institut für Extraterrestrische Physik (MPE), National Astronomical Observatories of China, New Mexico State University, New York University, University of Notre Dame, Observatário Nacional / MCTI, The Ohio State University, Pennsylvania State University, Shanghai Astronomical Observatory, United Kingdom Participation Group, Universidad Nacional Autónoma de México, University of Arizona, University of Colorado Boulder, University of Oxford, University of Portsmouth, University of Utah, University of Virginia, University of Washington, University of Wisconsin, Vanderbilt University, and Yale University.
Funding for SDSS-III has been provided by the Alfred P. Sloan Foundation, the Participating Institutions, the National Science Foundation, and the U.S. Department of Energy Office of Science.
Funding for the SDSS and SDSS-II has been provided by the Alfred P. Sloan Foundation, the Participating Institutions, the National Science Foundation, the U.S. Department of Energy, the National Aeronautics and Space Administration, the Japanese Monbukagakusho, the Max Planck Society, and the Higher Education Funding Council for England.
Data availability
The data underlying this article are available in the SDSS website at https://www.sdss.org.
References
- Abell (1958) Abell G. O., 1958, ApJS, 3, 211
- Abolfathi et al. (2018) Abolfathi B., et al., 2018, ApJS, 235, 42
- Adami et al. (2018) Adami C., et al., 2018, A&A, 620, A5
- Ahumada et al. (2020) Ahumada R., et al., 2020, ApJS, 249, 3
- Aihara et al. (2011) Aihara H., et al., 2011, ApJS, 193, 29
- Alam et al. (2015) Alam S., et al., 2015, ApJS, 219, 12
- Albareti et al. (2017) Albareti F. D., et al., 2017, ApJS, 233, 25
- Andreon et al. (2019) Andreon S., Moretti A., Trinchieri G., Ishwara-Chandra C. H., 2019, A&A, 630, A78
- Astropy Collaboration et al. (2013) Astropy Collaboration et al., 2013, A&A, 558, A33
- Bahcall & Cen (1993) Bahcall N. A., Cen R., 1993, ApJ, 407, L49
- Blanton et al. (2017) Blanton M. R., et al., 2017, AJ, 154, 28
- Boch & Fernique (2014) Boch T., Fernique P., 2014, Aladin Lite: Embed your Sky in the Browser. p. 277
- Böhringer et al. (2002) Böhringer H., et al., 2002, ApJ, 566, 93
- Böhringer et al. (2004) Böhringer H., et al., 2004, A&A, 425, 367
- Böhringer et al. (2017) Böhringer H., Chon G., Fukugita M., 2017, A&A, 608, A65
- Bolton et al. (2012) Bolton A. S., et al., 2012, AJ, 144, 144
- Bonnarel et al. (2000) Bonnarel F., et al., 2000, A&AS, 143, 33
- Borgani et al. (1999) Borgani S., Rosati P., Tozzi P., Norman C., 1999, ApJ, 517, 40
- Brimioulle et al. (2013) Brimioulle F., Seitz S., Lerchster M., Bender R., Snigula J., 2013, MNRAS, 432, 1046
- Bruzual & Charlot (2003) Bruzual G., Charlot S., 2003, MNRAS, 344, 1000
- Capasso et al. (2019) Capasso R., et al., 2019, MNRAS, 486, 1594
- Capasso et al. (2020) Capasso R., et al., 2020, MNRAS, 494, 2736
- Cavaliere & Fusco-Femiano (1976) Cavaliere A., Fusco-Femiano R., 1976, A&A, 500, 95
- Clerc et al. (2012) Clerc N., Sadibekova T., Pierre M., Pacaud F., Le Fèvre J. P., Adami C., Altieri B., Valtchanov I., 2012, MNRAS, 423, 3561
- Clerc et al. (2016) Clerc N., et al., 2016, MNRAS, 463, 4490
- Clerc et al. (prep) Clerc N., et al., in prep.
- Comparat et al. (2017) Comparat J., et al., 2017, arXiv e-prints, p. arXiv:1711.06575
- Comparat et al. (2020) Comparat J., et al., 2020, A&A, 636, A97
- Dawson et al. (2013) Dawson K. S., et al., 2013, AJ, 145, 10
- Dawson et al. (2016) Dawson K. S., et al., 2016, AJ, 151, 44
- Dey et al. (2019) Dey A., et al., 2019, AJ, 157, 168
- Diaferio (1999) Diaferio A., 1999, MNRAS, 309, 610
- Doi et al. (2010) Doi M., et al., 2010, AJ, 139, 1628
- Dwelly et al. (2017) Dwelly T., et al., 2017, MNRAS, 469, 1065
- Erfanianfar et al. (2019) Erfanianfar G., et al., 2019, A&A, 631, A175
- Evans et al. (2010) Evans I. N., et al., 2010, ApJS, 189, 37
- Finoguenov et al. (2019) Finoguenov A., et al., 2019, The Messenger, 175, 39
- Finoguenov et al. (2020) Finoguenov A., et al., 2020, A&A in press, 638, A114
- Flaugher et al. (2015) Flaugher B., et al., 2015, AJ, 150, 150
- Flewelling et al. (2016) Flewelling H. A., et al., 2016, arXiv e-prints, p. arXiv:1612.05243
- Fukugita et al. (1996) Fukugita M., Ichikawa T., Gunn J. E., Doi M., Shimasaku K., Schneider D. P., 1996, AJ, 111, 1748
- Furnell et al. (2018) Furnell K. E., et al., 2018, MNRAS, 478, 4952
- Gladders & Yee (2000) Gladders M. D., Yee H. K. C., 2000, AJ, 120, 2148
- Górski et al. (2005) Górski K. M., Hivon E., Banday A. J., Wandelt B. D., Hansen F. K., Reinecke M., Bartelmann M., 2005, ApJ, 622, 759
- Gozaliasl et al. (2019) Gozaliasl G., et al., 2019, MNRAS, 483, 3545
- Gunn et al. (1998) Gunn J. E., et al., 1998, AJ, 116, 3040
- Gunn et al. (2006) Gunn J. E., et al., 2006, AJ, 131, 2332
- Guzzo et al. (2009) Guzzo L., et al., 2009, A&A, 499, 357
- Henry et al. (2009) Henry J. P., Evrard A. E., Hoekstra H., Babul A., Mahdavi A., 2009, ApJ, 691, 1307
- Hunter (2007) Hunter J. D., 2007, Computing In Science & Engineering, 9, 90
- Ibata et al. (2017) Ibata R. A., et al., 2017, ApJ, 848, 128
- Ider Chitham et al. (subm) Ider Chitham J., et al., subm.,
- Ilić et al. (2015) Ilić S., Blanchard A., Douspis M., 2015, A&A, 582, A79
- Jones & Forman (1999) Jones C., Forman W., 1999, ApJ, 511, 65
- Kaiser (1986) Kaiser N., 1986, MNRAS, 222, 323
- Kirkpatrick et al. (subm) Kirkpatrick C. C., et al., subm.,
- Klein et al. (2018) Klein M., et al., 2018, MNRAS, 474, 3324
- Klein et al. (2019) Klein M., et al., 2019, MNRAS, 488, 739
- Kollmeier et al. (2017) Kollmeier J. A., et al., 2017, arXiv e-prints, p. arXiv:1711.03234
- Kuijken et al. (2019) Kuijken K., et al., 2019, A&A, 625, A2
- Lotz et al. (2019) Lotz M., Remus R.-S., Dolag K., Biviano A., Burkert A., 2019, MNRAS, 488, 5370
- MacLeod et al. (2018) MacLeod C. L., et al., 2018, AJ, 155, 6
- Mantz et al. (2010) Mantz A., Allen S. W., Rapetti D., Ebeling H., 2010, MNRAS, 406, 1759
- McMahon et al. (2013) McMahon R. G., Banerji M., Gonzalez E., Koposov S. E., Bejar V. J., Lodieu N., Rebolo R., VHS Collaboration 2013, The Messenger, 154, 35
- Merloni et al. (2012) Merloni A., et al., 2012, arXiv e-prints, p. arXiv:1209.3114
- Merloni et al. (2019) Merloni A., et al., 2019, The Messenger, 175, 42
- Muzzin et al. (2014) Muzzin A., et al., 2014, ApJ, 796, 65
- Oguri et al. (2018) Oguri M., et al., 2018, PASJ, 70, S20
- Owers et al. (2019) Owers M. S., et al., 2019, ApJ, 873, 52
- Pacaud et al. (2006) Pacaud F., et al., 2006, MNRAS, 372, 578
- Pacaud et al. (2018) Pacaud F., et al., 2018, A&A, 620, A10
- Popesso et al. (2015) Popesso P., et al., 2015, A&A, 579, A132
- Predehl (2017) Predehl P., 2017, Astronomische Nachrichten, 338, 159
- Price-Whelan et al. (2018) Price-Whelan A. M., et al., 2018, AJ, 156, 123
- Reiprich & Böhringer (2002) Reiprich T. H., Böhringer H., 2002, ApJ, 567, 716
- Ricci et al. (2018) Ricci M., et al., 2018, A&A, 620, A13
- Ridl et al. (2017) Ridl J., et al., 2017, MNRAS, 468, 662
- Rosen et al. (2016) Rosen S. R., et al., 2016, A&A, 590, A1
- Rykoff et al. (2012) Rykoff E. S., et al., 2012, ApJ, 746, 178
- Rykoff et al. (2014) Rykoff E. S., et al., 2014, ApJ, 785, 104
- Rykoff et al. (2015) Rykoff E. S., Rozo E., Keisler R., 2015, arXiv e-prints, p. arXiv:1509.00870
- Sadibekova et al. (2014) Sadibekova T., Pierre M., Clerc N., Faccioli L., Gastaud R., Le Fevre J. P., Rozo E., Rykoff E., 2014, A&A, 571, A87
- Salvato et al. (2018) Salvato M., et al., 2018, MNRAS, 473, 4937
- Saxton et al. (2008) Saxton R. D., Read A. M., Esquej P., Freyberg M. J., Altieri B., Bermejo D., 2008, A&A, 480, 611
- Schechter (1976) Schechter P., 1976, ApJ, 203, 297
- Schellenberger & Reiprich (2017) Schellenberger G., Reiprich T. H., 2017, MNRAS, 471, 1370
- Shan et al. (2014) Shan H. Y., et al., 2014, MNRAS, 442, 2534
- Shanks et al. (2015) Shanks T., et al., 2015, MNRAS, 451, 4238
- Smee et al. (2013) Smee S. A., et al., 2013, AJ, 146, 32
- Sohn et al. (2018a) Sohn J., Chon G., Böhringer H., Geller M. J., Diaferio A., Hwang H. S., Utsumi Y., Rines K. J., 2018a, ApJ, 855, 100
- Sohn et al. (2018b) Sohn J., Geller M. J., Rines K. J., Hwang H. S., Utsumi Y., Diaferio A., 2018b, ApJ, 856, 172
- Sohn et al. (2019) Sohn J., Geller M. J., Zahid H. J., 2019, ApJ, 880, 142
- Stoughton et al. (2002) Stoughton C., et al., 2002, AJ, 123, 485
- Taylor (2005) Taylor M. B., 2005, TOPCAT & STIL: Starlink Table/VOTable Processing Software. p. 29
- Trevisan et al. (2017) Trevisan M., Mamon G. A., Stalder D. H., 2017, MNRAS, 471, L47
- Truemper (1993) Truemper J., 1993, Science, 260, 1769
- Vikhlinin et al. (2009) Vikhlinin A., et al., 2009, ApJ, 692, 1060
- Voges et al. (1999) Voges W., et al., 1999, A&A, 349, 389
- Wen & Han (2018) Wen Z. L., Han J. L., 2018, MNRAS, 481, 4158
- Wilkinson et al. (2017) Wilkinson D. M., Maraston C., Goddard D., Thomas D., Parikh T., 2017, MNRAS, 472, 4297
Appendix A Two-dimensional stack of cluster member spectra
Fig. 20 illustrates the homogeneity of the sample of galaxies identified as members of SPIDERS clusters over a wide range of redshifts and masses.
Appendix B Sky distribution of "clean" CODEX clusters
Figure 21 is a representation of all 1,346 clusters that pass the clean 10% RASS sensitivity cut as defined in Finoguenov et al. (2019).