Grading video interviews with fairness considerations
Abstract
There has been considerable interest in predicting human emotions and traits using facial images and videos. Lately, such work has come under criticism for poor labeling practices, inconclusive prediction results and fairness considerations. We present a careful methodology to automatically derive social skills of candidates based on their video response to interview questions. We, for the first time, include video data from multiple countries encompassing multiple ethnicities. Also, the videos were rated by individuals from multiple racial backgrounds, following several best practices, to achieve a consensus and unbiased measure of social skills. We develop two machine-learning models to predict social skills. The first model employs expert-guidance to use plausibly causal features. The second uses deep learning and depends solely on the empirical correlations present in the data. We compare errors of both these models, study the specificity of the models and make recommendations. We further analyze fairness by studying the errors of models by race and gender. We verify the usefulness of our models by determining how well they predict interview outcomes for candidates. Overall, the study provides strong support for using artificial intelligence for video interview scoring, while taking care of fairness and ethical considerations.
1 Introduction
The recruitment process at companies and organizations generally consists of assessments and personal interviews. Assessments consisting of multiple-choice tests were automated way back in the 1990s. Recently there have been efforts to automate the scoring of open-response tests , such as those to measure spoken English [37, 38], programming skills [39, 41, 2], essay and email writing skills [43]. Over the last few years, advancements in computer vision have spurred interest in the grading video interviews [23, 30, 13] automatically.
There have been several research studies [32, 25, 7] and proliferation of tools [27, 3, 4] that attempt to score emotions based on images/videos. In [13], the authors develop algorithms to predict personality based on video interviews, while in [23], the authors develop models to predict hirability based on job profiles and video interview feeds. In [29], the authors record actual interviews in a lab setting and then develop models to predict social skills.
However, such research has attracted criticism, particularly from the psychology community, over considerations of ethics and fairness. In [8], the authors question the very hypothesis that emotions, that are internal states, could be rated based on external behaviors, such as facial expressions and voice characteristics. They also question the process of labeling emotions, the universality of emotional manifestation across cultures and the inadequate criteria being used to judge the quality of models. Furthermore, variations in the results of image and video processing with regard to gender, race, nationality, etc., have raised questions of fairness [10, 28, 14]. Algorithms tend to pick non-causal markers [31, 33] that signal one’s identity than behavior. On the other hand, techniques that predict hireability status propagate bias in extant hiring practices. It is unclear which skills and behaviors these model actually predict and they are susceptible to using spurious correlations in the sample. There has been no study on fairness of video interview grading algorithms, other than [26], which looks at biases in the labelling process. Grading of video interviews has enormous implications for a person’s economic outcomes and living standard. Therefore, the bar for fairness and ethics must be set high for grading video interviews. In this paper, we mitigate these criticisms for the first time and explain how we developed models to grade video interviews with fairness considerations. We take several steps to do so.
We, for the first time, use a multi-country, multi-racial dataset to develop video-interview grading. Our data of 810 candidates and 5845 videos includes people from the US, UK, and India, who identify as Caucasians, African Americans, Asian, Hispanic111We merge Hispanic with few smaller ethnic groups and call them ”Others”. and a few other smaller ethnic groups. We apply significant thought to devise meaningful parameters for rating video interviews and to establish a fair process to get the labels. Rather than attempting to gauge internal states, we measure externally expressed behavior. We refer to such behavior as “social skills” that encompass parameters such as “Confidence” (e.g., whether the average person watching the video would agree that the candidate projects confidence). Each parameter includes a proper rubric along with a ‘Cannot say’ option if the rater decides that the information in the video is not sufficient to grade a given parameter222In addition to social skills, we also measure interviews according to the spoken content. However, that is not the subject of this paper.. The video interviews are rated for social skills by multiple raters of different racial backgrounds. The scores of these various raters correlate moderately well. We consider their consensus rating, to comprise the universal understanding of social skills.
We develop two models to predict social skills. The first uses expert-guidance to pick causal features. We further constrain the modeling space to avoid the use of spurious non-causal features333The model is not necessarily causal, but has been guided in that direction.. Our intention is to build a relatively simple model with well-meaning features, that is interpretable and may show less variance over different samples. In the second model, we give machine learning a free hand to exploit the correlations in the dataset to build the best possible predictive model. Here, we use a state-of-the-art transformer model with additive attention to predict the grades. We recommend that if a simpler, causal-guided model gives comparable accuracy to a more expressive model, the former is preferable out of consideration of fairness. In fact, we discover that the simpler model performs as well as the deep-learning model on two parameters, while the deep-learning based model performs better on the third.
We examine further whether our models are biased and compare model errors by race and gender. We find that effect sizes are small in error for all parameters barring one involving race, where also it is borderline. We discuss methods to mitigate this. Finally, we test our social skill predictions against interview outcomes, using dataset from three companies. We find that social skills are indeed consistent predictors of interview outcomes.
This work makes significant new contributions:
-
•
It is the first video grading work to look at fairness with regard to gender and race.
-
•
We introduce and use the first multi-country and multi-racial dataset of video interviews.
-
•
We introduce a new approach to looking at building fair models: comparing simpler expert-guided models with complex fully-empirical models.
-
•
We for the first time study the errors of video grading models with regard to gender and race.
We believe this work will go a long way in setting context and methods for fairness studies in video processing in general and video interviews in particular.
2 Dataset and Ratings
2.1 Rating Parameters
Traditionally, researchers process facial images to predict the candidate’s emotions (such as happy, sad, anger, etc.). They use facial action units, (i.e., facial expressions) and map them to emotions [24]. However, such research has been subject to criticism for several reasons. For example, emotions are purported to be internal states that are not necessarily signaled by facial expressions alone. Furthermore, the experience and perception of emotions may vary across cultures, races and countries. Also, images alone may not be sufficient to make a determination of a person’s emotional state. Nevertheless, raters are often implicitly forced to assign labels even if they think that the information is insufficient to make a confident designation.
In our approach, we take several steps to address these criticisms. First, we rate videos instead of still images. The videos have a duration of at least 30 seconds. This gives the raters ample time to observe the candidates before making a judgement. Moreover, a candidate’s final rating is based on a set of videos (at least six) rather than a single video. Also, our rating parameters are expressed behaviors rather than internal states. Several studies show that expressed behavior through facial expressions and voice tone, are judged during interviews and correlate to performance. [20] finds significant difference in non-verbal behavior such as facial expressions, head movements and eye-contact between selected and rejected candidates in an interview. [1] lists enthusiasm, tempo, and body language as pragmatic skills needed in a interview, and [16] finds visual cues such as smile, gaze and body movement are predictive of on-job performance.
We finalized on four rating parameters - Positive Emotion, Calmness, Confidence and Engagement. We call such expressed behavior “social skills.” These skills are essential in such roles as sales, customer service and management. There is a rubric related with each parameter, and the rater assigns a score by selecting a level on the rubric. The first option (in bold for emphasis) on the rubric indicates that the video cannot be rated on the parameter. This option is provided in order to eliminate any parameter for which the video offers insufficient information. Refer to supplementary material for the rubric used for rating.
As we will discuss in further sections, the candidates and raters in our study span diverse cultures and racial backgrounds. This was done to a universal, or stated scientifically, consensus (shared-view), rating of social skills.
2.2 Video Dataset
Each candidate must answer seven pre-recorded questions in English. The candidate is allotted 30 seconds to think about her/his response, and then one minute to deliver the response. The sessions are recorded via the candidate’s own webcam. The questions include situational questions, competency-based questions and domain knowledge questions from areas such as technology, banking, accounting, etc. (See examples in the supplementary material).
We collected data from 810 jobseekers from the US, UK, India and some other countries from Europe. We designed the sample to include candidates of different age, gender, racial and educational background. We collected a total of 5845 videos (with duration of thirty seconds to a minute) from the 810 jobseekers. The diversity of the dataset allows us to test whether our algorithms are biased against any of the various groups and how one may mitigate such bias. To the best of our knowledge, this study is the first to include data from multiple countries and multiple ethnic groups to measure social skills, emotions or grade video interviews. Refer to supplementary material to view the distribution of candidates by country, age, gender and race.
2.3 Raters and rating process
Many previous studies have examined whether the ML algorithm exhibits bias towards any particular group. In [26] authors examine the prospect of human bias in scoring video-based structured interviews. The possibility of bias in labeling takes on increasing importance in the present case for two reasons. First, we are rating faces. Uncorrelated facial markers such as race, color, gender, etc. may bias the raters. Second, social skills may be perceived differently by individuals of different gender and racial backgrounds. We aim to capture the common variance (consensus) among these different groups to establish a universal social skills scoring index.
We recruited our raters online. All raters have experience working as HR recruiters, soft skills trainers, or possessed a background in industrial organizational psychology. We chose the rater sample to be representative of multiple ethnicities and gender. We performed a first rater selection exercise. Here, each rater scored 50 videos. We removed the raters with an average inter-rater correlation of less than 0.5 and a mean-difference of more than 1.0 (on a 5-point scale). This produced a pool of 31 raters, from diverse backgrounds. This exercise also helped us determine how many raters are required per video to provide a stable consensus rating. We bootstrapped different numbers of raters and studied how the variance in consensus ratings decreased with every additional rater. We observe little reduction in score variance when adding additional raters beyond five.
We then had every video rated by 7 raters. We again removed the raters which didn’t agree with others, on average (same criteria as before). Finally, each video was rated by atleast 5 raters. The distribution of the raters on race and gender is provided in supplementary material. We used the mean ratings of raters, as the final rating per video, per social skill.
3 Methods
We develop video-wise models for each social skill using supervised learning. We derive a candidate-level score by averaging the video-wise scores. We present two approaches to develop models. In the first approach, we solicit expert advice in choosing theoretically valid features and also constrain the model-space through certain computational techniques. The idea is to develop a model that is less susceptible to non-causal correlations and sampling biases. In the second approach, we use a much more expressive Deep Learning model that relies solely on the correlations present in the sample dataset. One may refer to supplementary material for the related work in the field of automated grading of video-interviews. We wish to determine whether the Deep Learning approach results in greater accuracy, and if so, how much. If there is no significant difference in model accuracy, then we prefer the first approach given that it provides a better theoretical basis and may better generalize over different kinds of samples. We now describe the two methods we use.
3.1 Expert-Driven Approach
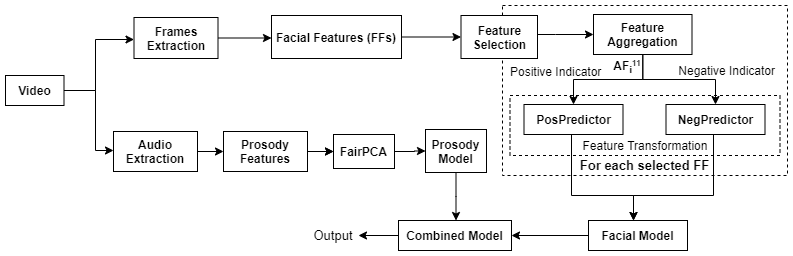
In this approach, we derive several features from the video, select certain features based on expert guidance, make some feature transformations and finally use a classical supervised learning technique to train models against the ratings. All these steps are illustrated in Fig 1. We first describe the features that we used.
3.1.1 Feature Engineering
We primarily use two kind of features:
Facial Features (FFs): We first extract the frames from the video at a sampling frequency of 15 frames per second. We use OpenFace [6] to derive the intensities of different facial action units (AU) from each frame. Facial action units comprise facial movements such as lip curl, and eye brows raise. We also derive head pose translations and rotations (HP). This results in a -dimensional time series vector for each video.
Prosody Features (PFs): We extract the audio from the videos to derive prosody features such as the patterns of rhythm, stress and intonation in speech. We used OpenSMILE [17], a library that helps extract large audio feature spaces in real time. These comprise 1582 features from the INTERSPEECH 2010 Paralinguistic challenge feature set [35] and 382 features from the the INTERSPEECH 2009 Emotion Challenge feature set [36]. In addition, we use FairPCA [34, 42] for finding a low dimensional representation of the features which maintain similar conformity between the multiple groups444We formed these groups by combining race and gender tags, for e.g : Male Caucasian, Female Caucasian, Male Asian…, etc. within the dataset.
3.1.2 Feature Selection and Transformation
We take three steps to process our features. First, we select a subset of FFs for each social skill based on expert consensus. We only use the selected FFs to build models for a given social skill. Second, we convert the facial time-series features into a vector of aggregate features (AF). Third, we apply a transformation function to convert the aggregate vector for each FF into a single dimensional value FF. We use the same transformation function for all FF feature vectors for a given social skill, which constrains the modeling space further. We describe these three steps in detail now.
Feature Selection: Every social skill links to certain AUs and HPs. For instance, an AU such as an upward lip-curl may signal a smile and indicate ‘Positive Emotion’. We expect a positive correlation - higher the intensity of the AU, higher the ‘Positive Emotion’ score. On the other hand, we do not expect a relationship between say, Lip Puckerer (AU18) or Lip Raiser (AU10) and ‘Positive Emotion’. We recruited five experts with more than 5-10 years of experience in Industrial organizational psychology and diverse ethnicities and gender. For each social skill, they marked whether an FF may signal a positive, a negative or no relationship. FFs were marked as positive indicators, negative indicators, or unrelated, based on expert vote consensus. Only the selected indicators were used to build models for each social skill. No such selection was made on prosody features since they aren’t human interpretable.
Feature Aggregation: Typically, researchers average intensities of FFs to aggregate time-series data [13]. This does away with multiple rich characteristics of the curve. For instance, a video with bursts of high intensity among a low intensity base, will generate the same value as a constant mid-intensity waveform. Similarly, the variation in the intensity curve may help measure the amount of activity vs. monotony. To capture these effects, we create 11 different aggregate features from the FF time series data. These have been explained in detail in supplementary material. They quantify different characteristics of the intensity curves.
Feature Transformation: The 11 aggregate features for each FF provide richness for machine learning, but exposes the risk of using non-causal correlations. We wished to constrain down the model space of 187 (11*17) features to a lower meaningful dimension. Similar to the use of ‘average intensity’, we learn a common function to aggregate the 11-dimensional vectors across FFs. Rather than one such aggregation function, we create one for every social skill and every type of indicator. The hypothesis is that certain common FF curve properties predict a social skill across, say, positive indicators. This constrains the algorithm to use a common set of curve properties which are predictive of a social skill, than using different properties for each FF. We learn six such functions, covering three social skills 555We remove one social skill out of the initial four. This is explained in sections ahead. and two indicators each. This may be stated mathematically as follows: For each social skill,
Pos descriptor set, Neg descriptor set
aggregate features set
unit vectors of dimension equal to no. of FFs in respectively
Let us take the example of positive indicators for ‘Positive Emotion’. We learn a linear function with common weights across selected FFs, but add a different constant for each. We take the 11-dimensional vector as input variables, stacked for all FFs one below the other. Each FF has a separate unit vector, to learn a constant. The social skill score is the output variable and it gets repeated for each stacked FF. We use ridge regression to determine the weights that are most predictive of the given social skill. One may note, all these operations are done on the train set.
We finally have a set off FF features and prosody features for each social skill. We use classical feature selection and machine learning techniques to learn a predictive model.
3.2 Deep Learning Approach
Prior research has addressed video processing problems such as video summarization [9] and grading video interviews [23] using RNNs, with either LSTMs or GRU cells, and with or without attention. We tried a few different deep-learning approaches and found that a Transformer model with additive attention worked best. We now describe our model structure.
As a first step, we extract 256 dimensional features per-frame from the penultimate layer of a pre-trained CNN model[18]. This model was trained on face images to classify emotion labels (our data has video-wise social skill scores, but not image wise labels). We only use those frames, where a face is detected with a confidence of more than 0.75 and the rest of the frames are imputed with the mean of their surrounding frames. If less than 70% of the frames in a video have a face in them then we remove the video altogether. We call this 256-dimensional vector for every frame as the face embedding on that frame. When we train the model, the weights that create the embedding are also re-optimized, i.e. fine-tuned.
The number of frames in a video vary. We take the maximum number of frames to be 1200 and perform padding where needed. We then perform dimensionality reduction in the face embedding vector and in the time-space. We used a feedforward layer applied at every time frame to downsample the number of features from 256 to 64. We also add the FF time-series data (described in previous section) to the embeddings to create a 87-dimensional vector. We reduce the number of frames to 239, using a 1D convolution filter with a kernel size of 10 and stride length of 5. We used 87 such filters, each assigned to a particular channel/dimension of the input feature vector. This leads to a 87 by 239 matrix per video.
We used multi-head self-attention [44] on the fixed length sequence . It contains scaled dot product attention mechanism over the Keys , Queries and Values and compute the representation using softmax as:
We then use additive attention [5] to extract the importance of each feature vector in the sequence. This helps weigh up certain frames, say one representing a lip curl (in case of positive emotion), to amplify their contribution and reduce noise. The additive attention layer first comprises a feedforward layer, followed by a softmax to model the output conditional probability distribution. The final output vector is the weighted sum (using the probability distribution) of input embeddings across the time dimension. We then concatenate the prosody feature vector (the output from FairPCA, refer to previous section) with the facial vector to obtain the final vector. This 151-dimensional vector is then passed onto a feedforward layer (hidden layer of size 64) to get the final prediction. Refer to supplementary material for a detailed explanation.
4 Experiments & Results
We address the following questions through our experiments:
-
•
Do our raters agree to each other and how the different social skills relate with each other?
-
•
How do the Expert-Driven (ED) and Deep Learning (DL) models compare on accuracy? Do our models predict ratings with high specificity?
-
•
How do the errors in the model compare within gender and racial groups? Are the models fair and what may be done to mitigate any fairness issues?
-
•
Do our predicted social skills predict interview outcomes?
4.1 Video Data and Ratings
A total of 5845 videos for 810 candidates were collected. All videos marked as ’Video not clear’ () and cannot be rated () by more than 2 raters were removed from the dataset. Most raters judged that videos provided them with sufficient information to rate social skills.
A total of 31 raters were used and every video is rated by at least 5 raters. The inter-rater agreement was measured using pearson coefficient of correlation. The correlation is strong, more than 0.6, for all parameters barring ‘Calmness’ (Refer to supplementary material for Inter-rater agreement details.). This showed that raters across racial and gender groups had a good-level of agreement on the social skill scores of different videos. We averaged the ratings across raters to get the final rating for a video. For a candidate, the ratings across videos were averaged for each social skill, to get the final rating.
We next looked at inter-parameter correlations. These are presented in supplementary material. We find most social skills have a moderate-to-strong correlation with each other (-). This is expected, since if someone is high in one social skill, generally s/he is high in others too. Confidence and Calmness are very highly correlated by a . We decided to drop Calmness due to its high correlation with Confidence and also, low inter-rater agreement. A factor analysis of the ratings also confirmed the data represented three significant factors.
4.2 Model Results
For training models, we split the candidates into a - train-test set. We do a random split stratified by ratings. We boot-strap train/test set times and report average results over runs. Details of all hyperparameters and experimental details are provided in supplementary material.
In Table 1, we report how well our models predict social skills measured by pearson coefficient of correlation. We find that for Confidence and Engagement, both modelling techniques give similar results. For Positive Emotion, DL model gave a much better result, a correlation of as compared to of the ED model. We also split the data by country666We merged the small sample from other european countries into UK for the analysis. to see if the correlations remain intact for different countries. The correlations are mostly similar, other than for Confidence, where the DL model shows lower correlation for India.
We also looked at cross-correlations – how prediction model for one social skill correlated with the expert ratings of a different social skill. This is important to study, when the predicted parameters are correlated. We must check that the prediction model specifically predicts it’s given social skill and doesn’t just signal the shared/common variance with another social skill.
The results are present in Table 2. For the ED model, we find that the model for Positive Emotion predicts Engagement equally well. This shows that the Positive Emotion model is in some sense a proxy model for Engagement, and has picked the shared variance between Positive Emotion and Engagement. In the DL models, we do not come across such an issue. Finally, we choose the ED models for Confidence and Engagement, since they perform as well as DL models. For Positive Emotion, we choose the DL model for better accuracy and more importantly, specificity. We do a feature analysis and find Positive Emotion is determined mostly by facial expressions, confidence by voice tone and engagement is impacted by both. Details can be found in supplementary material.
| Positive Emotion | Confidence | Engagement | |||||
|---|---|---|---|---|---|---|---|
| Train Data | Test Data | Expert-Driven | DL | Expert-Driven | DL | Expert Driven | DL |
| All | All | 0.57 | 0.65 | 0.68 | 0.66 | 0.68 | 0.66 |
| All | US-UK | 0.55 | 0.63 | 0.70 | 0.70 | 0.68 | 0.63 |
| All | India | 0.56 | 0.65 | 0.67 | 0.63 | 0.67 | 0.65 |
| Expert-Driven | Deep Learning | |||||
| PE* | Confidence | Engagement | PE* | Confidence | Engagement | |
| PE* | 0.57 | 0.38 | 0.48 | 0.65 | 0.44 | 0.55 |
| Confidence | 0.44 | 0.68 | 0.60 | 0.40 | 0.66 | 0.52 |
| Engagement | 0.58 | 0.57 | 0.68 | 0.56 | 0.57 | 0.66 |
| *PE here represents Positive Emotion | ||||||
4.3 Fairness Study
We studied whether our models are fair with regard to gender and racial groups. For each group, we studied two parameters. First, we looked at the mean-difference (mean_diff) between true and predicted ratings to examine if our models systematically underpredicted or overpredicted scores for any group. Second, we looked at the mean-absolute-error (MAE), to check if the models are less accurate for some groups vs. others.
We calculated the difference in these parameter values, between the group with the highest and lowest value. For example, within racial groups in ‘Positive Emotion’, Afro-Americans had the highest mean-difference () and Indians777We have considered sample from India as another race for this analysis. There are many races within India as well, which we plan to study in future work. have the least mean difference (). We take the difference which is (diff_mean_diff). Similarly, for MAE, we subtract the values for Others and Asians to get (diff_MAE). One may refer to supplementary material for detailed numbers.
To understand the impact of these differences, we look at their effect size and significance. Significance is calculated using 2-sample t-test at % confidence level. To find effect size, we divide each of the diff_mean_diff and diff_MAE by the standard deviation of the predicted rating parameter (say positive emotion). This tells us, the difference in models is what percentage of standard deviation. Generally, a difference of less than % of standard deviation is considered small [40].
We find that there is little systematic over/underprediction (signalled by diff_mean_diff). All effect sizes are small (less than %). With regard to accuracy, all differences have small effect sizes, other than Confidence for racial groups which is borderline small (%). It is also interesting to note, that mostly the protected groups (Afro-Americans/Asians, females) have more accurate models (Refer supplementary material).
| Positive Emotion | Confidence | Engagement | ||||||||||
| diff_mean_diff | diff_MAE | diff_mean_diff | diff_MAE | diff_mean_diff | diff_MAE | |||||||
| type | val | ef-size | val | ef-size | val | ef-size | val | ef-size | val | ef-size | val | ef-size |
| Gender | 0.03 | 7.3 | 0.01 | 2.4 | 0.08* | 14.0 | 0.04* | 7.0 | 0.02 | 3.3 | 0.05* | 8.3 |
| Race | 0.05 | 12.2 | 0.06* | 14.6 | 0.04 | 7.0 | 0.13* | 22.8 | 0.11 | 18.3 | 0.09* | 15 |
| *, val represents the maximum absolute difference | ||||||||||||
We also investigated whether the models will lead to fair selection if used with a cut-score. We applied a cut-score that eliminated the bottom one-third candidates888Companies generally use these tools to eliminate the bottom performers and do further rounds of interviews with the rest.. We find that the Disparate Impact[19] for each sensitive attribute is well between -. Please refer to supplementary material for more details.
We present the results in Table 3. These are very encouraging results. Only one effect sizes is not small, but on the borderline. This could be mitigated in couple of ways. First, one could investigate further machine learning techniques to induce fairness in the models. Techniques for data-transformation [12], fair feature engineering [42, 34, 21] and post-processing [22] may be used. Secondly, certain standard practices in assessment may be used. For instance, consider that a company wants to shortlist candidates based on the Confidence score. They estimate a cut-score based on the trait requirement for the job. To ensure fairness, they could lower the estimated cut-score for the group with the higher error. If companies do not want to use different cut-scores for different groups, they can uniformly lower the cut-score, allowing passage to candidate who are impacted by model accuracy. The hypothesis is that the non-worthy candidates will be out-selected in further expert rounds. Our larger recommendation is that these models provide very promising results with regard to fairness, but must be used with oversight and caution.
4.4 Validation Study
We tested whether our scores are predictive of interview success for three different companies across India and China. The companies were hiring for a product engineering role. All the applicants took our asynchronous interview. For the first two companies, company personnel did an independent interview for all the applicants and made offers. In case of the third, the company personnel rated the videos on a 3-point scale on hireability. Company personnel did not have access to the social skill scores in any of the three studies. All correlations (ranging -) between social skill scores and interview outcomes are significant, other than one. We also did a regression using the three scores and the regression range from -. These correlations are similar or better than the correlation of personality scores with interview outcomes, that range - [15, 11]. Also, we must consider that social skills are not expected to explain all the variance of interview outcomes, since interviewers also assess other parameters such as domain skills. Refer to supplementary material for more details.
5 Conclusion
In this work, we use a multi-country and multi-racial dataset for building models to grade video interviews and study fairness with regard to gender and race. We measure externally expressed behaviour which we call social skills. We adopt several best practices in the rating process to arrive at a true measure of social skills. We build two models, first one using expert-verified features, while the second is a complex state-of-the-art transformer model with additive attention. We find that the simpler model performs similar to the complex model for two of the parameters. The model also generalizes well across candidates from different countries. We also study the errors of video grading models with regard to gender and race. We find most effect sizes to be small and the results to be very encouraging. We finally verify that the social scores are indeed predictive of interview outcomes. In future work, we plan to do a more detailed analysis of model fairness and also, experiment with more methods to mitigate biases in models. We also plan to test the validity of scores against on-job performance.
Broader Impact
This study presents the first examination of fairness in the scoring of video interviews. This work should help companies assess candidates fairly and recruit a more diverse workforce by minimizing bias when evaluating job candidates, particularly candidates from protected classes. We consider ways to construct models that use causal features. We also examine whether the grading models exhibit bias by race or gender. We urge practitioners to develop and use these models with utmost care, applying the concepts developed in this paper. We hope this work will help encourage and develop further studies in fairness in video processing.
References
- [1] Marilyn Abbott, Tracey Derwing, and Kerry Louw. Teaching pragmatics to l2 learners for the workplace: The job interview. Canadian Modern Language Review-revue Canadienne Des Langues Vivantes - CAN MOD LANG REV, 66:739–758, 08 2010.
- [2] Varun Aggarwal, Shashank Srikant, and Gursimran Singh. Question independent grading using machine learning: The case of computer program grading. In KDD, 2016.
- [3] Amazon rekognition. Website, 0.
- [4] Face: An ai service that analyses faces in images. Website, 0.
- [5] Dzmitry Bahdanau, Kyunghyun Cho, and Y. Bengio. Neural machine translation by jointly learning to align and translate. ArXiv, 1409, 09 2014.
- [6] T. Baltrušaitis, P. Robinson, and L. Morency. Openface: An open source facial behavior analysis toolkit. In 2016 IEEE Winter Conference on Applications of Computer Vision (WACV), pages 1–10, 2016.
- [7] Sarah Adel Bargal, Emad Barsoum, Cristian Canton Ferrer, and Cha Zhang. Emotion recognition in the wild from videos using images. In Proceedings of the 18th ACM International Conference on Multimodal Interaction, pages 433–436, 2016.
- [8] Lisa Feldman Barrett, Ralph Adolphs, Stacy Marsella, Aleix M. Martinez, and Seth D. Pollak. Emotional expressions reconsidered: Challenges to inferring emotion from human facial movements. Psychological Science in the Public Interest, 20(1):1–68, 2019. PMID: 31313636.
- [9] Manjot Bilkhu, Siyang Wang, and Tushar Dobhal. Attention is all you need for videos: Self-attention based video summarization using universal transformers. arXiv preprint arXiv:1906.02792, 2019.
- [10] Joy Buolamwini and Timnit Gebru. Gender shades: Intersectional accuracy disparities in commercial gender classification. In Conference on fairness, accountability and transparency, pages 77–91, 2018.
- [11] David F Caldwell and Jerry M Burger. Personality characteristics of job applicants and success in screening interviews. Personnel Psychology, 51(1):119–136, 1998.
- [12] Flavio Calmon, Dennis Wei, Bhanukiran Vinzamuri, Karthikeyan Natesan Ramamurthy, and Kush R Varshney. Optimized pre-processing for discrimination prevention. In I. Guyon, U. V. Luxburg, S. Bengio, H. Wallach, R. Fergus, S. Vishwanathan, and R. Garnett, editors, Advances in Neural Information Processing Systems 30, pages 3992–4001. Curran Associates, Inc., 2017.
- [13] Lei Chen, Ru Zhao, Chee Wee Leong, Blair Lehman, Gary Feng, and Mohammed Ehsan Hoque. Automated video interview judgment on a large-sized corpus collected online. In 2017 Seventh International Conference on Affective Computing and Intelligent Interaction (ACII), pages 504–509. IEEE, 2017.
- [14] Cynthia M Cook, John J Howard, Yevgeniy B Sirotin, Jerry L Tipton, and Arun R Vemury. Demographic effects in facial recognition and their dependence on image acquisition: An evaluation of eleven commercial systems. IEEE Transactions on Biometrics, Behavior, and Identity Science, 1(1):32–41, 2019.
- [15] Kevin W Cook, Carol A Vance, and Paul E Spector. The relation of candidate personality with selection-interview outcomes. Journal of Applied Social Psychology, 30(4):867–885, 2000.
- [16] Timothy DeGroot and Stephan Motowidlo. Why visual and vocal interview cues can affect interviewers’ judgments and predict job performance. Journal of Applied Psychology - J APPL PSYCHOL, 84:986–993, 12 1999.
- [17] Florian Eyben, Felix Weninger, Florian Gross, and Björn Schuller. Recent developments in opensmile, the munich open-source multimedia feature extractor. In Proceedings of the 21st ACM International Conference on Multimedia, MM ’13, page 835–838, New York, NY, USA, 2013. Association for Computing Machinery.
- [18] Realtime webcam face detection and emotion recognition. Github, 2018.
- [19] Michael Feldman, Sorelle A Friedler, John Moeller, Carlos Scheidegger, and Suresh Venkatasubramanian. Certifying and removing disparate impact. In proceedings of the 21th ACM SIGKDD international conference on knowledge discovery and data mining, pages 259–268, 2015.
- [20] RAY J. FORBES and PAUL R. JACKSON. Non-verbal behaviour and the outcome of selection interviews. Journal of Occupational Psychology, 53(1):65–72, 1980.
- [21] Nina Grgic-Hlaca, Muhammad Bilal Zafar, Krishna P. Gummadi, and Adrian Weller. Beyond distributive fairness in algorithmic decision making: Feature selection for procedurally fair learning. In AAAI, 2018.
- [22] Moritz Hardt, Eric Price, Eric Price, and Nati Srebro. Equality of opportunity in supervised learning. In D. D. Lee, M. Sugiyama, U. V. Luxburg, I. Guyon, and R. Garnett, editors, Advances in Neural Information Processing Systems 29, pages 3315–3323. Curran Associates, Inc., 2016.
- [23] Léo Hemamou, Ghazi Felhi, Vincent Vandenbussche, Jean-Claude Martin, and Chloé Clavel. Hirenet: A hierarchical attention model for the automatic analysis of asynchronous video job interviews. In Proceedings of the AAAI Conference on Artificial Intelligence, volume 33, pages 573–581, 2019.
- [24] Dacher Keltner, Paul Ekman, Gian C Gonzaga, and Jennifer Beer. Facial expression of emotion. Oxford University Press, 2003.
- [25] Christian G Kohler, Travis Turner, Neal M Stolar, Warren B Bilker, Colleen M Brensinger, Raquel E Gur, and Ruben C Gur. Differences in facial expressions of four universal emotions. Psychiatry research, 128(3):235–244, 2004.
- [26] Chee Leong, Katrina Roohr, Vikram Ramanarayanan, Michelle Martin-Raugh, Harrison Kell, Rutuja Ubale, Yao Qian, Zydrune Mladineo, and Laura McCulla. Are humans biased in assessment of video interviews? In ICMI ’19: Adjunct of the 2019 International Conference on Multimodal Interaction, pages 1–5, 10 2019.
- [27] Daniel McDuff, Abdelrahman Mahmoud, Mohammad Mavadati, May Amr, Jay Turcot, and Rana el Kaliouby. Affdex sdk: a cross-platform real-time multi-face expression recognition toolkit. In Proceedings of the 2016 CHI conference extended abstracts on human factors in computing systems, pages 3723–3726, 2016.
- [28] Vidya Muthukumar. Color-theoretic experiments to understand unequal gender classification accuracy from face images. In Proceedings of the IEEE Conference on Computer Vision and Pattern Recognition Workshops, pages 0–0, 2019.
- [29] Iftekhar Naim, Md Iftekhar Tanveer, Daniel Gildea, and Mohammed Ehsan Hoque. Automated analysis and prediction of job interview performance. IEEE Transactions on Affective Computing, 9(2):191–204, 2016.
- [30] L. S. Nguyen, D. Frauendorfer, M. S. Mast, and D. Gatica-Perez. Hire me: Computational inference of hirability in employment interviews based on nonverbal behavior. IEEE Transactions on Multimedia, 16(4):1018–1031, 2014.
- [31] Ziad Obermeyer, Brian Powers, Christine Vogeli, and Sendhil Mullainathan. Dissecting racial bias in an algorithm used to manage the health of populations. Science, 366(6464):447–453, 2019.
- [32] Curtis Padgett and Garrison Cottrell. Identifying emotion in static face images. In Proceedings of the 2nd Joint Symposium on Neural Computation, volume 5, pages 91–101, 1995.
- [33] Bilal Qureshi, Faisal Kamiran, Asim Karim, and Salvatore Ruggieri. Causal discrimination discovery through propensity score analysis. arXiv preprint arXiv:1608.03735, 2016.
- [34] Samira Samadi, Uthaipon Tantipongpipat, Jamie Morgenstern, Mohit Singh, and Santosh Vempala. The price of fair pca: One extra dimension. In Proceedings of the 32nd International Conference on Neural Information Processing Systems, NIPS’18, page 10999–11010, Red Hook, NY, USA, 2018. Curran Associates Inc.
- [35] Björn Schuller, Stefan Steidl, Anton Batliner, Felix Burkhardt, Laurence Devillers, Christian Müller, and Shrikanth Narayanan. The interspeech 2010 paralinguistic challenge. ISCA, 2010.
- [36] Björn Schuller, Stefan Steidl, and Anton Batliner. The interspeech 2009 emotion challenge. Proc. Interspeech, pages 312–315, 01 2009.
- [37] Vinay Shashidhar, Nishant Pandey, and Varun Aggarwal. Automatic spontaneous speech grading: A novel feature derivation technique using the crowd. In ACL, 2015.
- [38] Vinay Shashidhar, Nishant Pandey, and Varun Aggarwal. Spoken english grading: Machine learning with crowd intelligence. In KDD, 2015.
- [39] Shashank Srikant and Varun Aggarwal. A system to grade computer programming skills using machine learning. In Proceedings of the 20th ACM SIGKDD international conference on Knowledge discovery and data mining, pages 1887–1896. ACM, 2014.
- [40] Gail M. Sullivan and Richard Feinn. Using effect size—or why the p value is not enough. Journal of Graduate Medical Education, 4(3):279–282, 2012.
- [41] Rohit Takhar and Varun Aggarwal. Grading uncompilable programs. In Proceedings of the AAAI Conference on Artificial Intelligence, volume 33, pages 9389–9396, 2019.
- [42] Uthaipon Tantipongpipat, Samira Samadi, Mohit Singh, Jamie H Morgenstern, and Santosh Vempala. Multi-criteria dimensionality reduction with applications to fairness. In Advances in Neural Information Processing Systems, pages 15135–15145, 2019.
- [43] Abhishek Unnam, Rohit Takhar, and Varun Aggarwal. Grading emails and generating feedback. EDM, 2018.
- [44] Ashish Vaswani, Noam Shazeer, Niki Parmar, Jakob Uszkoreit, Llion Jones, Aidan N Gomez, Łukasz Kaiser, and Illia Polosukhin. Attention is all you need. In Advances in neural information processing systems, pages 5998–6008, 2017.