∎
22email: a.zehtab97@ms.tabrizu.ac.ir
Orcid: 0000-0001-7410-0299 33institutetext: Ali-Reza Feizi-Derakhshi 44institutetext: Computerized Intelligence Systems Laboratory, Department of Computer Engineering, University of Tabriz, Tabriz, IRAN.
44email: derakhshi96@ms.tabrizu.ac.ir
Orcid: 0000-0003-3036-1651 55institutetext: Narjes Nikzad-Khasmakhi 66institutetext: Computerized Intelligence Systems Laboratory, Department of Computer Engineering, University of Tabriz, Tabriz, IRAN.
66email: n.nikzad@tabrizu.ac.ir
Orcid: 0000-0003-3536-1343 77institutetext: Meysam Asgari-Chenaghlu 88institutetext: Computerized Intelligence Systems Laboratory, Department of Computer Engineering, University of Tabriz, Tabriz, IRAN.
88email: m.asgari@tabrizu.ac.ir
Orcid: 0000-0002-7892-9675 99institutetext: Saeideh Nabipour 1010institutetext: Department Computer and Electrical Engineering, University of Mohaghegh Ardabili, Ardabil, IRAN.
Orcid: 0000-0002-3622-1513
1010email: saeideh.nabipour@gmail.com
Multimodal price prediction
Abstract
Price prediction is one of the examples related to forecasting tasks and is a project based on data science. Price prediction analyzes data and predicts the cost of new products. The goal of this research is to achieve an arrangement to predict the price of a cellphone based on its specifications. So, five deep learning models are proposed to predict the price range of a cellphone, one unimodal and four multimodal approaches. The multimodal methods predict the prices based on the graphical and non-graphical features of cellphones that have an important effect on their valorizations. Also, to evaluate the efficiency of the proposed methods, a cellphone dataset has been gathered from GSMArena. The experimental results show 88.3% F1-score, which confirms that multimodal learning leads to more accurate predictions than state-of-the-art techniques.
Keywords:
Price Prediction Multimodal Learning Convolutional Neural Network Inception Classification1 Introduction
With increasing the volume of unstructured data created by IoT devices, humans and social media platforms, data science has become a great analytic science to extract useful and valuable information from this data Tien (2017). On the other hand, data mining techniques such as Decision Tree, Neural Network and K-means have accelerated the data science growth to discover patterns and extract knowledge from a large amount of data stored in different sources such as web Olson and Shi (2007); Sohrabi et al. (2012); Jian et al. (2013). Moreover, data science and machine learning work in a perfect harmony to process data and learn from it for specific tasks such as making predictions. This collaboration helps both businesses and customers. For example, the stock market prediction is a business activity that most people are interested in. Prediction and analysis of stock market data have played a crucial role in today’s economy Hiransha et al. (2018). From customers’ prespective, stock market prediction has significant effects on their future choices such as the decision processes of traders and investors to buy or sell a stock.
The price prediction is one of the examples related to forecasting tasks and is a project based on data science. The price prediction analyzes data and predicts the cost of new products. Examples of price prediction include stock prediction Parmar et al. (2018); Teixeira Zavadzki de Pauli et al. (2020); Singh and Srivastava (2017); Karimuzzaman et al. (2021), oil price SenGupta et al. (2021), electricity price forecasting Vilar et al. (2018), ticket pricing Abdella et al. (2019); Lantseva et al. (2015), cryptocurrency forecasting Azari (2019); Kadiroglu et al. (2019); Phaladisailoed and Numnonda (2018); Lahmiri and Bekiros (2019); Ji et al. (2019), product price prediction such as house Park and Bae (2015) and smartphone Chandrashekhara et al. (2019). Because of IoT usage of cellphones Tien (2017), cellphone price prediction is selected as the benchmark of this study.
Price prediction can be seen as a regression or classification task. For the regression task, the actual price is predicted and for the classification task, the price range in the form of classes is predicted. The accuracy of predicted price can be changed based on the number of classes. On the other hand, the price prediction task itself, regardless of being regression or classification, is achieved using the features of the products. These features can be in any modality and form. For example, a product such as a cellphone has features in both numerical and image forms. Combination of various and different modalities requires a more robust model that can generalize its learning for samples with different aspects. In the case of cellphone price prediction, the RGB image data that is in form of a matrix is combined with features such as 3G network support that is a boolean feature.
Some previous works such as Nasser and Al-Shawwa (2019); Asim and Khan (2018); Chandrashekhara et al. (2019) proposed various methods for the problem of cellphone price prediction. Using a variety of techniques such as machine learning and deep learning requires a huge number of data for training. The lack of such data prohibits researchers to use these approaches on cellphone price prediction. Hence, in this paper, a real cellphone dataset, called CD18, for applying learning-based approaches to cellphone price prediction has been provided. Moreover, in the current study, five novel models are proposed that aim to predict prices more accurately. One of the proposed models is unimodal and others are based on multimodal learning. Multimodal prediction and learning are also popular in other fields of AI Asgari-Chenaghlu et al. (2020); Nikzad-Khasmakhi et al. (2020). Using different sentiment analysis and text classification methods Minaee et al. (2020); VasfiSisi and Feizi Derakhshi (2013) can be investigated even in the text related to user comments. In this paper, the multimodal approach has two data types: graphical features and non-graphical features. While images of the products create graphical features, all other features are defined as non-graphical features. Briefly, the combination of the collected dataset with the proposed multimodal learning approaches provides an insightful view of the cellphone price prediction problem.
The rest of this study is organized in the following manner: the second section contains a literature review of mobile price prediction. Section 3 presents the proposed methods. The experimental results are given and discussed in section 4. Some conclusions are drawn in the final section, and the areas for further researches are identified, as well.
2 Related study
While price prediction has a long history in many fields, there are not many works in the product price prediction especially cellphone price prediction that is the main objective of this study. In the following paragraphs, an overview of studies related to the cellphone price prediction is provided.
Asim and Khan Asim and Khan (2018) treated the task of cellphone price prediction in the form of classification problem. In this study, prices were classified into four classes (very economical ( 150), economical (151 - 300), expensive (301 - 450), very expensive ( 450)). Two classifiers decision tree (J48) and Naive Bayes were used to obtain the classes. Also, the authors collected a dataset which includes ten features of cellphones from GSMArena website. In the gathered data, two features brand including categorical and numerical have been used. The memory card slot is categorical, and the rest of the features are numerical.
Also, Nasser and Al-Shawwa Nasser and Al-Shawwa (2019) observed the price prediction as a classification process and used an artificial neural network (ANN) that has three layers. Authors reported their results over Sharma Sharma dataset and considered twenty features of mobile devices and four classes of prices as inputs and outputs, accordingly.
Unlike the previous methods, the study Chandrashekhara et al. (2019) utilized three regression models for the cellphone price prediction task. These three regression methods include Support vector regression (SVR), Multiple linear regression, and Back-propagation neural network. Also, in this paper, features and prices for cellphones were used to evaluate the proposed approaches.
Moreover, in Subhiksha et al. (2020), the authors investigated the efficiency of three regression models including SVM, Logistic regression, and Random forest over Sharma dataset to forecast the prices. They reported that SVM and logistic regression have reached the best accuracy ().
Furthermore, Pipalia and Bhadja Pipalia and Bhadja (2020) studied different classifiers to predict cellphones price. Authors deployed five classifiers namely Logistic Regression, K-Nearest Neighbours (KNN), Decision Tree, SVM, and Gradient Boosting to classify the range of mobile price. The benchmark of their research was Sharma dataset. The obtained results of this paper show that Gradient Boosting is the best classifier that reaches accuracy.
Due to the previous researches, it can be said that there are not multimodal learning and deep learning techniques in cellphone price prediction. So, in this paper, a multimodal learning technique has been employed to combine graphical and non-graphical features. We take the advantages of deep learning structures such as Inception-V3 and convolutional neural network to preserve both features. In this way, each cellphone is presented by a low-dimensional vector that is the concatenation of two features. Then, this vector is fed into a classifier to predict its price.
3 Proposed Method
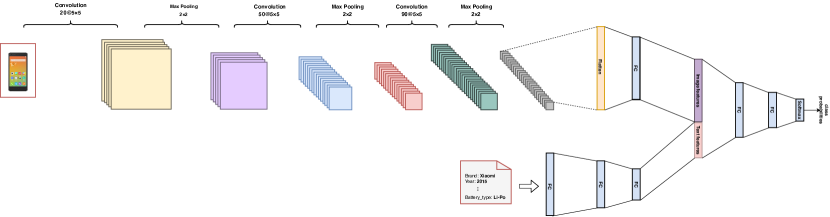
This paper aims to propose a novel multimodal approach for predicting the prices of cellphones. As described before, we treat the price prediction task as a classification problem. To achieve it, five methods have been proposed that one of them is a unimodal model, and the rest of the methods are multimodal approaches. The unimodal modal accepts the numerical features as inputs, while the multimodal approaches add the images of cellphones as another modality. In both unimodal and multimodal approaches, a range of prices for each cellphone are predicted. Each price range is defined as a class of classification task. The important item that makes difference among the proposed multimodal approaches is the way of obtaining features from non-graphical and graphical inputs. Inception-V3 and the convolutional neural networks are deployed to capture image features. On the other hand, non-graphical features are extracted using two different neural networks which consist of three dense layers and convolutional neural networks, respectively. In the next step, both abstracted features are concatenated to create a simple representation for each cellphone sample. Finally, this single feature vector is fed into a classifier to predict and classify the range of cellphone prices. A neural classifier is proposed here which can be exchanged with any other one. In the following paragraphs, the proposed methods are explained in detail.
3.1 Model 1: Unimodal
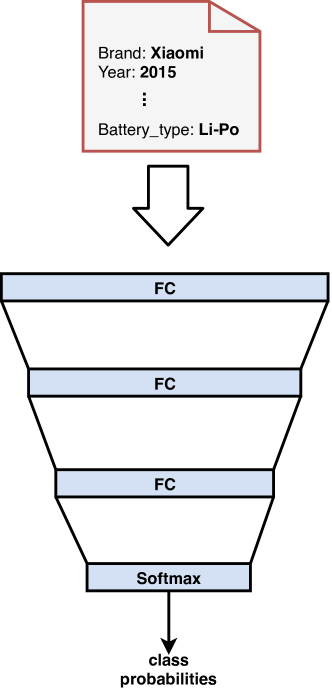
The proposed unimodal method uses non-graphical features of cellphones to predict and classify prices. As shown in Figure 2, this unimodal approach proposes the utilization of the neural network architecture that consists of three fully connected layers and a softmax layer that transforms the prices into price ranges. The input and output of this approach are the numerical features and a price range as a class of classification, respectively.
3.2 Model 2: Inception-based image feature extraction
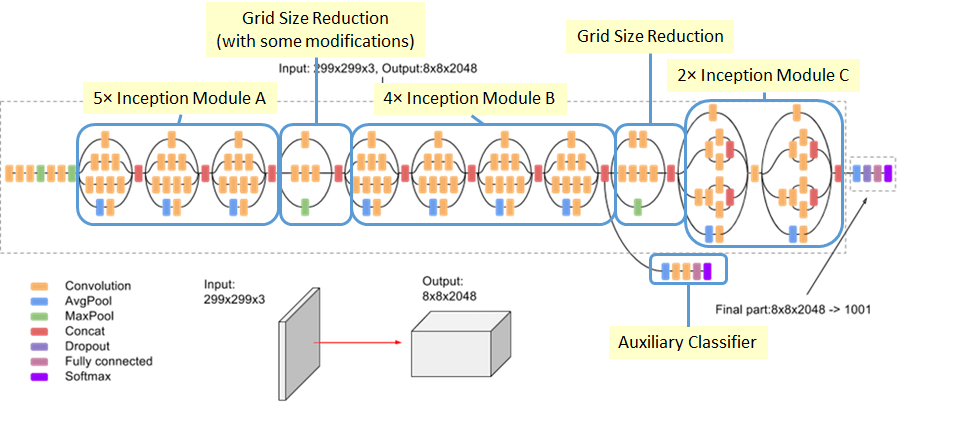
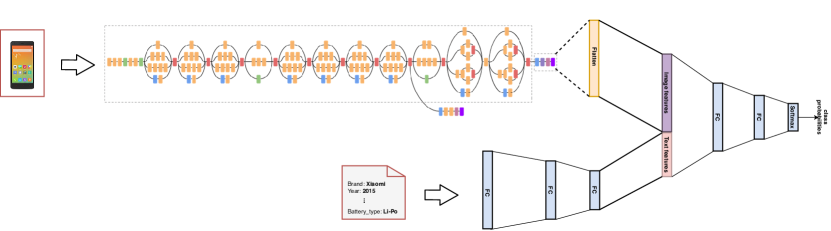
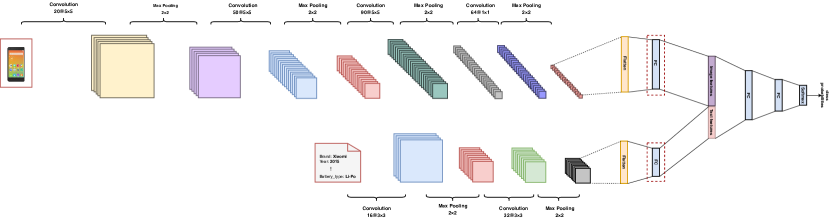
The second model is a multimodal approach that takes the image and non-graphical features of cellphones as inputs and forecasts the price range. The non-graphical features are extracted by a neural network that consists of three fully connected layers used in the unimodal technique. Moreover, there are various methods to model an image or extract features from it. The most popular one is the convolutional neural network (CNN) LeCun et al. (1989). This neural network is the foundation of many models, such as LeNet LeCun et al. (1998), AlexNet Krizhevsky et al. (2017), GoogleNet Szegedy et al. (2015), and Inception Szegedy et al. (2016, 2017). In this study, Inception-V3 model has been used to learn graphical features. For more comprehensive understanding, Figure 3 illustrates the architecture of Inception-V3. To obtain the image features, the output of the second ”Grid Size Reduction” (Figure 3) of Inception-V3 (pre-trained model) has been selected as image embeddings.
At the end, both of these embeddings (non-graphical and graphical features) are concatenated and fed into a classifier. A neural network classifier is proposed here which can be replaced with any other classifier such as Logistic Regression. Figure 4 demonstrates the structure of the second proposed model.
3.3 Model 3: Convolutional image feature extraction and dense concatenating
Figure 5 presents the third proposed approach. It can be inferred that the embedding of the non-graphical inputs are created by a similar process done in the second proposed model and the unimodal method. Moreover, since the convolutional neural networks are one of the most popular and practical deep learning methods to extract features from images, these networks have been used as the image feature extraction method for the rest of the proposed approaches. The CNN architecture has three convolutional layers, three maxpooling layers and one fully connected layer. Then, for each cellphone, the embeddings are extracted from non-graphical and image features are integrated into a single representation through the concatenation process. Finally, this single representation is fed into a neural network that includes two dense layers to predict prices.
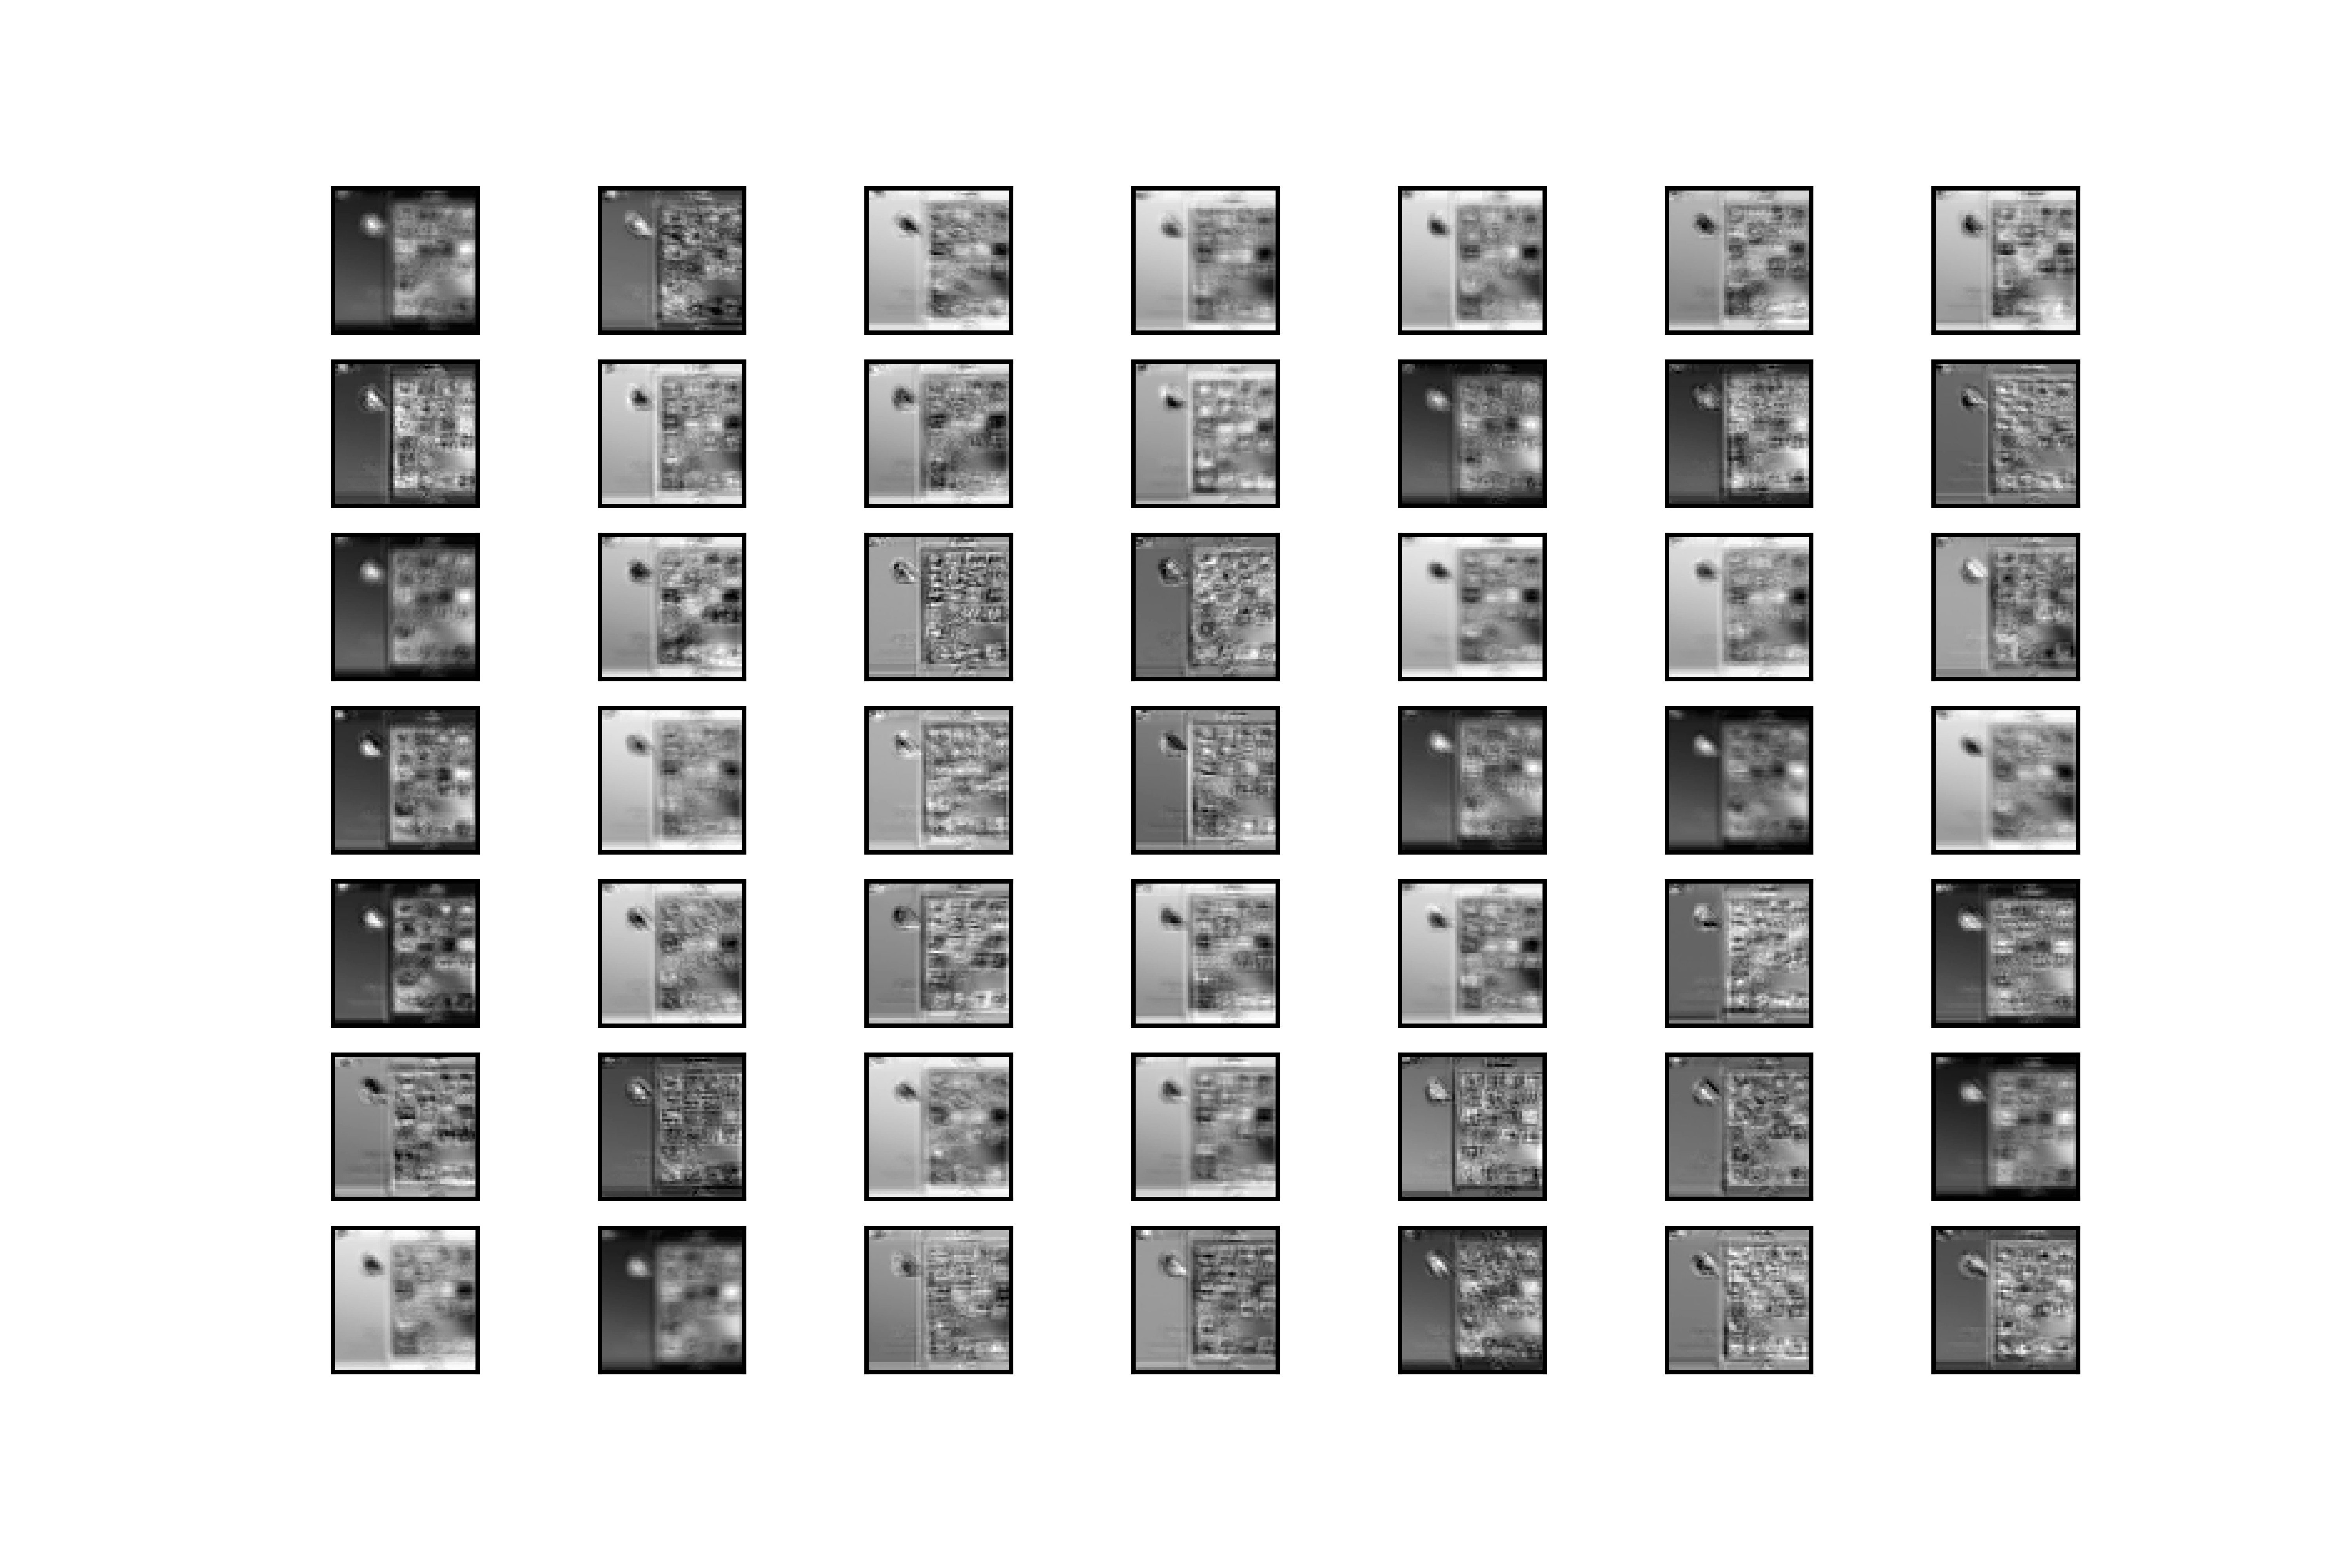
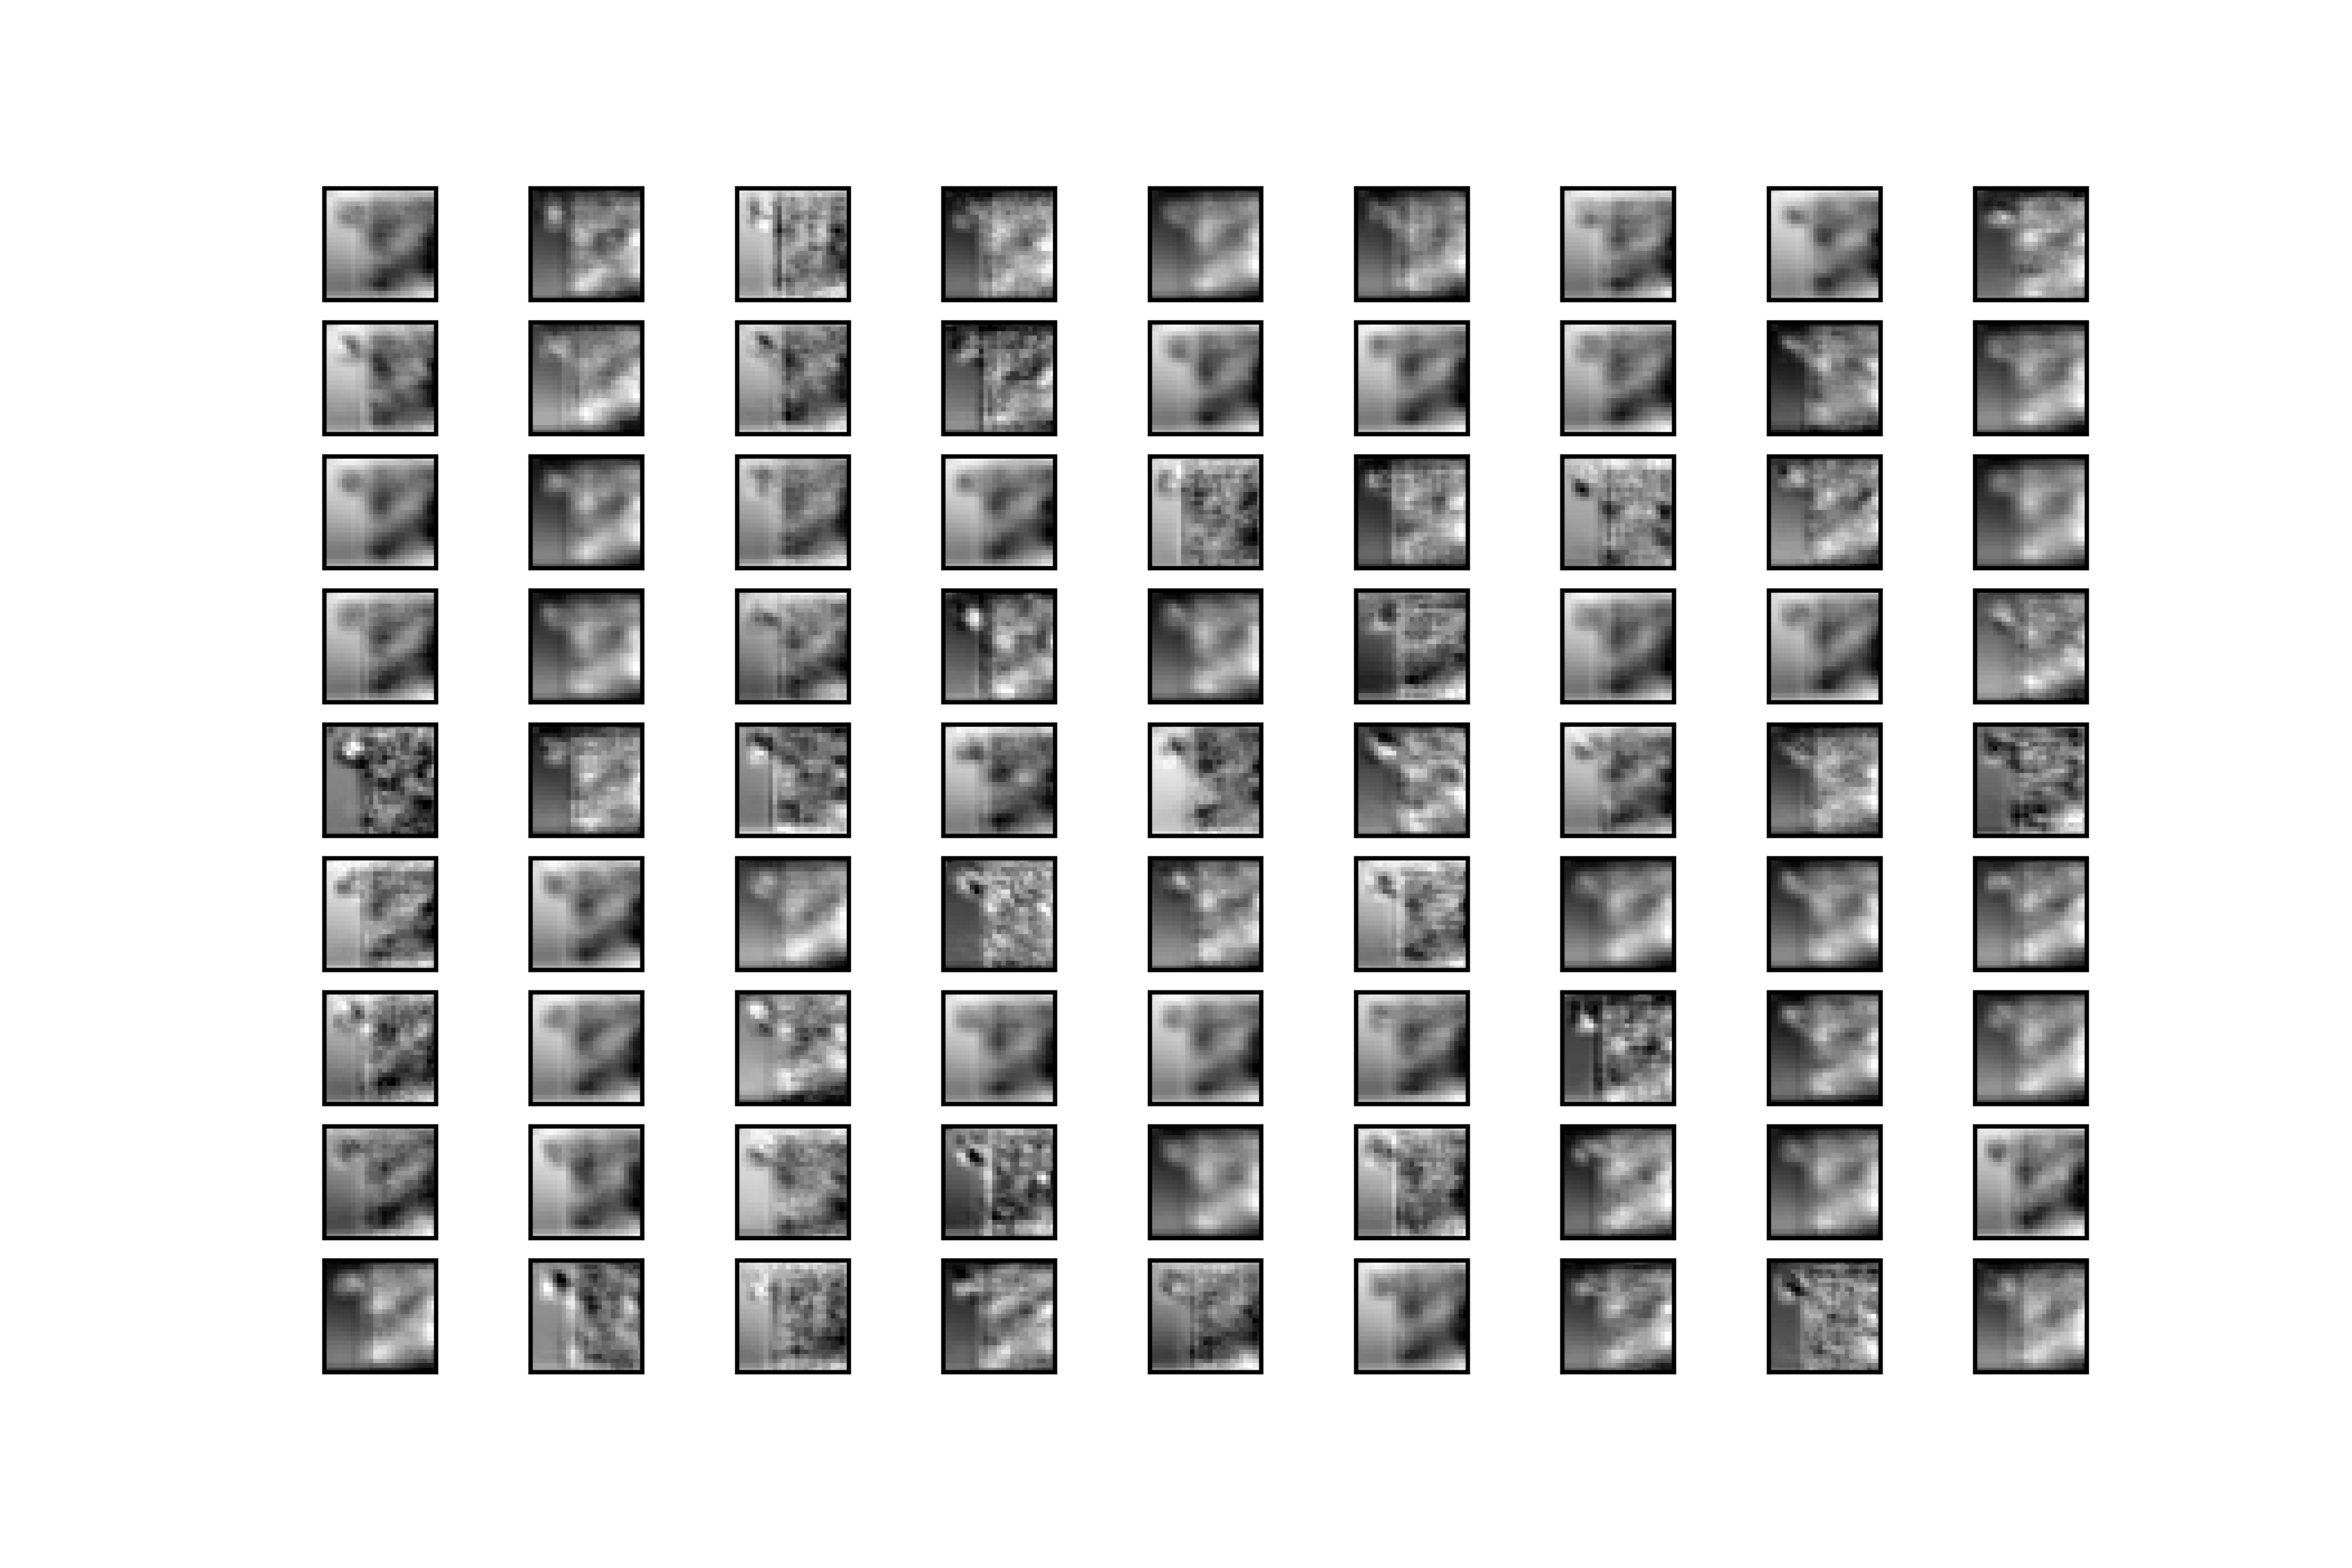
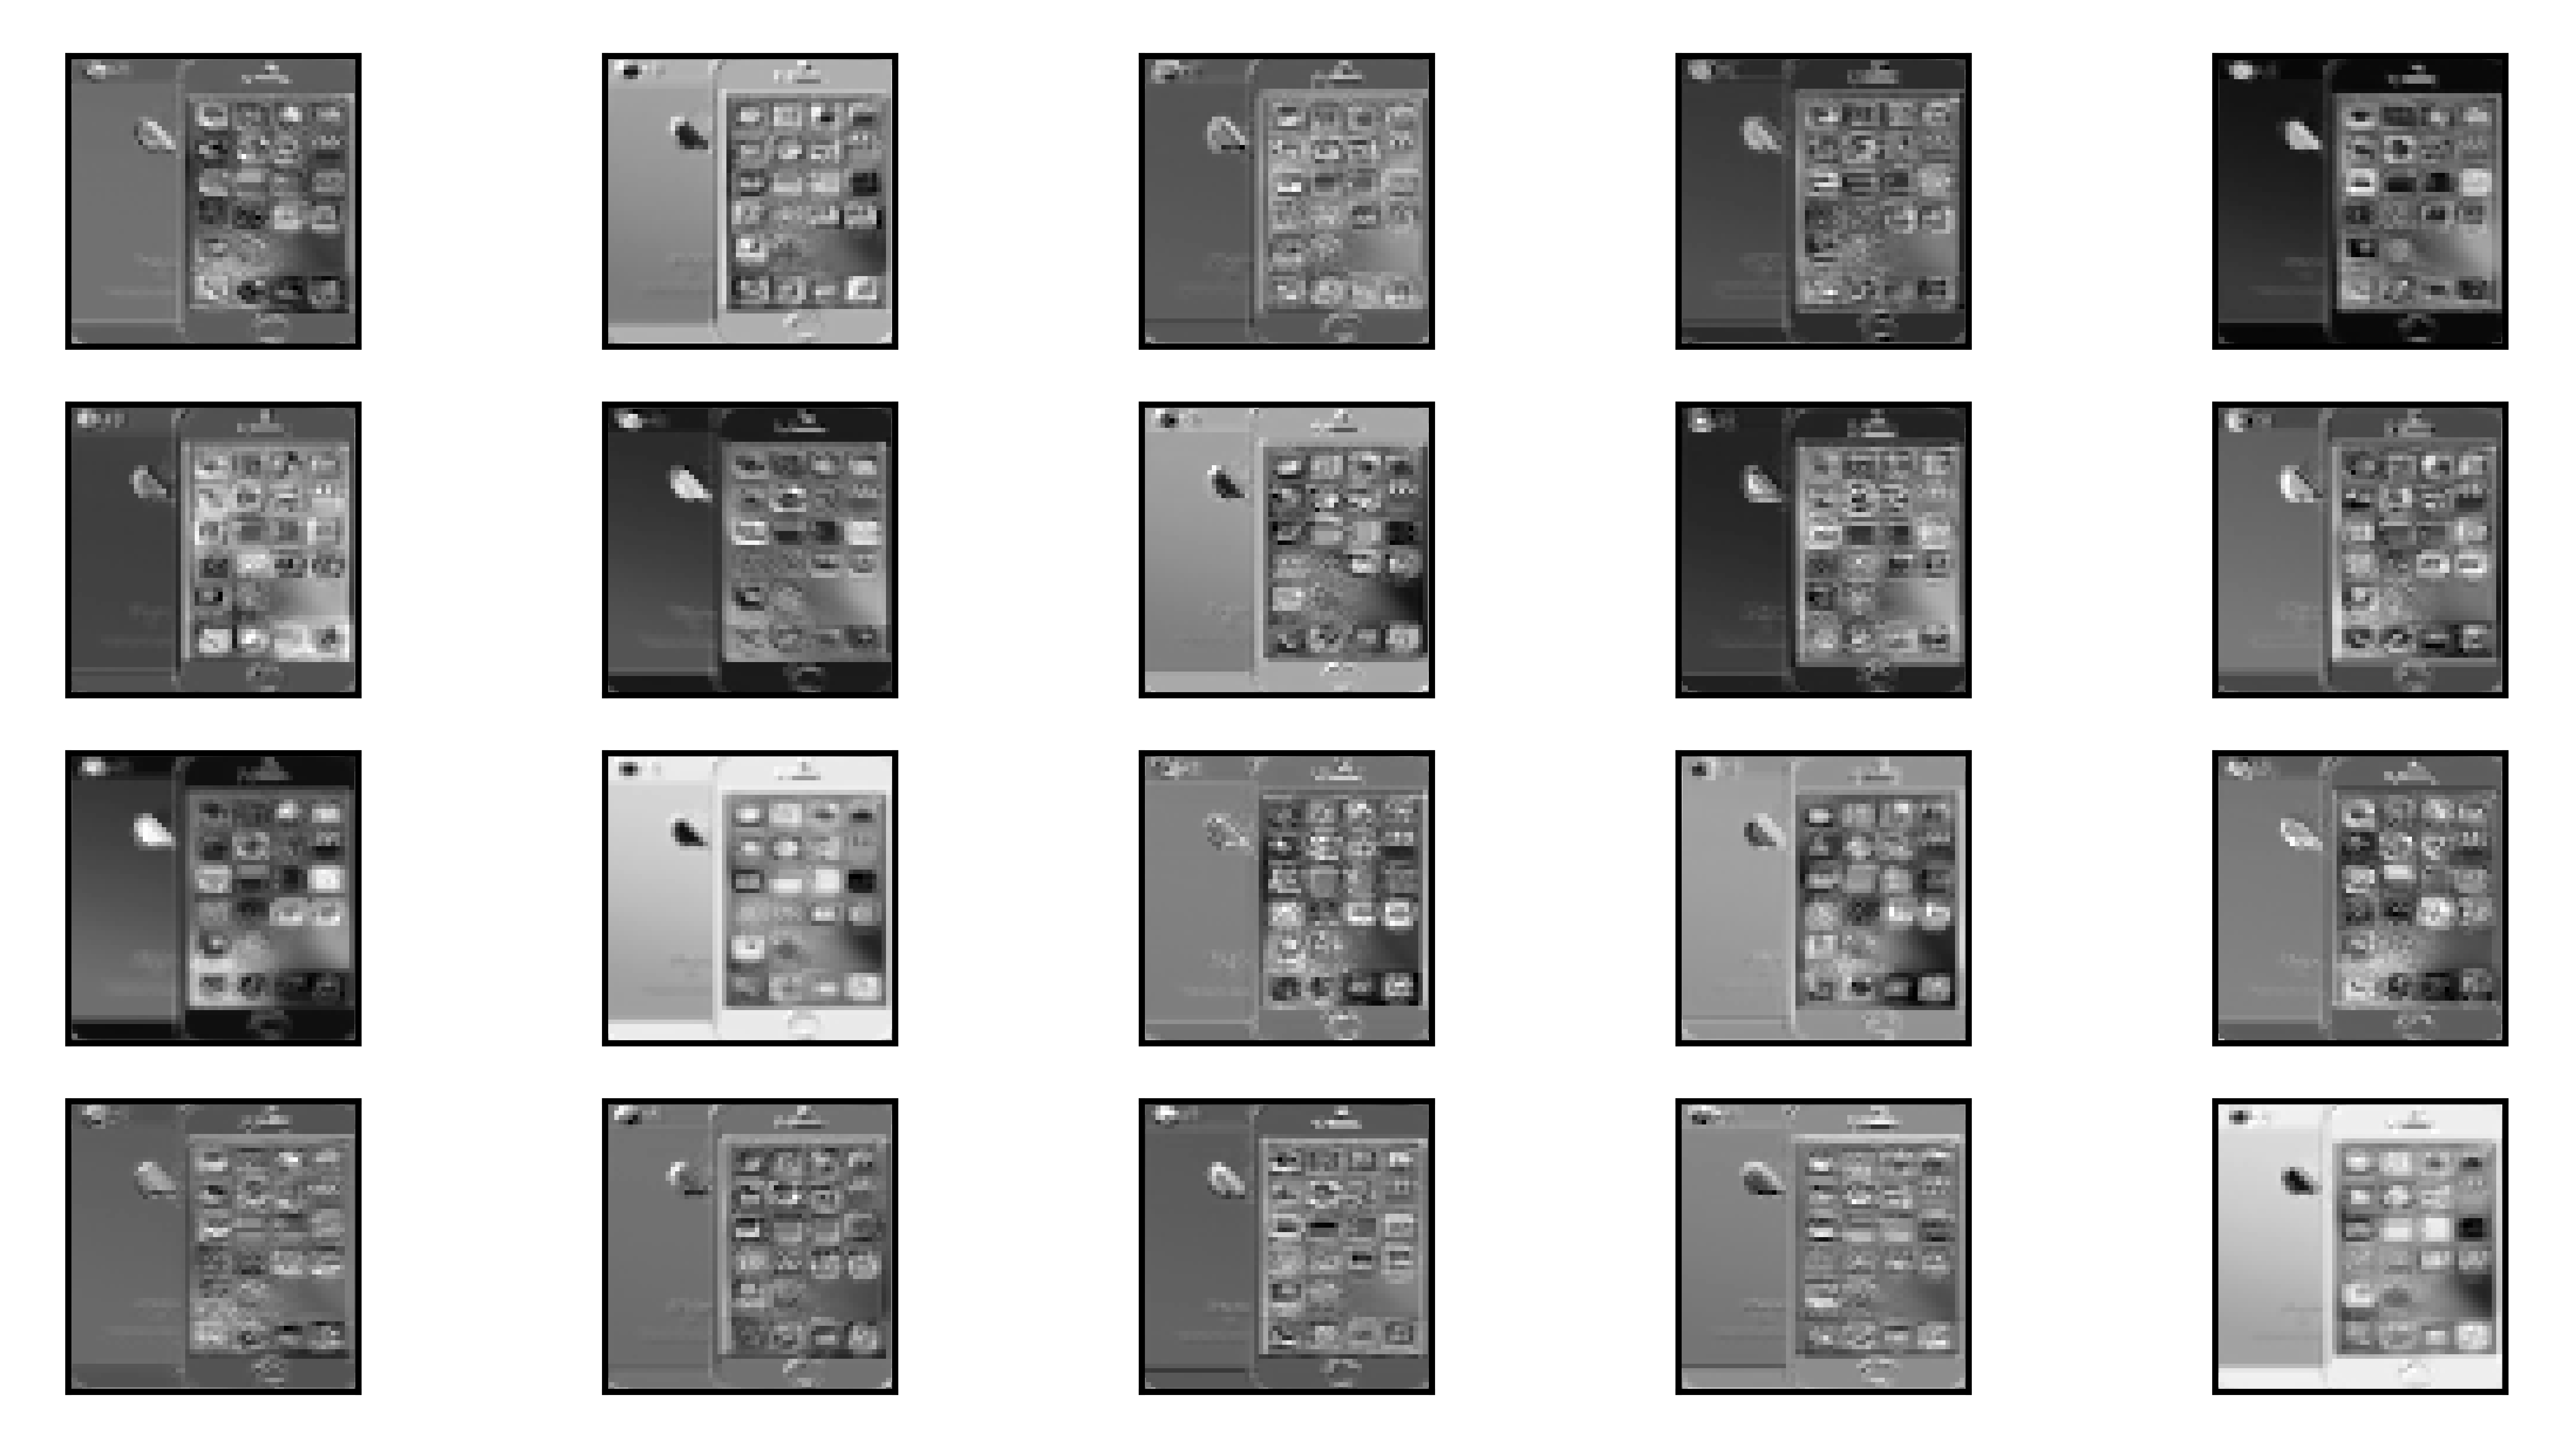
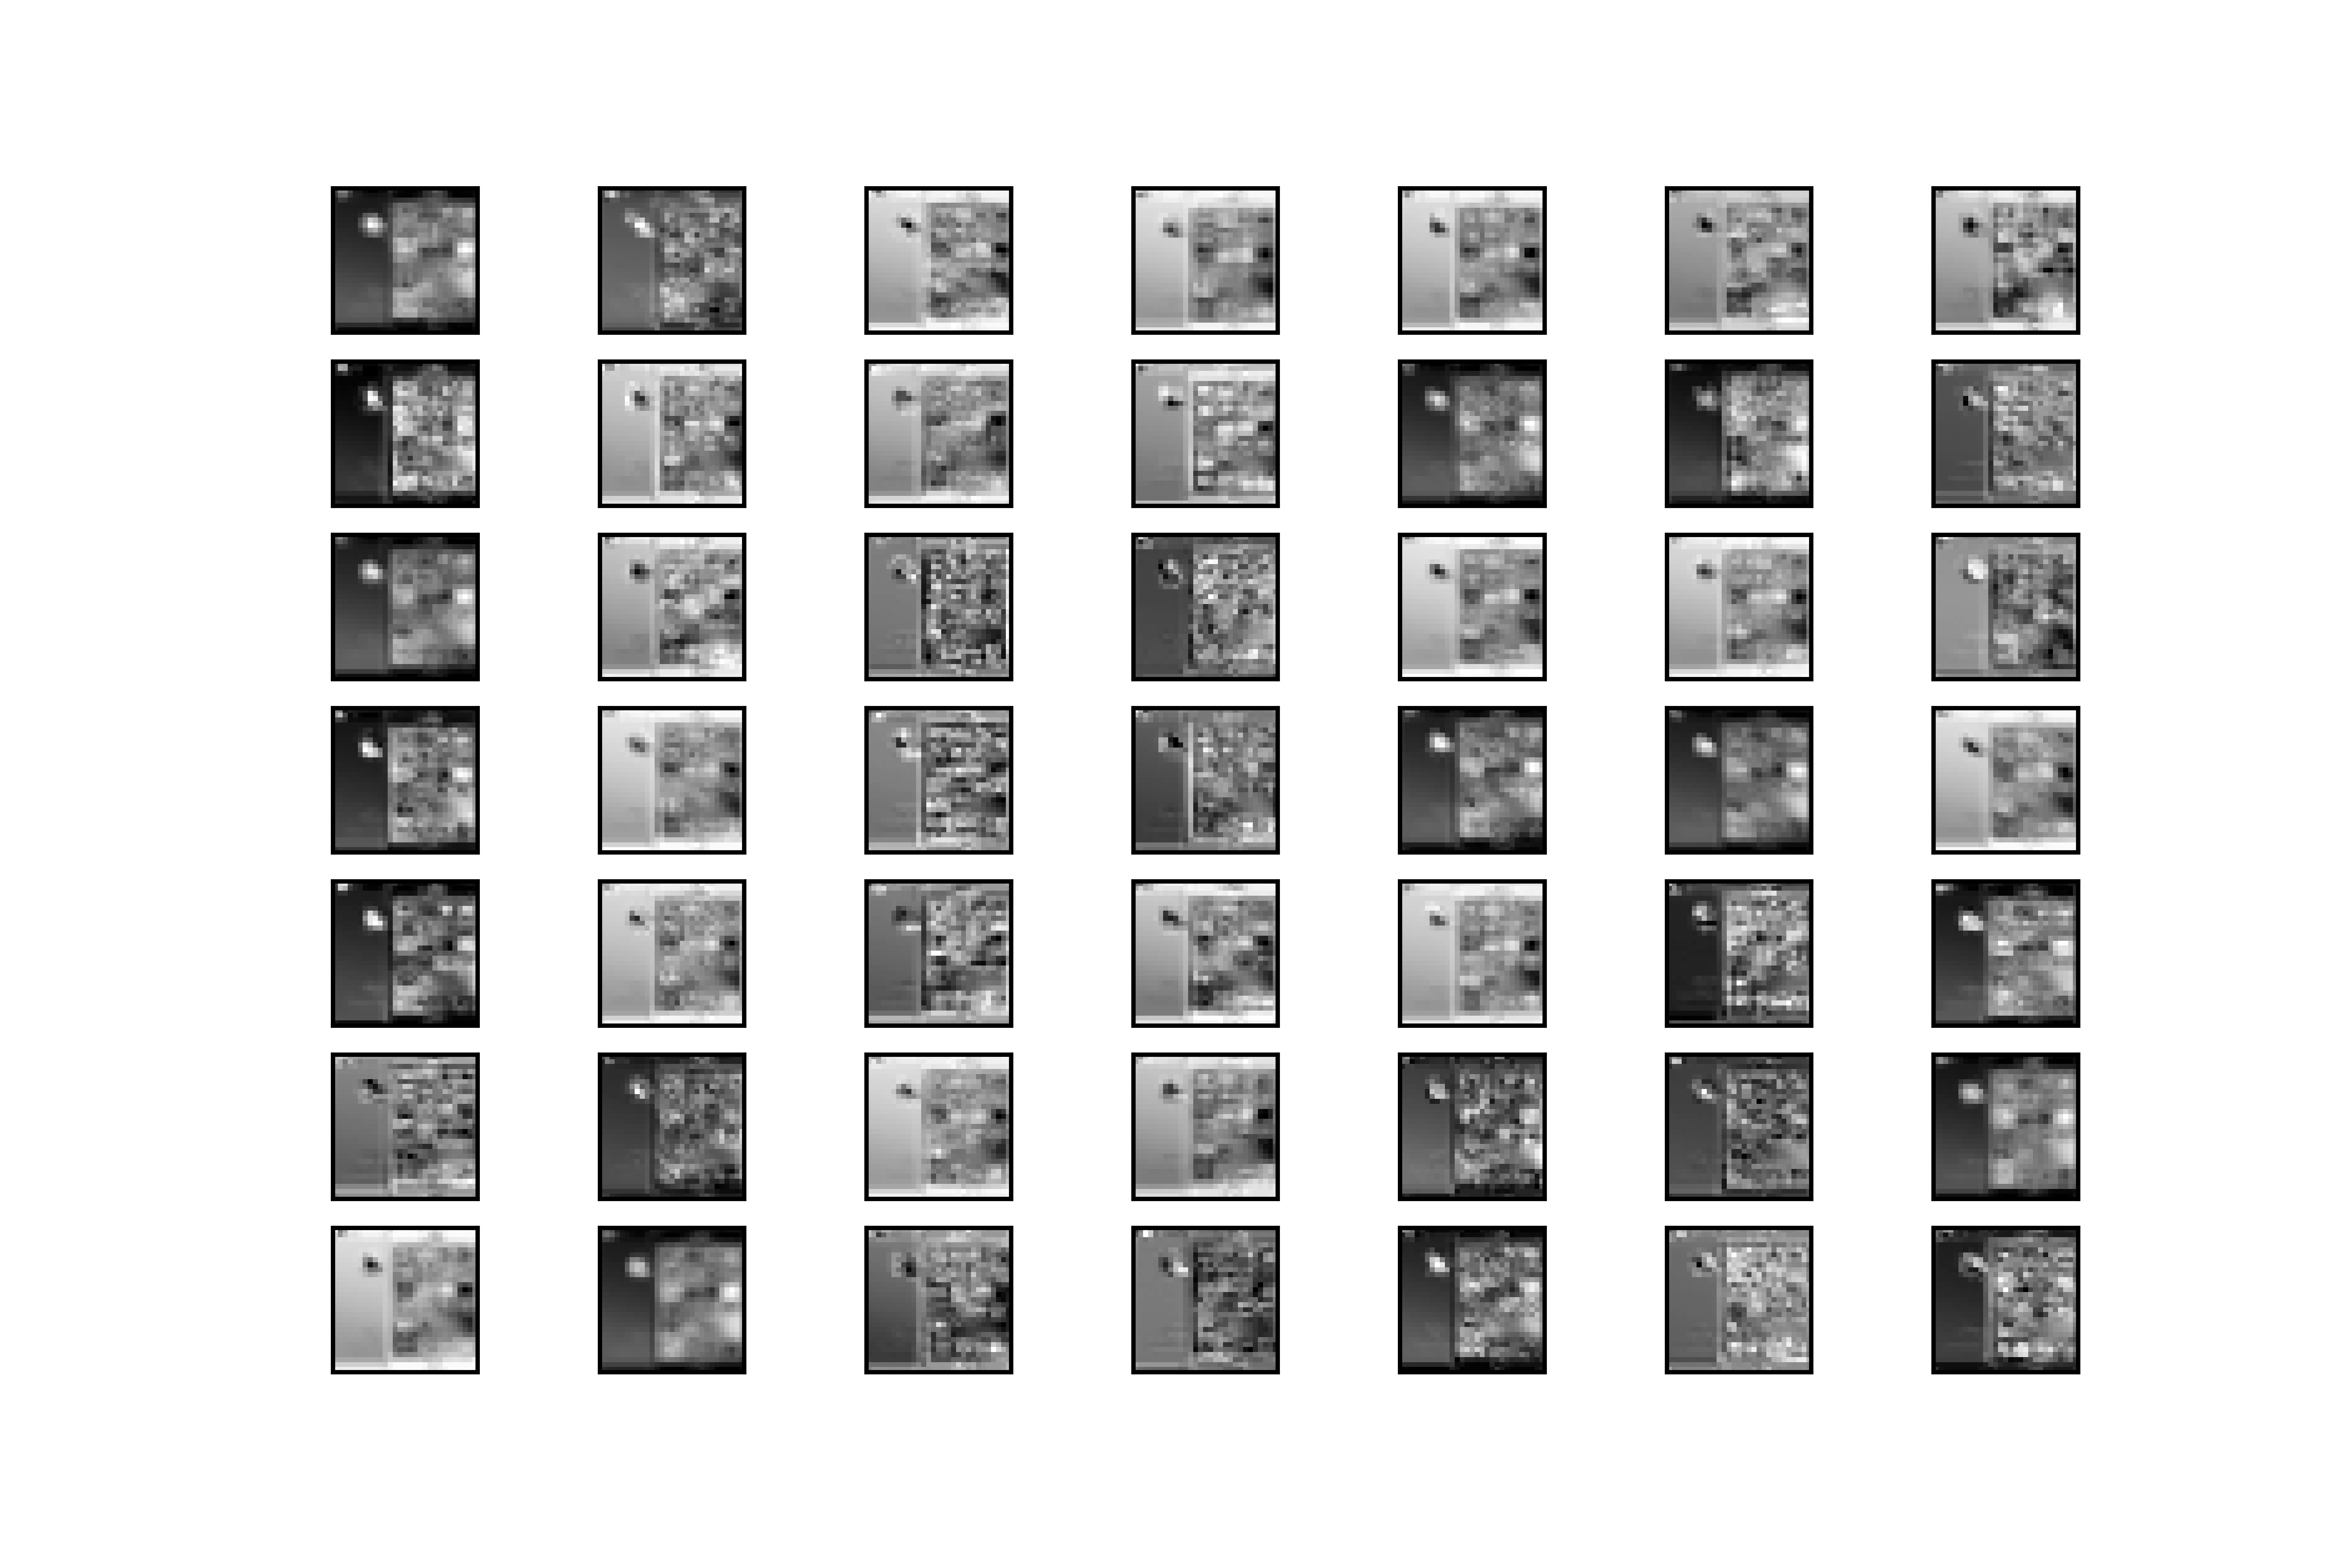
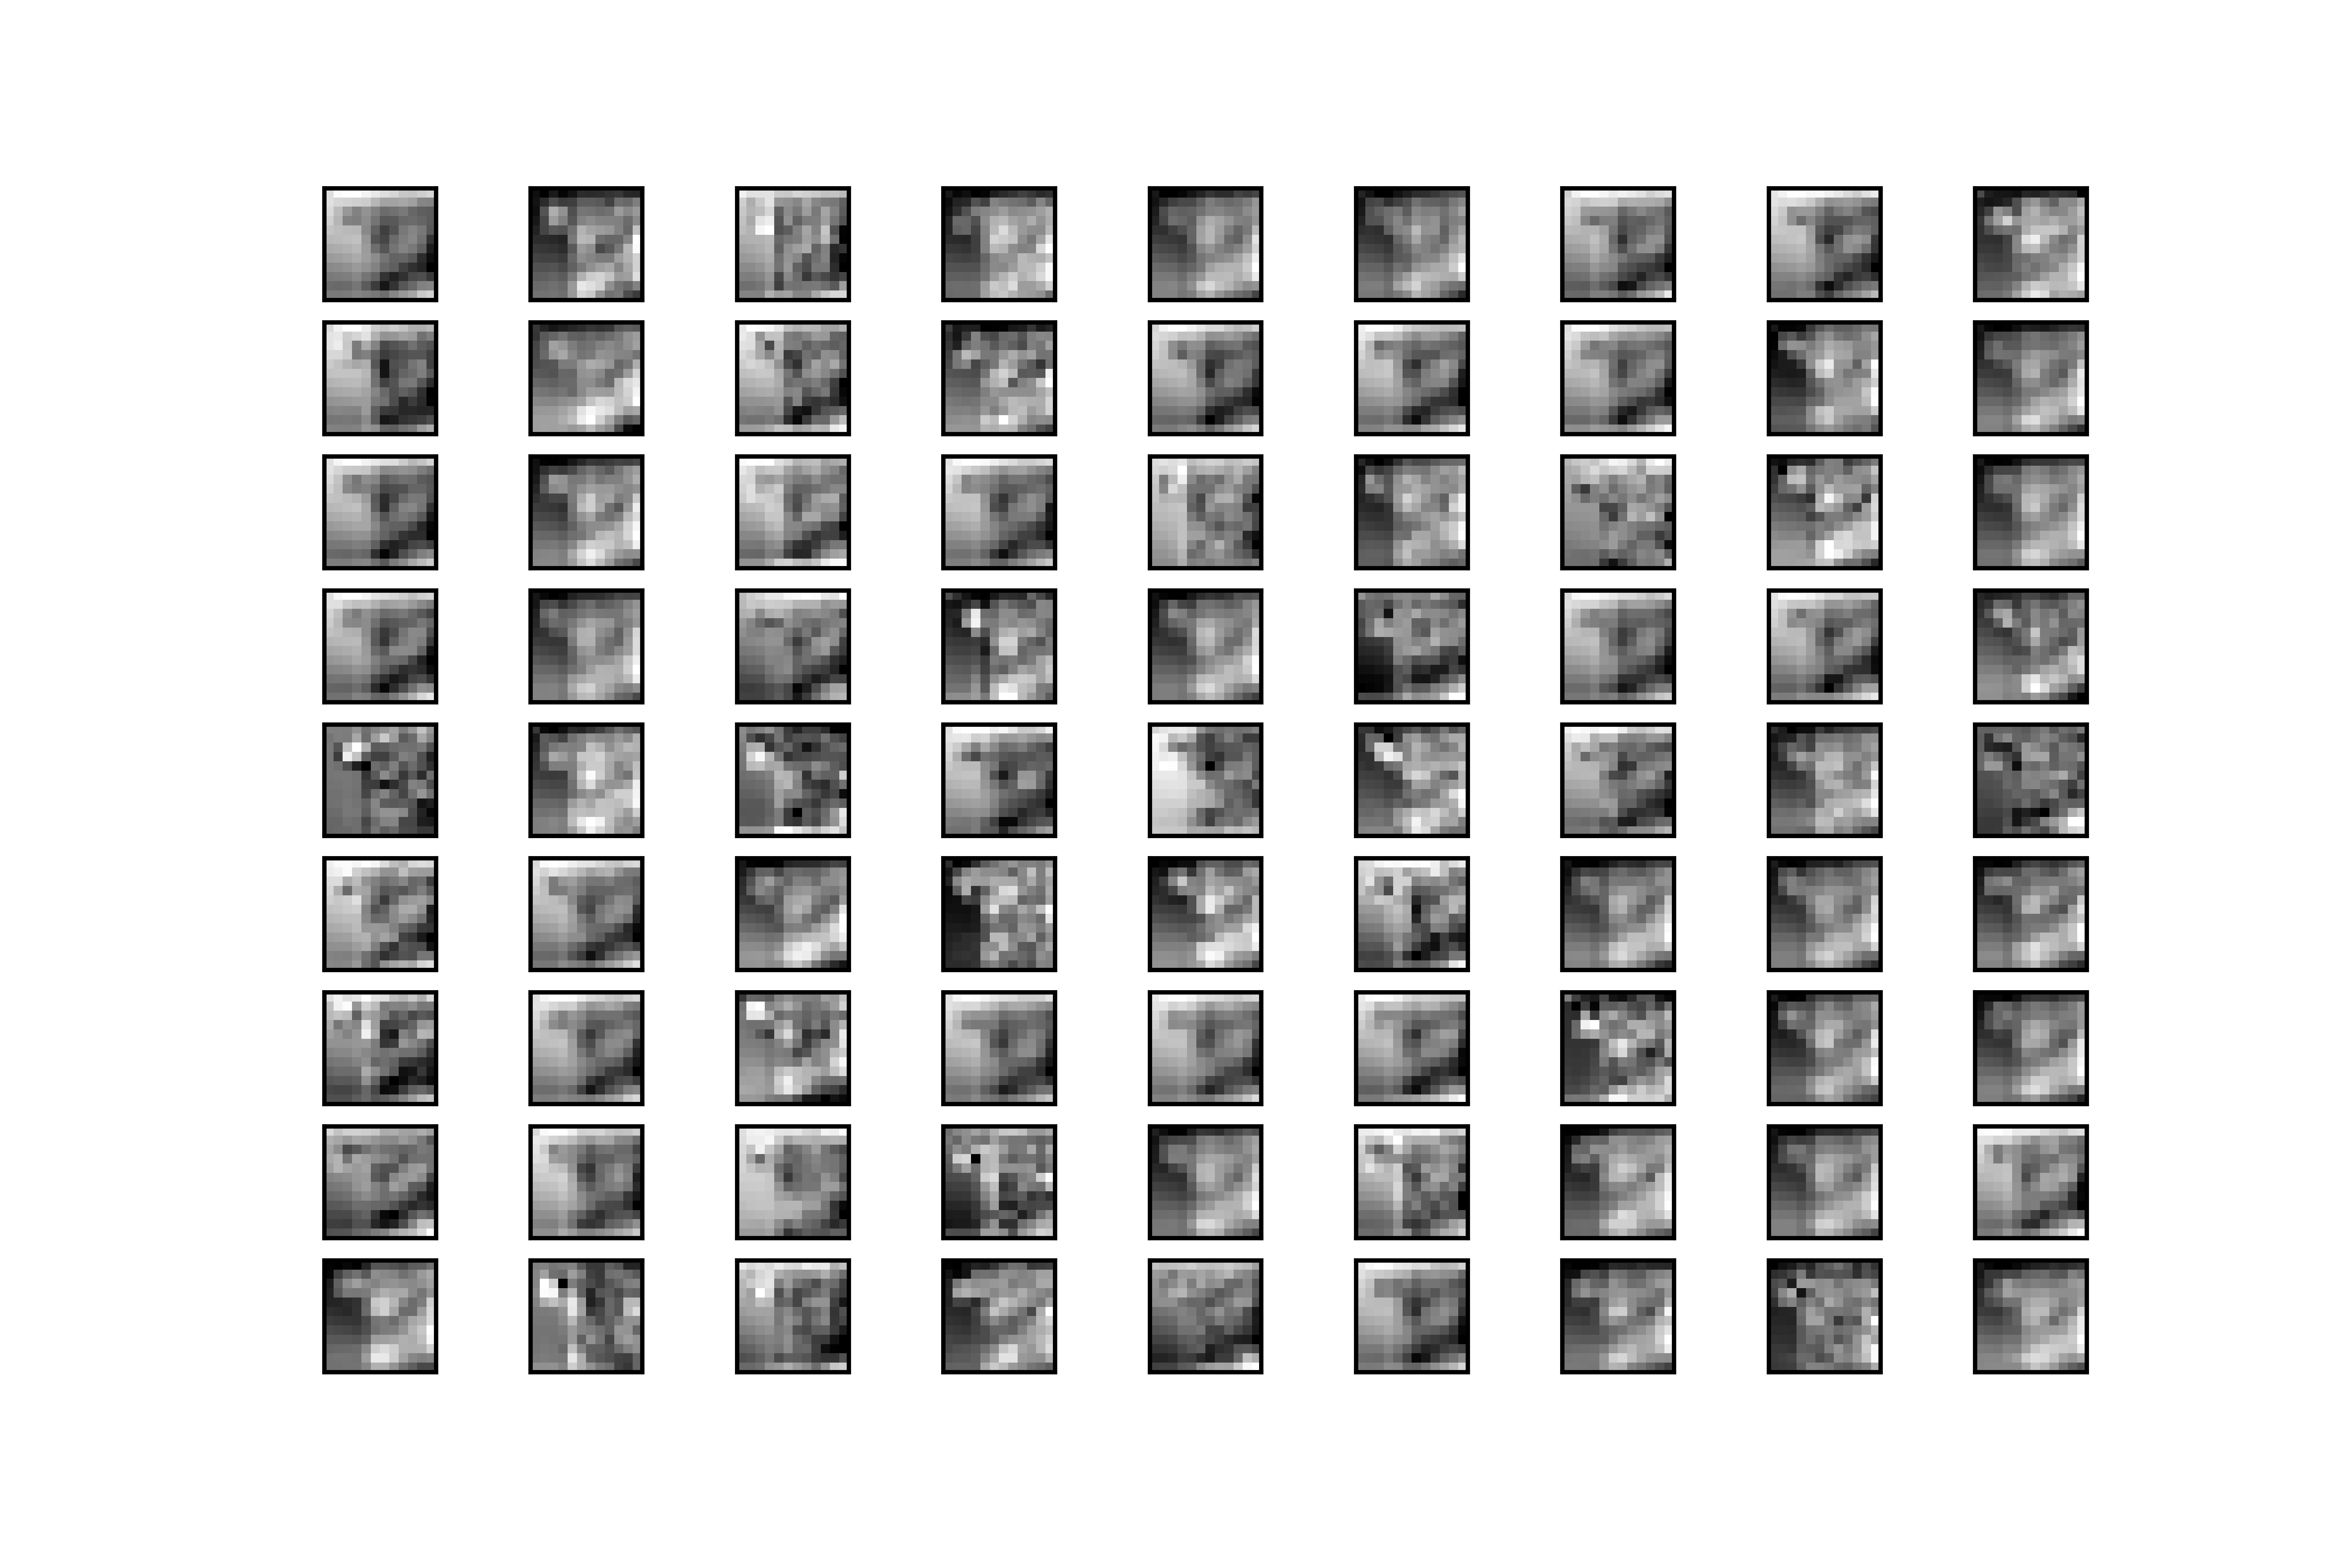
To show how each convolutional layer extracts features, a cellphone image has been injected into the input of the CNN model as an example and the outputs of each convolution layer have been represented in Figure 6. It is obvious that in each layer more features are obtained from the input image which can improve the proposed price prediction model.

3.4 Model 4: Fully convolutional network
The important part that makes a difference between the fourth and third proposed models is that a convolutional neural network is also used to extract features from non-graphical inputs. As shown in Figure 7, non-graphical features as a matrix structured format have been fed into the input of the CNN architecture. This neural network includes two convolutional and maxpooling layers. It should also be noted that the image features are obtained just like the third model. Then, the flattened layers appear that pass the extracted features to the concatenation part. In the next step, the concatenation of both graphical and non-graphical is done. Finally, the vector representations of cellphones make the inputs of the classification part.
3.5 Model 5: Convolutional image and non-graphical features with dense concatenating
The main goal of this method is to have a higher level feature extraction from non-graphical and graphical inputs. Hence, a dense layer on the output of the convolutional networks is added in extracting features from both non-graphical and image inputs. As Figure 7 shows, two and three convolution layers calculate non-graphical and image features, respectively. After flattening the extracted embeddings from the convolution layers, they are fed into the fully connected layer. Then, we have the concatenation and classification parts, accordingly, which are the same as the previous proposed models.
4 Experiment
In this section, the applied datasets for the proposed methods are discribed. Then, the parameter settings are explained. Finally, the metrics used to evaluate the proposed algorithms are defined.
4.1 Dataset
The different proposed methods are evaluated on two different datasets Sharma and CD18. In the following paragraphs, these datasets are introduced:
Sharma:
Sharma Sharma is a dataset of cellphone crawled from GSMArena111www.gsmarena.com in 2018. The dataset consists of row cellphone data with non-graphical features. In this dataset all features are numerical and the prices fall into four categories defined as phones’ labels.
CD18:
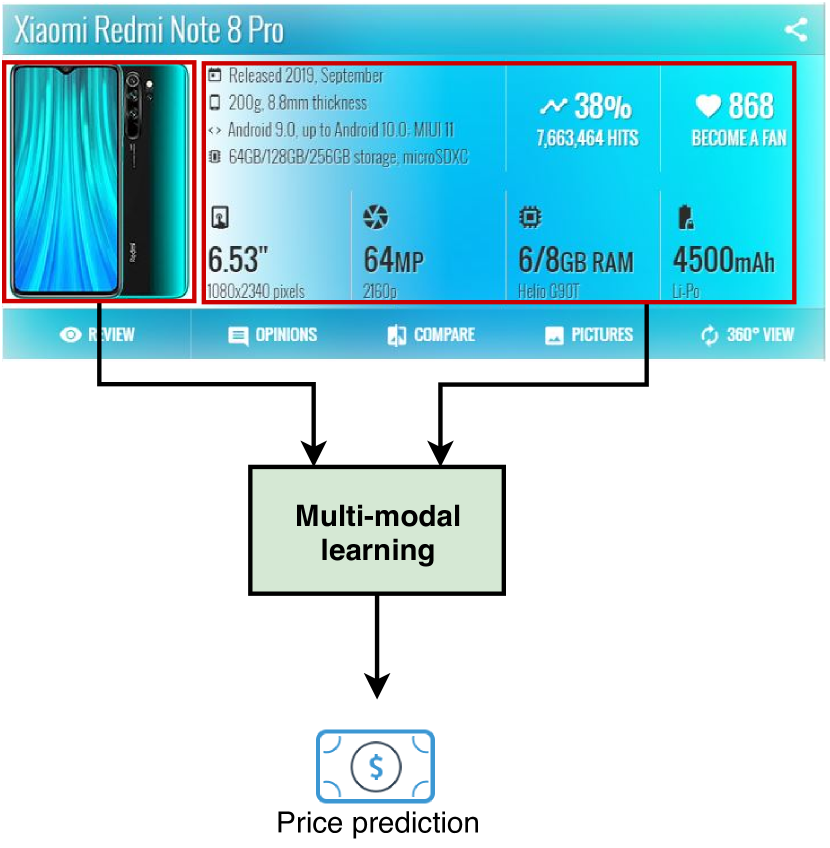
GSMArena is a specialized and reputable website that provides cellphones’ specifications. On this website, each cellphone has a page that consists of its specifications. Sharma dataset contains non-graphical information about cellphones. Since, in this study four multimodal approaches have been proposed that need both non-graphical and image information related to the cellphones, it is attempted to collect a dataset called CD18222Cellphone Dataset with 18 Features from GSMArena to satisfy the need for multimodal dataset. As a mobile phone device has many non-graphical features that are not necessary most of the time, feature selection considers one essential part of the proposed data-dependent project. To reduce the number of cellphone features to those that are trusted to be most helpful for the proposed models, the features that are offered by GSMArena on the top of each cellphone page, have been selected. Figure 1 shows those features on the top of each mobile page. The gathered dataset is made up of the features of this figure. The selected features are listed as below:
-
1.
Brand
-
2.
Model
-
3.
Release Date
-
4.
Weight
-
5.
Operation System
-
6.
Storage
-
7.
Hit
-
8.
Hit Count
-
9.
Display Size
-
10.
Display Resolution
-
11.
Camera
-
12.
Video
-
13.
Processor
-
14.
Ram
-
15.
Battery
-
16.
Battery Type
-
17.
Picture
-
18.
Price (Euro)
The gathered data are raw and should be normalized before any utilization. In this regard, changes have been listed as below:
-
•
Weight: Non-numerical characters such as ”gr” have been deleted, and the values of this column are used as a numerical feature.
-
•
OS: There are too many customized models or names for this feature. To reduce overplus states, this feature has been configured to consist of models.
-
•
Display size: Display size quotes as . In this form, the feature should be processed as categorical. To obtain a numerical representation from this feature, this column has been broken into two columns called ”V_resolution” and ”H_resolution” that show the vertical and horizontal pixels, accordingly.
-
•
Video: Video’s resolution is represented with term ”p” as the abbreviation of pixel which is an integer value. To make this feature a numerical one, the term ”p” is deleted.
-
•
Processor: There are a lot of models of cellphone processor’s chipset and this makes too many possibilities for the system as a category feature. Thus, only the brands of processors and types of these processors have been selected.
-
•
Ram: For this feature, all values must be on the same unit, so they have been converted to Mb (MegaByte).
-
•
Hit & Hit Count: These two features do not affect price prediction but only they maybe show the users perspective. So these were not used as non-graphical feature.
Moreover, since the price prediction has been considered as a classification task, it is needed to determine the classes of this task. Furthermore, the eligible classes have been created by classifying the cellphone prices into four groups. These groups are estimated by thresholding prices as below:
-
•
0:
-
•
1: &
-
•
2: &
-
•
3:
At the end, the collected dataset contains records with non-graphical features besides the cellphones’ images.
4.2 Parameter settings
All tests were run via python on a Core i7-5600U 2.6 GHz processor with 12 GB of RAM and Nvidia 840M graphic processor. The learning rate and batch size have been set to 0.001 and 32, respectively. Also, the optimizer has been optimized with the RMSProp optimizer for all five models. Furthermore, the fully connected classifier consists of three layers that the first and second layers include Relu activation function with 300 and 120 neurons, respectively. Also, L1 regularization was set to . Finally, the last layer is softmax function that produces four different classes.
4.3 Evaluation Metrics
To assess the quality of the proposed methods on the price prediction task, precision, recall, accuracy, and F1-measure are used as the metrics. The reason for deploying these metrics is treating the price prediction as a classification problem. These metrics are defined as follows:
Precision attempts to show what fraction of the retrieved instances is actually correct. While, recall defines what fraction of factual positives is recognized accurately. Equations 1 and 2 show how these two metrics are calculated.
| (1) |
| (2) |
here TP, FP, FN and TN show True Positives, False Positives, False Negatives and True Negatives, respectively.
There are other metrics that rely on both precision and recall such as F1-measure. F1-measure is the harmonic mean of the precision and recall. This metric is defined as Eq. 3.
| (3) |
Accuracy informally is the fraction of predictions of the proposed model. this metric is calculated based on Eq. 4.
| (4) |
5 Results
In this section, the proposed approaches are evaluated and compared with three approaches Nasser et al. Nasser and Al-Shawwa (2019), Subhiksha et al. Subhiksha et al. (2020) and Asim et al. Asim and Khan (2018) that are unimodal and described in section 2. Tables 1 and 2 report the obtained results.
Table 1 presents the evaluation of different unimodal methods on two datasets CD18 and Sharma. Just non-graphical features of CD18 have been employed for making a comparison of the proposed unimodal approach with others. It can also be concluded that the proposed unimodal method achieved the best results on both datasets over different metrics. Also, the proposed unimodal approach is the winner of the competition against others in terms of accuracy metric.
Table 2 illustrates the evaluation of the proposed multimodal methods on CD18 dataset using different classifiers. To assess the multimodal methods, six various classifiers consisting SVM Shi et al. (2011), Logistic Regression, Decision Tree, KNN, and fully connected neural network have been deployed. It can be seen that the classifier constructed based on the deep neural network achieved the best values in each metric, but not in very high deference with compared to other classifiers. Multimodal approaches increase the value of F1-measure and accuracy more than . Although, using different classifiers have direct effects on the quality of the prediction, it can be seen that in the most cases the concatenation of non-graphical and graphical features (multimodal approach) performs better and makes predictions more accurate than unimodal. The other deduction from the evaluations is that convolution networks can detect features from images of cellphones better than Inception-V3, because cellphones’ schema is too close and Inception-V3 is trained to appear different types of objects. In conclusion, due to the results, it can be asserted that images of products are impressive in predicting price along with other features and the multimodal approaches make predictions more authentic.
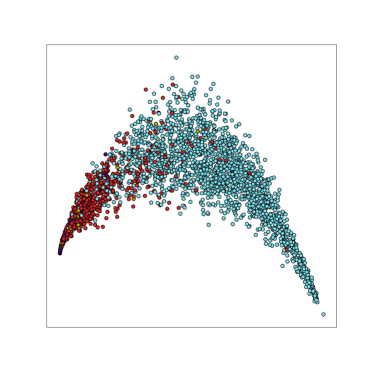
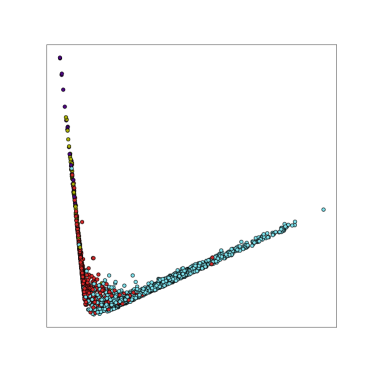
Each cellphone has been presented by a low-dimensional vector that allows us to visualize cellphones to understand their price ranges. Visualizations of the second and fourth proposed models are shown in Figure 8. Since the underlying community is known, the community label is used to color the cellphone. It can be observed that embeddings generated by the fourth proposed multimodal approach can separate the communities of mobiles based on their predicted prices better than the second model.
| Dataset | ||||||||
| Method | Sharma Sharma | Unimodal dataset of CD18 | ||||||
| Precision | Recall | Accuracy | F-measure | Precision | Recall | Accuracy | F-measure | |
| Proposed Method 1 | 83.0 | 83.0 | 82.9 | 82.5 | 88.0 | 85.5 | 85.5 | 86.1 |
| Nasser et al. Nasser and Al-Shawwa (2019) | 47.5 | 25.4 | 25.6 | 33.1 | 45.8 | 67.6 | 67.7 | 54.6 |
| Subhiksha et al. Subhiksha et al. (2020) | 81.0 | |||||||
| Asim et al. Asim and Khan (2018) | 78.0 | |||||||
| Method | Logistic Regression | KNN | Decision Tree | |||||||||
|---|---|---|---|---|---|---|---|---|---|---|---|---|
|
Precision |
Recall |
Accuracy |
F-measure |
Precision |
Recall |
Accuracy |
F-measure |
Precision |
Recall |
Accuracy |
F-measure |
|
| Proposed Method 2 | 83.6 | 81.7 | 87.5 | 82.3 | 89.3 | 88.0 | 87.7 | 88.2 | 83.4 | 83.0 | 87.5 | 83.2 |
| Proposed Method 3 | 88.3 | 87.4 | 87.4 | 87.6 | 84.7 | 84.2 | 84.3 | 84.4 | 83.4 | 81.8 | 81.8 | 82.1 |
| Proposed Method 4 | 80.3 | 79.9 | 79.8 | 79.8 | 81.0 | 73.6 | 73.6 | 76.8 | 71.3 | 69.8 | 69.8 | 70.5 |
| Proposed Method 5 | 85.2 | 82.3 | 82.4 | 83.8 | 82.1 | 79.9 | 79.8 | 81.0 | 74.9 | 74.2 | 74.2 | 74.5 |
| Method | SVM | Gradient Boosting | Fully connected | |||||||||
|---|---|---|---|---|---|---|---|---|---|---|---|---|
|
Precision |
Recall |
Accuracy |
F-measure |
Precision |
Recall |
Accuracy |
F-measure |
Precision |
Recall |
Accuracy |
F-measure |
|
| Proposed Method 2 | 88.1 | 86.8 | 87.9 | 87.3 | 85.6 | 84.9 | 87.9 | 85.2 | 89.4 | 86.8 | 86.8 | 87.8 |
| Proposed Method 3 | 89.1 | 87.9 | 88.0 | 88.3 | 87.2 | 84.9 | 84.9 | 85.9 | 89.1 | 88.0 | 88.0 | 88.3 |
| Proposed Method 4 | 83.9 | 81.1 | 81.2 | 82.4 | 73.0 | 71.7 | 71.7 | 72.2 | 83.7 | 83.0 | 83.0 | 82.9 |
| Proposed Method 5 | 85.2 | 82.4 | 82.3 | 83.7 | 81.2 | 79.8 | 79.8 | 80.5 | 88.1 | 83.0 | 83.0 | 85.3 |
6 Conclusion
Proposing a multimodal price prediction system is the primary goal of this paper. The first step of this study was to gather an appropriate dataset, called CD18, that consists of both graphical and non-graphical features of cellphones with their prices. To achieve this goal, information related to the cellphones including their specifications and pictures were collected from GSMArena. After that, five methods were proposed that one of them is unimodal and the rest of them are multimodal approaches. The multimodal methods were created by Inception-V3 and convolutional neural networks that are applied to the graphical, and both graphical and non-graphical features, respectively. Then, there are two parts including the joint part that combines graphical and non-graphical features, and the classification part that has a dense neural network. The evaluation of the proposed methods was done on two different datasets Sharma and CD18. The results show that the proposed methods give better performance in comparison with the other available researches.
Declarations
Funding
The authors did not receive support from any organization for the submitted work.
Conflict of interest
The authors declare that they have no conflict of interest.
References
- Tien [2017] James M. Tien. Internet of Things, Real-Time Decision Making, and Artificial Intelligence. Annals of Data Science, 4(2):149–178, jun 2017. ISSN 21985812. doi: 10.1007/s40745-017-0112-5. URL https://link.springer.com/article/10.1007/s40745-017-0112-5.
- Olson and Shi [2007] David Louis Olson and Yong Shi. Introduction to Business Data Mining. McGraw-Hill/Irwin series operations and decision sciences. McGraw Hill, 2007. ISBN 9780071244701. URL https://books.google.no/books?id=m_j4AAAACAAJ.
- Sohrabi et al. [2012] Babak Sohrabi, Payam Mahmoudian, and Iman Raeesi. A framework for improving e-commerce websites usability using a hybrid genetic algorithm and neural network system. Neural Computing and Applications, 21(5):1017–1029, 2012.
- Jian et al. [2013] Liheng Jian, Cheng Wang, Ying Liu, Shenshen Liang, Weidong Yi, and Yong Shi. Parallel data mining techniques on graphics processing unit with compute unified device architecture (cuda). The Journal of Supercomputing, 64(3):942–967, 2013.
- Hiransha et al. [2018] M. Hiransha, E. A. Gopalakrishnan, Vijay Krishna Menon, and K. P. Soman. NSE Stock Market Prediction Using Deep-Learning Models. In Procedia Computer Science, 2018. doi: 10.1016/j.procs.2018.05.050.
- Parmar et al. [2018] Ishita Parmar, Navanshu Agarwal, Sheirsh Saxena, Ridam Arora, Shikhin Gupta, Himanshu Dhiman, and Lokesh Chouhan. Stock market prediction using machine learning. In ICSCCC 2018 - 1st International Conference on Secure Cyber Computing and Communications, pages 574–576, 2018. ISBN 9781538663738. doi: 10.1109/ICSCCC.2018.8703332.
- Teixeira Zavadzki de Pauli et al. [2020] Suellen Teixeira Zavadzki de Pauli, Mariana Kleina, and Wagner Hugo Bonat. Comparing Artificial Neural Network Architectures for Brazilian Stock Market Prediction. Annals of Data Science, 7(4):613–628, dec 2020. ISSN 21985812. doi: 10.1007/s40745-020-00305-w. URL https://doi.org/10.1007/s40745-020-00305-w.
- Singh and Srivastava [2017] Ritika Singh and Shashi Srivastava. Stock prediction using deep learning. Multimedia Tools and Applications, 2017. ISSN 15737721. doi: 10.1007/s11042-016-4159-7.
- Karimuzzaman et al. [2021] Md. Karimuzzaman, Nusrat Islam, Sabrina Afroz, and Md. Moyazzem Hossain. Predicting Stock Market Price of Bangladesh: A Comparative Study of Linear Classification Models. Annals of Data Science, pages 1–18, jan 2021. ISSN 2198-5804. doi: 10.1007/s40745-020-00318-5. URL http://link.springer.com/10.1007/s40745-020-00318-5.
- SenGupta et al. [2021] Indranil SenGupta, William Nganje, and Erik Hanson. Refinements of Barndorff-Nielsen and Shephard Model: An Analysis of Crude Oil Price with Machine Learning. Annals of Data Science, 8(1):39–55, mar 2021. ISSN 21985812. doi: 10.1007/s40745-020-00256-2. URL https://link.springer.com/article/10.1007/s40745-020-00256-2.
- Vilar et al. [2018] Juan Vilar, Germán Aneiros, and Paula Raña. Prediction intervals for electricity demand and price using functional data. International Journal of Electrical Power and Energy Systems, 2018. ISSN 01420615. doi: 10.1016/j.ijepes.2017.10.010.
- Abdella et al. [2019] Juhar Ahmed Abdella, Nazar Zaki, Khaled Shuaib, and Fahad Khan. Airline ticket price and demand prediction: A survey, feb 2019. ISSN 22131248.
- Lantseva et al. [2015] Anastasia Lantseva, Ksenia Mukhina, Anna Nikishova, Sergey Ivanov, and Konstantin Knyazkov. Data-driven modeling of airlines pricing. In Procedia Computer Science, volume 66, pages 267–276. Elsevier B.V., jan 2015. doi: 10.1016/j.procs.2015.11.032.
- Azari [2019] Amin Azari. Bitcoin price prediction: An arima approach. apr 2019. URL http://arxiv.org/abs/1904.05315.
- Kadiroglu et al. [2019] Zehra Kadiroglu, Beyza Nur Akilotu, and Abdulkadir Sengur. Mechanism of bitcoin and investigation of the studies in the literature related to bitcoin. In 1st International Informatics and Software Engineering Conference: Innovative Technologies for Digital Transformation, IISEC 2019 - Proceedings. Institute of Electrical and Electronics Engineers Inc., nov 2019. ISBN 9781728139920. doi: 10.1109/UBMYK48245.2019.8965449.
- Phaladisailoed and Numnonda [2018] Thearasak Phaladisailoed and Thanisa Numnonda. Machine learning models comparison for bitcoin price prediction. In Proceedings of 2018 10th International Conference on Information Technology and Electrical Engineering: Smart Technology for Better Society, ICITEE 2018, pages 506–511. Institute of Electrical and Electronics Engineers Inc., nov 2018. ISBN 9781538647394. doi: 10.1109/ICITEED.2018.8534911.
- Lahmiri and Bekiros [2019] Salim Lahmiri and Stelios Bekiros. Cryptocurrency forecasting with deep learning chaotic neural networks. Chaos, Solitons and Fractals, 118:35–40, jan 2019. ISSN 09600779. doi: 10.1016/j.chaos.2018.11.014.
- Ji et al. [2019] Suhwan Ji, Jongmin Kim, and Hyeonseung Im. A comparative study of bitcoin price prediction using deep learning. Mathematics, 2019. ISSN 22277390. doi: 10.3390/math7100898.
- Park and Bae [2015] Byeonghwa Park and Jae Kwon Bae. Using machine learning algorithms for housing price prediction: The case of fairfax county, virginia housing data. Expert Systems with Applications, 42(6):2928–2934, 2015.
- Chandrashekhara et al. [2019] K. T. Chandrashekhara, M. Thungamani, C. N. Gireesh Babu, and T. N. Manjunath. Smartphone price prediction in retail industry using machine learning techniques. In Lecture Notes in Electrical Engineering, 2019. ISBN 9789811358012. doi: 10.1007/978-981-13-5802-9˙34.
- Nasser and Al-Shawwa [2019] Ibrahim M Nasser and Mohammed Al-Shawwa. Ann for predicting mobile phone price range. Technical report, 2019.
- Asim and Khan [2018] Muhammad Asim and Zafar Khan. Mobile price class prediction using machine learning techniques. International Journal of Computer Applications, 179(29):6–11, 2018. doi: 10.5120/ijca2018916555.
- Asgari-Chenaghlu et al. [2020] Meysam Asgari-Chenaghlu, M. Reza Feizi-Derakhshi, Leili Farzinvash, M. A. Balafar, and Cina Motamed. A multimodal deep learning approach for named entity recognition from social media, 2020.
- Nikzad-Khasmakhi et al. [2020] N. Nikzad-Khasmakhi, M. A. Balafar, M. Reza Feizi-Derakhshi, and Cina Motamed. Berters: Multimodal representation learning for expert recommendation system with transformer, 2020.
- Minaee et al. [2020] Shervin Minaee, Nal Kalchbrenner, Erik Cambria, Narjes Nikzad, Meysam Chenaghlu, and Jianfeng Gao. Deep learning based text classification: A comprehensive review, 2020.
- VasfiSisi and Feizi Derakhshi [2013] Nasim VasfiSisi and Mohammad Reza Feizi Derakhshi. Text classification with machine learning algorithms. Journal of Basic and Applied Scientific Research, 3(1):31–35, 2013.
- [27] Abhishek Sharma. Mobile price classification — kaggle. URL https://www.kaggle.com/iabhishekofficial/mobile-price-classification.
- Subhiksha et al. [2020] S. Subhiksha, Swathi Thota, and J. Sangeetha. Prediction of phone prices using machine learning techniques. In Advances in Intelligent Systems and Computing, volume 1079, pages 781–789. Springer, 2020. ISBN 9789811510960. doi: 10.1007/978-981-15-1097-7˙65.
- Pipalia and Bhadja [2020] Keval Pipalia and Rahul Bhadja. Performance Evaluation of Different Supervised Learning Algorithms for Mobile Price Classification. 8, 2020. ISSN 2321-9653. doi: 10.22214/ijraset.2020.6302. URL www.ijraset.com.
- LeCun et al. [1989] Y. LeCun, B. Boser, J. S. Denker, D. Henderson, R. E. Howard, W. Hubbard, and L. D. Jackel. Backpropagation applied to handwritten zip code recognition. Neural Computation, 1(4):541–551, dec 1989. ISSN 0899-7667. doi: 10.1162/neco.1989.1.4.541.
- LeCun et al. [1998] Yann LeCun, Léon Bottou, Yoshua Bengio, and Patrick Haffner. Gradient-based learning applied to document recognition. Proceedings of the IEEE, 86(11):2278–2323, 1998. ISSN 00189219. doi: 10.1109/5.726791.
- Krizhevsky et al. [2017] Alex Krizhevsky, Ilya Sutskever, and Geoffrey E. Hinton. Imagenet classification with deep convolutional neural networks. Communications of the ACM, 60(6):84–90, jun 2017. ISSN 15577317. doi: 10.1145/3065386. URL https://dl.acm.org/doi/10.1145/3065386.
- Szegedy et al. [2015] Christian Szegedy, Wei Liu, Yangqing Jia, Pierre Sermanet, Scott Reed, Dragomir Anguelov, Dumitru Erhan, Vincent Vanhoucke, and Andrew Rabinovich. Going deeper with convolutions. In Proceedings of the IEEE Computer Society Conference on Computer Vision and Pattern Recognition, volume 07-12-June-2015, pages 1–9. IEEE Computer Society, oct 2015. ISBN 9781467369640. doi: 10.1109/CVPR.2015.7298594.
- Szegedy et al. [2016] Christian Szegedy, Vincent Vanhoucke, Sergey Ioffe, Jon Shlens, and Zbigniew Wojna. Rethinking the inception architecture for computer vision. In Proceedings of the IEEE Computer Society Conference on Computer Vision and Pattern Recognition, volume 2016-December, pages 2818–2826. IEEE Computer Society, dec 2016. ISBN 9781467388504. doi: 10.1109/CVPR.2016.308.
- Szegedy et al. [2017] Christian Szegedy, Sergey Ioffe, Vincent Vanhoucke, and Alexander A. Alemi. Inception-v4, inception-resnet and the impact of residual connections on learning. In 31st AAAI Conference on Artificial Intelligence, AAAI 2017, pages 4278–4284. AAAI press, feb 2017.
- [36] Review: Inception-v3 — 1st runner up (image classification) in ilsvrc 2015. URL https://medium.com/@sh.tsang/review-inception-v3-1st-runner-up-image-classification-in-ilsvrc-2015-17915421f77c.
- Shi et al. [2011] Yong Shi, Yingjie Tian, Gang Kou, Yi Peng, and Jianping Li. Support vector machines for multi-class classification problems. In Optimization Based Data Mining: Theory and Applications, number 9780857295033, pages 47–60. Springer London, 2011. doi: 10.1007/978-0-85729-504-0˙3.