Entropy and electronic orders of the three-orbital Hubbard model with antiferromagnetic Hund coupling
Abstract
An antiferromagnetic Hund coupling in multiorbital Hubbard systems induces orbital freezing and an associated superconducting instability, as well as unique composite orders in the case of an odd number of orbitals. While the rich phase diagram of the half-filled three-orbital model has recently been explored in detail, the properties of the doped system remain to be clarified. Here, we complement the previous studies by computing the entropy of the half-filled model, which exhibits an increase in the orbital-frozen region, and a suppression in the composite ordered phase. The doping dependent phase diagram shows that the composite ordered state can be stabilized in the doped Mott regime, if conventional electronic orders are suppressed by frustration. While antiferro orbital order dominates the filling range , and ferro orbital order the strongly interacting region for , we find superconductivity with a remarkably high around (quarter filling). Also in the doped system, there is a close connection between the orbital freezing crossover and superconductivity.
I Introduction
The ferromagnetic Hund coupling in conventional multi-orbital Hubbard models leads to spin-freezing and bad metal behavior in a wide filling, interaction, and temperature range Werner et al. (2008); de’ Medici et al. (2011). This physics is crucial for understanding the normal-state properties of an interesting class of correlated materials, the so-called Hund metals Haule and Kotliar (2009); Yin et al. (2011); Georges et al. (2013), and it is closely linked to unconventional superconductivity Hoshino and Werner (2015); Werner et al. (2016). Related phenomena appear in multi-orbital Hubbard models with negative (antiferromagnetic) Hund coupling Fabrizio and Tosatti (1997); Nomura et al. (2015); Steiner et al. (2016), where the physics turns out to be even more complex because of the appearance of odd-frequency orbital orders Hoshino and Werner (2017). Particularly interesting is the case of the three-orbital Hubbard model with antiferromagnetic Hund coupling, which is relevant for the description of fulleride compounds Gunnarsson (1997); Capone et al. (2002); Gunnarsson (2004); Capone et al. (2009); Nomura et al. (2012). Several recent studies Hoshino and Werner (2017); Ishigaki et al. (2018, 2019) have considered the half-filled case and revealed (i) a connection between the unconventional -wave superconductivity and an orbital-freezing phenomenon, (ii) the existence of spontaneous orbital selective Mott (SOSM) phases, which can be interpreted as odd-frequency orbital orderings, in the vicinity of the Mott transition, (iii) the existence of a spontaneous orbital selective superconducting phase, and (iv) various types of staggered or uniform orbital and magnetic orders. These results provide a general understanding of the phase diagram of alkali-doped fullerides (K3C60), with three electrons in three molecular orbitals, including the recently reported Jahn-Teller metal phase Zadik et al. (2015), which can be identified with the SOSM phase Hoshino and Werner (2017).
Last year, the first single crystals (thin films) of fulleride compounds were grown epitaxially, and this experimental technique allows to control the filling over a wide range via doping Ren et al. (2020); Han et al. (2020). It is thus interesting to extend the theoretical studies of the three-orbital Hubbard model with negative Hund coupling to the doped regime. While a previous work has reported some results for a doped realistic model of fulleride superconductors Misawa and Imada (2017), we currently lack a complete picture of how the doping affects the orbital freezing, superconductivity, SOSM states and other electronically ordered phases.
In this paper, we try to fill this gap by presenting a systematic study of the crossovers and phase transitions in the half-filled and doped three-orbital Hubbard model with degenerate bands. After introducing the model in Sec. II we start by revisiting the half-filled phase diagram and discuss in Sec. III.1 the effect of the orbital-freezing crossover, SOSM and Mott transitions on the entropy. We then turn our attention to electronic orders and show in Secs. III.2 and III.3 how the orbital-ordered, charge-ordered and (metastable) SOSM phases depend on the filling. In Sec. III.4, we clarify the connection between superconductivity and orbital freezing in the doped system. Section IV contains a summary and conclusions.
II Model and Method
We use dynamical mean field theory (DMFT) Müller-Hartmann (1989a, b); Metzner and Vollhardt (1989); Georges et al. (1996); Kotliar et al. (2006) to simulate the three-orbital Hubbard model on an infinitely connected Bethe lattice. This method provides a qualitatively correct description of three-dimensional materials, such as fulleride compounds. We consider a local Hamiltonian of the form , where denotes the orbitals, the spin, the intra-orbital repulsion, the interorbital same-spin repulsion, and the Hund coupling. We set and , to be consistent with the parameters used in the previous studies of electronic orderings Hoshino and Werner (2017); Ishigaki et al. (2018, 2019). The density-density approximation enables an efficient solution of the DMFT equations Werner et al. (2006); Gull et al. (2011), and hence allows us to systematically compute the entropy of the model, as well as lattice susceptibilities, which require the measurement of four-point correlation functions Hoshino and Werner (2015).
The infinitely connected Bethe lattice has a semi-circular density of states of bandwidth (with a properly rescaled hopping), and in this study, we will use as the unit of energy. Magnetic order is suppressed by imposing the symmetry for the Green’s functions, and we will search for solutions which satisfy (while the Green’s function for orbital can be different). This is consistent with the symmetry breaking to the SOSM phase Hoshino and Werner (2017) and with various types of orbital and charge order. The entropy per site is calculated with the procedure detailed in Ref. Yue and Werner (2017), by first computing the total energy per site of the system on a fine temperature grid and evaluating the specific heat . Using the exactly known infinite-temperature result as a reference, we then compute . From the total energy and entropy we also obtain the free energy , which is useful for discussing the stability of different phases in a coexistence region Werner and Millis (2007); Haule and Birol (2015).
Conventional electronic orders such as charge order (CDW), antiferro orbital order (AFO), ferro orbital order (FO) or superconductivity (SC), can be studied in two complementary ways. The first strategy, which will be used in Secs. III.2 and III.3 for the study of charge and orbital orders, is to break the symmetry explicitly in the DMFT calculation Chan et al. (2009). An advantage of this approach is that it allows to discuss the stability regions of competing ordered phases. The second strategy, which will be used in Sec. III.4, is to compute lattice susceptibilities for the different orders using the local vertex from the DMFT solution in a Bethe-Salpeter equation, and to search for divergences in these susceptibilities Hoshino and Werner (2015, 2017). This approach allows to extract information on the tendencies towards different electronic orders from a single simulation.
III Results
III.1 Entropy of the half-filled model with suppressed electronic orders
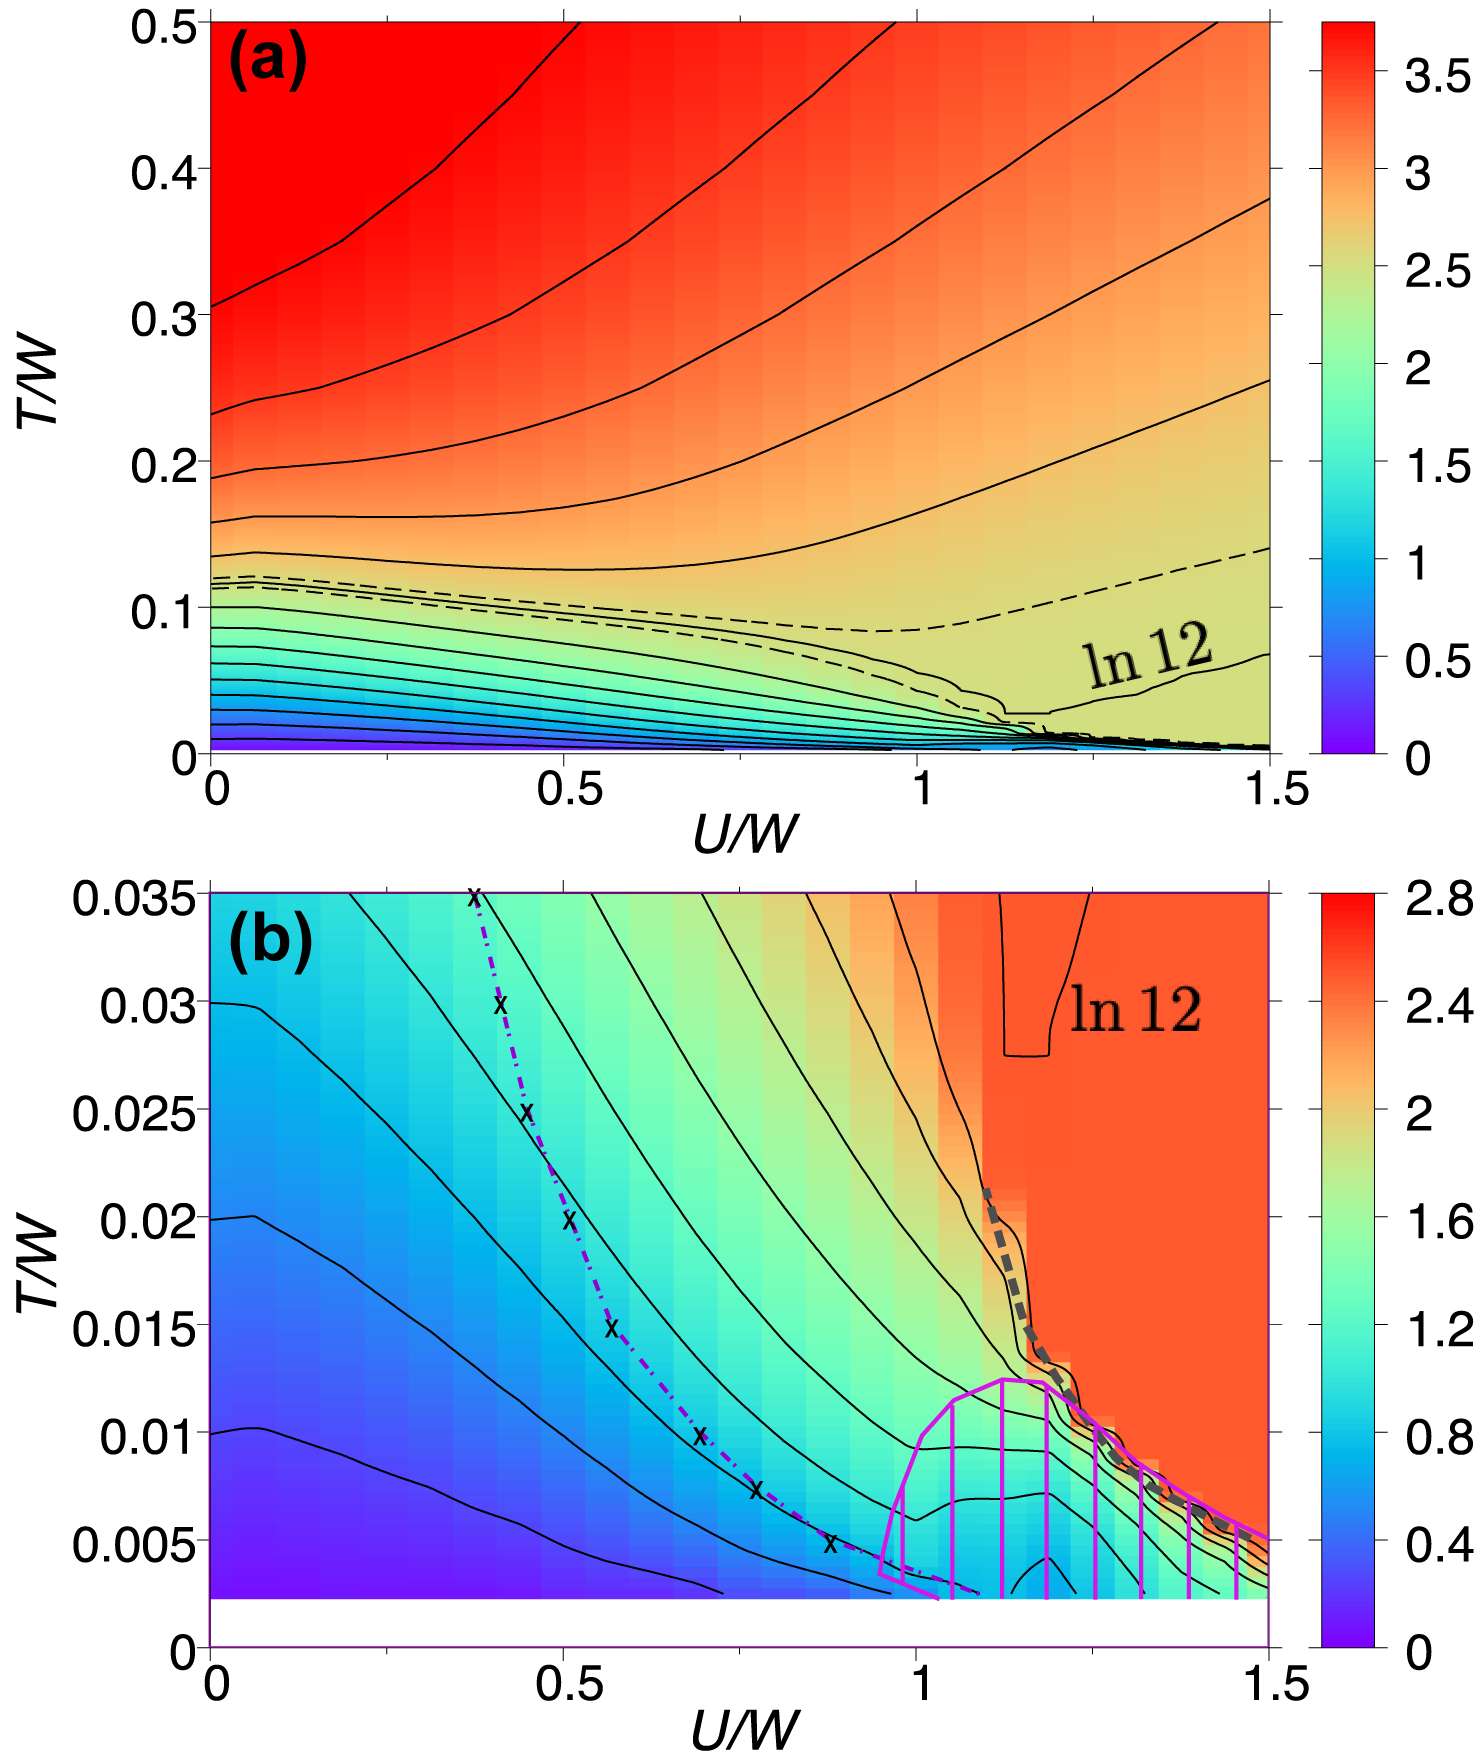
We start by discussing the entropy per site of the half-filled model with suppressed antiferro-type orders by assuming, e. g., the presence of geometrical frustration as in fcc lattices. Figure 1 plots the contour lines of the entropy in the interaction-temperature plane, with the top panel showing a wide temperature range, and the lower panel a zoom of the low-temperature region, with the SOSM solutions indicated by the pink hashing. In the SOSM phase the equivalence between the three orbitals is spontaneously broken 111While Ref. Ishigaki et al. (2019) reported two different types of SOSM phases, we will consider here only the phase with orbitals 1 and 2 in a paired Mott state, and the third orbital metallic.. Also indicated as a gray dashed line is the Mott transition line which terminates at . We see that reaches approximately in the Mott phase, which is explained by the dominant configurations with one doubly occupied orbital, one empty orbital and one singly occupied orbital with spin up or down. The entropy plateau extends beyond the end point of the Mott transition line into the metal-insulator crossover region. Clearly separated from the Mott phase is the orbital-freezing crossover line (dashed line with crosses in the lower panel), which we define as the maximum in the dynamical contribution to the local orbital susceptibility,
| (1) |
where , and is the -th Gell-Mann matrix Hoshino and Werner (2017). This crossover line, which separates the Fermi liquid metal on the weak- side from an “orbital frozen” metal on the large- side, has been shown in Ref. Hoshino and Werner, 2017 to correlate with the peak in the superconducting dome. We find that this line very roughly corresponds to the entropy contour for at low temperatures. While the entropy in the orbital frozen metal is enhanced, the crossover is very broad. The transition into the SOSM phase is associated with a reduction in the entropy, compared to the orbital frozen metal. At low temperatures, the SOSM state exhibits an entropy per site, because there are two ways of distributing a doublon and a hole among the two paired Mott insulating orbitals. With increasing temperature, the entropy of the SOSM state increases, because of the metallic orbital , and also because the gap in the “paired Mott” orbitals 1 and 2 starts to fill in; however, it increases less rapidly than in the orbital-frozen metal phase.
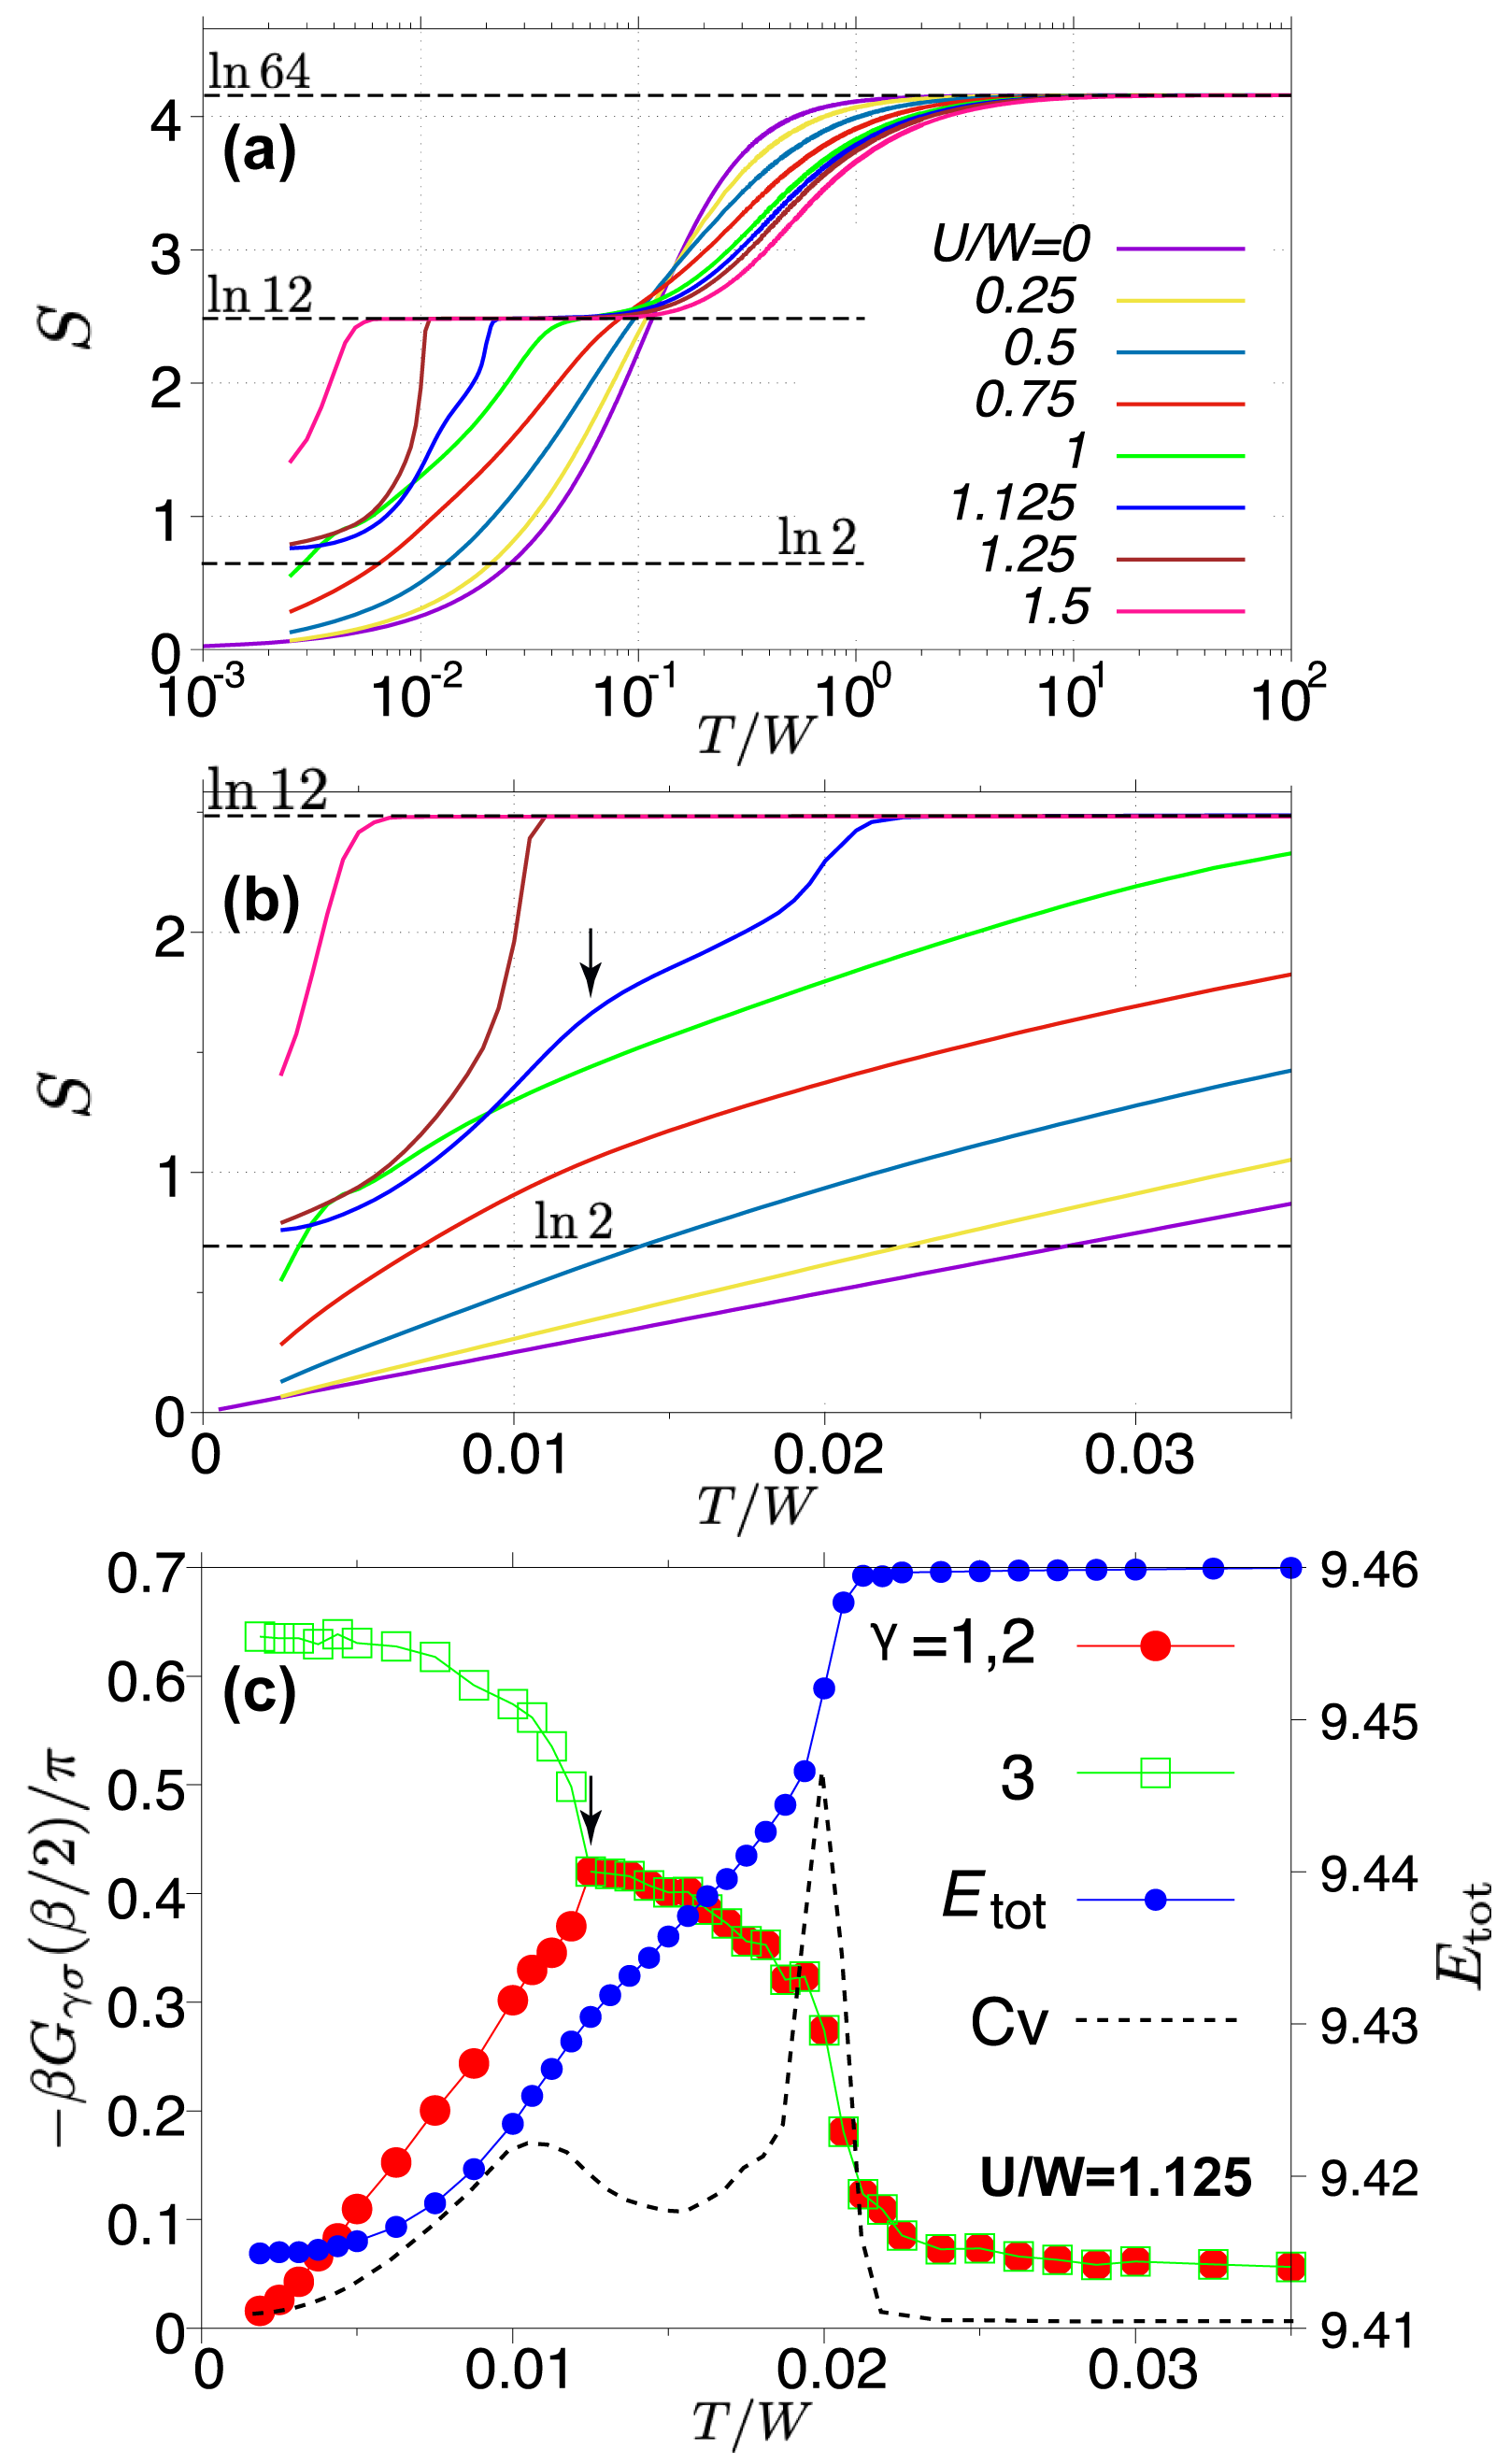
For a more detailed analysis, we show in Fig. 2 curves for fixed interactions. In panel (a), the results are plotted on a logarithmic scale, to illustrate how the value of the entropy is reached at very high temperatures in all cases, and how the entropy plateau with appears in and near the Mott phase. Panel (b) shows a zoom of the low-temperature region on a linear scale. Here, one can see that while the entropy in the metallic region goes to zero linearly as , it is enhanced (with values larger than ) in the orbital-frozen regime. On the other hand, in the SOSM phase, it approaches . The curve for , which is on the metallic side of the Mott transition, exhibits several crossovers and a phase transition. As temperature is lowered below , there is a crossover from a bad metal state with suppressed quasi-particle peak and to a more coherent strongly correlated metal, and then, around (black arrow) the transition into the SOSM phase, with a subsequent decrease of the entropy to . The corresponding specific heat is plotted in panel (c), where we also show the quantity as a rough estimate of the density of states (DOS) near Gull et al. (2008). Note that here all the orbitals are half-filled (no conventional orbital order) but the DOS can detect the broken orbital symmetry, reflecting a peculiarity of this ordered phase. While the DOS is suppressed in orbitals 1 and 2, compared to orbital 3, the Mott insulating nature is evident only at low temperatures. Near , the SOSM state is in fact a metallic state with a spontaneous symmetry breaking into two “bad metallic” and one “good metallic” orbital.
At , the system just barely crosses into the SOSM phase as decreases. It undergoes crossovers and transitions from bad metal to good metal, to SOSM, and (below ) makes a transition to the low-temperature Fermi liquid. As shown in the Appendix (Fig. A.1(a)), there are three peaks in associated with these transitions or crossovers. The first two peaks are broad and overlap with each other. The peak associated with the transition from SOSM phase to the good metal below is very sharp (in reality a delta function, if the transition is first order), and responsible for the decrease of the entropy below , as shown by the green line in Fig. 2(a-b). The results for , on the Mott insulating side, are shown in Fig. A.1(b), where the peak associated with the transition into the SOSM phase also exhibits a delta-function like contribution, but extends to low temperatures due to the strongly correlated nature of the metallic orbital.
III.2 Electronic orders in the doped Mott regime
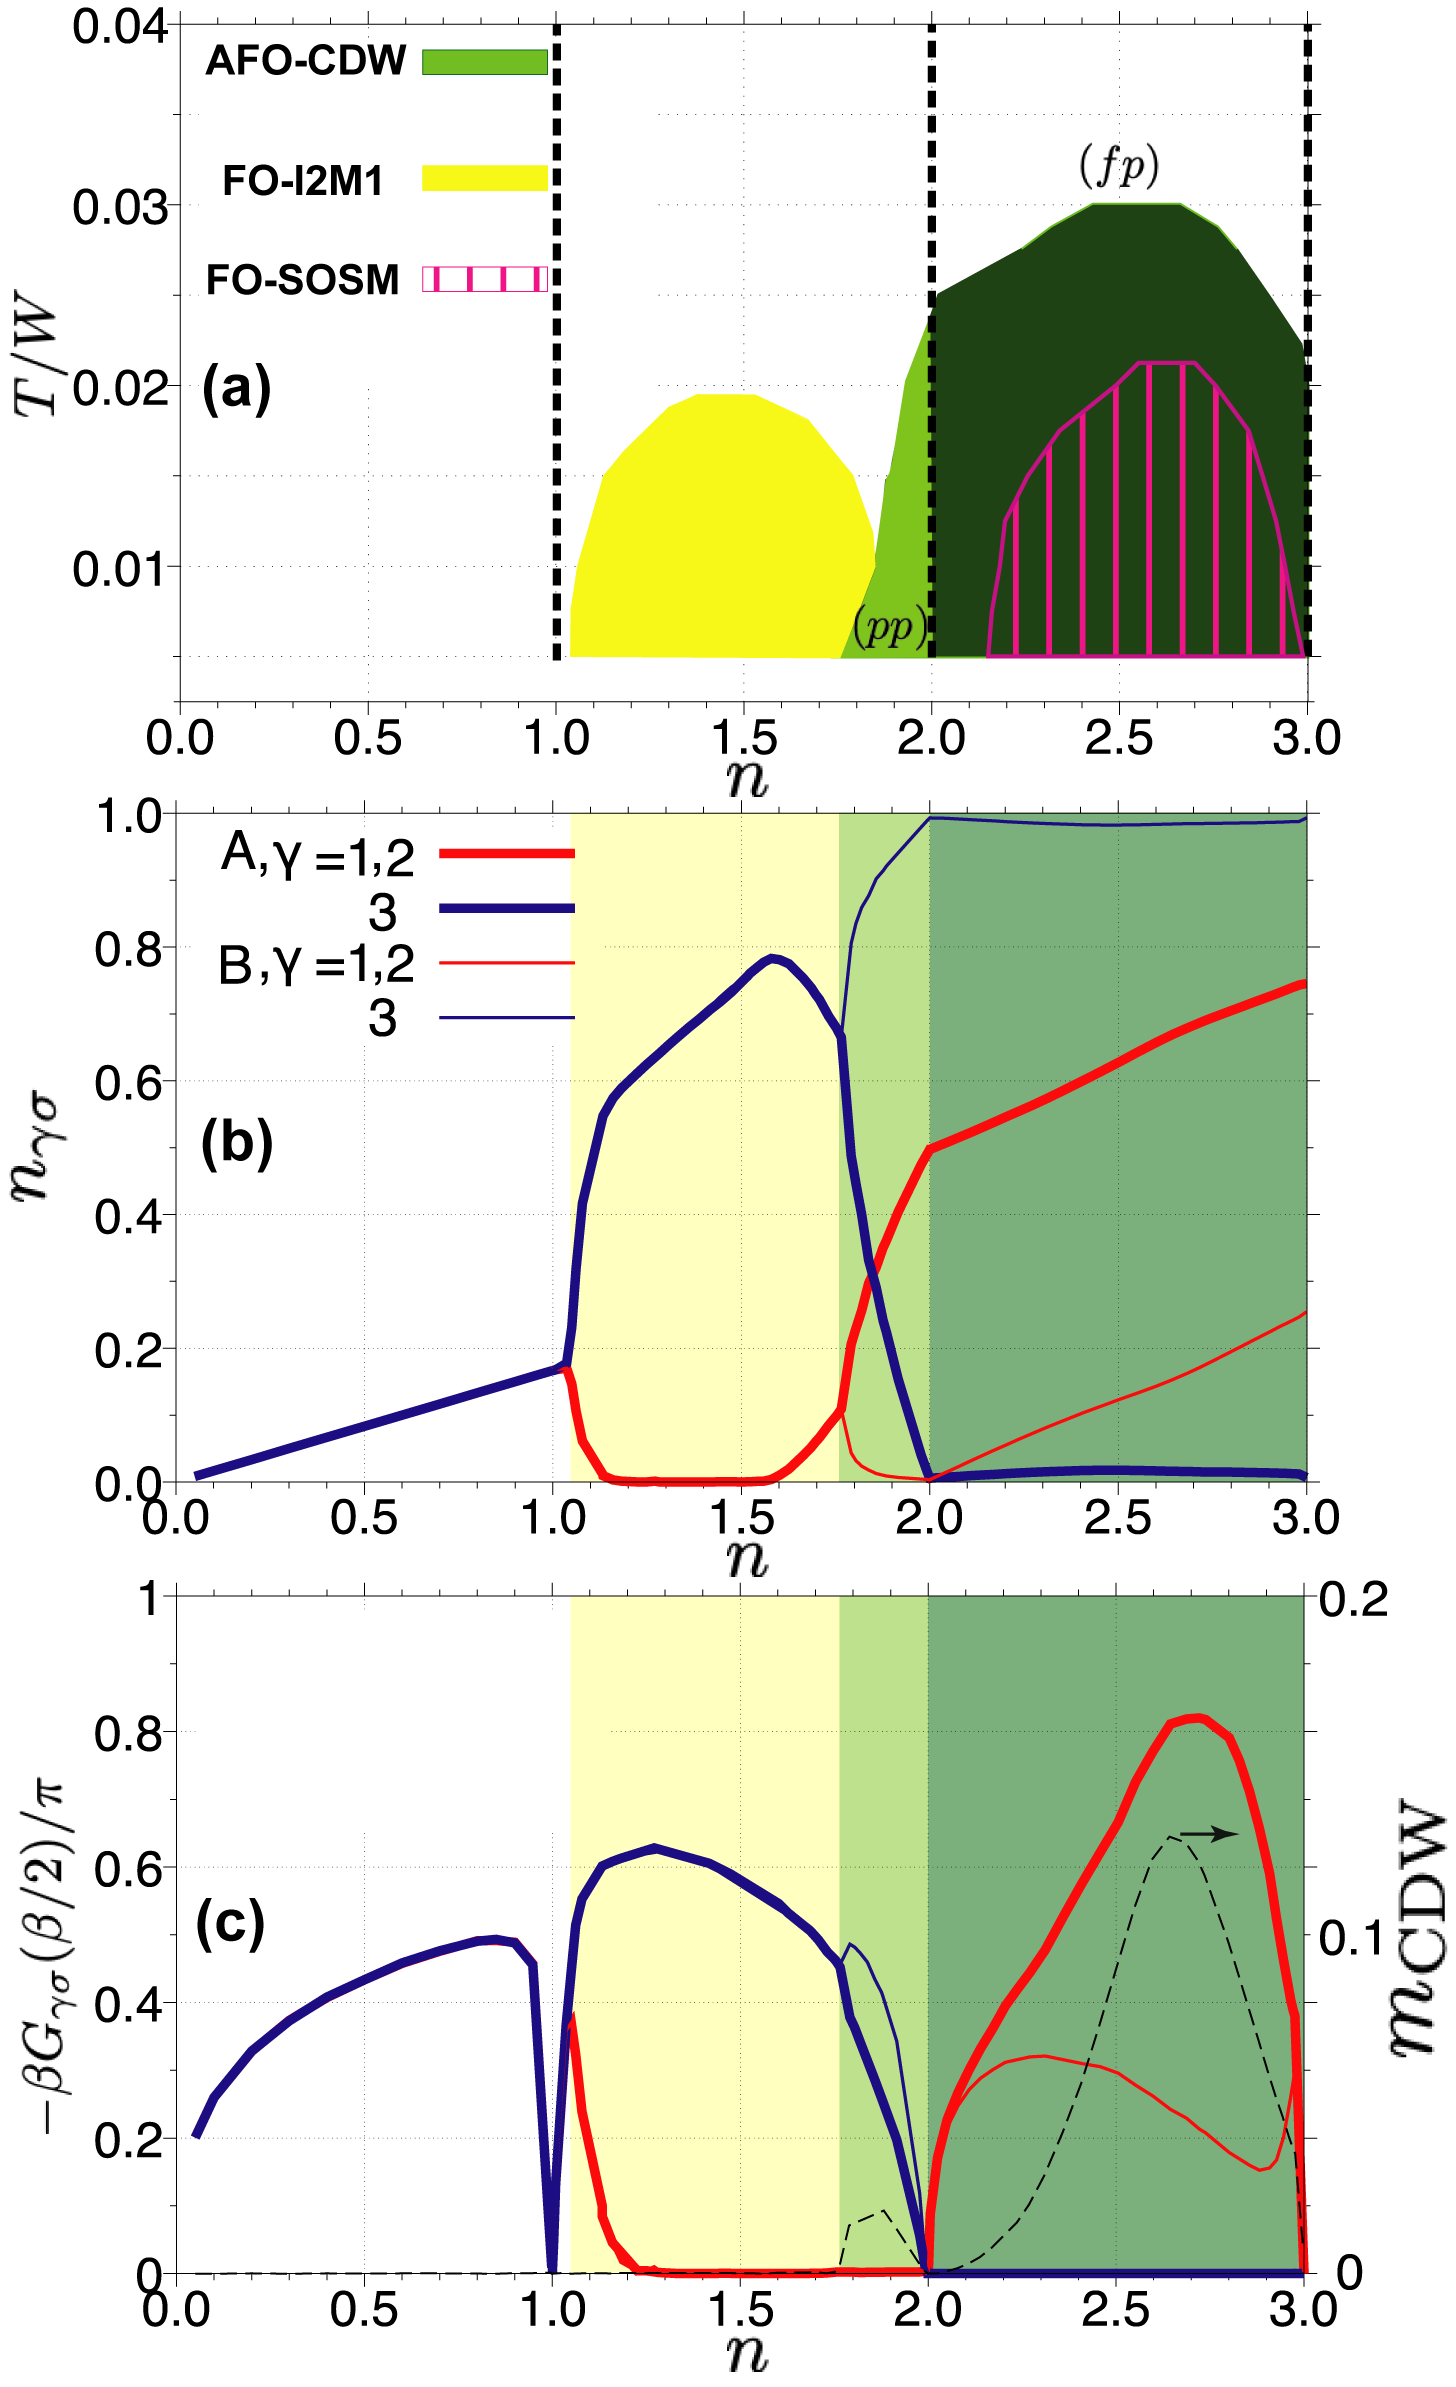
The phase diagram at in the space of filling and temperature is shown in Fig. 3. Now we allow for translational symmetry breaking and consider antiferro-type orders, as relevant e.g. in the case of bcc lattices. Since we suppress magnetic orders, the half-filled Mott insulator is at low temperatures in a fully polarized AFO state, which we call AFO. In this state, orbital 3 is almost empty on sublattice A and almost fully occupied on sublattice B, while orbitals 1 and 2 are 3/4 filled on sublattice A and 1/4 filled on sublattice B. As we hole-dope this state, the orbitals 3 remain fully polarized (band insulating), while the occupation in orbitals 1 and 2 is reduced proportional to the doping on both sublattices. The spectral functions in Fig. C.1(c) show that the partially filled orbitals in the doped AFO state are metallic. At the occupations in the three orbitals reach on sublattice A and on sublattice B, and the half-filled orbitals undergo a Mott transition. If we further hole dope this insulator, we obtain a partially polarized AFO state, denoted by AFO, where the orbital differentiation between sublattice A and B rapidly shrinks with hole doping, resulting in a state with large occupation in orbital 3 and small occupation in orbitals 1 and 2, and a transition to a state with FO order. The AFO solutions also exhibit a small CDW with a maximum reached near at , as indicated by the dashed line in Fig. 3(c). Hence, we denote the green phases in Fig. 3 by AFO+CDW and AFO+CDW.
The FO state with large occupation in the metallic orbital 3 and low occupations in the orbitals 1 and 2 persists down to filling , where the system becomes again Mott insulating. In most of this filling range, orbital 1 and 2 are in fact empty (band insulating, see spectral functions in Fig. C.1(a)), which is why we denote this phase as FO-I2M1 (two insulating orbitals and one metallic orbital). For fillings below 1 there is no orbital or charge order.
There exist also metastable electronically ordered phases, which can be stabilized in DMFT by starting from an appropriate initial solution. One of these metastable phases is the doped version of the SOSM phase, with one metallic and two paired Mott insulating orbitals. Away from half-filling, this phase (which is indicated by the pink hashing in Fig. 3(a)) has FO order, because the Mott insulating orbitals remain essentially half-filled, while the metallic one is doped. We call this the FO-SOSM phase, and show the corresponding orbital fillings in Fig. B.1 in Appendix B. This phase is continuously connected to the SOSM phase appearing next to the Mott insulator in the half-filled phase diagram (pink hashed region in Fig. 1). An interesting observation is that the FO-SOSM phase exists up to higher temperatures ( at , ) than the half-filled SOSM state ( at , ). Hence, if the AFO+CDW order can be suppressed by geometrical frustration, e. g. in fulleride compounds with an fcc lattice, then electron or hole doping of the Mott insulating compounds should result in a FO-SOSM state which is stable over a wide doping range and up to high temperatures.
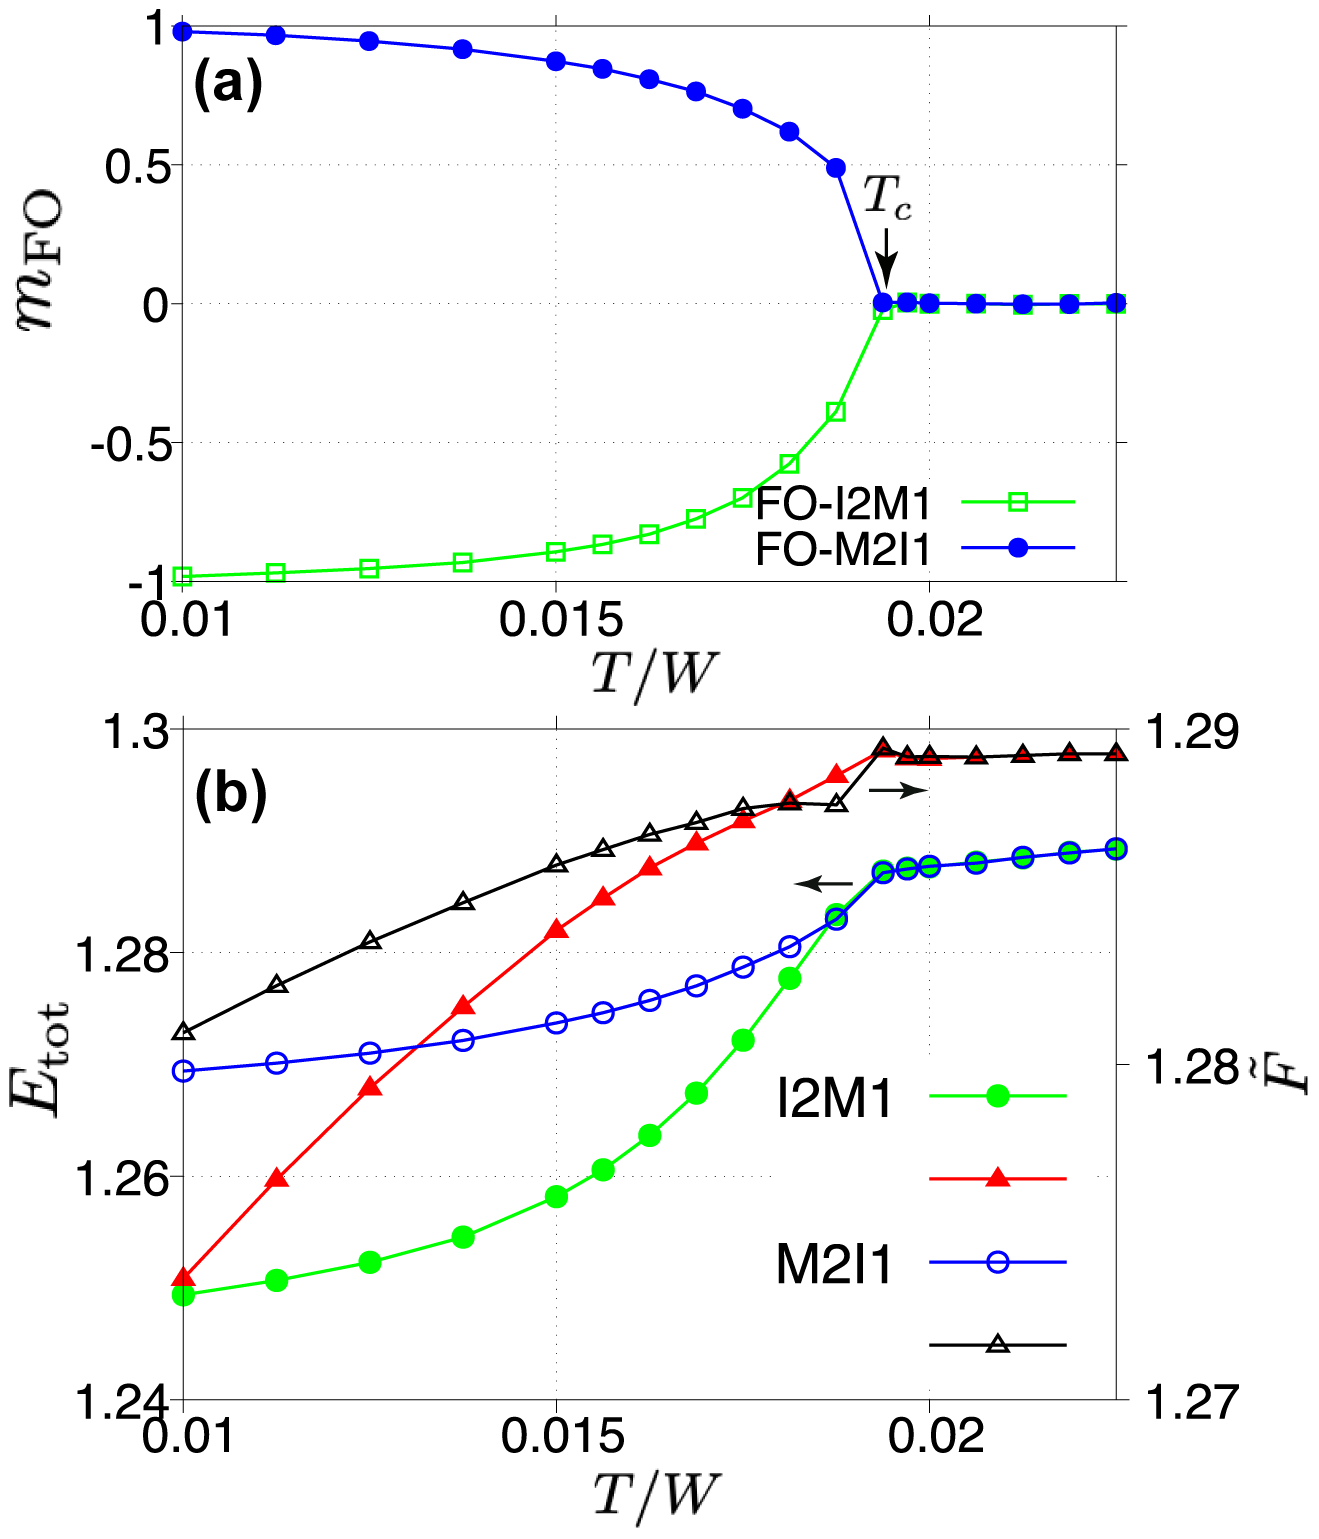
In the filling range we also find a second FO solution, with two metallic and one (band) insulating orbital, as also indicated in Fig. B.1. We call this the FO-M2I1 phase (two metallic orbitals and one insulating orbital as shown in Fig. C.1(b) where the orbital is empty). This phase can be stabilized in almost the same parameter region as the FO-I2M1 phase, but it has a larger energy and free energy in most of this region (except close to ). To illustrate this, we plot in Fig. 4 the total energies and the free energies relative to the critical temperature , , at as a function of . These data show that below , the stable phase is FO-I2M1.
There is also a metastable phase overlapping with the AFO-CDW phase, which connects to the FO-M2I1 phase and can be stabilized for example by increasing the filling starting from this FO phase, but not by decreasing the filling from . We call this the AFO-CDW phase and show the corresponding orbital-dependent fillings in Fig. B.1.
III.3 Electronic orders in the doped SOSM regime
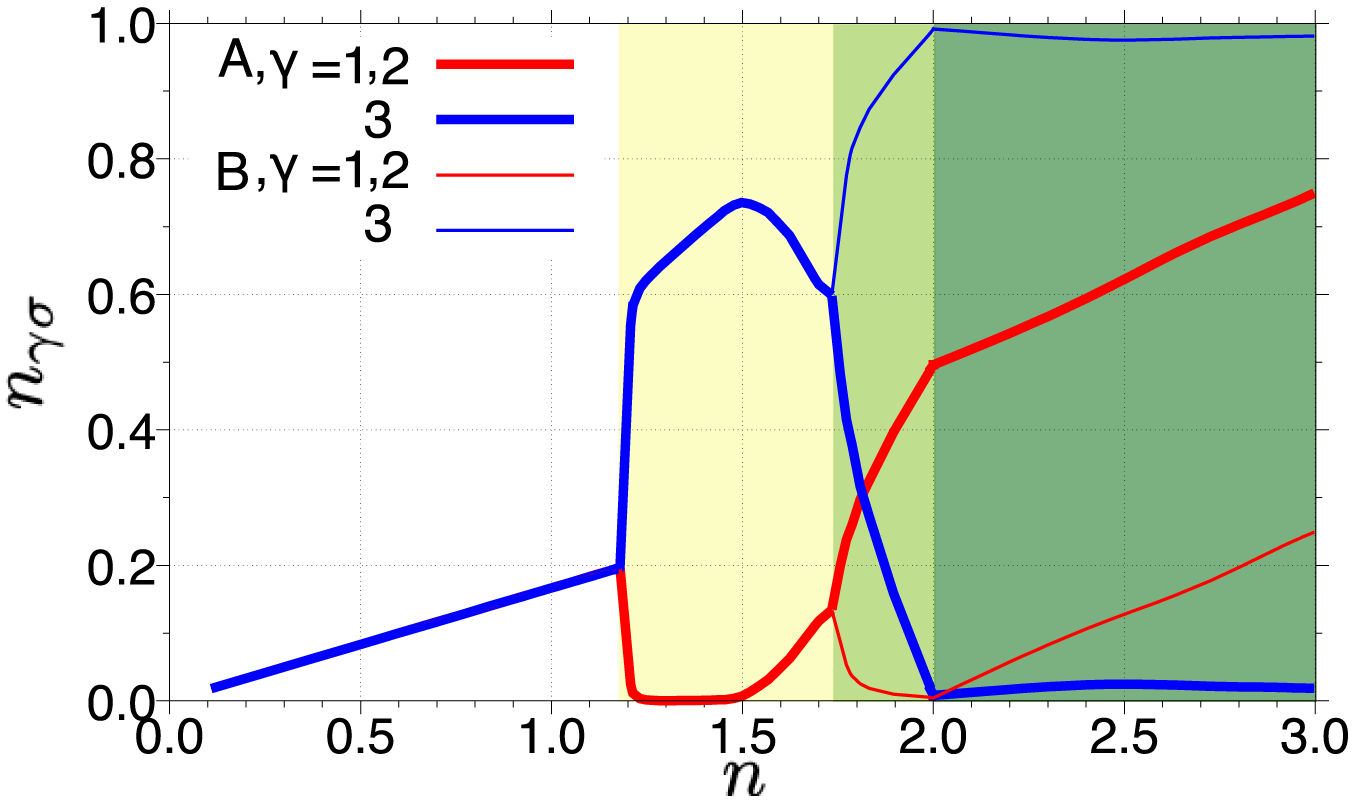
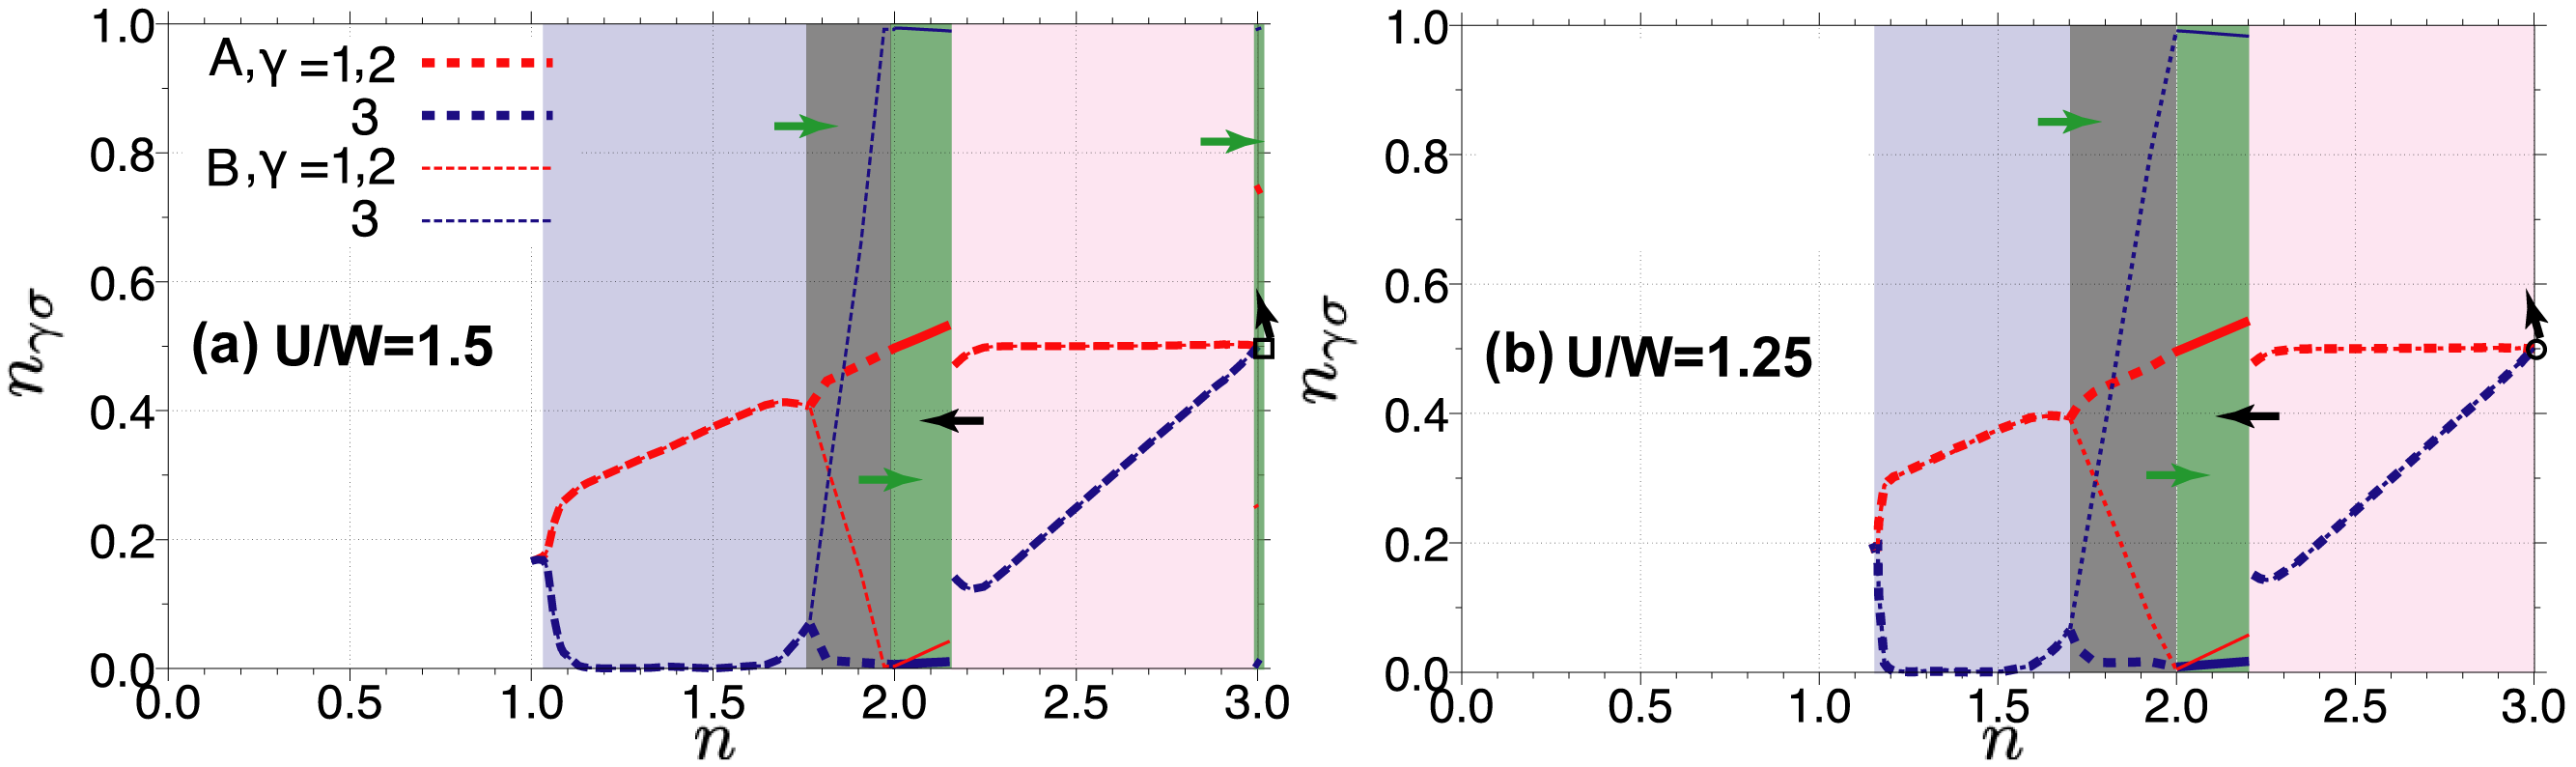
We next consider the filling dependence of the electronic orders at , where the half-filled system below is in the SOSM phase (in the absence of conventional electronic orders), or in the AFO+CDW phase. Here we do not map out the entire phase diagram in the filling-temperature plane but merely discuss the cut at . The occupations of the spin-orbitals are plotted as a function of total filling in Fig. 5 (stable phases) and Fig. B.1(b) (metastable phases). The results are similar to those shown for in Fig. 3, but the FO-I2M1 phase is stable only down to filling , while the filling range of the AFO+CDW phase slightly expands. Also, the metastable FO-SOSM phase directly connects to the (also metastable) half-filled SOSM phase, while in the doped Mott case (, , Fig. B.1(a)) the FO-SOSM state exists only above some critical doping concentration. In both cases, the FO-SOSM state can be stabilized over a wide doping range, down to . The orbital differentiation in vanishes in the limit as shown in Fig. B.1(b) but the orbital symmetry breaking still remains there, which distinguishes the SOSM state from conventional FO orders. Based on these results, and the data in Fig. 1, we identify in Fig. 6 the FO phase at , which is detected by the susceptibility analysis, with the (FO-)SOSM phase.
III.4 Orbital freezing and superconductivity in the doped system
In this section we complement the previous results on electronic ordering instabilities with data obtained from susceptibility calculations. With this approach, we can also investigate the -wave superconducting instability, without introducing Nambu Green’s functions in the DMFT simulations. This allows us to address the connection between orbital freezing and superconductivity in the doped system. The half filled model with has been analyzed with the same technique in Ref. Hoshino and Werner, 2017.
We start by plotting in Fig. 6 the potential stability regions of different phases in the space of and at temperature . We see that AFO order (in this analysis we do not distinguish between AFO and AFO) covers a wide region in the filling range and also for some range of fillings below , while FO order potentially appears at large for fillings , except in the vicinity of . As mentioned in Sec. II, the susceptibility analysis cannot tell us which of two overlapping orders is stable, but it is natural to assume that the order which covers the larger parameter region is actually realized. Within the accuracy of our analysis, the results are then consistent with the data presented in the previous sections, which for demonstrated AFO order down to (1.81 in Fig. 6) at followed by FO order which is stable down to . Similarly, at we found AFO order down to (1.78 in Fig. 6) and FO order down to .
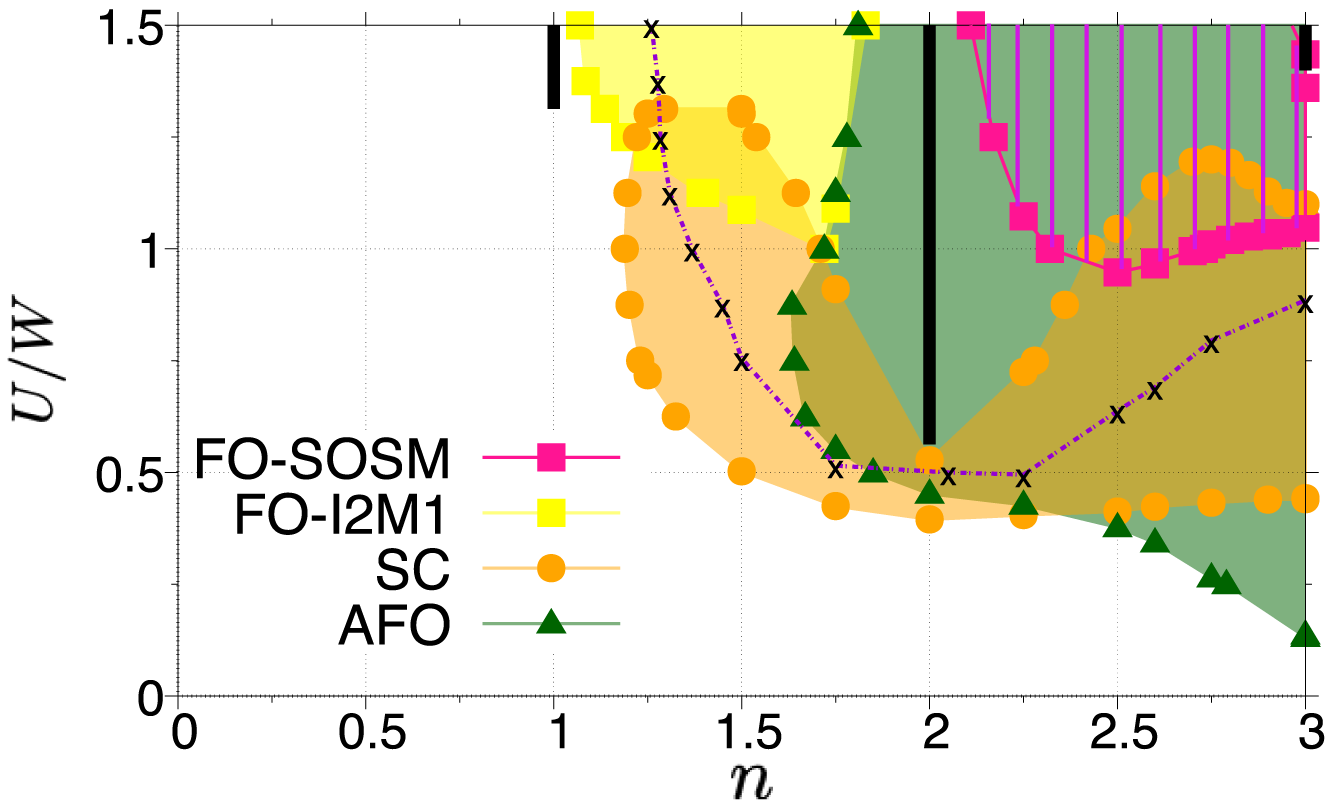
We also indicate by orange dots the potential stability region of the SC phase, and by the violet line with black crosses the orbital freezing crossover (maxima of ). At half-filling, the SC phase appears detached from the Mott phase next to the SOSM phase. (This is different from the two-orbital model, where the paired Mott state is very stable Steiner et al. (2016), and the SOSM phase does not exist.) Upon hole doping, the SC phase expands to larger , before it shrinks considerably as we approach the very stable Mott insulator. For fillings below the SC region expands again and reaches its largest extent in the direction near .
Independent of filling, the highest superconducting is reached near the orbital freezing crossover. This is suggested already by the obvious connection between the orbital freezing line in Fig. 6 and the shape of the SC region, and demonstrated explicitly in Fig. 7, which shows phase diagrams in the - plane for and , respectively. The peaks of the SC domes appear in the orbital freezing crossover region, which demonstrates that the unconventional SC state in multi-orbital systems is induced by the emergence of slowly fluctuating orbital moments, in analogy to the spin-freezing induced superconductivity in multi-orbital systems Hoshino and Werner (2015); Steiner et al. (2016); Werner et al. (2016).
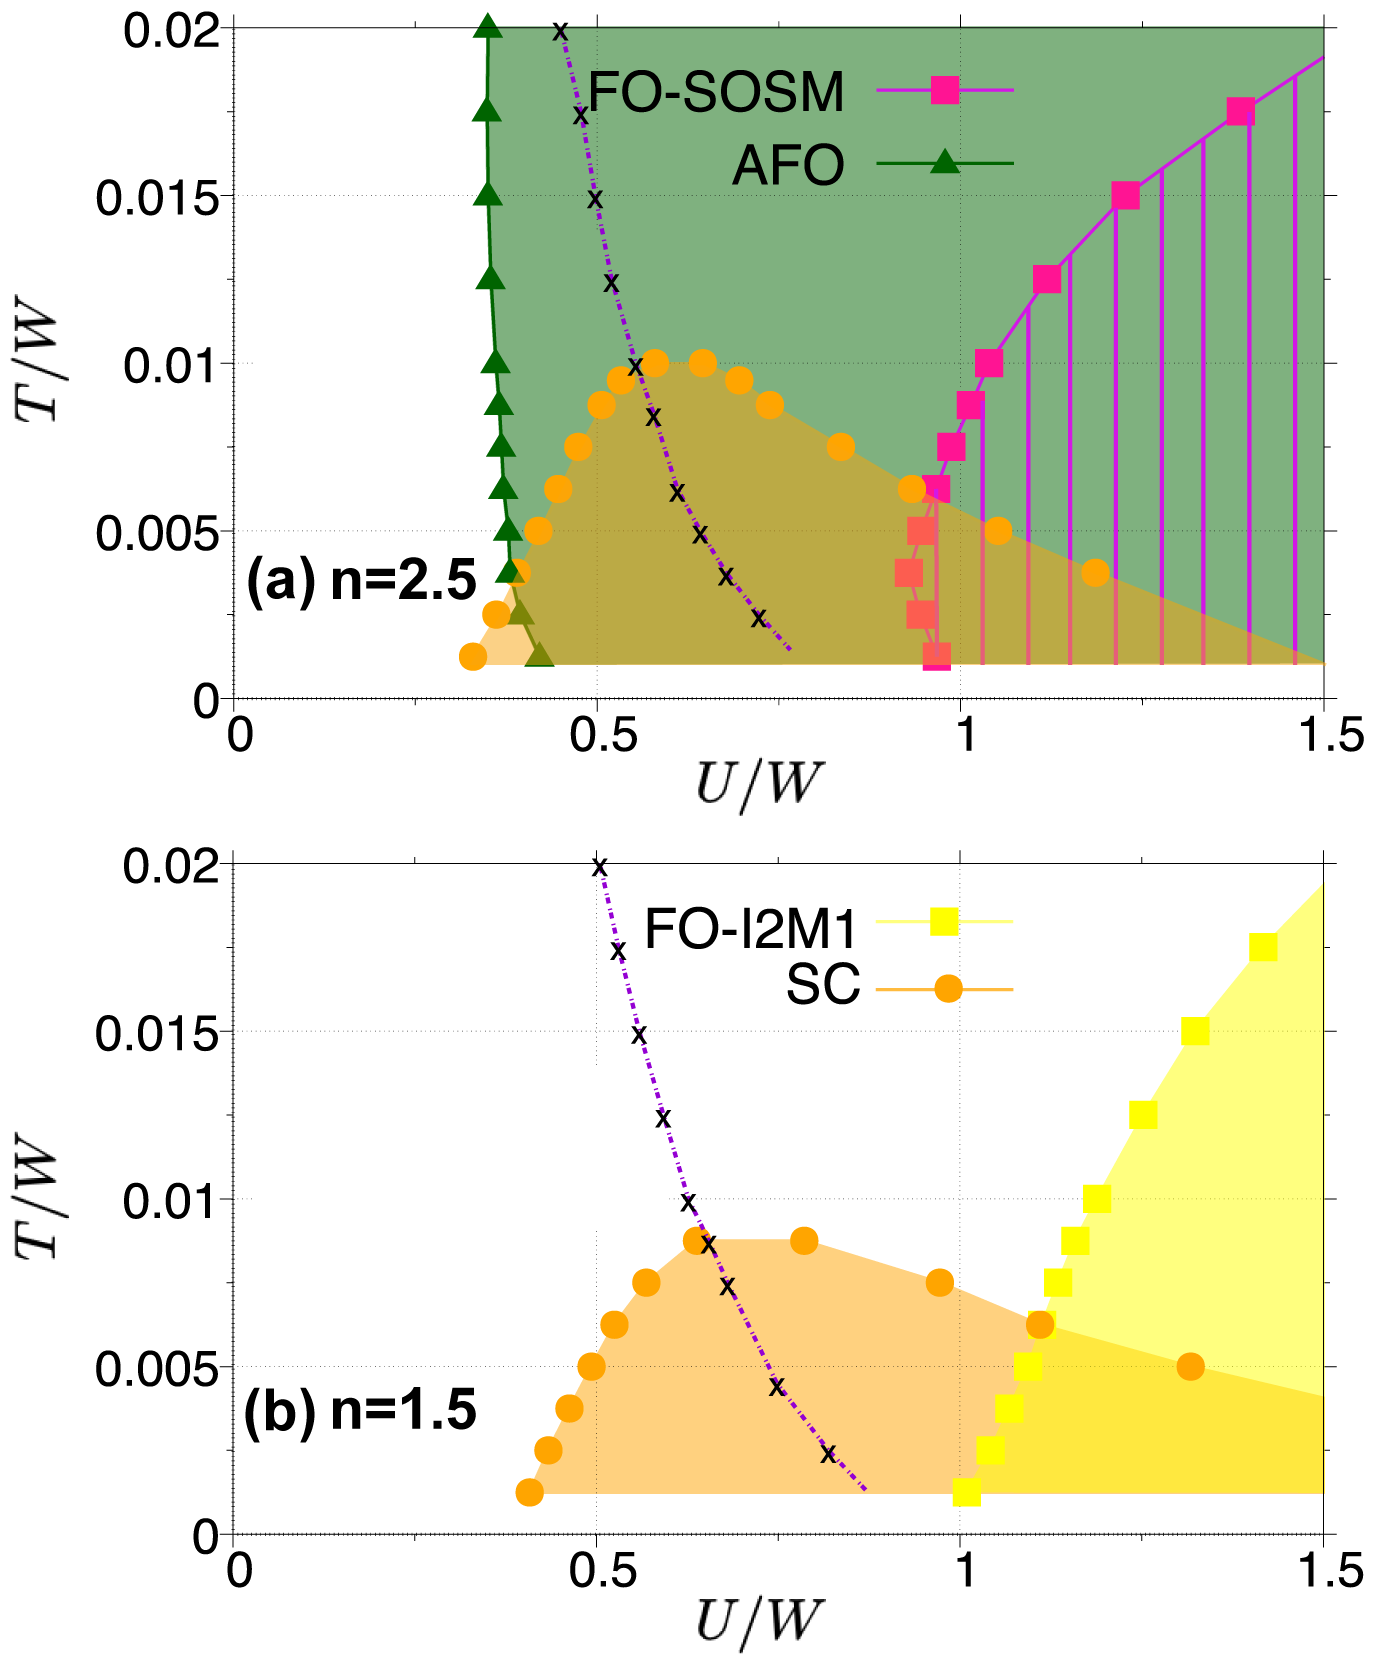
While SC near can only be realized by suppressing AFO order, or on the small- side of the dome at very low (see Fig. 7(a)), there are no competing electronic orders in the spin freezing crossover region near . The maximum at and is comparable to the maximum reached at half-filling Hoshino and Werner (2015). In fcc fulleride superconductors, AFO is suppressed by geometrical frustration, and SC has been recently found also in doped compounds Ren et al. (2020); Han et al. (2020), although a more careful modeling would be needed to account for the thin-film nature of these systems. Our results suggest that also the quarter-filled fulleride compounds should exhibit unconventional SC with a high .
IV Discussion and Summary
We have studied the filling dependence of electronically ordered states in the three-orbital Hubbard model with negative Hund coupling and degenerate bands. This model is relevant for the description of fulleride compound, where the small bare is overscreend by a coupling to Jahn-Teller phonons Fabrizio and Tosatti (1997); Capone et al. (2009); Nomura et al. (2012). Recent experimental progress Ren et al. (2020); Han et al. (2020) enables a systematic study of chemically doped thin films of these unconventional superconductors. Our work is not meant to be a realistic study of fulleride compounds, but the simple model considered captures the qualitative physics of this class of materials, as has been shown in recent investigations of the half-filled system Hoshino and Werner (2017); Ishigaki et al. (2018, 2019). In particular, these theoretical studies have explained the puzzling “Jahn-Teller metal” phase Zadik et al. (2015) as a manifestation of the SOSM phase. This composite ordered phase is unique to multi-orbital Hubbard systems with negative Hund coupling, and conceptually related to odd-frequency order in the two-channel Kondo problem Hoshino and Kuramoto (2014); Hoshino et al. (2019). The previous investigations of the half-filled model have also clearly revealed that the unconventional superconductivity is induced by an orbital freezing crossover Hoshino and Werner (2017).
In this work, we have focused on orbital orders, the SOSM phase, and superconductivity, and investigated their stability as the system is doped away from half-filling. (Antiferromagnetic order also exists in this model, but it appears only in and near the and Mott insulating phases.) At low temperatures, the phase diagram for fillings is dominated by antiferro orbital order. At large interactions , FO order appears for . If the AFO state is suppressed, e. g. by geometric frustration as in fcc fullerides, superconductivity appears in a wide range between , and it reaches maximum s which are comparable to the undoped system. Also for superconductivity is prominent and reaches similarly high s near . This filling regime is particularly interesting, because here the superconducting state for does not compete with other electronic instabilities.
Also away from half-filling, the highest superconducting s are reached in the orbital-freezing crossover region, where slowly fluctuating orbital moments emerge within the metal phase. This connection to orbital freezing motivated us to also study the entropy of the three-orbital model with . Focusing on the half-filled model for simplicity, we indeed found the expected enhancement of the entropy in the orbital frozen metal regime, although the crossover is rather broad. This is consistent with enhanced orbital fluctuations in a wide interaction range and a correspondingly wide superconducting dome. A more prominent feature of the entropy is a plateau in the half-filled Mott state, which extends to high temperatures, and deep into the metal-insulator crossover region. We also showed that the entropy of the SOSM state is lower than that of the orbital-frozen metal.
While the SOSM phase is dominated by the AFO phase in our model, it can exist as a stable phase in geometrically frustrated systems Zadik et al. (2015). It is thus interesting to ask how this composite ordered state evolves under doping. While the half-filled SOSM state at higher temperatures is in fact metallic (with two bad metallic and one good metallic orbital), it is characterized at low temperatures by the spontaneous symmetry breaking into two paired Mott insulating orbitals and one metallic orbital. Upon hole doping, the Mott insulating orbitals remain half-filled (and insulating), while the filling of the metallic orbital is reduced. The doped SOSM state thus exhibits a conventional FO order.
Not only does the half-filled SOSM state evolve under hole doping into a FO-SOSM state which is stable over a wide doping range, a similar FO-SOSM state can also be induced at larger interactions, by hole-doping the half-filled Mott insulator. In this doped large- region, the of the FO-SOSM phase can be higher than the maximum of the half-filled SOSM (Jahn-Teller metal) phase. In experiments on doped Mott insulating fulleride compounds, e. g. doped Cs3C60 Ganin et al. (2008); Zadik et al. (2015), one may thus find a prominent FO-SOSM phase, with experimental signatures similar to those of the Jahn-Teller metal.
Acknowledgements.
The calculations have been performed on the Beo05 cluster at the University of Fribourg, using a code based on iQist Huang et al. (2015); Huang (2017), and at the facilities of the Supercomputer Center of the Institute for Solid State Physics, University of Tokyo. We acknowledge support by SNSF Grant No. 200021-165539 and JSPS KAKENHI Grant No. JP18K13490.Appendix A Specific heat and orbital occupations near the SOSM phase
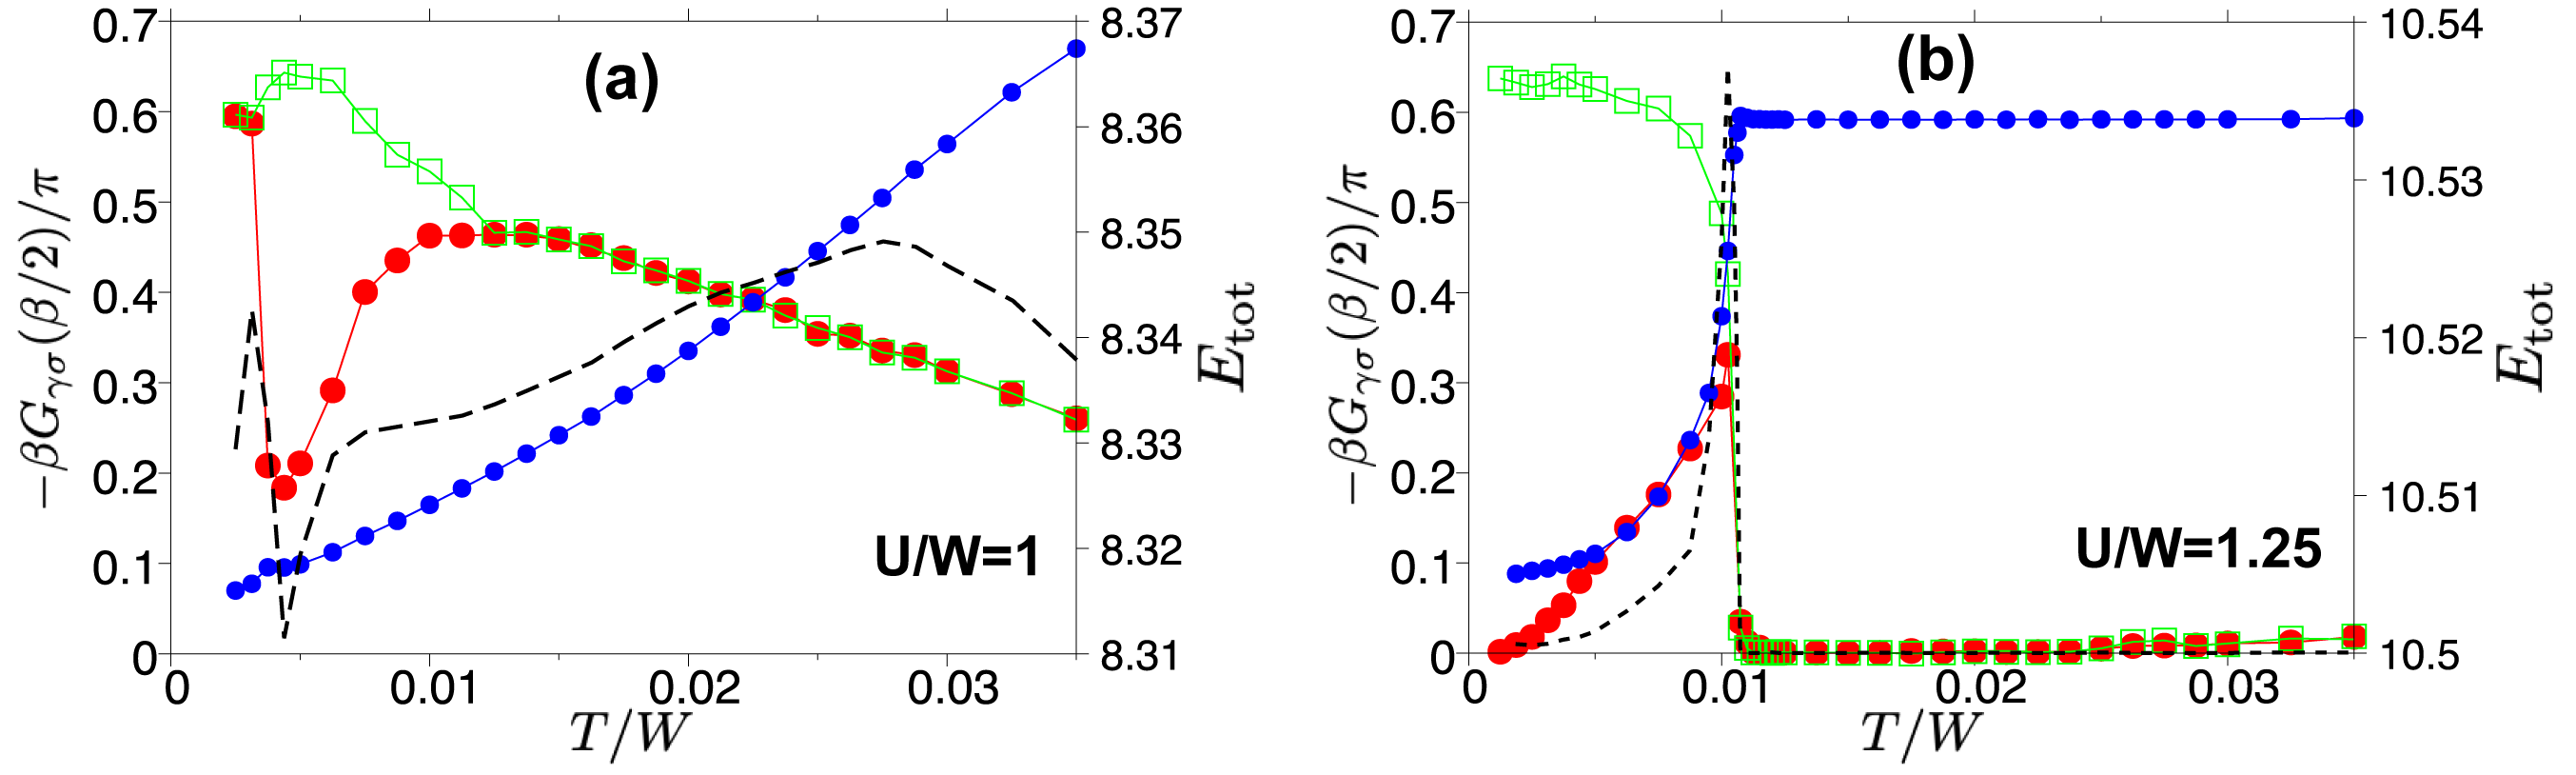
In Fig. A.1 we plot the total energy, specific heat, and orbital occupations as a function of temperature for (panel (a)) and 1.25 (panel (b)). In the case, the system enters the SOSM phase around and switches to a strongly correlated Fermi liquid around , which is accompanied by a large increase in the specific heat. (Since the transition is expected to be first order, the specific heat exhibits a delta-function peak at the transition point.) At the system makes a transition from the Mott insulator to the SOSM phase at , again with a delta-function like peak in the specific heat at the transition point and an enhanced specific heat in the correlated Fermi liquid state at .
Appendix B Metastable electronically ordered phases
We illustrate in Fig. B.1 the stability regions and orbital occupations of the metastable phases, and the transitions induced by changing the chemical potential in these metastable phases. The green (black) thick arrows show the phase transitions observed by increasing (decreasing) the chemical potential . By decreasing from the Mott phase at , , the system ends up in the AFO-CDW phase, as indicated by the arrow in panel (a). The stability range of the AFO-CDW phase is very narrow because is very close to the transition between the half-filled Mott and SOSM phases. At higher temperatures, this phase will extend over a wider doping range, while at lower temperatures, it would disappear completely.
By decreasing from the SOSM phase at , , an orbital polarization is induced, and the system makes a transition into the FO-SOSM phase, as indicated by the arrow in panel (b).
Appendix C Spectral functions
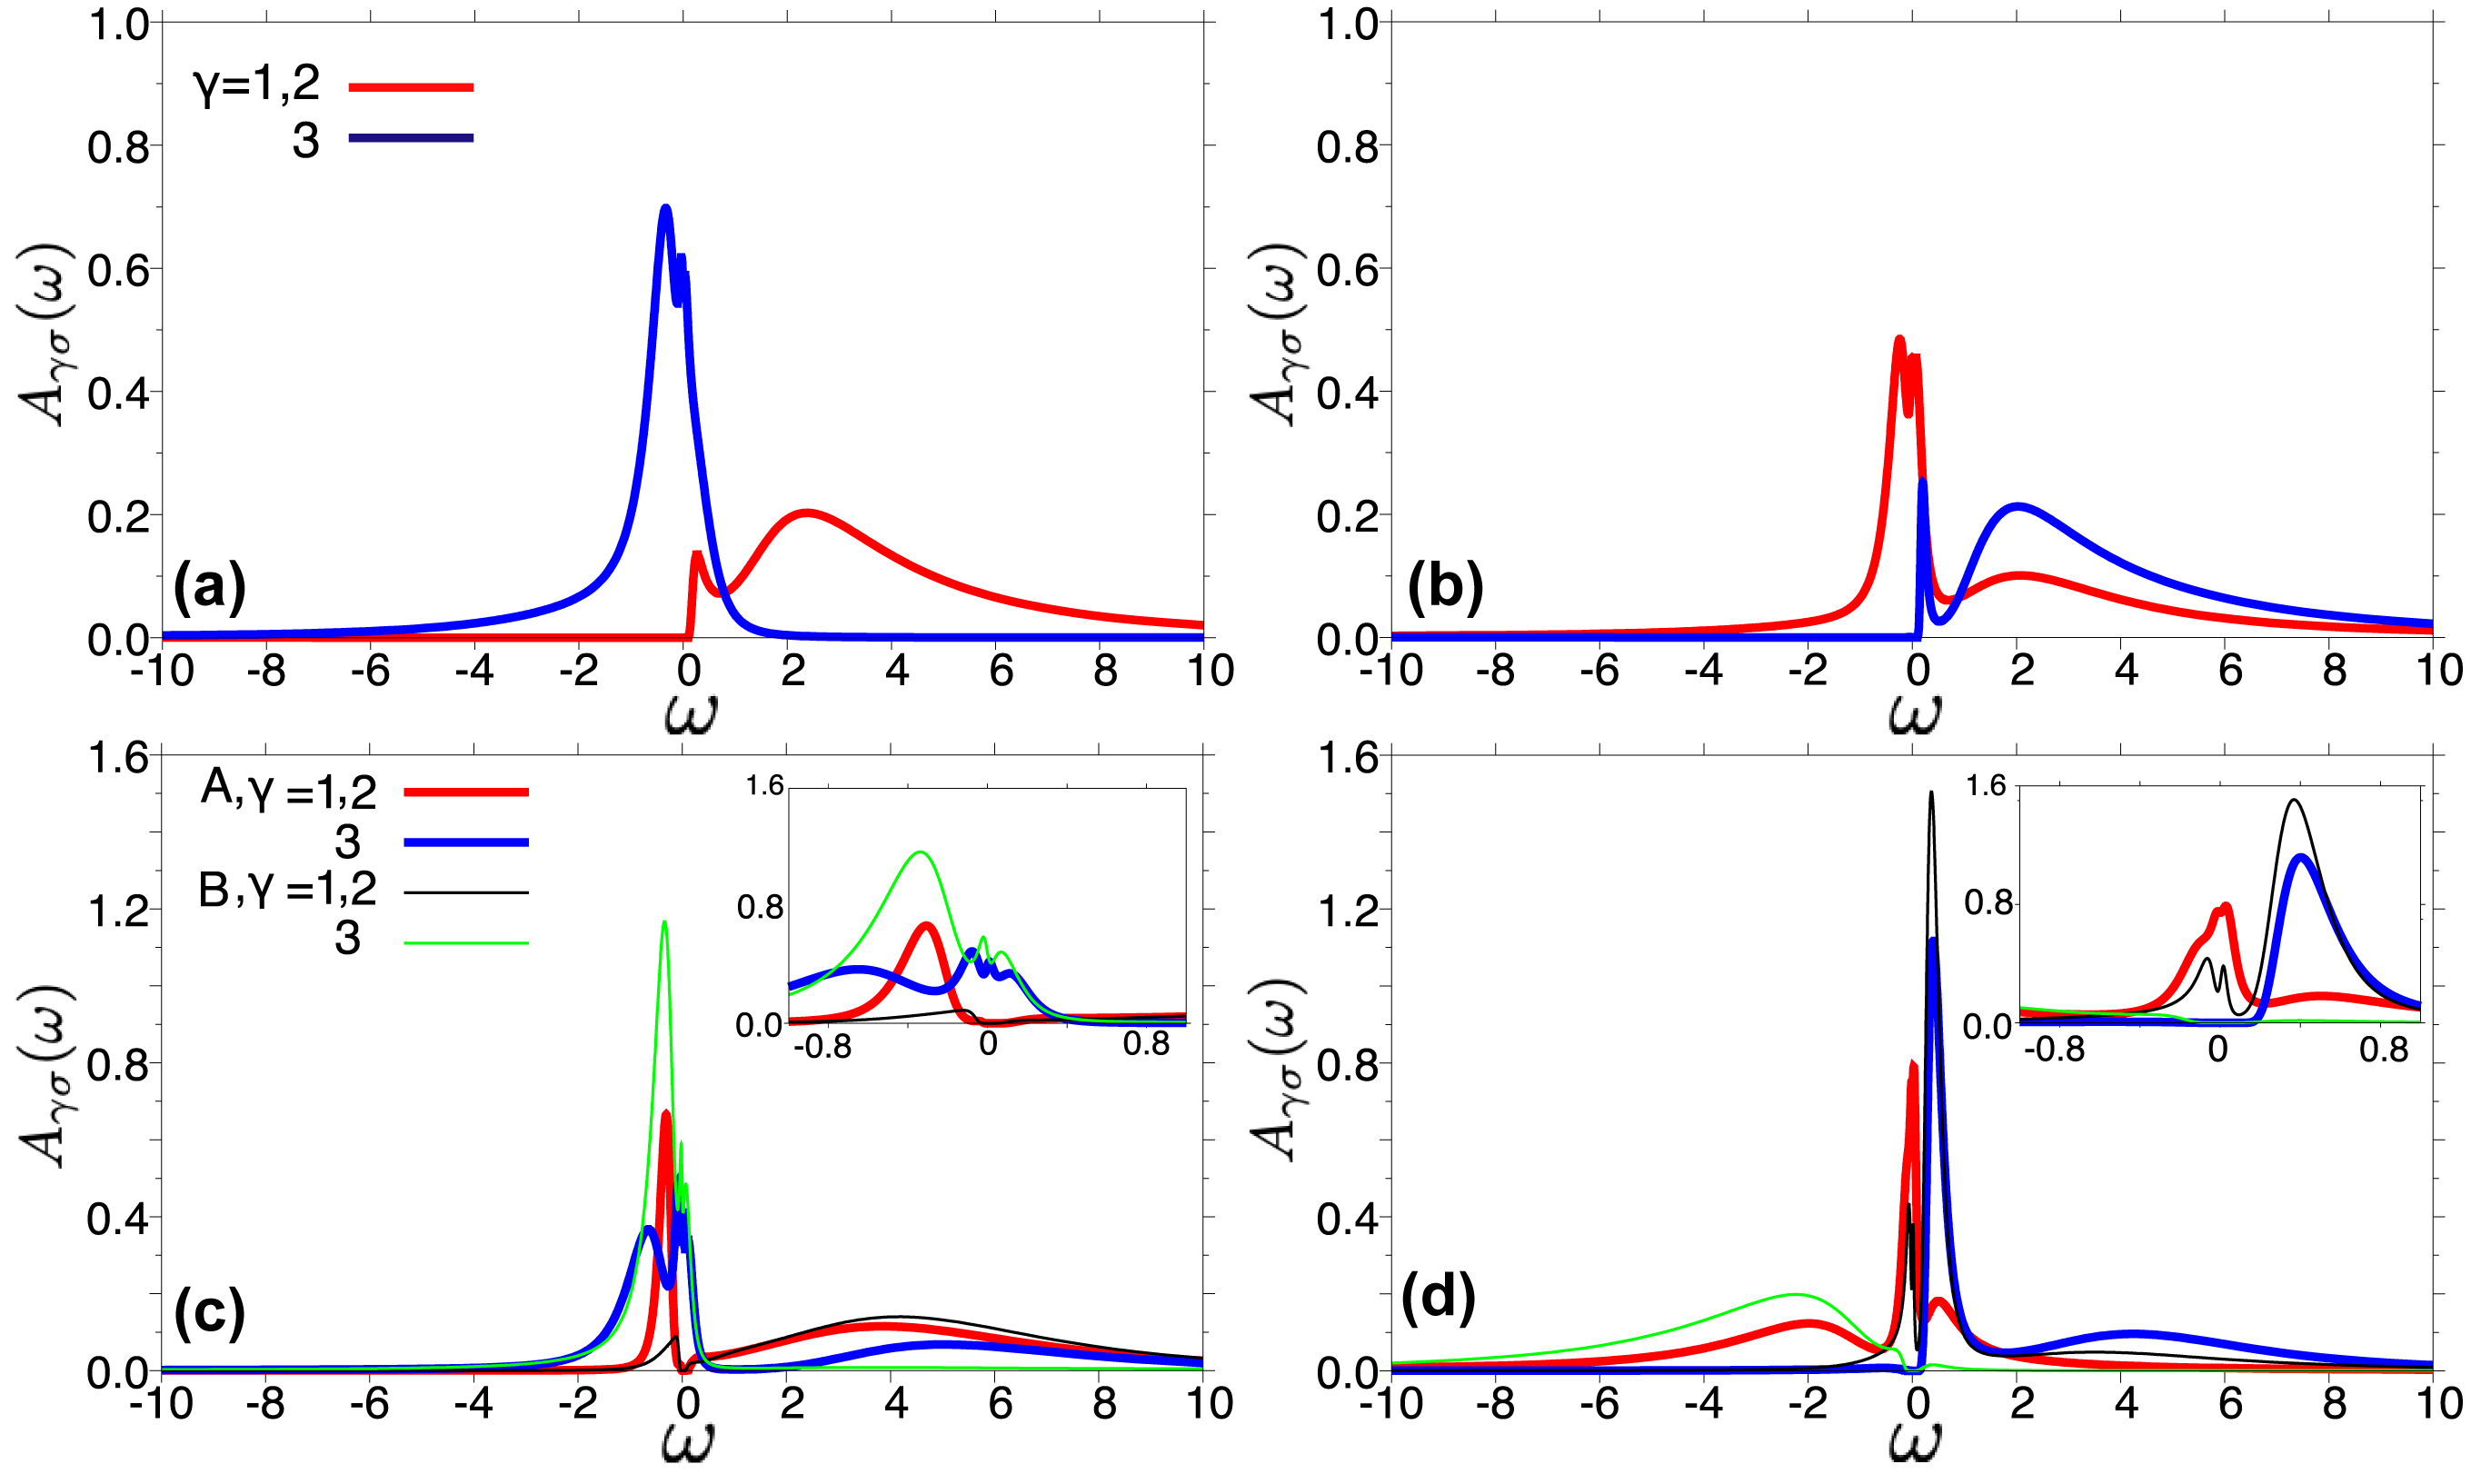
Figure C.1 plots representative spectral functions for the three stable orbitally ordered phases at . Panel (a) shows an example for the FO-I2M1 phase at , with orbital 3 metallic and orbitals 1 and 2 band insulating (empty). In contrast, panel (b) shows an example for the FO-M2I1 phase, with orbital 1 and 2 metallic and orbital 3 band insulating (empty). Panel (c) is an example for the AFO-CDW state at . Here, we have different solutions for the two sublattices, with orbital 3 metallic and orbitals 1 and 2 essentially empty. Panel (d) plots the spectral functions at , in the AFO-CDW phase. Here, orbital 3 is band insulating (full or empty) while orbitals 1 and 2 are metallic.
References
- Werner et al. (2008) P. Werner, E. Gull, M. Troyer, and A. J. Millis, Phys. Rev. Lett. 101, 166405 (2008).
- de’ Medici et al. (2011) L. de’ Medici, J. Mravlje, and A. Georges, Phys. Rev. Lett. 107, 256401 (2011).
- Haule and Kotliar (2009) K. Haule and G. Kotliar, New Journal of Physics 11, 025021 (2009).
- Yin et al. (2011) Z. P. Yin, K. Haule, and G. Kotliar, Nature Materials 10, 932 (2011).
- Georges et al. (2013) A. Georges, L. d. Medici, and J. Mravlje, Annual Review of Condensed Matter Physics 4, 137 (2013).
- Hoshino and Werner (2015) S. Hoshino and P. Werner, Phys. Rev. Lett. 115, 247001 (2015).
- Werner et al. (2016) P. Werner, S. Hoshino, and H. Shinaoka, Phys. Rev. B 94, 245134 (2016).
- Fabrizio and Tosatti (1997) M. Fabrizio and E. Tosatti, Phys. Rev. B 55, 13465 (1997).
- Nomura et al. (2015) Y. Nomura, S. Sakai, M. Capone, and R. Arita, Science Advances 1 (2015), 10.1126/sciadv.1500568.
- Steiner et al. (2016) K. Steiner, S. Hoshino, Y. Nomura, and P. Werner, Phys. Rev. B 94, 075107 (2016).
- Hoshino and Werner (2017) S. Hoshino and P. Werner, Phys. Rev. Lett. 118, 177002 (2017).
- Gunnarsson (1997) O. Gunnarsson, Rev. Mod. Phys. 69, 575 (1997).
- Capone et al. (2002) M. Capone, M. Fabrizio, C. Castellani, and E. Tosatti, Science 296, 2364 (2002).
- Gunnarsson (2004) O. Gunnarsson, Alkali-Doped Fullerides (2004).
- Capone et al. (2009) M. Capone, M. Fabrizio, C. Castellani, and E. Tosatti, Rev. Mod. Phys. 81, 943 (2009).
- Nomura et al. (2012) Y. Nomura, K. Nakamura, and R. Arita, Phys. Rev. B 85, 155452 (2012).
- Ishigaki et al. (2018) K. Ishigaki, J. Nasu, A. Koga, S. Hoshino, and P. Werner, Phys. Rev. B 98, 235120 (2018).
- Ishigaki et al. (2019) K. Ishigaki, J. Nasu, A. Koga, S. Hoshino, and P. Werner, Phys. Rev. B 99, 085131 (2019).
- Zadik et al. (2015) R. H. Zadik, Y. Takabayashi, G. Klupp, R. H. Colman, A. Y. Ganin, A. Potočnik, P. Jeglič, D. Arčon, P. Matus, K. Kamarás, Y. Kasahara, Y. Iwasa, A. N. Fitch, Y. Ohishi, G. Garbarino, K. Kato, M. J. Rosseinsky, and K. Prassides, Sci. Adv. 1, e1500059 (2015).
- Ren et al. (2020) M.-Q. Ren, S. Han, S.-Z. Wang, J.-Q. Fan, C.-L. Song, X.-C. Ma, and Q.-K. Xue, Phys. Rev. Lett. 124, 187001 (2020).
- Han et al. (2020) S. Han, M.-X. Guan, C.-L. Song, Y.-L. Wang, M.-Q. Ren, S. Meng, X.-C. Ma, and Q.-K. Xue, Phys. Rev. B 101, 085413 (2020).
- Misawa and Imada (2017) T. Misawa and M. Imada, arXiv e-prints , arXiv:1711.10205 (2017), arXiv:1711.10205 [cond-mat.str-el] .
- Müller-Hartmann (1989a) E. Müller-Hartmann, Z. Phys. B 74, 507 (1989a).
- Müller-Hartmann (1989b) E. Müller-Hartmann, Z. Phys. B 76, 211 (1989b).
- Metzner and Vollhardt (1989) W. Metzner and D. Vollhardt, Phys. Rev. Lett. 62, 324 (1989).
- Georges et al. (1996) A. Georges, G. Kotliar, W. Krauth, and M. J. Rozenberg, Rev. Mod. Phys. 68, 13 (1996).
- Kotliar et al. (2006) G. Kotliar, S. Y. Savrasov, K. Haule, V. S. Oudovenko, O. Parcollet, and C. A. Marianetti, Rev. Mod. Phys. 78, 865 (2006).
- Werner et al. (2006) P. Werner, A. Comanac, L. de’ Medici, M. Troyer, and A. J. Millis, Phys. Rev. Lett. 97, 076405 (2006).
- Gull et al. (2011) E. Gull, A. J. Millis, A. I. Lichtenstein, A. N. Rubtsov, M. Troyer, and P. Werner, Rev. Mod. Phys. 83, 349 (2011).
- Yue and Werner (2017) C. Yue and P. Werner, arXiv e-prints , arXiv:2004.00471 (2017), arXiv:2004.00471 [cond-mat.str-el] .
- Werner and Millis (2007) P. Werner and A. J. Millis, Phys. Rev. B 75, 085108 (2007).
- Haule and Birol (2015) K. Haule and T. Birol, Phys. Rev. Lett. 115, 256402 (2015).
- Chan et al. (2009) C.-K. Chan, P. Werner, and A. J. Millis, Phys. Rev. B 80, 235114 (2009).
- Note (1) While Ref. Ishigaki et al. (2019) reported two different types of SOSM phases, we will consider here only the phase with orbitals 1 and 2 in a paired Mott state, and the third orbital metallic.
- Gull et al. (2008) E. Gull, P. Werner, X. Wang, M. Troyer, and A. J. Millis, EPL (Europhysics Letters) 84, 37009 (2008).
- Hoshino and Kuramoto (2014) S. Hoshino and Y. Kuramoto, Phys. Rev. Lett. 112, 167204 (2014).
- Hoshino et al. (2019) S. Hoshino, P. Werner, and R. Arita, Phys. Rev. B 99, 235133 (2019).
- Ganin et al. (2008) A. Y. Ganin, Y. Takabayashi, Y. Z. Khimyak, S. Margadonna, A. Tamai, M. J. Rosseinsky, and K. Prassides, Nature Materials 7, 367 (2008).
- Huang et al. (2015) L. Huang, Y. Wang, Z. Y. Meng, L. Du, P. Werner, and X. Dai, Comput. Phys. Commun 195, 140 (2015).
- Huang (2017) L. Huang, Comput. Phys. Commun 221, 423 (2017).