Searching for debris discs in the 30 Myr open cluster IC 4665
Abstract
Context. Debris discs orbiting young stars are key to understand dust evolution and the planetary formation process. We take advantage of a recent membership analysis of the 30 Myr nearby open cluster IC 4665 based on the Gaia and DANCe surveys to revisit the disc population of this cluster.
Aims. We aim to study the disc population of IC 4665 using Spitzer (MIPS and IRAC) and WISE photometry.
Methods. We use several colour-colour diagrams with empirical photospheric sequences to detect the sources with an infrared excess. Independently, we also fit the spectral energy distribution (SED) of our debris disc candidates with the Virtual Observatory SED analyser (VOSA) which is capable of automatically detecting infrared excesses and provides effective temperature estimates.
Results. We find six candidates debris disc host-stars (five with MIPS and one with WISE) and two of them are new candidates. We estimate a disc fraction of 2410% for the B–A stars, where our sample is expected to be complete. This is similar to what has been reported in other clusters of similar ages (Upper Centaurus Lupus, Lower Centaurus Crux, the Pictoris moving group, and the Pleiades). For solar type stars we find a disk fraction of 99%, lower than that observed in regions with comparable ages.
Conclusions. Our candidates debris disc host-stars are excellent targets to be studied with ALMA or the future James Webb Space Telescope (JWST).
Key Words.:
Stars: circumstellar matter, Infrared: stars, Galaxy: open clusters and associations: individual: IC 46651 Introduction
Debris discs are the result of collisions between planetesimals and their detection therefore implies that the planet formation process was successful in forming bodies of a few hundreds or a few thousands of kilometres (see e.g. Hughes et al., 2018, for a recent review on debris discs). Stars hosting debris discs are excellent places where to image planets and discs simultaneously, see e.g. Fomalhaut (Kalas et al., 2008), Pictoris (Lagrange et al., 2010), HR8799 (Marois et al., 2008). The reason is that they are optically thin in the infrared, where planets are imaged since they offer the best contrast with respect to the star. On the contrary, protoplanetary discs are optically thick in this wavelengths hindering the observation of planets. In addition, the study of debris discs can give us clues on the composition of exoplanets as well as their orbits and masses (e.g. Hughes et al., 2018).
The first debris disc was discovered around Vega using the Infrared Astronomical Satellite (IRAS) by Aumann et al. (1984). After that, several studies have been devoted to search for debris discs in the solar vicinity (e.g. Moór et al., 2006; Rhee et al., 2007; Zuckerman et al., 2011). One of the main questions addressed by these studies is the temporal evolution of debris discs, only possible if accurate age measurements are available which is in general not common for isolated stars. The easiest way to tackle this issue is to study debris discs hosted by stars members of a known association or open cluster where the age estimates are much more reliable. In the past decade, a number of studies reported the frequency of infrared (IR) excesses in clusters of different ages (e.g. Gorlova et al. 2006, Gorlova et al. 2007, Siegler et al. 2007). These joint efforts complemented by others on field stars suggested a debris disc fraction decay inversely proportional to the age (Rieke et al., 2005).
IC 4665 is among the sample of young open clusters examined in the literature to search for debris discs. This is a young open cluster with an estimated age of Myr (Manzi et al., 2008) and an average distance of 350 pc (Miret-Roig et al., 2019). Several works have studied the cluster population (Hogg & Kron, 1955; Prosser & Giampapa, 1994; de Wit et al., 2006; Jeffries et al., 2009; Lodieu et al., 2011). Recently, Miret-Roig et al. (2019) updated the cluster census using photometric and astrometric information, providing a list of more than 800 highly probable cluster members. Smith et al. (2011) did a search of debris discs in IC 4665 based on Spitzer observations. They started from a sample of 75 members and obtained a disc fraction of 27%. The authors also reported a disc fraction for solar-type stars (F5–K5) of % which they claimed to be higher than what had been found in other clusters of similar ages, although compatible within the uncertainties (e.g. Gorlova et al. 2007 found a F0–F9 fraction of % for the 30 Myr NGC 2547 open cluster).
In this work, we take advantage of Miret-Roig et al. (2019) recent census to revisit the study of debris discs in this cluster. In Section 2 we describe our sample and dataset which combines photometry from DANCe, WISE and Spitzer. In Section 3 we present our empirical method to detect IR excesses with colour-colour diagrams. In Sect. 4 we confirm our candidates by comparing their spectral energy distribution (SED) to models of photospheric emission. In Section 5 we discuss the candidates individually, and in Section 6 we compute the disc fraction and compare it to other studies. Finally, in Section 7 we present our conclusions.
2 Data
We start from a list of 819 candidate members of IC 4665 (Miret-Roig et al., 2019) covering a magnitude range of 12.4 mag ( mag). This sample has been selected combining photometry and astrometry from the Gaia Data Release 2 (DR2, Gaia Collaboration et al., 2016, 2018) and the ground-based survey DANCe (Dynamical Analysis of Nearby Clusters, Bouy et al., 2013) in a Bayesian membership algorithm. The resulting sample is expected to be significantly more complete and reliable than the one previously used by Smith et al. (2011) to study debris discs in this cluster. Their sample contained 40 spectroscopic low-mass members from Jeffries et al. (2009), 33 brighter stars selected with proper motions and photometry from the Tycho-2 catalogue (Høg et al., 2000), and two additional members from Prosser & Giampapa (1994). The recent Gaia DR2 astrometry allows to discard as non-members at a high level of confidence 24 of their 75 targets (32%), hence motivating a re-analysis of the cluster disc frequency.
2.1 Photometric database
| Instrument | Program ID |
|---|---|
| IRAC | 13102, 40601, 80072 |
| MIPS | 3347,40601 |
We used all the optical and IR photometry available in the DANCe catalogue111http://vizier.u-strasbg.fr/viz-bin/VizieR?-source=J/A+A/631/A57, i.e. . We also cross-matched (using a cross-match radius of 1″) our sample with the AllWISE catalogue (Wright et al., 2010) and found 704 sources with a counterpart in the (3.4 m), (4.6 m), (12.1 m), (22.2 m) bands.
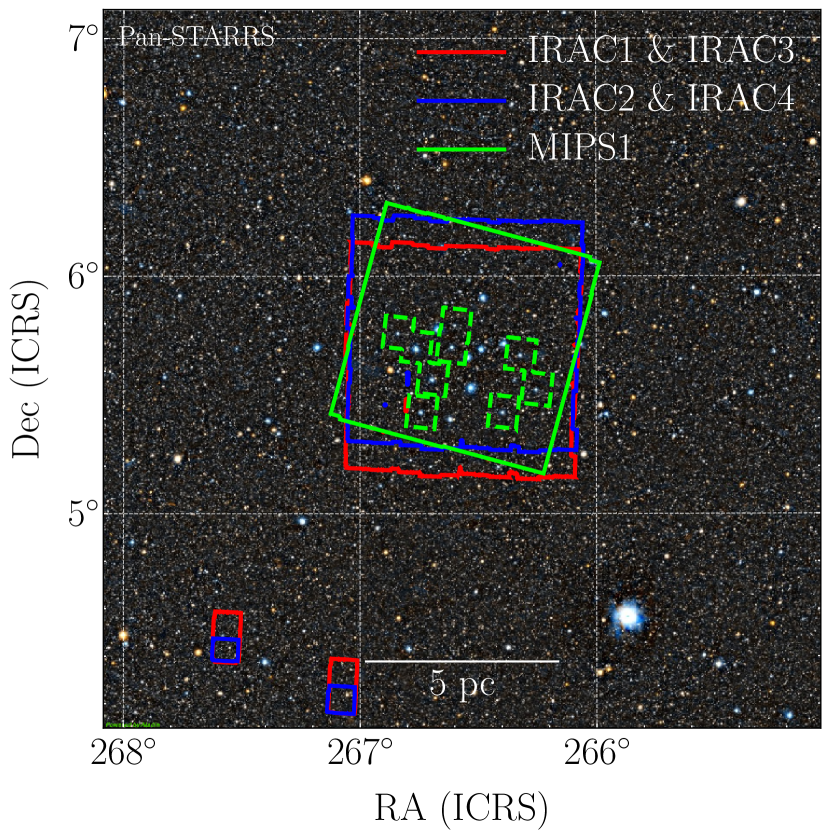
We queried the Spitzer Heritage Archive for all the IRAC1 (4.6 m), IRAC2 (4.5 m), IRAC3 (5.8 m), IRAC4 (8.0 m) and MIPS1 (24 m) data within a radius of 3° the estimated size of the cluster, around the centre. The program IDs of the observations in this area are given in Table 1 and the footprints of the various bands are displayed in Figure 1. The majority of the data come from program ID 40601 which has been analysed in Smith et al. (2011), but a significant number of images were added from program ID 3347 over part of the area. Our reduction began from the S18.25.0 pipeline-processed artifact Corrected Basic Calibrated Data (CBCD) in the case of IRAC, and from the S18.12.0 pipeline-processed Basic Calibrated Data (BCDs) in the case of MIPS. The self-calibration recommended in the Spitzer Data Analysis Cookbook was applied in the case of MIPS to remove artefacts as well as bright and dark latents present in the BCD images. We then combined these into deep mosaics using the recommended version 18 of MOPEX (MOsaicker and Point source EXtractor) provided by the Spitzer Science Center using the standard parameters (see the MOPEX User’s Guide for details on the data reduction).
In the case of IRAC, point sources were detected using SExtractor (Bertin & Arnouts, 1996), and their PRF-fitting photometry was measured using APEX, the photometry package that is part of MOPEX. According to the manual, the colour corrections tabulated in the IRAC and MIPS handbooks are marginal for our sources ( K) and we therefore neglected them.
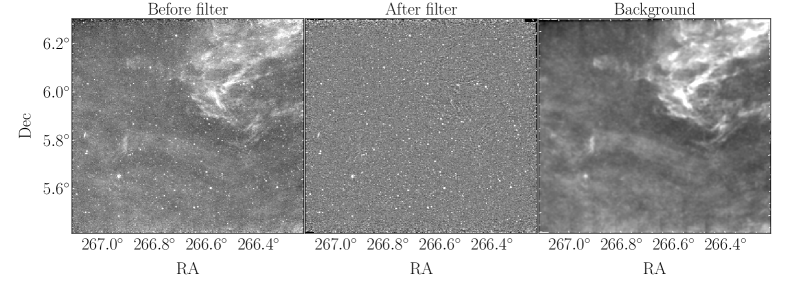
In the case of MIPS, an extra step was performed before extracting the sources and measuring their photometry. The presence of a bright extended nebulosity (see Fig. 2) indeed compromises the detection and measurements as the background estimations implemented in SExtractor and APEX are not optimised to deal with such extended emission. We therefore applied the nebulosity filter described in Irwin (2010) to the pipeline produced mosaic. A spatially variable Point Spread Function (PSF) was then computed using PSFEx (Bertin, 2013) and the final PSF photometry was extracted using SExtractor again. We verified that the SExtractor PSF and APEX fluxes were in good agreement within the uncertainties, but kept SExtractor measurements as it detected and deblended more sources than APEX. To calibrate the fluxes of SExtractor we used the APEX photometry as reference and computed a linear fit which resulted in a zero point of Jy. We applied this zero point to all the SExtractor fluxes, and its uncertainty was added quadratically to the flux error. To convert fluxes into magnitudes we used the magnitude zero points provided in the instruments handbooks. For IRAC they are 280.9 Jy, 179.7 Jy, 115.0 Jy, and 64.9 Jy for bands 1, 2, 3, and 4, respectively and for MIPS1 it is 7.17 Jy. As explained in the instruments handbooks, the estimated level of accuracy of the photometric measurements is of 3% for IRAC and 4% for MIPS1. Therefore, we also added these uncertainties in quadrature to the statistical flux uncertainties. We estimated the global offset of our sources with respect to Gaia DR2 and AllWISE to be in all bands inspecting the distribution of cross-match separations. The sources were then cross-identified with our input catalogue using a 2″ radius as maximum separation. The number of matches in each case is reported in Table 2. In Table 4 we provide the photometry used for the sources candidates of hosting a debris disc. An extended version of this table including all the photometric bands for all the members of IC 4665 is available at CDS.
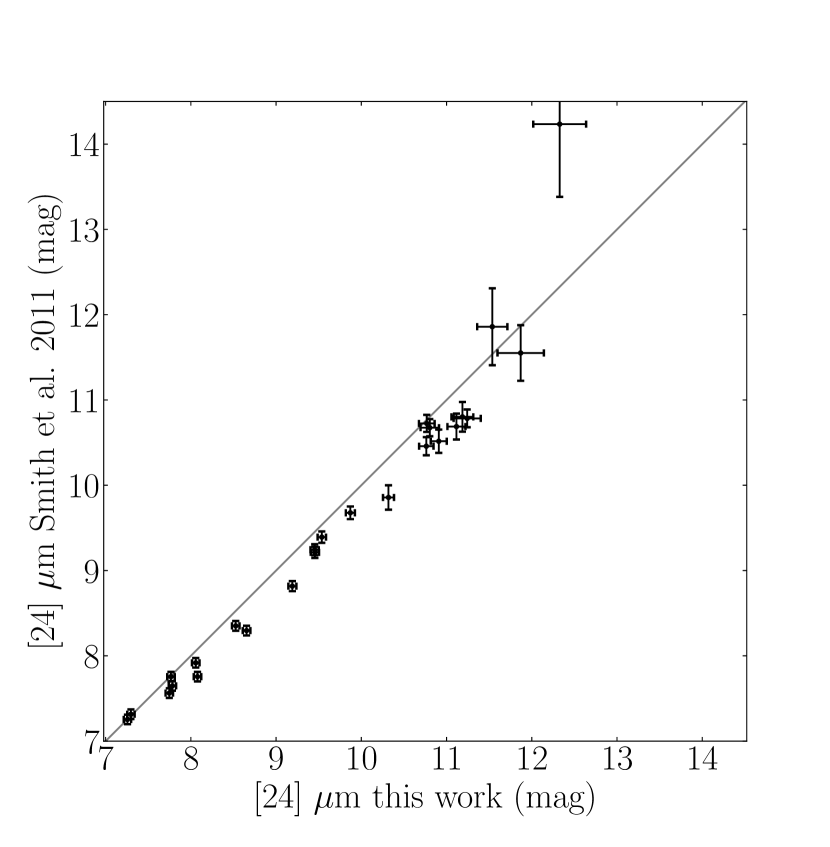
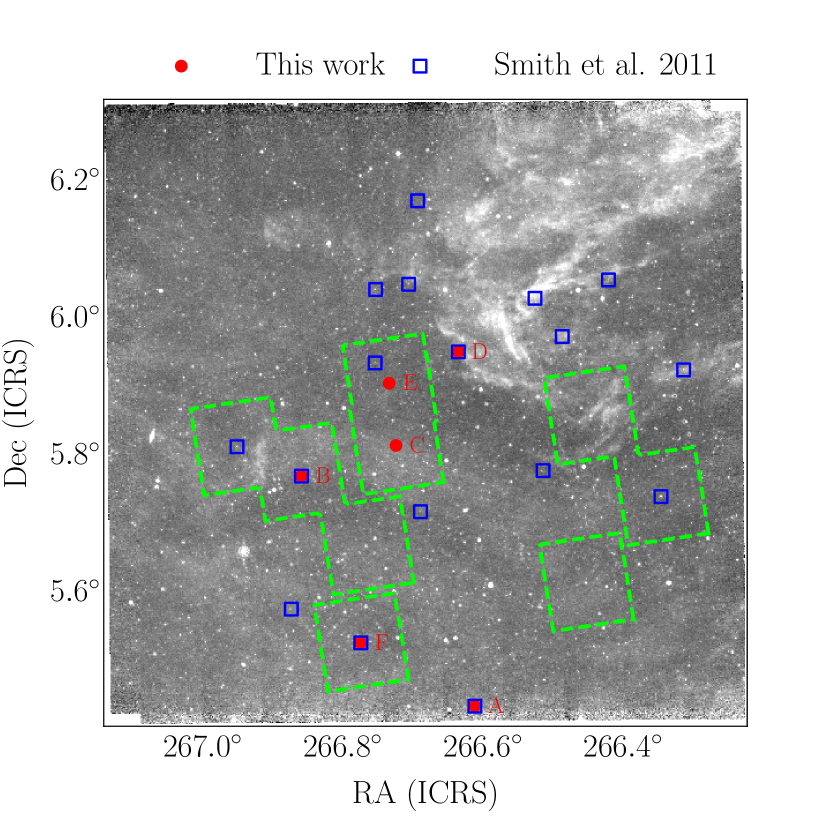
We compared the photometry obtained with the one published in Smith et al. (2011). The photometric measurements obtained in the four IRAC channels are consistent within the uncertainties except for a few objects close or above saturation. When we compared the MIPS1 photometry we found that for several sources their magnitudes are systematically lower than our measurements (see Fig. 3, top). We checked that our SExtrator PSF fits are good, as demonstrated by the very low levels of residuals and good reduced . We find several reasons to explain these differences. First, we used a more recent version of the pipeline (both MOPEX and APEX). In particular, it includes a significant background improvement thanks to the self-calibration of the data mentioned above. Second, we used a superior background subtraction with the nebulosity filter compared to the standard pyramidal median filtering used in SExtractor and MOPEX that produces local over-estimations that can severely affect the final photometry in regions of variable extended emission. Indeed, in Figure 3 (bottom) we see that several of Smith et al. (2011) sources with 24 m excess are in regions of nebulosity. We also note that other sources are in regions where our images are more sensitive since we combined the data of two programs (areas limited by green lines). Finally, we emphasise that we provide PSF photometry for all the objects while Smith et al. (2011) measured aperture photometry when their PSF fit failed.
2.2 Photometry filtering
| Initial | After filtering | |||
| Filter | Num. | Pct. | Num. | Pct. |
| 727 | 89% | 727 | 89% | |
| 698 | 85% | 698 | 85% | |
| 699 | 85% | 699 | 85% | |
| 566 | 69% | 566 | 69% | |
| 695 | 85% | 695 | 85% | |
| 766 | 94% | 766 | 94% | |
| 755 | 92% | 755 | 92% | |
| 789 | 96% | 789 | 96% | |
| 815 | 100% | 815 | 100% | |
| 781 | 95% | 781 | 95% | |
| 778 | 95% | 778 | 95% | |
| W1 | 704 | 86% | 577 | 70% |
| W2 | 704 | 86% | 560 | 68% |
| W3 | 704 | 86% | 148 | 18% |
| W4 | 704 | 86% | 18 | 2% |
| IRAC1 | 218 | 27% | 218 | 27% |
| IRAC2 | 219 | 27% | 219 | 27% |
| IRAC3 | 204 | 25% | 202 | 25% |
| IRAC4 | 200 | 24% | 199 | 24% |
| MIPS1 | 45 | 5% | 45 | 5% |
Photometric measurements can be affected by a number of problems (e.g. saturation, blending with a nearby source, cosmic rays, etc.) which can alter the true values and lead to unreliable measurements. Such contaminated photometric measurements can lead to a false IR excess detection or prevent the detection of a real excess. To minimise the impact of dubious photometric measurements, we applied filtering criteria specifically designed for each instrument.
The WISE photometry is well-known to be affected by a large number of artefacts which are identified and flagged in the AllWISE catalogue. Filtering these sources is essential to discard unreliable photometry. In this work we applied the following filtering:
-
•
”cc_flags”. We only keep sources with 0 flag, which means that they are unaffected by any of the known artefacts.
-
•
”ext_flg”. We only keep sources with 0 flag, which means that they are point-source objects, excluding extended objects.
-
•
”ph_qual” is the photometric quality flag. We consider flags A (SNR ) and B ( SNR ) as good quality photometry, flags C ( SNR ) as bad quality photometry, and flag U (SNR ) as an upper limit. The bad quality photometry and the upper limits are shown throughout our analysis but are not considered as reliable measurements.
For Spitzer observations, we discarded any detection with SNR . Detections with SNR are considered to be marginal and they should be considered with caution.
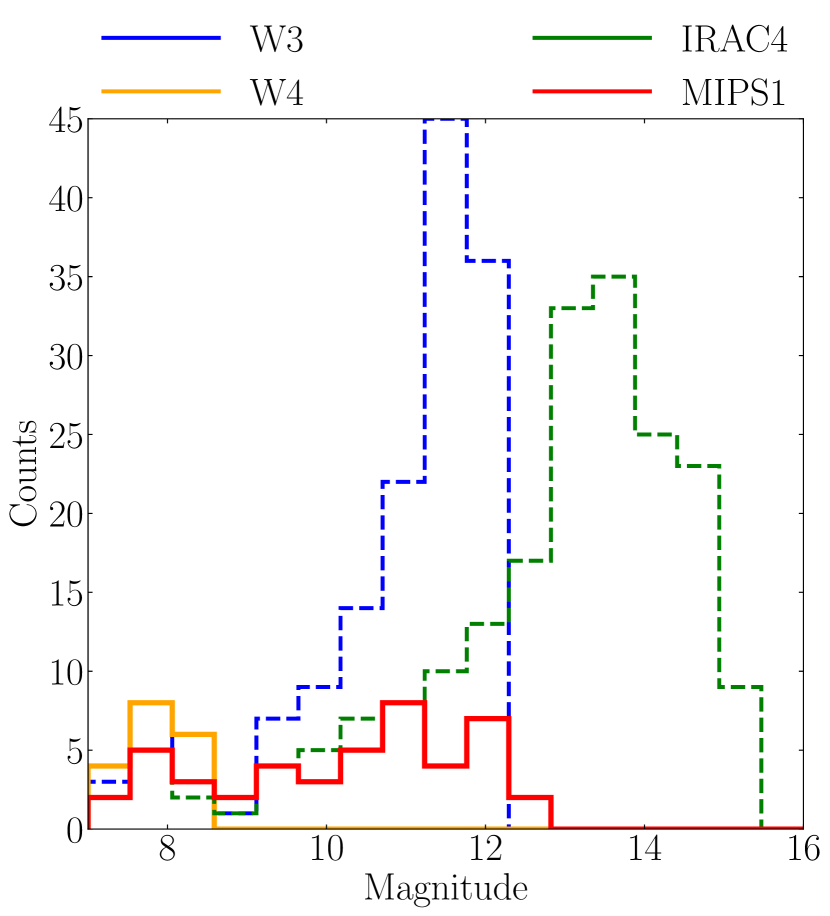
In Table 2 we report the number of sources detected in each band before and after the filtering process. In spite of their better sensitivity, the Spitzer images include less sources simply because they cover a smaller area (11°, see Fig. 1). Another important remark is that WISE detections are the most affected by our filtering criteria, specially at large wavelengths ( and ) where many sources are only detected as upper limits. In Figure 4 we see the magnitude distribution of the members of IC 4665 in the mid-infrared photometric bands. There are 45 sources with MIPS1 photometry in the magnitude range 7.2–12.4 mag. The detection limit of the channel at 22 m is slightly shallower and there are 18 sources in the magnitude range between 7–8.6 mag.
2.3 Completeness
One of the goals of this study is to measure the debris disc fraction of IC 4665. For that, defining a sample for which the photometric surveys are complete is crucial to interpret the results and compare with other studies. Establishing the completeness of photometric surveys can be a complex task, especially when variable extended emission is present (see Fig. 2).
In the following, we derive an estimate of the completeness limits of the photometric filters MIPS1 and . We take the maximum of the magnitude distribution of all the sources in the field of view (members and field stars) as the completeness limit. These distributions show a maximum around 11.8 mag for MIPS1 and around 8.5 mag for . We find no significant variations in the areas affected by the extended emission and, as a first approximation, use these numbers for the entire survey. To convert the completeness in magnitude to a fundamental parameter such as the mass, we used the BT-Settl atmospheric models of Allard (2014). At the age and distance of IC 4665, we find that the magnitude limit of MIPS1 corresponds to a temperature of 4 000 K and a mass of 0.75 M☉. This corresponds to a spectral type of mid-K (Table A5 from Kenyon & Hartmann 1995). The BT-Settl models do not cover the hottest objects and can not be used to convert the completeness limit in magnitude into a mass. Therefore, we followed a different approach and transformed the magnitude to a colour using an empirical relation defined by the members of IC 4665. The limiting magnitude of mag corresponds to an intrinsic mag (assuming an extinction A mag). This color corresponds to an effective temperature of 8 400 K and a mass of 1.75 M☉ according to the PARSEC-COLIBRI models (Marigo et al., 2017). This is equivalent to a spectral type of mid-A (Kenyon & Hartmann, 1995).
3 Infrared excess detection
In order to identify cluster members with debris discs, we use colour-colour diagrams to detect IR excesses at different wavelengths, a method that is entirely empirical. We chose to analyse the WISE and Spitzer data independently because of their significantly different wavelength coverage, spatial resolution and sensitivities.
3.1 MIPS 24 m data
.
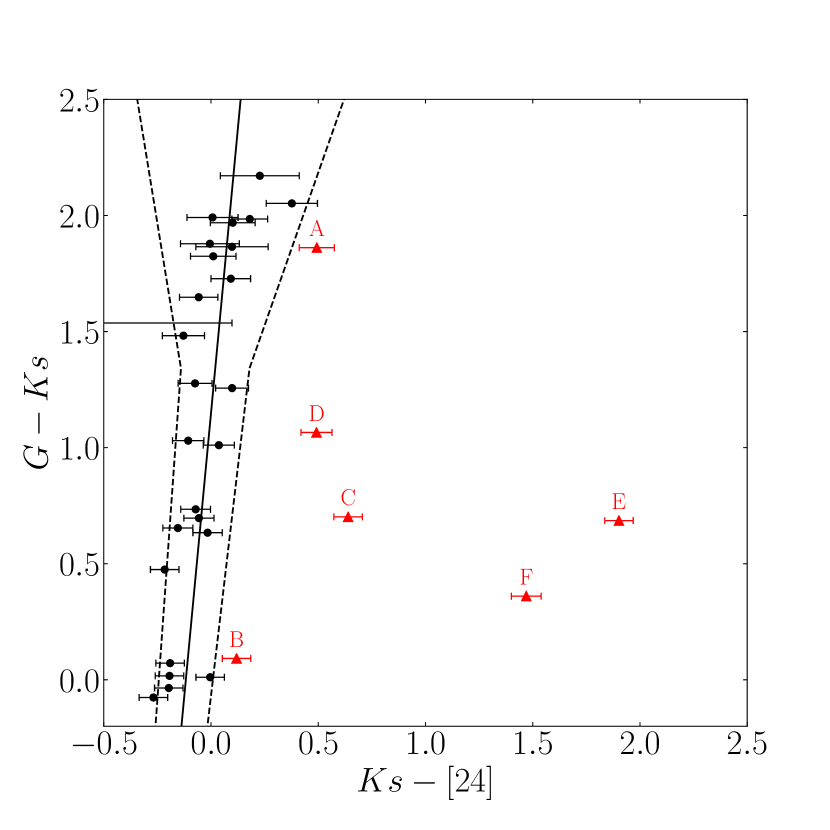
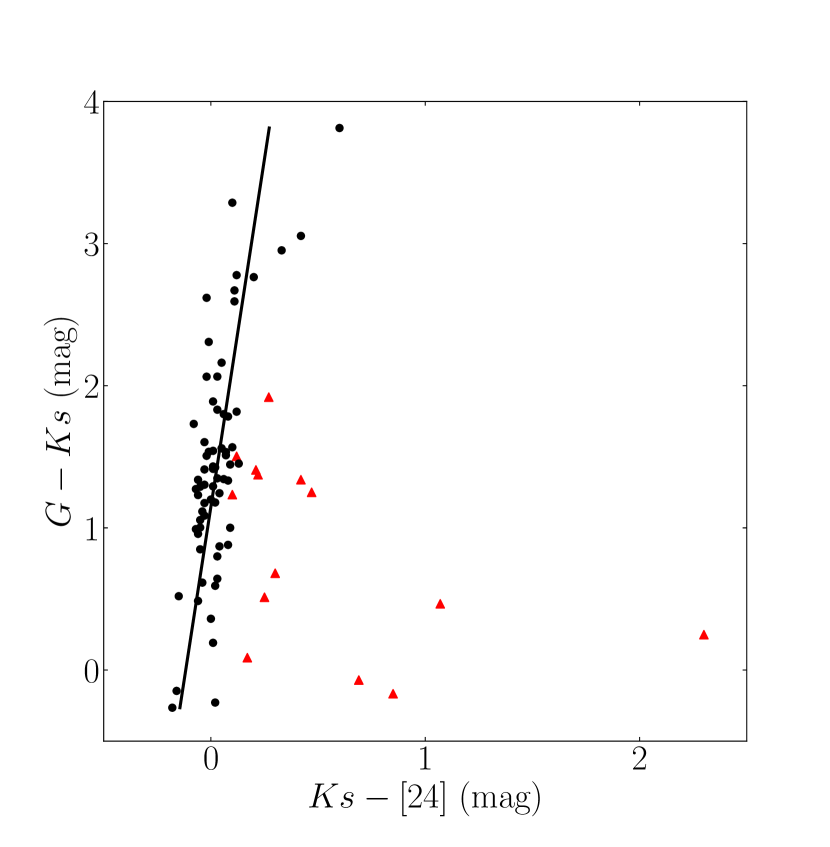
The photometric colour has been commonly used in the literature to detect sources with 24 m excess emission (e.g. Gorlova et al., 2006; Stauffer et al., 2010). We followed the methodology of these works and used colour-colour diagrams to discern between the excess and non-excess population. The only difference is that we used the photometry of the recent Gaia DR2 filter which is more precise, uniform, and extended than the Johnson filter.
In order to detect sources with IR excess, it is essential to first outline the location of the sources with photospheric colours (i.e. those which do not have an IR excess). We used the Spitzer observations in the Pleiades of Gorlova et al. (2006) to define the photospheric sequence in the colour-colour diagram. We note that this is the same approach that Gorlova et al. (2007) used for the 30–40 Myr cluster NGC 2547. Indeed, several authors have found similar relations in young clusters (e.g. Stauffer et al. 2010 for the Hyades, and Plavchan et al. 2009 for nearby young stars). We used only the reliable 24 m photometry for the Pleiades sources classified as not having excess by the authors222sources in their Table 2 with no asterisk.. Equivalently to what they did, we fitted a linear polynomial relation (see Fig. 12) and obtained:
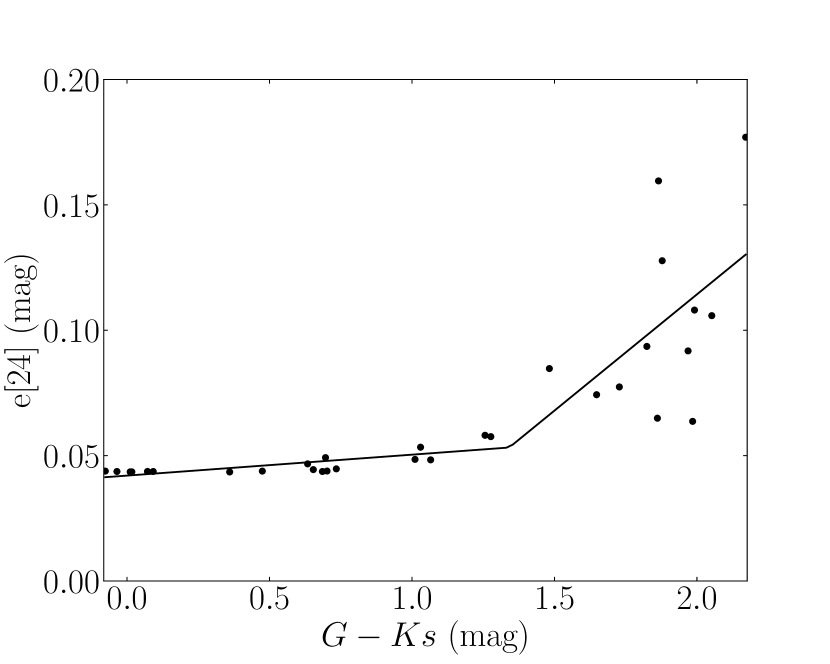
We used this relation to define the photospheric emission locus in our data. To establish a confidence interval in which we believe that there is no emission excess, we fitted a segmented linear function with two slopes to account for the fact that at high SNR the measures are dominated by photon noise and at low SNR by Poisson noise (see Fig. 13). The point of change in trend is a free parameter of the fitting process.
The parameters of the fit are mag, mag, , and .
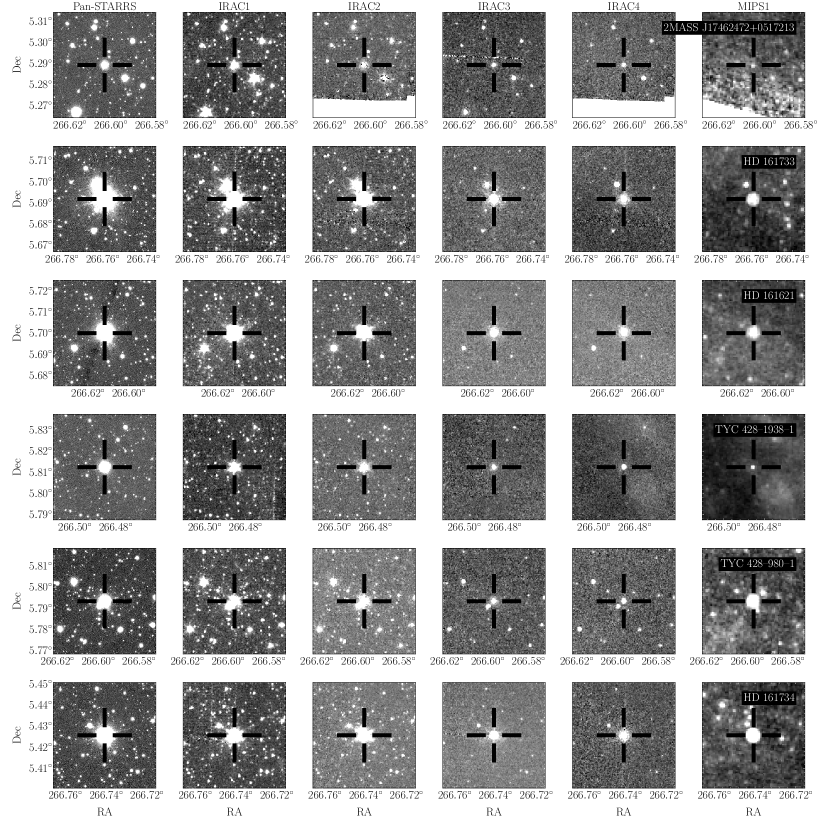
We consider that sources with a colour larger (within the uncertainties) than the photospheric emission locus plus the uncertainties of the 24 m photometry have an excess in the 24 m emission. According to this criterion, we find 5/45 candidates with excesses in the 24 m emission. Three (HD 161733, TYC 428-1938-1, and 2MASS J17462472+0517213) had already been reported by Smith et al. (2011) and the other two (HD 161621 and TYC 428-980-1) are new candidates. In Figure 6 we see that all the candidates have a clear detection in all the Spitzer photometric bands.
In the case of Smith et al. (2011), they detected 14 additional sources with 24 m excesses not present in our analysis. Four of them are simply not classified as members by Miret-Roig et al. (2019) and thus were not considered in this study. We have checked that three out of these four do not show any excess at 24 m according to our photometry. The fourth object (HD 161734) has WISE+Spitzer excesses in our photometry (see Figs. 5, 7, and 8) but it had a low membership probability (p = 0.002%) with Gaia in Miret-Roig et al. (2019) and therefore was not initially considered in this work. We refer to Sect. 5 for a more detailed discussion of this object. For the remaining 10 sources the MIPS 24 m photometry is significantly discrepant between the two studies (as shown in Fig. 3), which explains why they found an excess and we did not.
3.2 IRAC 3.6–8.0 m data
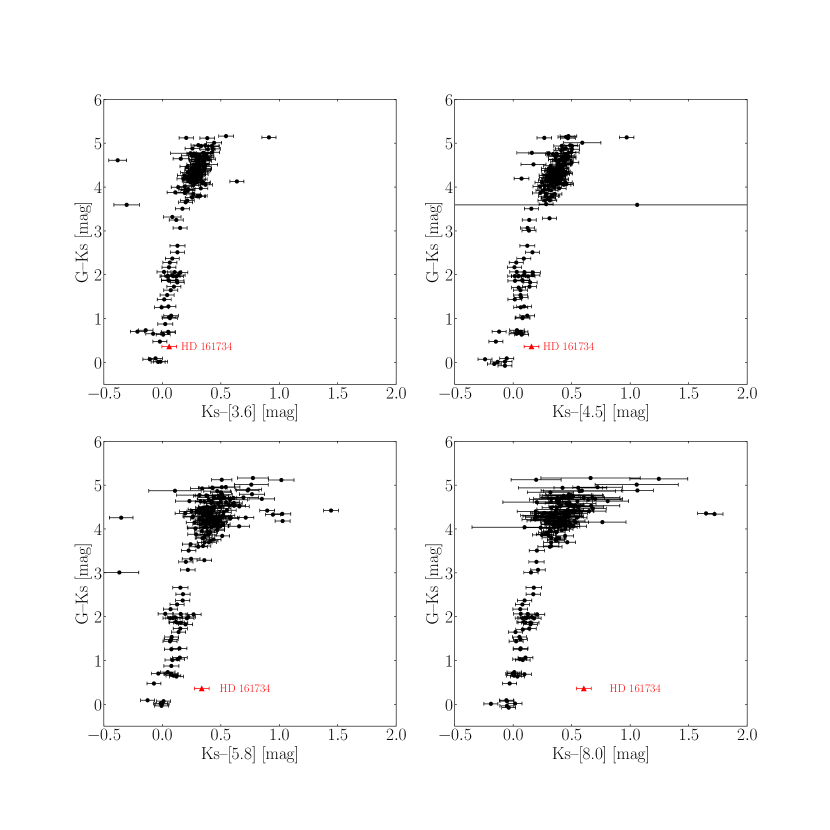
Similarly to what we did in Sect. 3.1 with the MIPS photometry, now we use the four channels of IRAC to search for possible candidates with a near-infrared excess. In Figure 7 we represent the colour-colour diagrams against . None of our members have an excess on any of the IRAC bands. There are a few points in each colour-colour diagram which seem to be much redder than the mean photospheric locus but none of them show an excess in two consecutive bands. These are spurious or blended detections in the images, or have a high of the PSF fit.
The source HD 161734 shows an increasing excess in the colour-colour diagrams of the IRAC channels. This excess was also detected by Smith et al. (2011) in the 5.8 and 8.0 m channels.
3.3 WISE 3.4–22.2 m data
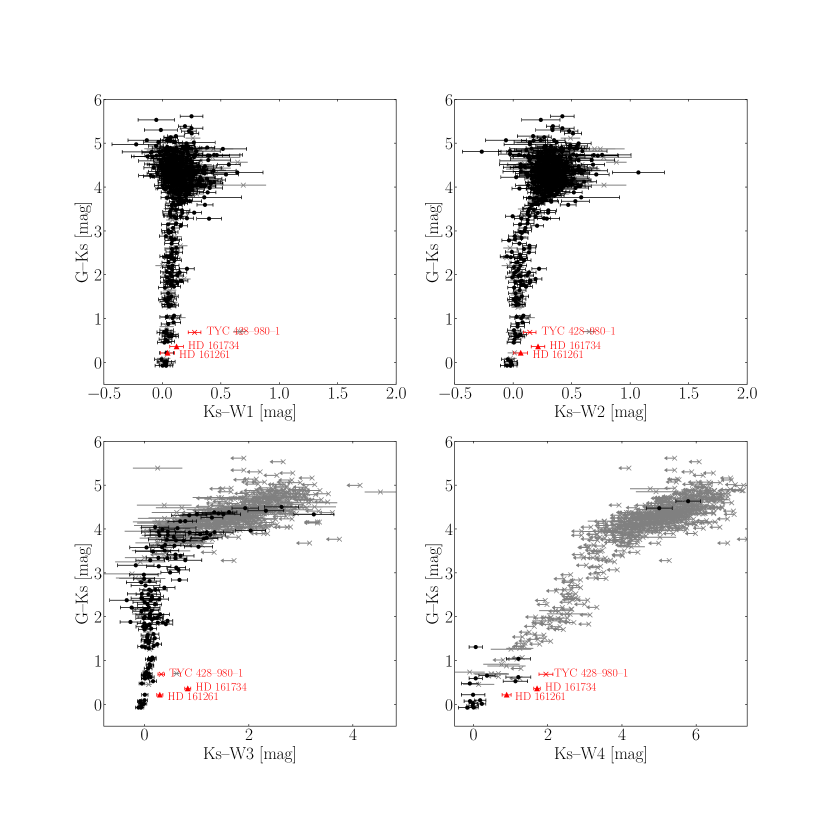
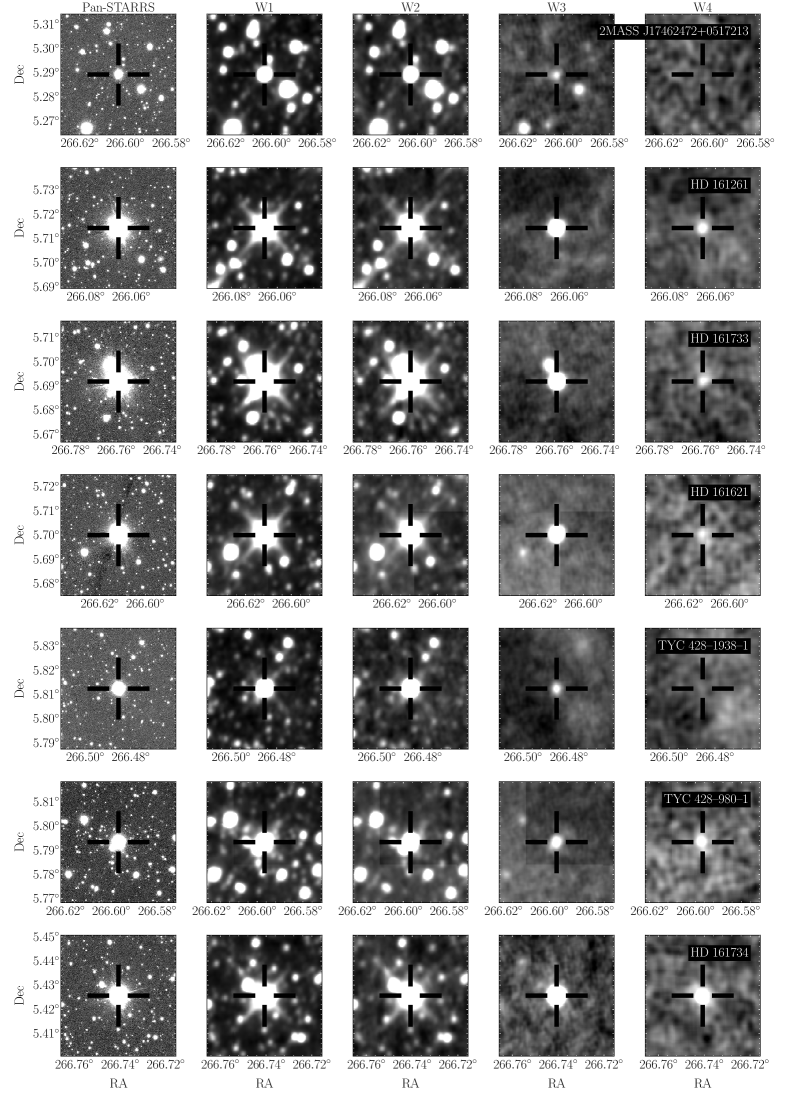
Similarly to what we did in Sect. 3.1 for MIPS and in Sect. 3.2 for IRAC, here we present colour-colour diagrams using the WISE photometry (see Fig. 8). The photometric measurements classified as ”good” are represented by black dots, according to the criteria defined in Sect. 2.2. In these panels we have also represented data classified as ”bad” to illustrate the loss of sensitivity at longer wavelengths, resulting in the overlap of good and bad quality data in (mainly for the coldest objects) and (almost along the whole cluster sequence). In the bands (3.4 m) and (4.6 m) we do not see any source with a significant excess, with the exceptions of TYC 428-980-1 which is flagged as a extended source by the WISE catalogue (probably due to the blending of nearby sources, see Fig. 9), and HD 161734 which shows an increasing excess in all the WISE bands.
In addition to HD 161734, in the (12 m) band we see two objects redder than the photospheric sequence defined by the majority of sources. One is HD 161261, a good candidate to host a debris disc since it also displays an excess in (22 m). Moreover, the WISE images of this source look clean (see Fig. 9). We note that this source is not covered by Spitzer because is not in the central area. The second source is TYC 428-980-1 which, as mentioned above, was initially discarded for being flagged as an extended object by the WISE catalogue. However, if we look at the WISE images (Fig. 9), we see that the source appears blended in the and bands, but not in and , where the object shows an increasing excess. In Section 5 we discuss this object more in detail, and explain if the nearby source detected at shorter wavelengths might be unresolved in and , with the subsequent contamination of the derived photometry.
As commented above, in bands and there is a significant increasing amount of ”bad” photometric measurements and upper limits. This is due to the limited sensitivity of WISE, and the increasing amount of diffuse emission present at those wavelengths.
There are a few sources at the limit of sensitivity which have not been flagged by WISE as ”bad” and seem to have an excess. We have checked the images and discarded them because they do not show any detected source.
4 SEDs
| Object | SpT (Ref.) | AG | T | T | A | T | T | Binary | New | ||||||
|---|---|---|---|---|---|---|---|---|---|---|---|---|---|---|---|
| (pc) | (mag) | (mag) | (K) | (K) | (mag) | (K) | (K) | ||||||||
| HD 161261 | B9 (1) | 8.26 | 0.62 | 9 132 | 8 842 | 0.6 | 12 000 | 11 250–13 000 | 4.5 | 10.0 | 32.8 | ? | Y | ||
| HD 161733 | B7(2)–B8 (1) | 7.96 | 0.43 | 9 124 | 8 740 | 0.65 | 15 000 | 14 000–16 914 | 5.0 | 5.2 | 2.3 | 12.6 | ? | N | |
| HD 161621 | A0 (1) | 9.45 | 0.61 | 7 886 | 0.4 | 8 250 | 7 250–11 000 | 4.0 | 9.0 | Y | Y∗ | ||||
| TYC 428-1938-1 | A (3) | 11.01 | 0.77 | 6 197 | 7 840 | 0.7 | 7 500 | 6 031–8 463 | 4.5 | 0.9 | 47.4 | N | N | ||
| TYC 428-980-1 | A2 (3) | 10.36 | 7 310 | 0.35 | 7 750 | 6 750–10 250 | 4.0 | 0.6 | 25.0 | 417.1 | N | Y | |||
| 2MASS J17462472+0517213 | G2–G3 (4) | 12.67 | 0.78 | 5 155 | 5 459 | 0.65 | 5 750 | 5 000–6 500 | 5.0 | 3.8 | 20.8 | N | N | ||
| HD 161734 | B8 (5)–A0 (1) | 8.82 | 0.75 | 8 478 | 8 420 | 0.9 | 13 000 | 10 705–14 000 | 4.5 | 5.9 | 150.0 | 320.3 | ? | N |
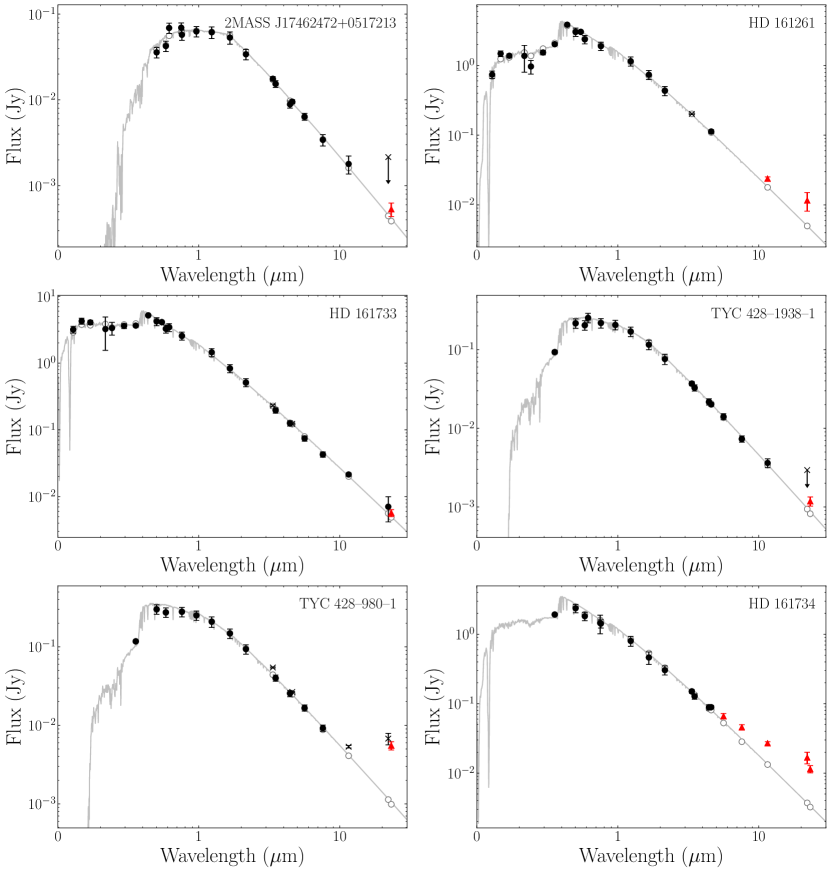
We used the Spanish Virtual Observatory (SVO) tool VOSA333http://svo2.cab.inta-csic.es/theory/vosa/ (VO SED analyser, Bayo et al., 2008) to further investigate the sources that show significant excesses in the colour-colour diagrams. We use VOSA to fit their SED in order to (i) confirm if the mid-IR excesses are automatically detected by the tool, and (ii) characterise the central sources more in detail.
We used all the photometry described in Sect. 2 excluding the filtered photometry, upper limits, and saturated measures. In addition, we used the VOSA interface to search for all the Ultraviolet (UV) photometry available. Since several targets are early-type stars, the filters in the bluest part of the spectrum are important to complete the SED. We computed Bayesian distances inferred using Kalkayotl444https://github.com/olivares-j/kalkayotl and the Gaia DR2 parallaxes. The resultant values are reported in Table 3. The extinction towards IC 4665 is not yet well constrained. The 3D dust map from Green et al. (2019) reports an extinction of mag at the position and distance of the cluster. Recently, Miret-Roig et al. (2019) estimated a median extinction of mag with the Gaia DR2 a_g_val and Anders et al. (2019) determined individual extinction values for our targets between 0.09–0.74 mag. In consequence, we let the extinction as a free parameter between 0–1 mag.
To find the best model which reproduces the observed SEDs, we used the option ”Chi-square Fit”. This option calculates the synthetic photometry from theoretical spectra for the filters with observed data, and applies a statistical test to find the model that best reproduces the data. The fitting algorithm is able to detect possible IR excesses and then, these points are no longer considered in the final fit. We used the theoretical atmospheres models of Kurucz (ODFNEW/NOVER models, Castelli et al. 1997) with solar metallicity. We allow VOSA to find the best in the interval 4–5, and the best temperature in the range K.
In Figure 10, we present the observed SEDs together with the best fit models, and in Table 3 we summarise some of their parameters. We see that VOSA independently finds an IR excess for six of the seven candidates for which an excess was detected in colour-colour diagrams (Sect. 3). The excess of HD 161733 is at the limit of the VOSA detection (, see Sect. 5). In Table 3 we report the effective temperature measured with different techniques. The effective temperatures from Gaia DR2 (T) are computed from the three photometric bands of Gaia, and two colours which can be strongly correlated. In addition, they have been obtained with a machine learning algorithm only trained on the range 3 000–10 000 K. Stars outside this range (which is the case of several of our candidates) can be systematically under- or overestimated (Andrae et al., 2018; Gaia Collaboration et al., 2018). The effective temperatures from Smith et al. (2011) (T) are obtained from the intrinsic colours through a relation provided by the authors. The differences between these two temperatures are of a few hundreds of Kelvin, similar to what Andrae et al. (2018) found in the validation of the Gaia DR2 effective temperatures. Additionally, we provide the effective temperatures of the theoretical atmospheric model which best fits the observed SED (T). In all cases, the temperatures from the SED fitting have higher values with respect to the two photometric temperatures, specially for the two hottest objects which have differences of thousands of Kelvins. In these cases, we trust more the effective temperatures from our SED fitting because they rely on a larger amount of photometric measurements from different instruments (i.e. not correlated), covering a large fraction of the spectra (UV-IR), and are derived using the individual parallaxes for each object. Additionally, our effective temperatures match better the spectral types determined in the literature (see second column of Table 3).
5 Candidates of hosting a debris disc
We detected seven stars with mid-IR excesses in one or several of the Spitzer and WISE bands. In this section, we discuss them one by one.
5.1 HD 161261
HD 161261 displays excesses in and and the images show a clear detection in both cases. This source is not in the central region of the cluster and thus is not covered by Spitzer. It is a new debris disc candidate. The effective temperature of the best theoretical atmospheric model is K, significantly higher than the values obtained by Gaia DR2 and Smith et al. (2011). However, it matches well with the spectral class B9 from Cannon & Pickering (1993).
Interestingly, this source is classified as a rotating ellipsoidal variable by the General Catalogue of Variable Stars (Samus’ et al., 2017), which implies that it could be a close binary system. However, we find neither any confirmation of the existence of this binary system nor any hint on the properties of the possible companion.
5.2 HD 161733
HD 161733 shows a small excess in MIPS 24 m data (see Fig. 5). It is also detected in , but the uncertainties of the photometry are large hindering a confirmation of this excess with WISE. The best fit SED corresponds to a model of T K, significantly hotter than the photometric temperatures of Gaia DR2 and Smith et al. (2011), but consistent with the strong Helium lines present in its spectrum (e.g. Levato & Mararoda 1977, Hubrig & Mathys 1996), and the spectral classification found in the literature (e.g. Kraicheva et al., 1980; Cannon & Pickering, 1993). The algorithm of VOSA did not detect an infrared excess for this source when both and MIPS1 are considered. We checked that the MIPS 24 m observation shows a significance excess of , at the limit of the algorithm detection. In fact, if we neglect the and photometry ( and are filtered in Sect. 2.2), VOSA automatically detects an excess with MIPS. Smith et al. (2011) also detected a 24 m excess for this source.
The multiplicity of this source has been discussed in different works and the results are not conclusive. It was included in the catalogue of spectroscopic binaries of Kraicheva et al. (1980), based on radial velocity studies (Abt et al., 1972; Pédoussaut & Carquillat, 1973). However, the works of Crampton et al. (1976) and Morrell & Abt (1991) did not report any RV variability after the analysis of several spectra. According to the work of Kraicheva et al. (1980), the masses of the primary and the secondary are 4.3 M☉ and 0.8 M☉, respectively. This mass ratio cannot explain the excess we observe since the contribution of a 0.8 M☉ star on the SED of a 4.3 M☉ star is negligible. These authors also determined the orbital period of the system days and a separation of AU. However the nature of the spectroscopic binary is not confirmed and more observations are needed to characterise this source.
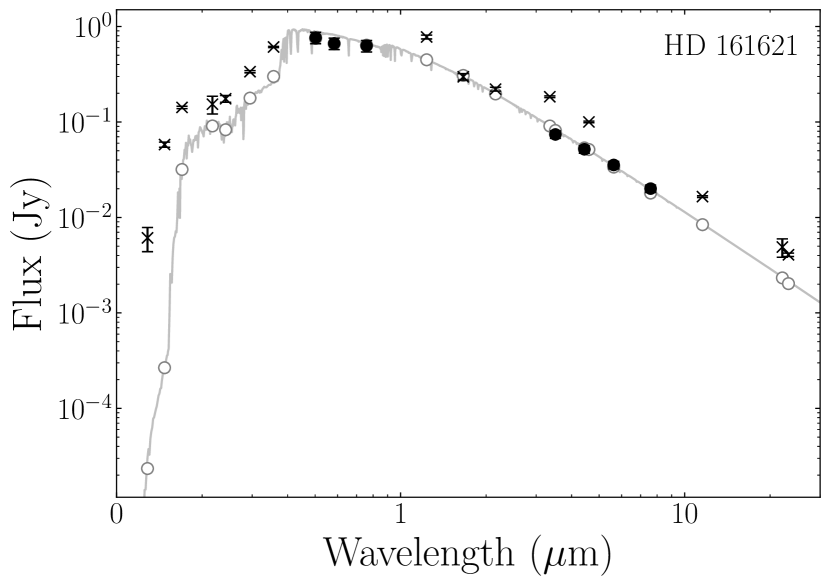
5.3 HD 161621
HD 161621 is a visual binary star with a separation of 3.2″(Mason et al., 2001). The companion is the source TYC~428-1977-1. The two companions have very similar magnitudes ( mag; mag), effective temperatures (7 886 K; 7 811 K), and parallaxes ( mas; mas) indicating it is an equal mass binary.
This system has a WISE counterpart at a separation of 1.6″ from the primary source, slightly larger than our initial search so we added the WISE photometry manually. This source is flagged as an extended object by WISE and we checked that it is not resolved by this instrument. In fact, this system is resolved by Gaia and IRAC, and unresolved by the International Ultraviolet Explorer (IUE), WISE and MIPS. 2MASS detects the two components but the photometry is flagged as contaminated.
We only used the photometry which resolved the system (Gaia and IRAC) to fit a SED (see Fig. 14). We can see that all the unresolved channels (crosses) provided a photometric measure systematically brighter than the predicted by the model. Our SED fit shows that the excess we detected with MIPS is in fact due to the companion since the excess is of 0.75 mag, exactly what we expect for an equal mass binary. For this reason, we no longer consider this source as a candidate to host a debris disc.
5.4 TYC 428-1938-1
TYC 428-1938-1 displays an excess in 24 m data which was already reported by Smith et al. (2011). This source has WISE photometry but the sensitivity of is too low to be detected in that channel (see Fig. 9) so we cannot use WISE to confirm this excess. The SED shows a 24 m excess with respect to the photospheric emission.
5.5 TYC 428-980-1
TYC 428-980-1 displays excesses in , , and MIPS 24 m. While the MIPS1 PSF fit shows a of 1.3, the source is flagged as an extended object in the WISE catalogue. Figures 6 and 9 show a close source at a separation of around but pc closer according to the Gaia DR2 parallaxes. Such a separation could be spatially resolved in the WISE bands (not in ), and in MIPS 24 m. The fact that this close source is detected neither in the band nor in the MIPS1 image implies that the detected emission is associated to the central star. The SED of this object (see Fig. 10) shows that the (22 m) and MIPS1 (24 m) excesses are compatible, making an extremely interesting new candidate.
5.6 2MASS J17462472+0517213
This source has an excess in MIPS at 24 m. We cannot confirm the excess with WISE since the this source is detected as an upper limit in . This is the coolest star for which we detect an IR excess. VOSA finds a best fit with a SED of 5 750 K consistent with the Gaia and Smith et al. (2011) effective temperatures and with an early G spectral type.
5.7 HD 161734
HD 161734 was not initially included in our sample because it has a low membership probability in Miret-Roig et al. (2019). However, Smith et al. (2011) and Meng et al. (2017) detected an excess emission from the near to mid-infrared which motivated us to study it further. With our new IRAC and MIPS photometric reduction, we also detect an excess. Additionally, we searched the WISE photometry finding an excess consistent with what is seen with Spitzer (see Fig. 10). Smith et al. (2011) mention in their conclusions that this source may be a binary. However, they did not mention on what they based their suspects and we did not find any reason to believe so. Based on its near-IR excess, they proposed that this source could have a remnant primordial disc. In fact, they can fit the excess with a 500 K blackbody, suggesting a dusty disc with a radius of 1.7 AU. Considering the members obtained with Gaia in Miret-Roig et al. (2019) the cluster has a median and standard deviation parallax of 2.84 mas and 0.36 mas, respectively. For the proper motions, the median and standard deviation are mas yr-1 and 0.64 yr-1 in right ascension and mas yr-1 and 0.68 yr-1 in declination. The Gaia DR2 astrometry of HD 161734 is mas, pmRA mas yr-1, pmDec mas yr-1. Therefore, we see that this source has a very precise Gaia DR2 astrometry which falls further than of the cluster distribution in all the spaces, specially in parallax which is a decisive variable for the membership analysis. However, we checked that this source has a photometry that agrees well with the main sequence of the cluster, and the fact that it shows a clear IR excess makes it a good debris disc candidate member. Future Gaia releases with improved astrometry might rise the membership probability of this source. In any case, the membership of Miret-Roig et al. (2019) has a true positive rate of , and this source is an example of the objects that could be missing in that list of members.
6 Discussion
We have estimated that our MIPS photometry is complete down to [24] (late-B to mid-K, see Sect. 2.3) in our sample. In this spectral range and in the central area covered by MIPS (37 pc2), the disc fraction of IC 4665 is 5/32 or %. This fraction is smaller (although compatible within the uncertainties) than the 27% rate reported in a previous study of this cluster, covering the same field of view and magnitude range (Smith et al., 2011). The main reasons for this difference are our improved image-processing techniques (see Sect. 2), the fact that we only provide PSF photometry and they mixed PSF and aperture photometry, and the different lists of members. We discarded most of their candidates, because their MIPS1 photometry was systematically brighter than ours (10 sources were rejected for this reason), and/or they are no longer classified as members after the analysis of the Gaia DR2 astrometry (3 sources were rejected for this reason).
Many studies in the literature provide the disc fraction for B–A stars and solar type stars, separately, in different clusters and star forming regions. To compare our study with these results, we have estimated these fractions in our sample. The B–A stars in IC 4665 have an intrinsic colour mag and, in this range, the disc fraction becomes 4/17 or %. If we apply the same selection to the sample of Smith et al. (2011) we obtain a disc fraction of 5/14 or % for B–A stars. Therefore, in this spectral range we also obtain a smaller disc fraction, although both are consistent within the uncertainties. We only detect one candidate in the spectral range F5–K5 (solar type stars) which results in a disc fraction of 1/11 or %. Smith et al. (2011) report a disc fraction of 10/24 or in the same spectral range which is discrepant with our results. Finally, we note that the disc fractions derived by us for early and solar-type stars are compatible within the relatively large uncertainties.
In the following, we compare the disc fractions obtained in this study with other young clusters and associations. This comparison should be regarded as tentative and taken with caution, given that the various studies quoted below have very different levels of sensitivity and/or completeness (see Wyatt 2008; Hughes et al. 2018, and references therein for a detailed discussion on the difficulties related to such comparisons). Additionally, the level of completeness and contamination in the list of members differs from one study to another and most of them are based on pre-Gaia members lists.
Gorlova et al. (2007) did a study analogous to the one presented here for the NGC 2547 open cluster. This is a very similar cluster in terms of age (30 Myr, Jeffries et al. 2006) and distance (400 pc). They imaged the inner regions which at the distance of the cluster corresponds to pc2, and were complete down to a spectral type of late-F in MIPS1. They found a B8–A9 excess fraction of 44% and a F0–F9 excess fraction of 33%. These values are significantly larger than what we find in IC 4665, although the authors do not provide uncertainties. We believe that the same reasons we discussed to explain the differences with the study of Smith et al. (2011) could apply to this discussion. Indeed, we checked that around 40% of their MIPS sample could be contaminants according to the Gaia DR2 astrometry.
Gorlova et al. (2006) studied the disc population of the intermediate age Pleiades cluster (120 Myr). They analysed Spitzer MIPS1 data of an area covering the central area of the cluster which at the distance of the Pleiades corresponds to an area of 14 pc2. They were complete down to a spectral type of K3, or even M2 in the regions with less nebulosity. They estimated the debris disc fraction of B–A members to be 25%. The value is very similar to the one found in IC 4665 and is consistent with a slow evolution of the 24 m excess in debris discs, with a characteristic timescale of 150 Myr (e.g. Siegler et al., 2007; Gorlova et al., 2006). However, the proximity of the Pleiades with respect to IC 4665 leads to a significantly smaller spatial coverage of this cluster, hindering a proper comparison of the disc fractions.
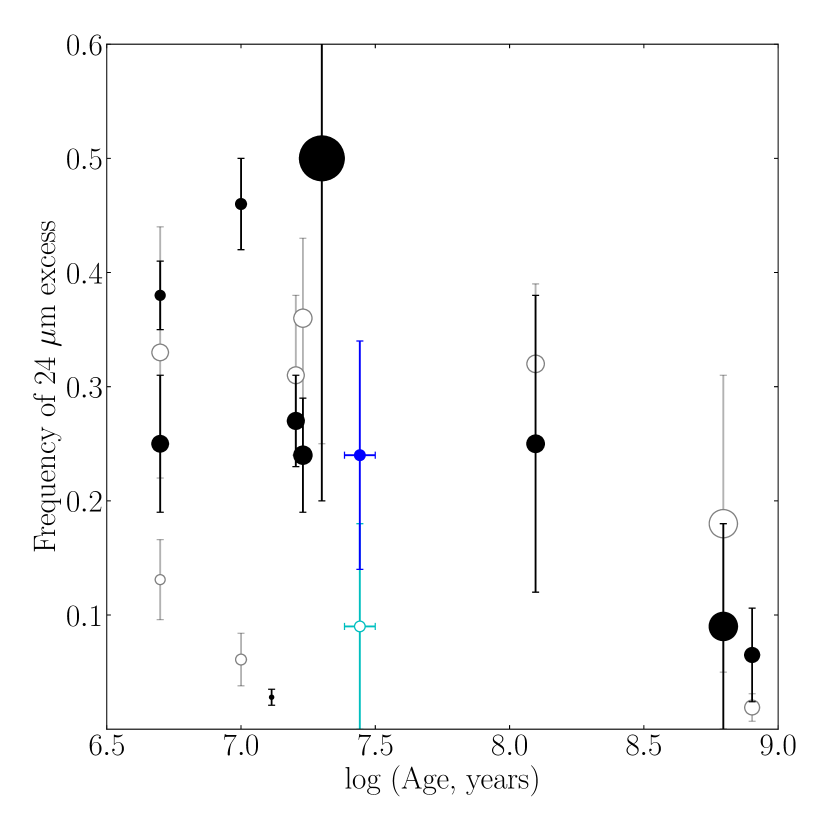
In Figure 11 we compare the disc fractions obtained in this study with several nearby clusters and associations reported in a recent work by Chen et al. (2020) for early and solar type stars. We see that our disc fraction for B–A stars is compatible with the disc evolution trend defined by the other clusters. The disc fraction we measure at 30 Myr is compatible within the uncertainties with clusters of 15–20 Myr (Upper Centaurus Lupus, Lower Centaurus Crux, and the Pictoris moving group) and with the Pleiades at 125 Myr. In the case of solar type stars, our disc fraction is smaller than that from clusters of 20 Myr which are at distances closer than 150 pc. Interestingly, our disc fraction is similar to the one reported in younger clusters (5–10 Myr) at similar distances (Orion OB1a and Orion OB1b).
Our Spitzer photometry of IC 4665 only covers the central of the cluster (see Fig. 1). However, according to the most complete membership analysis to date (Miret-Roig et al., 2019), the cluster has a size of at least 3° of radius. We estimated that MIPS1 observations only cover 55% of the B–A stars of the cluster by comparing the spatial distribution of all the B–A members in a circle of 3° radius (whole cluster area) with the same population in the area covered by MIPS data (). Therefore, the disc fractions we obtain with MIPS1 are in principle only valid for the central part of the cluster. Since we also have WISE photometry, which covers all the area occupied by the cluster (a circle of 3° radius in this case) we used it to to estimate the disc fraction. We obtain a fraction of 3/14 or 29% at 22 m () in the spectral range late–B to mid–A (see Sect. 2.3). This value is very similar to what we obtain with MIPS at the central region in the same spectral range 2/8 or %.
7 Conclusions
In this paper we presented a study of the debris disc population of the 30 Myr open cluster IC 4665. We identified six candidates with IR excess, two of which are new candidates. All of them have excesses at 22–24 m but not in the near infrared (except of HD 161734), indicative of the presence of dusty debris discs. Using MIPS data in the central part of the cluster, we computed a disc fraction of 2410% B–A stars. We only detected one solar type star resulting in a fraction of in the F5–K5 spectral type range. Using WISE, we extended the search to the outskirts of the cluster finding a similar result in the B–A range. We believe that the main differences between our results and the ones obtained in a similar study of this cluster (Smith et al., 2011) are mainly due to i) the fact that we used improved image-processing techniques, ii) we only measured PSF photometry and they combined PSF and aperture photometry, and iii) we worked with different member lists.
Comparing our disc fraction with other nearby clusters and associations we found that for early type stars our results are compatible with regions of 15–20 Myr (Upper Centaurus Lupus, Lower Centaurus Crux the Pictoris moving group), and 125 Myr (the Pleiades). For solar type stars we find a disc fraction lower than generally observed at 15–20 Myr. We would like to emphasise that all the studies we used to compare are pre-Gaia, meaning that the derived memberships (and in consequence disc fractions) should be revised with the new astrometry. Additionally, we have seen the importance of the image processing, specially at 24 m, where the images are strongly affected by nebulosities.
All our candidates were first detected in colour-colour diagrams and using an empirical photospheric sequence to define the non-excess locus. We also used the Kurucz atmospheric models to fit a SED and independently detect IR excess. As an extra product of this procedure, we obtained effective temperatures which are more accurate than the photometric ones available in the literature. Our candidates are good targets to be followed up with ALMA and with the future mission James Webb Space Telescope (JWST).
Appendix A Additional Tables and Figures
| Object | IRAC1 | IRAC2 | IRAC3 | IRAC4 | MIPS1 | ||||||||||
|---|---|---|---|---|---|---|---|---|---|---|---|---|---|---|---|
| (mag) | (mag) | (mag) | (mag) | (mag) | (mag) | (mag) | (mag) | (mag) | (mag) | (mag) | |||||
| HD 161261 | 8.260.05 | 8.040.05 | 8.00 | 0.02∗ | 7.98 | 0.02 | 7.75 | 0.02 | 7.15 | 0.11 | |||||
| HD 161733 | 7.960.05 | 7.870.05 | 7.85 | 0.03∗ | 7.89 | 0.02∗ | 7.87 | 0.02 | 7.69 | 0.15 | 7.920.03 | 7.920.03 | 7.990.03 | 7.920.03 | 7.750.04 |
| HD 161621 | 9.450.05 | 8.750.05 | 8.09 | 0.02∗ | 8.10 | 0.02∗ | 8.14 | 0.02∗ | 8.08 | 0.24∗ | 8.960.03 | 8.870.03 | 8.780.03 | 8.740.03 | 8.110.04 |
| TYC 428-1938-1 | 11.010.05 | 9.950.05 | 9.85 | 0.02 | 9.86 | 0.02 | 9.80 | 0.05 | 8.64 | 9.870.03 | 9.830.03 | 9.800.03 | 9.840.03 | 9.460.05 | |
| TYC 428-980-1 | 10.360.05 | 9.680.05 | 9.40 | 0.02∗ | 9.53 | 0.02∗ | 9.36 | 0.04∗ | 7.72 | 0.18∗ | 9.620.03 | 9.640.03 | 9.600.03 | 9.580.03 | 7.770.04 |
| 2MASS J17462472+0517213 | 12.670.05 | 10.810.05 | 10.81 | 0.02 | 10.66 | 0.02 | 10.56 | 0.09 | 8.97 | 10.690.03 | 10.800.03 | 10.650.03 | 10.670.05 | 10.320.06 | |
| HD 161734 | 8.820.05 | 8.460.05 | 8.34 | 0.02 | 8.25 | 0.02 | 7.64 | 0.02 | 6.75 | 0.07 | 8.400.03 | 8.310.03 | 8.130.03 | 7.860.03 | 6.990.04 |
Acknowledgements.
We acknowledge the referee for the exhaustive revision of our work which improved the quality of our study. We thank LM Sarro for his comments on the Gaia effective temperatures and the membership probability of HD 161734. This research has received funding from the European Research Council (ERC) under the European Union’s Horizon 2020 research and innovation programme (grant agreement No 682903, P.I. H. Bouy), and from the French State in the framework of the ”Investments for the future” Program, IdEx Bordeaux, reference ANR-10-IDEX-03-02. NH has been partially funded by the Spanish State Research Agency (AEI) Project No. ESP2017-87676-C5-1-R and No. MDM-2017-0737 Unidad de Excelencia “María de Maeztu”- Centro de Astrobiología (INTA-CSIC). This work is based [in part] on observations made with the Spitzer Space Telescope, which is operated by the Jet Propulsion Laboratory, California Institute of Technology under a contract with NASA. This publication makes use of data products from the Two Micron All Sky Survey, which is a joint project of the University of Massachusetts and the Infrared Processing and Analysis Center/California Institute of Technology, funded by the National Aeronautics and Space Administration and the National Science Foundation. This publication makes use of data products from the Wide-field Infrared Survey Explorer, which is a joint project of the University of California, Los Angeles, and the Jet Propulsion Laboratory/California Institute of Technology, funded by the National Aeronautics and Space Administration. This research has made use of the NASA/ IPAC Infrared Science Archive, which is operated by the Jet Propulsion Laboratory, California Institute of Technology, under contract with the National Aeronautics and Space Administration. This publication makes use of VOSA, developed under the Spanish Virtual Observatory project supported by the Spanish MINECO through grant AyA2017-84089. This work made extensive use of the following softwares and libraries: Parallel (Tange, 2011), astropy (Astropy Collaboration et al., 2013), Topcat (Taylor, 2005). This research has made use of the VizieR catalogue access tool, CDS, Strasbourg, France. The original description of the VizieR service was published in A&AS 143, 23.References
- Abt et al. (1972) Abt, H. A., Bolton, C. T., & Levy, S. G. 1972, ApJ, 171, 259
- Allain et al. (1996) Allain, S., Bouvier, J., Prosser, C., Marschall, L. A., & Laaksonen, B. D. 1996, A&A, 305, 498
- Allard (2014) Allard, F. 2014, in IAU Symposium, Vol. 299, Exploring the Formation and Evolution of Planetary Systems, ed. M. Booth, B. C. Matthews, & J. R. Graham, 271–272
- Anders et al. (2019) Anders, F., Khalatyan, A., Chiappini, C., et al. 2019, A&A, 628, A94
- Andrae et al. (2018) Andrae, R., Fouesneau, M., Creevey, O., et al. 2018, A&A, 616, A8
- Astropy Collaboration et al. (2013) Astropy Collaboration, Robitaille, T. P., Tollerud, E. J., et al. 2013, A&A, 558, A33
- Aumann et al. (1984) Aumann, H. H., Gillett, F. C., Beichman, C. A., et al. 1984, ApJ, 278, L23
- Bayo et al. (2008) Bayo, A., Rodrigo, C., Barrado Y Navascués, D., et al. 2008, A&A, 492, 277
- Bertin (2013) Bertin, E. 2013, PSFEx: Point Spread Function Extractor
- Bertin & Arnouts (1996) Bertin, E. & Arnouts, S. 1996, A&AS, 117, 393
- Bouy et al. (2013) Bouy, H., Bertin, E., Moraux, E., et al. 2013, A&A, 554, A101
- Cannon & Pickering (1993) Cannon, A. J. & Pickering, E. C. 1993, VizieR Online Data Catalog, III/135A
- Castelli et al. (1997) Castelli, F., Gratton, R. G., & Kurucz, R. L. 1997, A&A, 318, 841
- Chen et al. (2020) Chen, C. H., Su, K. Y. L., & Xu, S. 2020, Nature Astronomy, 4, 328
- Crampton et al. (1976) Crampton, D., Bernard, D., Harris, B. L., & Thackeray, A. D. 1976, MNRAS, 176, 683
- de Wit et al. (2006) de Wit, W. J., Bouvier, J., Palla, F., et al. 2006, A&A, 448, 189
- Gaia Collaboration et al. (2018) Gaia Collaboration, Brown, A. G. A., Vallenari, A., et al. 2018, A&A, 616, A1
- Gaia Collaboration et al. (2016) Gaia Collaboration, Prusti, T., de Bruijne, J. H. J., et al. 2016, A&A, 595, A1
- Giampapa et al. (1998) Giampapa, M. S., Prosser, C. F., & Fleming, T. A. 1998, ApJ, 501, 624
- Gorlova et al. (2007) Gorlova, N., Balog, Z., Rieke, G. H., et al. 2007, ApJ, 670, 516
- Gorlova et al. (2006) Gorlova, N., Rieke, G. H., Muzerolle, J., et al. 2006, ApJ, 649, 1028
- Gray & Corbally (2002) Gray, R. O. & Corbally, C. J. 2002, AJ, 124, 989
- Green et al. (2019) Green, G. M., Schlafly, E., Zucker, C., Speagle, J. S., & Finkbeiner, D. 2019, ApJ, 887, 93
- Høg et al. (2000) Høg, E., Fabricius, C., Makarov, V. V., et al. 2000, A&A, 355, L27
- Hogg & Kron (1955) Hogg, A. R. & Kron, G. E. 1955, AJ, 60, 365
- Hughes et al. (2018) Hughes, A. M., Duchêne, G., & Matthews, B. C. 2018, ARA&A, 56, 541
- Irwin (2010) Irwin, M. 2010, UKIRT Newsletter, 26, 14
- Jeffries et al. (2006) Jeffries, R. D., Evans, P. A., Pye, J. P., & Briggs, K. R. 2006, MNRAS, 367, 781
- Jeffries et al. (2009) Jeffries, R. D., Jackson, R. J., James, D. J., & Cargile, P. A. 2009, MNRAS, 400, 317
- Kalas et al. (2008) Kalas, P., Graham, J. R., Chiang, E., et al. 2008, Science, 322, 1345
- Kenyon & Hartmann (1995) Kenyon, S. J. & Hartmann, L. 1995, ApJS, 101, 117
- Kraicheva et al. (1980) Kraicheva, Z., Popova, E., Tutukov, A., & Yungelson, L. 1980, Bulletin d’Information du Centre de Donnees Stellaires, 19, 71
- Lagrange et al. (2010) Lagrange, A. M., Bonnefoy, M., Chauvin, G., et al. 2010, Science, 329, 57
- Lodieu et al. (2011) Lodieu, N., de Wit, W. J., Carraro, G., et al. 2011, A&A, 532, A103
- Manzi et al. (2008) Manzi, S., Randich, S., de Wit, W. J., & Palla, F. 2008, A&A, 479, 141
- Marigo et al. (2017) Marigo, P., Girardi, L., Bressan, A., et al. 2017, ApJ, 835, 77
- Marois et al. (2008) Marois, C., Macintosh, B., Barman, T., et al. 2008, Science, 322, 1348
- Mason et al. (2001) Mason, B. D., Wycoff, G. L., Hartkopf, W. I., Douglass, G. G., & Worley, C. E. 2001, AJ, 122, 3466
- Meng et al. (2017) Meng, H. Y. A., Rieke, G. H., Su, K. Y. L., & Gáspár, A. 2017, ApJ, 836, 34
- Miret-Roig et al. (2019) Miret-Roig, N., Bouy, H., Olivares, J., et al. 2019, A&A, 631, A57
- Moór et al. (2006) Moór, A., Ábrahám, P., Derekas, A., et al. 2006, ApJ, 644, 525
- Morrell & Abt (1991) Morrell, N. & Abt, H. A. 1991, ApJ, 378, 157
- Pédoussaut & Carquillat (1973) Pédoussaut, A. & Carquillat, J. M. 1973, A&AS, 10, 105
- Plavchan et al. (2009) Plavchan, P., Werner, M. W., Chen, C. H., et al. 2009, ApJ, 698, 1068
- Prosser & Giampapa (1994) Prosser, C. F. & Giampapa, M. S. 1994, AJ, 108, 964
- Rhee et al. (2007) Rhee, J. H., Song, I., Zuckerman, B., & McElwain, M. 2007, ApJ, 660, 1556
- Rieke et al. (2005) Rieke, G. H., Su, K. Y. L., Stansberry, J. A., et al. 2005, ApJ, 620, 1010
- Samus’ et al. (2017) Samus’, N. N., Kazarovets, E. V., Durlevich, O. V., Kireeva, N. N., & Pastukhova, E. N. 2017, Astronomy Reports, 61, 80
- Siegler et al. (2007) Siegler, N., Muzerolle, J., Young, E. T., et al. 2007, ApJ, 654, 580
- Smith et al. (2011) Smith, R., Jeffries, R. D., & Oliveira, J. M. 2011, MNRAS, 411, 2186
- Stauffer et al. (2010) Stauffer, J. R., Rebull, L. M., James, D., et al. 2010, ApJ, 719, 1859
- Tange (2011) Tange, O. 2011, ;login: The USENIX Magazine, 36, 42
- Taylor (2005) Taylor, M. B. 2005, in Astronomical Society of the Pacific Conference Series, Vol. 347, Astronomical Data Analysis Software and Systems XIV, ed. P. Shopbell, M. Britton, & R. Ebert, 29
- Wright et al. (2010) Wright, E. L., Eisenhardt, P. R. M., Mainzer, A. K., et al. 2010, AJ, 140, 1868
- Wyatt (2008) Wyatt, M. C. 2008, ARA&A, 46, 339
- Zuckerman et al. (2011) Zuckerman, B., Rhee, J. H., Song, I., & Bessell, M. S. 2011, ApJ, 732, 61