Salt, Hot Water, and Silicon Compounds Tracing Massive Twin Disks
Abstract
We report results of -resolution observations toward the O-type proto-binary system IRAS 16547–4247 with the Atacama Large Millimeter/submillimeter Array. We present dynamical and chemical structures of the circumbinary disk, circumstellar disks, outflows, and jets, illustrated by multi-wavelength continuum and various molecular lines. In particular, we detect sodium chloride, silicon compounds, and vibrationally excited water lines as probes of the individual protostellar disks at a scale of 100 au. These are complementary to typical hot-core molecules tracing the circumbinary structures on a 1000 au scale. The H2O line tracing inner disks has an upper-state energy of , indicating a high temperature of the disks. On the other hand, despite the detected transitions of NaCl, SiO, and SiS not necessarily having high upper-state energies, they are enhanced only in the vicinity of the protostars. We posit that these molecules are the products of dust destruction, which only happens in the inner disks. This is the second detection of alkali metal halide in protostellar systems after the case of the disk of Orion Source I, and also one of few massive protostellar disks associated with high-energy transition water and silicon compounds. These new results suggest that these “hot-disk” lines may be common in innermost disks around massive protostars, and have great potential for future research of massive star formation. We also tentatively find that the twin disks are counter-rotating, which might give a hint of the origin of the massive proto-binary system IRAS 16547–4247.
1 Introduction
Massive stars are the important sources of ultraviolet (UV) radiation, turbulent energy, and heavy elements in galaxies. Massive close binaries are the progenitors of merging black holes, which are detected by their gravitational wave emission. It is of prime importance to understand the formation process of massive stars (e.g., Tan et al., 2014). An essential question is whether or not massive protostars accrete through disks, as in low-mass star formation. Recent theoretical/numerical studies support the disk accretion theory (e.g., Rosen et al., 2016; Tanaka et al., 2017; Kuiper & Hosokawa, 2018). In particular, the shielding effect by the disk inside is the key to solving the longstanding radiation pressure problem (e.g., Wolfire & Cassinelli, 1987) in the formation of stars (Kuiper et al., 2010; Tanaka & Nakamoto, 2011). Simulations also predict that an accretion disk tends to be gravitationally unstable, which results in accretion bursts (Matsushita et al., 2017; Meyer et al., 2017, 2018) and the formation of companions (Krumholz et al., 2009; Rosen et al., 2016).
Thanks to the recent development of interferometers, especially the Atacama Large Millimeter/Submillimeter Array (ALMA), more and more disk/envelope structures around massive protostars with Keplerian-like rotation have been reported (see Hirota, 2018; Beltrán, 2020, for recent reviews). However, so far, the number of studies reaching the resolution of remains limited (Hirota et al., 2017; Ginsburg et al., 2018; Maud et al., 2019; Motogi et al., 2019; Johnston et al., 2020). The hot and dense nature of the surrounding material of massive protostars leads to the detection of rich molecular lines within , known as hot cores. One difficulty in the disk hunting is the lack of knowledge of which lines can trace the innermost region and separate the disk from the envelope. Recently, there have been some attempts to identify the disk with both kinematics and chemical patterns (e.g., Zhang et al., 2019a). However, there is no agreed-upon set of such molecular lines. This work will provide a tip for the disk-tracing line selection based on new ALMA observations.
Our target IRAS 16547–4247 (hereafter IRAS 16547) is an O-type protostellar object with a bolometric luminosity of , embedded in a clump within a radius of , at the distance of (Garay et al., 2003). Radio observations showed jets aligned in a northwest–southeast direction, across a scale of on the plane of the sky (Rodríguez et al., 2005, 2008). The presence of jets indicates ongoing accretion in the vicinity of the protostar. Recently, Zapata et al. (2015, 2019) reported a binary system seen as compact dusty objects with an apparent separation of , surrounded by a circumbinary disk, using ALMA observations. Using vibrationally excited CH3OCHO and CS transitions with upper-state energies of , Zapata et al. (2019) showed that the circumbinary disk is rotating with a Keplerian-like profile of an enclosed mass of . However, the dynamics at the several scale must be controlled by the individual binary protostars, which has not been well studied.
We report new multi-band ALMA observations toward IRAS 16547 with resolutions of at 1.3 and 3 mm. In this Letter, we mainly present the detection of sodium chloride, silicon compounds, and water lines as probes of the individual circumstellar disks. We propose that these inner-disk tracers may be common around massive protostars at the scale of , and valuable in understanding the disk properties in massive star formation.
2 Observations
The 3 mm and 1.3 mm observations were carried out with ALMA in Band 3 and 6 (ALMA project ID: 2018.1.01656.S). We also utilize the ALMA archived Band 7 (0.85 mm) data in project 2016.1.00992.S (Zapata et al., 2019). We summarize the information of the observations in Appendix Table 1. The data were calibrated using CASA (McMullin et al., 2007) pipeline v5.6.1. After pipeline calibration, we performed phase self-calibration for all the three bands using the continuum data combining line-free channels of all the spectral windows, and applied the self-calibration solutions to the line data. Images are made with CASA task tclean using the Briggs weighting with the robustness parameter of 0.5 for Band 3 and 6 data, and for Band 7 data. The resultant synthesized beams of the continuum images are as high as for all wavelengths (Table 1).
3 Results
3.1 Continuum
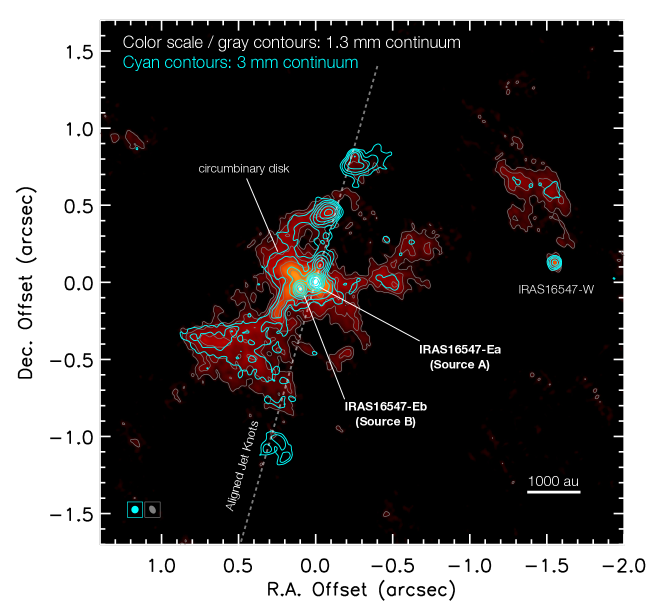
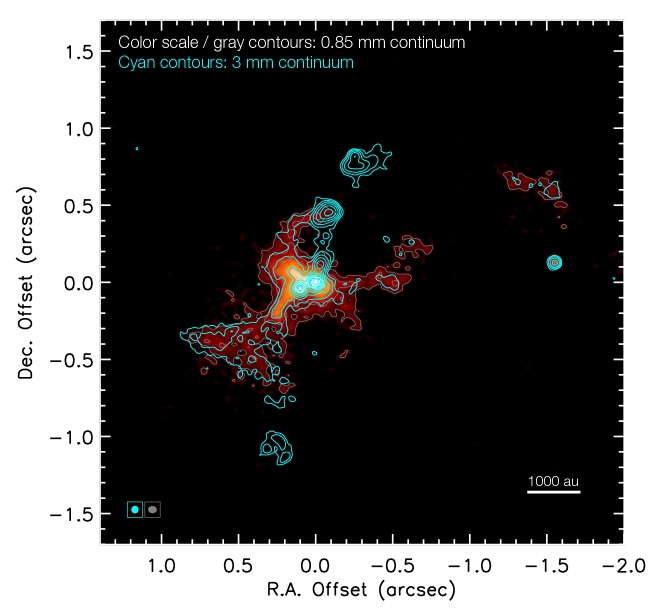
Figure 1 shows the 1.3 and 3 mm continuum maps. The dust emission dominates the 1.3 mm continuum, highlighting the circumbinary disk and outflow cavities, while the 3 mm continuum reveals the jet structures. The structures seen in the 1.3 mm continuum are very similar to those in 0.85 mm continuum (Appendix Figure 1), which was first reported by Zapata et al. (2019). Three protostars are prominent at all wavelengths, namely IRAS 16547-Ea and IRAS 16547-Eb (hereafter, sources A and B) forming the proto-binary with an apparent separation of , and a much weaker third source IRAS 16547-W. Using the 0.85 mm fluxes, which are less affected by the free-free emission than the 1.3 and 3 mm fluxes, we evaluate circumstellar disk masses of and around sources A and B within a radius of () assuming a dust temperature of (Appendix B). The proto-binary is surrounded by a circumbinary disk of , outflow cavities are seen on the northern and southern sides of the circumbinary disk (see also Zapata et al., 2019).
The 3 mm continuum newly reveals jet knots from source A aligned in a northwest–southeast direction, which is consistent with the orientation of the central radio source detected by centimeter observations (; Rodríguez et al., 2005, 2008). The resolution of the ALMA observation is an order of magnitude higher than those in the previous radio observations, which allows us to spatially resolve this central radio source into sources A and B and several jet knots, and to determine that the jet originates from source A. The jet orientation is also close to the elongated distribution of water masers (Franco-Hernández et al., 2009). The prominence of the proto-binary and jet knots in 3 mm continuum suggests that they are dominated by free-free emissions, and the jet knots may also contain significant synchrotron contributions. We leave the detailed analysis of the multi-band continuum to a forthcoming paper.
3.2 Lines
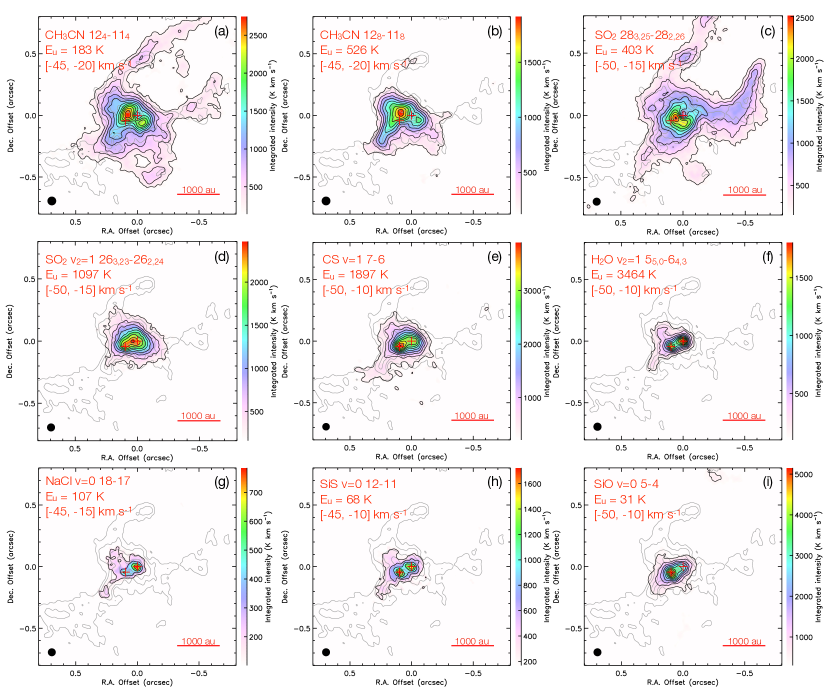
Rich molecular lines are detected in IRAS 16547, especially in Bands 6 and 7. Figure 2 shows the integrated intensity maps of representative emission lines, which trace different components in the proto-binary system from the circumbinary disk to the individual circumstellar disks (see Appendix A for the summary of the lines presented in this work). Methyl cyanide CH3CN, which is commonly used as a disk tracer toward massive protostars (e.g., Johnston et al., 2015, 2020; Beuther et al., 2017), associates with the circumbinary disk and the outflow cavity at the 1000 au scale (panels a and b). We detect the CH3CN – -ladder from to with excitation temperatures from to . Here as representatives, and lines are shown as they are less contaminated from neighboring lines. The emission of sulfur dioxide SO2, another typical hot-core molecule, with , also traces the circumbinary disk and the outflow cavity (panel c). However, peaks of these lower-energy transitions of CH3CN and SO2 with do not coincide with the positions of sources A and B, due to self-absorption and/or absorption against the compact continuum sources in slightly redshifted velocities, indicating that they trace the outer cooler infalling material. This wide distribution makes it difficult to study the innermost regions of a few hundred au by these lines.
On the other hand, the vibrationally excited transitions of SO2, CS, and H2O with upper-state energies of trace the innermost region of the circumbinary disk and the individual protostellar disks (panels d–f). In particular, the H2O emission with is concentrated at the positions of sources A and B (panel f; the extended emission comes from contamination of other lines; see Figure 3(d)). Such a high upper-state energy reflects the high temperature of protostellar disks in massive star formation at several hundred au. With lower , the SO2 and CS lines also trace the rotation of the circumbinary disk on the 1000 au scale (see below). We note that Zapata et al. (2019) first reported the CS emission tracing the rotating circumbinary disk, but its connection to the individual circumstellar disks were not known.
Furthermore, we found that the emissions of NaCl, SiO, and SiS are also concentrated in the vicinity of the protostars (panels g–i; again the extended emissions come from contamination of other lines). These lines are not detected in the 1000 au scale, although they have the low upper-state energies of , and their critical densities of – are not high. This fact indicates that these refractory molecules are enhanced only in the innermost regions of several hundred au. It is worth noting that this is the second reported detection of the alkali metal halide, NaCl, in protostellar systems after the Orion Source I disk (Ginsburg et al., 2019; Wright et al., 2020).
Appendix Table 1 summarizes the emission lines presented in this Letter. We note that some other transitions of NaCl, SiO, SiS, and vibrationally excited H2O are also detected, which will be reported in a future paper.
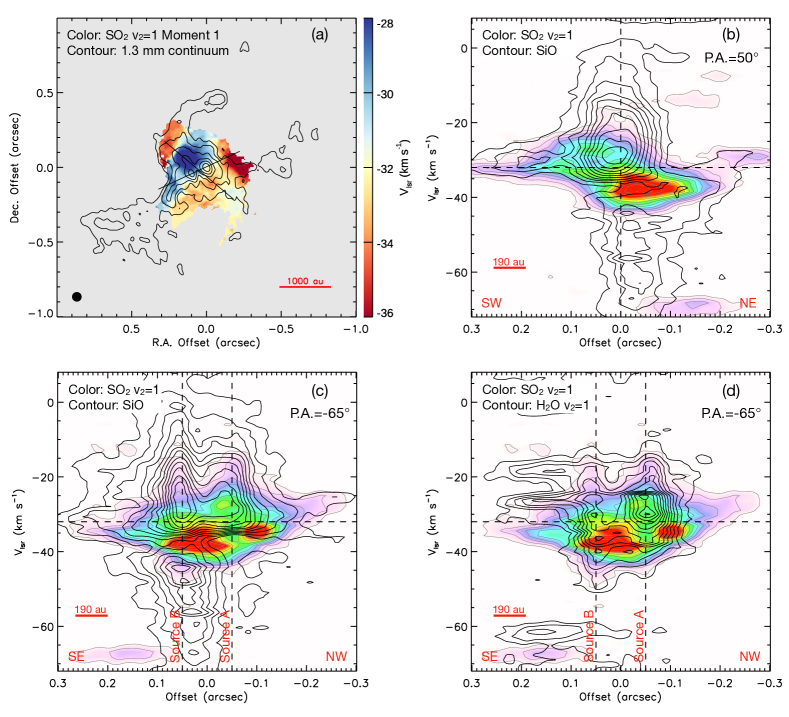
Using these lines, we can illustrate the kinematics from the circumbinary disk to the individual circumstellar disks. Figure 3a presents the moment 1 map of the SO2 line, showing the rotation of the circumbinary disk as reported by Zapata et al. (2015, 2019). The systemic velocity of IRAS 16547 is about (Garay et al., 2003). The rotation direction is consistent with the elongation of the circumbinary structure. Following Zapata et al. (2015, 2019), we plot the position-velocity (PV) diagrams along the major axis of the circumbinary disk (P.A.=), passing between sources A and B (panel b). The PV diagram of the SO2 line shows a rotational profile with velocity increasing toward the center. However, inside , or , the SO2 emission does not show the high-velocity component, which is expected for the Keplerian disk. Instead, the SiO emission nicely traces the central high-velocity components up to .
Figure 3c shows the PV diagrams of the SO2 and SiO emissions along a slit passing through sources A and B (P.A.). This PV diagram is clearly not a simple Keplerian profile inside , suggesting that the two protostars dominate the dynamics at this scale. Not only the SiO line but also the SO2 line shows the high-velocity components (especially in redshifted velocities), associated with sources A and B. The same is also seen in the PV diagrams of the H2O emission with P.A. (panel d), where the hot-water emission prominently shows two circumstellar components. These indicate that the rotation around the binary system is smoothly connected to the rotation around the individual protostars. The two circumstellar components are not quite parallel in the PV diagrams, judging from the different direction of velocity gradient. This suggests misalignment of the rotation directions between the twin disks (see below). We note that the contaminations by other lines are seen, extending to the southeast direction at and . We have not been able to identify these contamination lines. This source is rich in complex organic molecules, and a simultaneous check through the whole spectrum ranges is required for accurate line identification, which is left for future work.
We note that the blueshifted emission of SiO in source A is missing, probably due to self-absorption (see Figure 1), indicating that the SiO emission traces the outflowing material. However, as opposed to the commonly seen extended SiO emissions tracing shocked regions along the outflow, here the compact morphology of SiO and its close association with the two protostars suggest that it traces the material just launched from the disks or the surface layers of the disks, which can show both rotation and outflowing motions (e.g., Hirota et al., 2017; Maud et al., 2019; Zhang et al., 2019a).
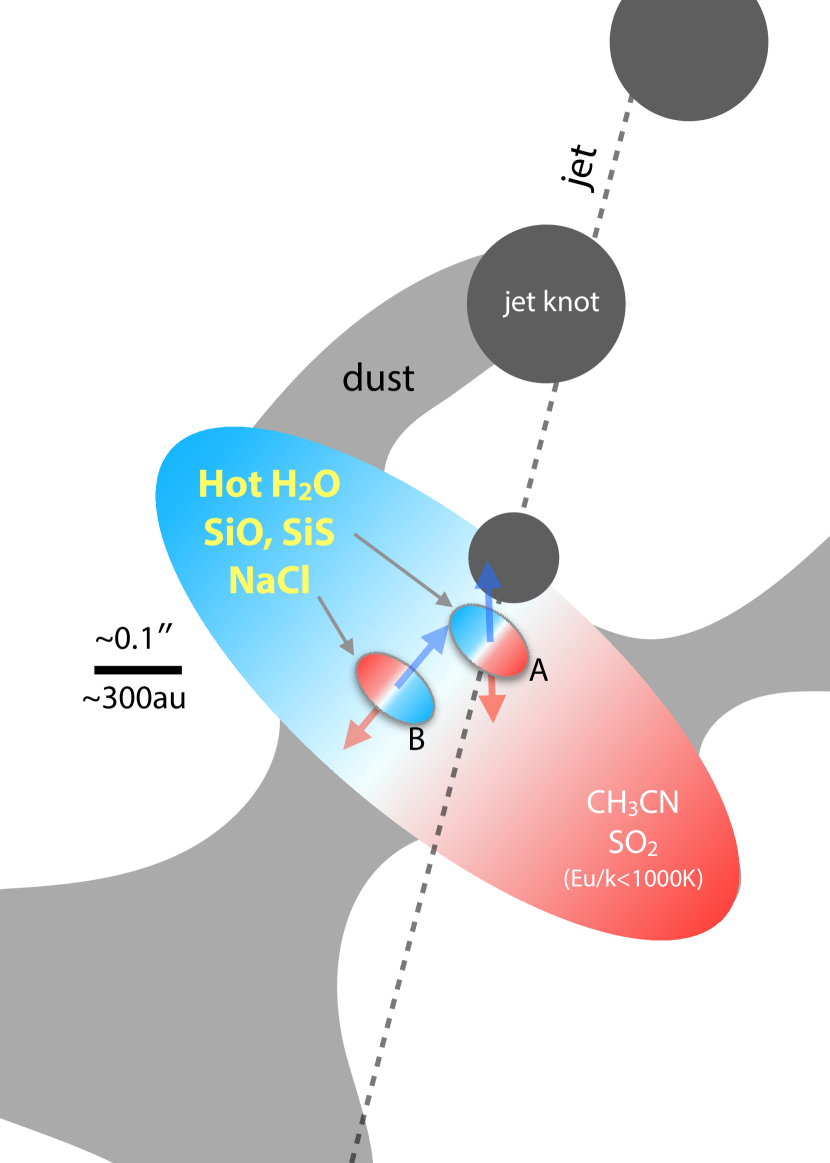
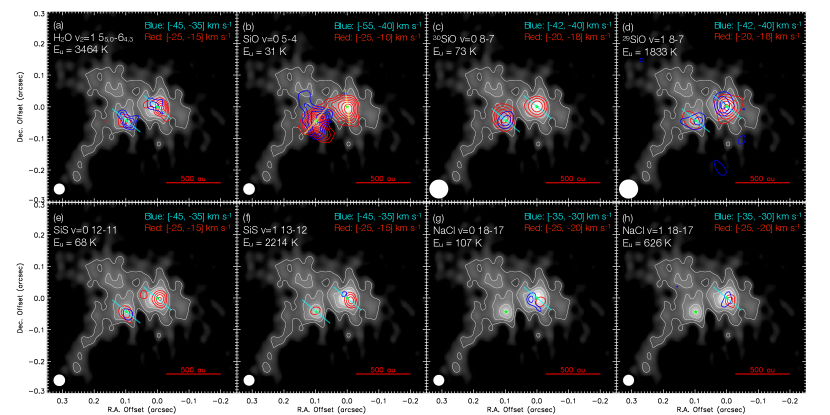
Figure 4 shows the blue- and redshifted emissions of selected lines of water (panel a), silicon-compound (panels b–f), and sodium chloride (panels g–h). To better resolve the kinematics of the individual circumstellar disks, for the lines in Band 6, we further improve the resolution to (), by emphasizing data with longer baselines using a robust parameter of . For source A, the H2O and NaCl emissions show velocity gradients in a northeast–southwest direction, which is similar to the rotation direction of the circumbinary disk (P.A.). Therefore, we interpret this velocity gradient as the disk rotation of source A. This orientation is also consistent with the rotating structure traced by water maser (Franco-Hernández et al., 2009) around source A. We note that this disk feature is not affected by the extended contaminations seen at and in Figure 3d, because they are significantly weakened by emphasizing the longer baselines. The disk A rotation is more difficult to identify in silicon-compounds emissions because these emissions could be blended with the outflowing motion. The velocity gradients of the emissions of SiO and 30SiO are ambiguous due to the strong absorption in the blueshifted component. For the SiO emission, comparing the redshifted emission position and the continuum peak position gives a velocity gradient direction in , which could be the outflow direction (or the direction between the outflow and the disk rotation). If this is the case, resembling the typical star-formation picture, the outflow direction would be nearly perpendicular to the disk rotation, and close to parallel with the jet-knot orientation. On the other hand, the velocity gradient of the vibrationally excited 29SiO line is consistent with the disk A rotation, as this line is optically thinner than the SiO line due to its rarity and high-excitation state. For SiS, redshifted components of and lines roughly follow the same velocity gradients seen by H2O and NaCl, suggesting the existence of SiS in the disk. However, the blueshifted component is missing in the low excitation () map, probably due to the similar reason for SiO. The NaCl lines trace the disk components even for the lower excitations, suggesting NaCl does not exist in the outflow unlike silicon compounds.
In source B, the velocity gradients seen in the emissions of H2O, 30SiO, 29SiO, and SiS are close to parallel to the disk A rotation, but in the opposite direction, suggesting that the circumstellar disk of source B is rotating in the opposite direction to the disk A and the circumbinary disk. The high-velocity component of the SiO emission again shows a gradient perpendicular to the disk rotation, which may also trace the outflowing motion, similar to source A.
4 Discussions
4.1 Salt, Silicon Compounds, and Hot Water
as Disk Probes
Based on the new high-resolution ALMA observations, we identify two groups of molecular lines tracing the innermost 100 au scale of the massive binary system IRAS 16547. The first group is the vibrationally excited “hot” lines with . Especially, the H2O line with nicely traces the individual circumstellar disks. The second group is the refractory molecules, i.e., alkali halides (NaCl) and silicon compounds (SiO and SiS) in the case of IRAS 16547. The lines of refractory species do not necessarily have high excitation of , but they trace only the innermost regions around the circumstellar disks. This fact indicates they are released to the gas phase within the disks on the 100 au scale. The production pathway of these gas-phase refractory molecules is probably through the destruction of dust grains, e.g., sputtering under strong shocks or radiation, and thermal desorption from grain surfaces. SiO and SiS are likely released to the gas phase in the disk and then launched to the outflow, as they are associated with both the disks and the outflows. Further multi-line high-resolution observations and their excitation analysis will be crucial to investigate chemical origin of those species.
Some previous observations have reported similar molecular lines tracing the innermost regions of massive protostellar sources. Orion Source I has been intensively studied as it is the closest massive protostar candidate at a distance of . All the disk-tracing molecules reported here, i.e., H2O, SiO, SiS, and NaCl, are detected in Orion Source I’s disk and wind launched from the disk (Hirota et al., 2012, 2014, 2017; Ginsburg et al., 2019; Wright et al., 2020). Moreover, emission lines of aluminum monoxide (AlO), one of the most refractory materials, are also found to be associated with the central region of Orion Source I (Tachibana et al., 2019). However, Orion Source I might not be the prototypical massive protostar because it has some peculiar features, e.g., the lack of an envelope, and the association of extremely strong SiO masers. Some claimed that Orion Source I could be an evolved star rather than a protostar (see Báez-Rubio et al., 2018). In either case, the single example could not establish these molecules as common disk probes of massive star formation.
Recently, in the B-type protostar G339.88–1.26, Zhang et al. (2019a) found that the disk and envelope can be disentangled not only by kinematics but also by chemical signatures. In particular, they found that the Keplerian disk is traced by SiO emission. Maud et al. (2018, 2019) also presented the SiO and vibrationally excited H2O emissions tracing a Keplerian disk around the O-type protostar G17.64+0.16 at . Moreover, the lines of sodium chloride are detected in the disk of G17.64+0.16 (L. Maud 2020, private communication). In addition, in both G339.88–1.26 and G17.64+0.16, these authors noted that the complex organic molecules and typical hot-core lines (such as CH3CN) trace the envelopes rather than the disks, similar to our case of IRAS 16547. Consistent with these previous findings, in the case of IRAS 16547, the individual circumstellar disks on scale are traced by the NaCl, SiS, and vibrationally excited H2O lines. These studies suggest that hot water, silicon compounds, and alkali halides could be commonly present in dynamical and hot massive protostellar sources, and can be used to trace the inner disk and/or the material just launched from the disk. Further systematic observations are needed to confirm the common presence of those molecular lines in massive protostellar sources. Developing from the conventional hot-core chemistry, the “hot-disk” chemistry would be an essential avenue for future research of massive star formation. This work has demonstrated the usefulness of the hot-disk lines for understanding the dynamics down to from the massive protostars. We also note that the lower-energy transitions of refractory molecules are excellent targets for future radio observations by the Square Kilometre Array (SKA) and the Next Generation Very Large Array (ngVLA), which will be able to resolve the sublimation fronts of solid materials at a 10 au scale.
An additional importance of the hot-disk chemistry around protostars is its unique link to meteoritics. The oldest materials contained in primitive meteorites, i.e., Ca-Al-rich inclusions (CAIs) and chondrules, have been sublimated or molten once in the proto-solar disk. This fact suggests that at least some materials in the pre-solar nebula must be heated to , although protoplanetary disks are typically as cool as few hundred Kelvin in planet-forming regions of several au scale (e.g., Bell et al., 2000). Therefore, how and where CAIs and chondrules formed is still a matter of debate. Further observations of hot-disk chemistry could provide important constraints on the gas-phase conditions of refractory species, and might give unique insights into the formation of high-temperature meteoritic components.
4.2 The Massive Proto-binary IRAS 16547
Finally, we discuss the unveiled picture of the massive proto-binary IRAS 16547, and a possible scenario of its origin (see the schematics in Figure 5). The orbital dynamics could be constrained based on the systemic-velocity difference between two sources (Zhang et al., 2019b). We find the velocity difference is as small as based on the available inner-disk tracing lines (Figure 1). If the two protostars are coplanar with the circumbinary disk, and orbiting the same circular path following the Keplerian profile of the circumbinary disk (the enclosed mass of ; the inclination of by Zapata et al., 2019), the expected velocity difference is about . The fact that the observed is smaller than the simple Keplerian velocity suggests that the protostars are gravitationally bound.
The ionized state of surrounding environments provide hints of the evolutionary stage of massive protostars (Tanaka et al., 2016; Rosero et al., 2019; Zhang et al., 2019c). Based on the free-free fluxes at 3 mm, we estimate ionizing photon rates of and for sources A and B, respectively (Appendix B). Note that those are upper limits as we ignore the contribution from dust emission. The estimated ionizing-photon rates are several orders of magnitude lower than that of zero-age main-sequence (ZAMS) stars with (Davies et al., 2011), suggesting that the binary stars are at protostar phase with large radii of . The evolutionary calculations of protostars proposed that such large radii of massive protostars are the consequence of high accretion rates of (e.g., Hosokawa & Omukai, 2009; Haemmerlé et al., 2016).
Although the free-free emission has been detected in IRAS 16547 at radio wavelengths (Rodríguez et al., 2005, 2008), we do not detect hydrogen recombination lines such as H40 and H42. The non-detection of recombination lines can be explained by the line broadening with a width of (Appendix B), which is consistent with the presence of jets seen in the 3 mm continuum. Additionally, the northern jet knots are located with approximately equal intervals of , or , which may be evidence of periodic accretion induced by a hidden companion or some disk instability around source A. Assuming a total mass of and a jet velocity of on the sky plane, we estimate this hidden companion should have a period of and a semi-major axis of . The proper motion of the jet knots would be detectable by follow-up observations with similar resolutions, which will provide important clues for testing the companion’s presence and for understanding jet launching and precession (Rodríguez et al., 2008).
The two protostars have similar continuum fluxes and line emissions, and look coplanar with the circumbinary disk. Those features superficially link to the disk fragmentation as the origin of the binary system (e.g., Krumholz et al., 2009). A puzzling finding, however, is the tentative detection of the counter-rotating disks (Figure 4), which are difficult to form by disk fragmentation. An alternative mechanism is turbulent fragmentation at the molecular cloud-core scale (e.g., Offner et al., 2010; Bate, 2012; Kuffmeier et al., 2019). Although their birthplaces may be distant, some pairs of protostars can migrate to as close as , forming binary systems. The presence of turbulence leads to the random rotation of protostellar disks, which remains even after the migration (Offner et al., 2016). The turbulent fragmentation scenario would go well with the small-cluster nature of IRAS 16547 on the scale of , seen in the misalignments of several outflows and jets (Higuchi et al., 2015). However, considering the actual origin of binary systems could be much more complicated, e.g., the combination of both fragmentation processes (Rosen & Krumholz, 2020) and the dynamical interactions with highly eccentric orbits (Saiki & Machida, 2020), it is difficult to conclude the formation process based on the currently available information. We want to emphasize that the detection of the counter-rotation is still tentative, and follow-up high-resolution observations are required to conclude the disk orientations of IRAS 16547.
5 Summary
We report the dynamical and chemical structures of the massive proto-binary system IRAS 16547–4247 using -resolution ALMA observations at 3, 1.3, and 0.85 mm. We propose that (1) the lines of destructed-dust molecules, such as alkali metal halides (e.g., NaCl) and silicon compounds (e.g., SiO and SiS), and (2) the high-excitation water line with can act as good tracers for investigating dynamics of the innermost region of massive star formation at a scale of .
Figure 5 shows the schematic view of the proto-binary IRAS 16547 presented in this study. In the scale of , the rotation of the circumbinary disk is revealed by emission lines of typical hot-core molecules, such as CH3CN and SO2, with upper-state energies of – (Zapata et al., 2019). However, these lines cannot trace well the protostellar disks at a 100 au scale. Instead, we found that some molecular lines, including vibrationally excited water, silicon compounds, and sodium chloride, exclusively trace the individual circumstellar disks. The detection of vibrationally excited lines in H2O, SiO, SiS, and NaCl with upper-state energy as high as – indicates a very high temperature in the innermost disks. Because sodium chloride and silicon compounds are produced through the destruction of dust grains in the dynamical disks, their emissions are seen only in the vicinity of protostars, even for the lower-energy transitions with . Using these new disk probes, we analyzed the disk kinematics and tentatively discovered that the twin disks are counter-rotating. The pair of the counter-rotating disks might suggest that the binary system is formed via turbulent fragmentation at the cloud-core scale rather than disk fragmentation. However, more observations are needed to confirm the rotation directions of disks.
Notably, this is the second reported detection of salt in protostellar systems after the case of the disk of Orion Source I (Ginsburg et al., 2019), and also one of few massive protostellar disks associated with high-energy transition water and silicon compounds (e.g., Maud et al., 2018, 2019; Zhang et al., 2019a). These new results suggest these “hot-disk” lines may be common in innermost disks around massive protostars and can be detected in high-resolution observations. Such “hot-disk” chemistry has great potential for the future research of massive star formation.
Appendix A Information of the Observations
Table 1 summarizes the information of the observations of Band 3, 6 (project: 2018.1.01656.S), and 7 (project 2016.1.00992.S, Zapata et al., 2019). As listed, similar high resolutions of are achieved for all wavelengths.
| Band | Obs. Date (Total Time) | # of Ant. | Baseline Range | Phase Cal. | Flux/Bandpass Cal. | 111The synthesized beams for the continuum images. A robust weighting parameter of 0.5 is used for Band 3 and 6 data, and a robust weighting parameter of -0.5 is used for Band 7 data. | 222The maximum recoverable scales. |
|---|---|---|---|---|---|---|---|
| 3 | June 9, 2019 (90 min) | 45 | 83.1 m 16.2 km | J1706-4600 | J1617-5848 | ||
| 6 | July 15, 2019 (78 min) | 42 | 138.5 m 8.5 km | J1706-4600 | J1427-4206 | ||
| 7 | August 21 22, 2019 (100 min) | 44 | 21.0 m 3.7 km | J1636-4102 | J1617-5848/J1427-4206 |
Appendix B Estimations of Protostellar Properties
We estimate the properties of the protostars based on results of multi-wavelength ALMA observations. The disk masses can be estimated using the dust flux of ,
| (B1) |
where is the distance to IRAS 16547, is the solid angle of the integrated region, is the dust opacity per gas mass, and is the Planck function at the dust temperature , respectively. We utilize the 0.85 mm fluxes of and within for sources A and B, because the dust emission should dominate at this wavelength (Figure 1). The dust temperatures in the disks are uncertain from the currently available data, but the peak brightness temperature of at 0.85 mm suggests the high temperature of . Here we assume the dust temperature range of –. Considering the physical condition of the disks, we apply the dust opacity of for the coagulated dust model in the high density of without the ice mantle (Ossenkopf & Henning, 1994) (a gas-to-dust ratio of 100 is assumed). We evaluate the disks masses as – and – for sources A and B, respectively, at the dust temperature range of –.
The free-free emissions at radio wavelengths are observed at the center of IRAS16547 (Rodríguez et al., 2005, 2008), suggesting the existence of photoionized regions. Under the assumption of the optically thin free-free emission, we can evaluate the ionizing-photon rates of the protostars (Schmiedeke et al., 2016),
| (B2) |
where is the electron temperature, which we use the typical values of (Keto et al., 2008). We adopt the 3 mm continuum for the free-free fluxes, which is the upper limit because the dust emission would contribute. Based on and within , we evaluate the ionizing-photon rates of and for sources A and B, respectively. The evaluated rates are orders of magnitude lower than ZAMS stars with luminosities (Davies et al., 2011) (note the total luminosity of IRAS 16547 is ), confirming that sources A and B are still at the protostellar phase with large radii. Assuming the bolometric luminosities are , we estimate the stellar radii of and for sources A and B, respectively (Tanaka et al., 2016). Such large radii of the massive protostars suggest that both protostars have grown with high accretion rates (e.g., Hosokawa & Omukai, 2009; Haemmerlé et al., 2016).
We do not identify the hydrogen recombination lines of H26, H30, H40, and H42 (353.6227, 231.9009, 99.0230, and 85.6884 GHz, respectively), which suggests a broadening effect due to the high-velocity jets. Under the assumption of the optically thin and local thermal equilibrium (LTE) conditions of the recombination lines, we can estimate the the ratio of hydrogen recombination lines to the free-free continuum (Anglada et al., 2018),
| (B3) |
where is the ratio of the He+ and H+ column densities (we use the typical value of ). Again, we adopt the 3 mm continuum flux as the free-free emission. Taking into account the peak intensity and the rms noise of , we estimated that the line width would be for the non-detection with level, i.e., . This wide width is consistent with the presence of the jets. We note that this is a conservative limit because the 3 mm flux also contains the dust emission.
Appendix C Information of the Presented Molecular Lines
| Molecule | Transition | Frequency | ||
|---|---|---|---|---|
| (GHz) | (K) | (D2) | ||
| H2O | – | 232.6867000 | 3463.6 | 1.079 |
| SiO | 5–4 | 217.1049800 | 31.3 | 48.00 |
| 30SiO | 8–7 | 338.9300437 | 73.2 | 76.81 |
| 29SiO | 8–7 | 340.6118622 | 1832.6 | 77.77 |
| SiS | 12–11 | 217.8176630 | 68.0 | 12.55 |
| SiS | 13–12 | 234.8129678 | 1150.6 | 169.5 |
| NaCl | 18–17 | 232.5099753 | 626.0 | 1478 |
| NaCl | 18–17 | 234.2519153 | 106.9 | 1458 |
| CH3CN | – | 220.6792874 | 183.2 | 328.2 |
| CH3CN | – | 220.4758078 | 525.8 | 205.1 |
| SO2 | – | 234.1870566 | 403.2 | 55.09 |
| SO2 | – | 216.7585584 | 1096.5 | 54.13 |
| CS | 7–6 | 340.3979569 | 1896.6 | 26.24 |
Note. — Line information of H2O is taken from the Jet Propulsion Laboratory (JPL) line database (Pickett et al., 1998), the information of other lines are taken from the Cologne Database for Molecular Spectroscopy molecular line catalog (CDMS) (Müller et al., 2005). The molecular lines listed above the horizontal line between NaCl and CH3CN trace well the 100 au scales of IRAS16547 (see Figures 4 and 1).
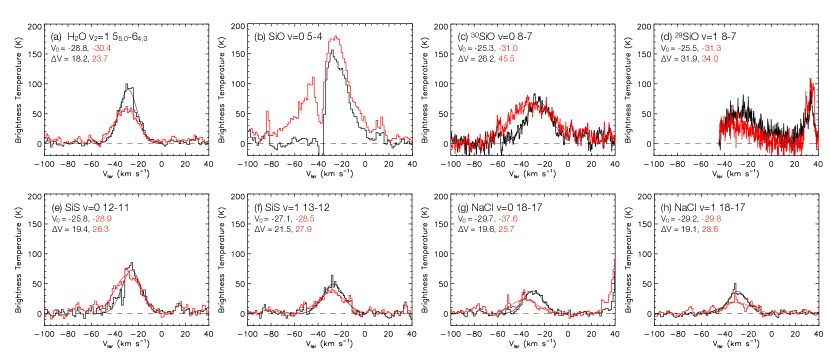
Table 1 summarizes the emission lines presented in this study. We particularly discuss the detection of sodium chloride, silicon compounds, and hot water as the disk probes at the 100 au scale. Figure 1 shows the spectra of these emissions at the continuum peaks of sources A and B. The fitted Gaussian functions of each profile are also presented, except for the SiO (5–4) emission, which has strong absorption. The systemic velocity of IRAS 16547 is about (Garay et al., 2003). As seen in Figure 4, the individual disks are traced particularly well by the emissions of H2O, NaCl , and SiS for source A, and H2O, and SiS for source B. These lines have quasi-Gaussian shapes with the FMHWs of –. We do not identify a clear line-of-sight velocity difference between the two protostars, i.e., , which indicates that the binary system is gravitationally bound (Section 4.2). The water line is contaminated by the other lines at around and (see also Figure 3d), which we have not been able to identify. On the other hand, the SiO (5–4) emission traces not only the disks but also the outflows. Thus, it is broader with clear absorption features in the blueshifted side (see also Figure 2h and i). Similar features are also seen in some of the other silicon-compound lines, e.g., SiS and 30SiO of source A. The deeper absorptions in the silicon-compound lines in source A suggests its stronger outflow than the outflow B.
References
- Anglada et al. (2018) Anglada, G., Rodríguez, L. F., & Carrasco-González, C. 2018, A&A Rev., 26, 3
- Báez-Rubio et al. (2018) Báez-Rubio, A., Jiménez-Serra, I., Martín-Pintado, J., et al. 2018, ApJ, 853, 4
- Bate (2012) Bate, M. R. 2012, MNRAS, 419, 3115
- Bell et al. (2000) Bell, K. R., Cassen, P. M., Wasson, J. T., et al. 2000, Protostars and Planets IV, 897
- Beltrán (2020) Beltrán, M. 2020, the Star Formation Newsletter, 329 (arXiv:2005.06912)
- Beuther et al. (2017) Beuther, H., Walsh, A. J., Johnston, K. G., et al. 2017, A&A, 603, A10
- Davies et al. (2011) Davies, B., Hoare, M. G., Lumsden, S. L., et al. 2011, MNRAS, 416, 972
- Franco-Hernández et al. (2009) Franco-Hernández, R., Moran, J. M., Rodríguez, L. F., et al. 2009, ApJ, 701, 974
- Garay et al. (2003) Garay, G., Brooks, K. J., Mardones, D., et al. 2003, ApJ, 587, 739
- Ginsburg et al. (2018) Ginsburg, A., Bally, J., Goddi, C., et al. 2018, ApJ, 860, 119
- Ginsburg et al. (2019) Ginsburg, A., McGuire, B., Plambeck, R., et al. 2019, ApJ, 872, 54
- Haemmerlé et al. (2016) Haemmerlé, L., Eggenberger, P., Meynet, G., et al. 2016, A&A, 585, A65
- Higuchi et al. (2015) Higuchi, A. E., Saigo, K., Chibueze, J. O., et al. 2015, ApJ, 798, L33
- Hirota (2018) Hirota, T. 2018, Publication of Korean Astronomical Society, 33, 21
- Hirota et al. (2012) Hirota, T., Kim, M. K., & Honma, M. 2012, ApJ, 757, L1
- Hirota et al. (2014) Hirota, T., Kim, M. K., Kurono, Y., et al. 2014, ApJ, 782, L28
- Hirota et al. (2017) Hirota, T., Machida, M. N., Matsushita, Y., et al. 2017, NatAs, 1, 0146
- Hosokawa & Omukai (2009) Hosokawa, T., & Omukai, K. 2009, ApJ, 691, 823
- Johnston et al. (2015) Johnston, K. G., Robitaille, T. P., Beuther, H., et al. 2015, ApJ, 813, L19
- Johnston et al. (2020) Johnston, K. G., Hoare, M. G., Beuther, H., et al. 2020, A&A, 634, L11
- Keto et al. (2008) Keto, E., Zhang, Q., & Kurtz, S. 2008, ApJ, 672, 423
- Krumholz et al. (2009) Krumholz, M. R., Klein, R. I., McKee, C. F., Offner, S. S. R., & Cunningham, A. J. 2009, Science, 323, 754
- Kuffmeier et al. (2019) Kuffmeier, M., Calcutt, H., & Kristensen, L. E. 2019, A&A, 628, A112
- Kuiper et al. (2010) Kuiper, R., Klahr, H., Beuther, H., & Henning, T. 2010, ApJ, 722, 1556
- Kuiper & Hosokawa (2018) Kuiper, R., & Hosokawa, T. 2018, A&A, 616, A101
- Landsman (1995) Landsman, W. B. 1995, Astronomical Data Analysis Software and Systems IV, 77, 437
- Matsushita et al. (2017) Matsushita, Y., Machida, M. N., Sakurai, Y., et al. 2017, MNRAS, 470, 1026
- Maud et al. (2018) Maud, L. T., Cesaroni, R., Kumar, M. S. N., et al. 2018, A&A, 620, A31
- Maud et al. (2019) Maud, L. T., Cesaroni, R., Kumar, M. S. N., et al. 2019, A&A, 627, L6
- McMullin et al. (2007) McMullin, J. P., Waters, B., Schiebel, D., Young, W., & Golap, K. 2007, Astronomical Data Analysis Software and Systems XVI (ASP Conf. Ser. 376), ed. R. A. Shaw, F. Hill, & D. J. Bell (San Francisco, CA: ASP), 127
- Meyer et al. (2017) Meyer, D. M.-A., Vorobyov, E. I., Kuiper, R., et al. 2017, MNRAS, 464, L90
- Meyer et al. (2018) Meyer, D. M.-A., Kuiper, R., Kley, W., et al. 2018, MNRAS, 473, 3615
- Motogi et al. (2019) Motogi, K., Hirota, T., Machida, M. N., et al. 2019, ApJ, 877, L25
- Müller et al. (2005) Müller, H. S. P., Schlöder, F., Stutzki, J., et al. 2005, Journal of Molecular Structure, 742, 215
- Offner et al. (2010) Offner, S. S. R., Kratter, K. M., Matzner, C. D., et al. 2010, ApJ, 725, 1485
- Offner et al. (2016) Offner, S. S. R., Dunham, M. M., Lee, K. I., et al. 2016, ApJ, 827, L11
- Ossenkopf & Henning (1994) Ossenkopf, V., & Henning, T. 1994, A&A, 291, 943
- Pickett et al. (1998) Pickett, H. M., Poynter, R. L., Cohen, E. A., et al. 1998, JQSRT, 60, 883
- Rodríguez et al. (2005) Rodríguez, L. F., Garay, G., Brooks, K. J., et al. 2005, ApJ, 626, 953
- Rodríguez et al. (2008) Rodríguez, L. F., Moran, J. M., Franco-Hernández, R., et al. 2008, AJ, 135, 2370
- Rosen & Krumholz (2020) Rosen, A. L. & Krumholz, M. R. 2020, AJ, 160, 78
- Rosen et al. (2016) Rosen, A. L., Krumholz, M. R., McKee, C. F., et al. 2016, MNRAS, 463, 2553
- Rosero et al. (2019) Rosero, V., Tanaka, K. E. I., Tan, J. C., et al., 2019, ApJ, 873, 20
- Saiki & Machida (2020) Saiki, Y. & Machida, M. N. 2020, ApJ, 897, L22
- Schmiedeke et al. (2016) Schmiedeke, A., Schilke, P., Möller, T., et al. 2016, A&A, 588, A143
- Tachibana et al. (2019) Tachibana, S., Kamizuka, T., Hirota, T., et al. 2019, ApJ, 875, L29
- Tan et al. (2014) Tan, J. C., Beltrán, M. T., Caselli, P., et al. 2014, in Protostars and Planets VI, ed. H. Beuther et al. (Tucson, AZ: Univ. Arizona Press), 149
- Tanaka & Nakamoto (2011) Tanaka, K. E. I., & Nakamoto, T. 2011, ApJ, 739, L50
- Tanaka et al. (2016) Tanaka, K. E. I., Tan, J. C., & Zhang, Y. 2016, ApJ, 818, 52
- Tanaka et al. (2017) Tanaka, K. E. I., Tan, J. C., & Zhang, Y. 2017b, ApJ, 835, 32
- Wolfire & Cassinelli (1987) Wolfire, M. G., & Cassinelli, J. P. 1987, ApJ, 319, 850
- Wright et al. (2020) Wright, M., Plambeck, R., Hirota, T., et al. 2020, ApJ, 889, 155
- Zapata et al. (2019) Zapata, L. A., Garay, G., Palau, A., et al. 2019, ApJ, 872, 176
- Zapata et al. (2015) Zapata, L. A., Palau, A., Galván-Madrid, R., et al. 2015, MNRAS, 447, 1826
- Zhang et al. (2019a) Zhang, Y., Tan, J. C., Sakai, N., et al. 2019a, ApJ, 873, 73
- Zhang et al. (2019b) Zhang, Y., Tan, J. C., Tanaka, K. E. I., et al. 2019b, NatAs, 3, 517
- Zhang et al. (2019c) Zhang, Y., Tanaka, K. E. I., Rosero, V., et al. 2019c, ApJ, 886, L4