Softening of the Metagalactic Ionizing Background from
Internal He II Absorption in Quasars
Abstract
Quasars and other active galactic nuclei (AGN) are significant contributors to the metagalactic ionizing background at redshifts . Recent HST/COS composite spectra of AGN find a harder flux distribution in the Lyman continuum, () compared to previous studies. This index appears to be inconsistent with observed He II/H I absorption ratios () in the Ly forest. We explore the effects of internal AGN absorption in the He II (4-ryd) continuum using an analytic source-function model of the ionizing background in which the emissivity () arises from quasars, reprocessed by the opacity () of the intervening Ly forest and distinct AGN escape fractions and at 1 ryd and 4 ryd, respectively. We also examine H I and He II photoelectric heating from the reprocessed background, whose spectral index ( depends on , the H I column density slope , and the ratio . We compare the model to Ly absorption lines of He II and H I toward the quasar HE 2347-4342. Internal AGN absorption with but would increase the index by , corresponding to for , in agreement with HST/COS observations at . The observed range of ratios, , constrains and . Individual AGN with softer spectra, , and more internal He II absorption could produce a few absorbers with , in proximity to AGN transverse to the sight line.
1 Introduction
Quasars and other active galactic nuclei (AGN) are considered to be significant contributors to the metagalactic ionizing background radiation (Haardt & Madau 2012), affecting the physical state of both the intergalactic medium (IGM) and circumgalactic medium (CGM). The dominant sources of ionizing photons are massive stars within star-forming galaxies and black hole accretion disks in AGN, but their relative contributions remain uncertain (Madau & Haardt 2015; Finkelstein et al. 2019; Puchwein et al. 2019). Although the space density of quasars is much smaller than star-forming galaxies (Richards et al. 2006; Madau & Dickinson 2014) a larger fraction of ionizing radiation escapes from luminous AGN. Far-ultraviolet spectra from the Cosmic Origins Spectrograph (COS; Green et al. 2012) on the Hubble Space Telescope (HST) have measured the Lyman continuum of low-redshift () quasars down to rest-frame wavelengths of 350 Å. Composite spectra from ensembles of Type-1 AGN (Stevans et al. 2014; Tilton et al. 2016) along clear sight lines through their emission-line regions and host galaxies show no photoionization edges at 912 Å (H I) or 504 Å (He I) suggesting an escape fraction for the H I ionizing continuum at 1 ryd. Internal AGN absorption in the higher-opacity He II continuum is likely to exist, although there is no direct information on the He II edge (228 Å) owing to strong absorption in the H I Ly forest at . Much smaller H I escape fractions or upper limits of a few percent are observed for star-forming galaxies (Shapley et al. 2016; Vanzella et al. 2018; Izotov et al. 2018) and Ly emitters (Bian & Fan 2020).
Photoionizing radiation is likely responsible for two major transitions of the IGM during the reionization epochs of H I at redshift and He II at . Obtaining a deeper understanding of the processes governing these transitions requires knowledge of the production rates of ionizing photons from high-redshift galaxies and AGN, as well as the range of escape fractions and their dependence on galaxy mass, metallicity, and stellar properties. Quasars generally have hard spectra in the He II continuum, whereas hot O-type stars have He II photoionization edges at 228 Å. The ionizing spectra of hot stars and AGN should be distinguishable by their intrinsic spectra and their effects on the state of the surrounding gas. Commonly used diagnostics of the EUV background include abundances of metal ions in the IGM and CGM as well as the He II/H I ratio in the Ly forest (Kriss et al. 2001; Shull et al. 2010) and Lyman Limit Systems (Graziani et al. 2019).
There are important cosmological reasons for identifying the populations that produce He II reionization. Quasar absorption lines in the Ly transitions of H I (1215.67 Å) and He II (303.78 Å) provide evidence for a “cosmic web” of gaseous structures in the IGM. During the He II reionization epoch, the He III ionization fronts begin to overlap and the IGM gradually becomes transparent in the 4 ryd He II continuum. The luminosity function of AGN and its evolution in redshift define the duration of the transition, leaving a thermal imprint on the gas (Puchwein et al. 2015), equation of state (Hui & Gnedin 1997), and abundances of metal-ions in IGM and CGM (Madau & Haardt 2009; Boksenberg & Sargent 2015). As AGN populations evolve, the spectral characteristics of ionizing sources will influence the structure of the Ly absorption troughs and flux transmission windows in the spectra of high-redshift AGN (Gunn & Peterson 1965). Finally, He II-ionizing QSOs transverse to the sight line can be used to constrain QSO lifetimes (Jakobsen et al. 2003; Syphers & Shull 2014; Schmidt et al. 2018) and the propagation of cosmological ionization fronts.
In this paper, we develop an analytic model of the ionizing background due to AGN with internal absorption in their continuum and emission-line regions. This model employs the radiative source function in the diffuse IGM, where the intrinsic AGN spectral emissivity is modified by escape fractions and . These assumptions are consistent with observations of AGN in their rest-frame EUV at 912 Å (H I) and 504 Å (He I) and inferred at 228 Å (He II) from variations in the extent of He II proximity zones around QSOs. Internal absorption in the He II continuum will produce a softer metagalactic background, consistent with observed He II/H I ratios (denoted ) in the Ly-forest. Throughout this paper, we assume that the IGM opacity comes from H I absorbers with a power-law distribution in H I column density, , and that the ionizing background at is dominated by AGN with a mean flux distribution in frequency, . Here, is the intrinsic spectral index (positive by convention) characterizing the AGN ionizing continua of H I and He II. After absorption and reprocessing, the metagalactic ionizing background is characterized by an effective index , defined by the ratio of specific intensities at 4 ryd and 1 ryd, . As discussed in Section 3, this effective index can be related to the He II/H I ratio by the formula , where depends on and . The He II ion is typically much more abundant in the IGM than H I (Miralda-Escudé et al. 1996; Fardal et al. 1998) even though He/H elemental abundances would favor hydrogen. The large observed ratios of column densities, , arise because He I is harder to ionize than H I and He III recombines faster than H II.
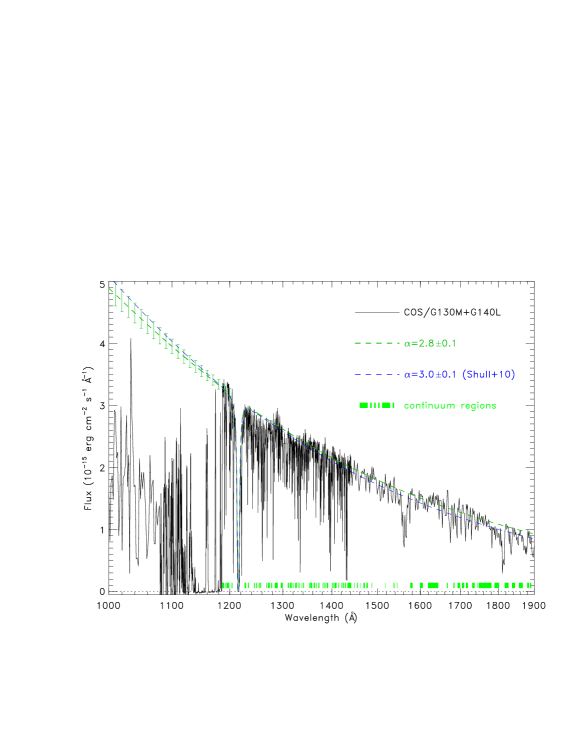
Our new study is motivated by two recent HST/COS observations: (1) the composite ionizing spectrum of AGN is harder than previously assumed; and (2) higher-resolution observations of the Ly forest better define the range of ratios. To probe the He II post-reionization epoch, we obtained deep UV spectroscopic observations of two quasars, HE 2347-4342 and HS 1700+6416, using both the G130M and G140L gratings of COS. These two AGN are the brightest known He II quasars and among the few percent of quasars with sufficient far-UV flux to observe the He II Ly forest in absorption. These were the only two quasars studied by FUSE in He II absorption (Kriss et al. 2001; Shull et al. 2004; Zheng et al. 2004; Fechner et al. 2006). These UV targets were used by the COS GTO team and others to study the He II post-reionization epoch (Shull et al. 2010; Syphers & Shull 2013; Worseck et al. 2016) and He II transverse-proximity effects in the ionization zones around QSOs (Schmidt et al. 2018).
In Section 2, we describe our HST/COS observations of HE 2347-4342, using the moderate-resolution G130M grating in the super-blue (1222 Å) wavelength setting, together with the lower-resolution G140L grating. This allowed us to extend far-UV G130M coverage down to 1067 Å and analyze He II/H I ratios down to redshifts , well into the post-reionization epoch. Section 3 presents our analytic model of the reprocessing of the intrinsic AGN spectra by intervening IGM and by absorption internal to the AGN. We introduce distinct escape fractions () for the H I and He II continua and derive a formula for the effective spectral index of the softened metagalactic radiation field and the corresponding He II/H I ratios. Adopting a mean index , an distribution slope , and assuming no internal AGN absorption, we find and . These ratios are considerably lower than those in the observations, and additional spectral softening may be needed, depending on the slope of the H I distribution between . We propose that He II-ionizing (4 ryd) photons are absorbed within some AGN, parameterized by escape fractions required for consistency with the distribution. Section 4 summarizes the implications of the modified radiation field for the He II reionization epoch and photoionization of metal ions in the IGM and CGM. We suggest the need for more sophisticated models in which AGN are non-uniform populations with a range of intrinsic spectral parameters (, ). This would facilitate a study of their correlation with and influence on metal-ion abundance ratios such C IV/C III, Si IV/Si III, and O VI/N V.
2 Observations
2.1 AGN Composite Spectrum
The He II/H I absorption ratio constrains the mean spectrum of quasars, after correcting for absorption and reprocessing by intervening gas. Using the G130M/G160M gratings on HST/COS, Stevans et al. (2014) constructed a composite spectrum of 159 AGN () in the rest-frame EUV down to Å. The mean spectral index, , is harder than those in other HST studies with lower-resolution instruments. For example, Telfer et al. (2002) found for 39 radio-quiet QSOs observed with the lower-resolution Faint Object Spectrograph (FOS) on HST. Lusso et al. (2015) found for 53 blue QSOs at using the UVIS-G280 grism on the HST Wide Field Camera 3 (2000–6000 Å). The HST/COS composite (Stevans et al. 2014) was based on high-S/N spectra with 20 km s-1 resolution, allowing us to resolve and mask out intervening Ly-forest absorbers. The high S/N allowed us to identify broad emission lines from the AGN (Ne VIII, O IV, and other ions of O and Ne) and characterize the underlying continuum. We also identified Lyman Limit systems (LLS) and partial LLS (pLLS) and restored the true continuum. Their H I column densities were determined from the depth of the Lyman break and curve-of-growth analysis of Lyman series lines (Shull et al. 2017).
We believe the COS composite index, , is a more reliable measure of the EUV (1-2 ryd) spectrum of AGN than the lower-resolution studies with FOS and WFC3. The quoted error bars on ( with COS, with FOS, with WFC3) allow for some overlapping uncertainty in the spectral index. However, as we show in Section 3, the effective index changes rapidly with IGM reprocessing, as the imean ntrinsic index hardens from to 1.4. These changes produce significant differences in predicted He II/H I ratios in models with (COS) versus (WFC3 prism).
2.2 Previous Studies of He II
Our previous COS/GTO analysis of HE 2347-4342 (Shull et al. 2010) was based on G130M spectra between 1135–1440 Å at 20 km s-1 resolution. Because of the central wavelength setting, these spectra did not cover He II Ly-forest absorption in the post-reionization recovery at . The shorter UV wavelengths were only observed at low resolution ( km s-1) with G140L on HST/COS. Earlier FUSE observations (Kriss et al. 2001; Shull et al. 2004) had low throughput and uncertain background corrections. The quasar HS 1700+6416 was previously observed by COS/G140L (Syphers & Shull 2014) but at low resolution insufficient to see individual absorbers. Our new HST/COS data with G130M provide superior resolution of the Ly forest in He II.
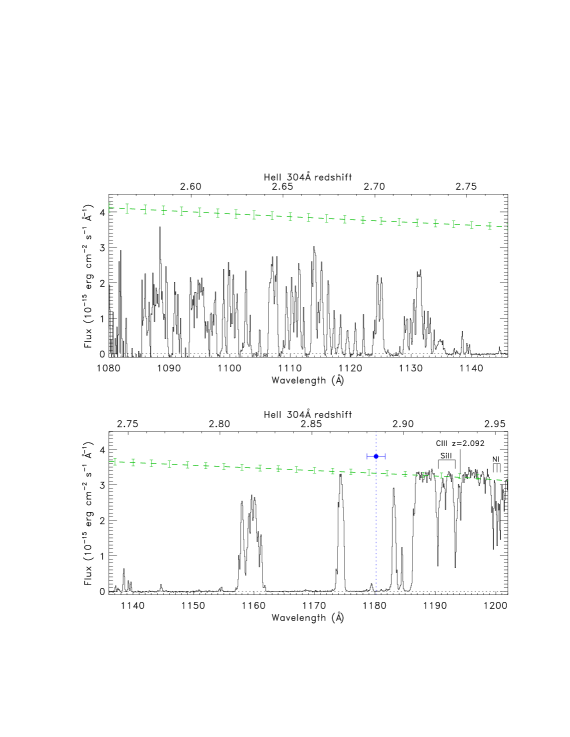
In this paper, we describe properties of the Ly forest toward HE 2347-4342. This sight line is considerably less complicated, compared to HS 1700+6416, which has contamination from metal lines in several strong intervening systems in (Fechner et al. 2006). The COS/G130M spectrum of HE 2347-4342 showed strong He II () absorption extending 1480 km s-1 redward of the estimated systemic redshift () out to 1186.4 Å (). Absorption at is also seen in H I and in associated metal-line absorbers (Fechner et al. 2004). Previous studies of the weak (O I+Si II) emission-line blend quoted systemic redshifts for HE 2347-4342 of (Reimers et al. 1997), (Dall’Aglio et al. 2008a), and (Dall’Aglio et al. 2008b). There is no obvious “proximity effect” (flux transmission shortward of the He II edge) despite the large ionizing photon luminosity of the QSO in the H I and He II continua. The observed strong associated absorption (1181.0–1186.4 Å) and the lack of a QSO proximity effect prompted the suggestion (Shull et al. 2010) that the true QSO redshift might be slightly higher, , just longward of the associated absorbers. That hypothesis turned out to be incorrect. Near-infrared spectra taken with the FIRE (Folded-port InfraRed Echellette) spectrograph at the Magellan 6.5m telescope (R. Simcoe, 2015, private communication) measured from the lines of [O III], H, and Mg II. This result is consistent with previous redshift estimates from the broad O I emission line, with improved errors. This more accurate systemic redshift is important for understanding the ionizing radiation field near the QSO, and opens the possibility that some He II-ionizing photons are being absorbed within the AGN.
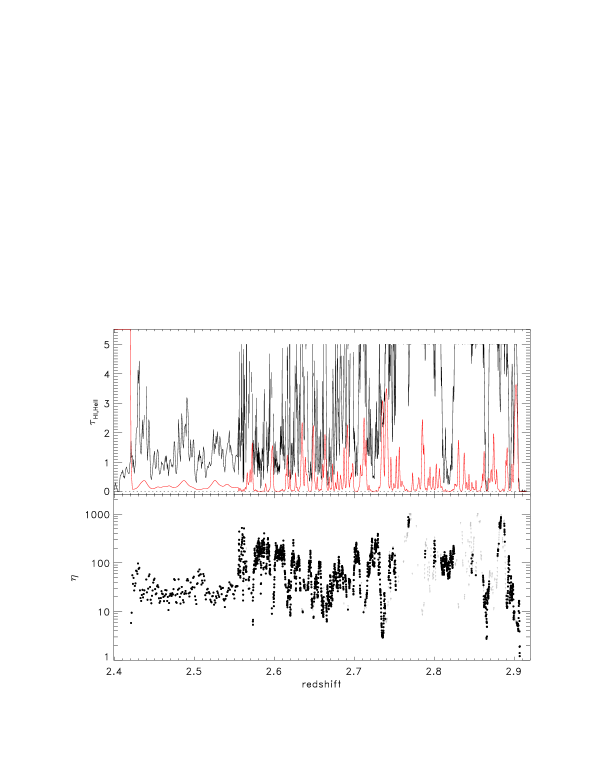
Previous COS observations of HE 2347-4342 (Shull et al. 2010) found substantial variations in the He II/H I optical-depth ratios () with a mean value . Because of binning and line overlap, the values depend on spectral resolution: for with the low-resolution G140L grating, and for with the higher resolution G130M grating. These -variations were seen at small scales (). For HS 1700+6416, a similar range of ratios were found, with and median from FUSE data (Fechner et al. 2006) and from HST/COS data taken with the lower resolution G140L grating (Syphers & Shulll 2013).
2.3 New Observations of HE 2347-4342
We obtained high-S/N data at moderate resolution (30 km s-1) with the COS/G130M grating covering 1067–1363 Å (see Table 1). The He II data were obtained through HST Guest Observer Program 13301 (PI Shull) using the super-blue (1222 Å) setting and near-simultaneous spectra with the lower-resolution G140L grating. The HST/COS G130M spectrograph is ideal for high-S/N studies of individual far-UV absorbers, while G140L is used to define the AGN continuum longward of the He II edge. We chose the 1222 Å setting, rather than 1096 Å or 1055 Å, because it provides higher resolving power ( rather than 6000) over the wavelengths (1067–1140 Å) of most interest for the He II post-reionization era. This setting has higher throughput than the other two, and it produces the higher S/N needed to detect and resolve the He II Ly absorbers at . The G130M/1222 Å setting also allows sufficient anchoring continuum longward of the target He II Ly break at 1186 Å. With these data (14 HST orbits) we were able to resolve individual lines in the Ly forest of He II down to (G130M). With the COS/G140L grating (one HST orbit) we extended the He II measurements down to at lower resolution (200 km s-1). We compared the He II absorbers with their H I Ly counterparts, using optical spectra taken by D. Reimers with the VLT/UVES (Ultraviolet Visual Echelle Spectrograph) in ESO program 071.A-0066 (see Shull et al. 2010). We then used the -ratio of He II/H I absorption as a diagnostic of the metagalactic ionizing background spectrum.
Figure 1 shows the observed COS (G130M and G140L) spectra of HE 2347-4342, with strong absorption at wavelengths Å in the Ly lines of He II (303.78 Å rest frame). Figure 2 shows an expanded view of the COS/G130M spectra (1080–1200 Å) relative to the extrapolated continuum. Figure 3 shows the He II/H I absorption ratio, calculated as the ratio of optical depths, . Surprisingly, this AGN lacks a He II proximity effect. Near the He II edge, between 1181 and 1186 Å, we see strong H I and He II absorption with inferred column densities (Fox et al. 2008) and (Fechner et al. 2004). There are also strong metal-line absorbers (C III, C IV, N V, O VI) which can be modeled with photoionization codes. These associated absorbers at may have sufficient column densities to block some of the H I and He II ionizing flux. The estimated H I column density, cm-2, corresponds to optical depth at the (1 ryd) Lyman limit. The He II column density could be much larger () and produce optical depth at 228 Å (4 ryd). Thus, it is possible that much of the He II-ionizing radiation is blocked near the AGN. As discussed in previous papers, these observations raise several puzzles about the structure of the AGN environment. Why does this powerful QSO produce no “near-zone” ionization cavity? How do the infalling associated absorbers () overcome QSO radiation pressure? If this QSO turned on in the last Myr, its ionization front may still be propagating out of the dense circumnuclear gas that fueled the QSO in its early luminous phase.
Many AGN are obscured, owing to inclination effects of the central accretion disk and dense gas in the galactic nucleus. For example, Seyfert galaxies were first classified as Type I or II, based on emission lines shown by their spectra. However, these differences may arise from obscuring dust farther out from the accretion disc. The composite UV/EUV spectra discussed in this paper were all Type I. The absence of any photoelectric absorption edge at 912 Å is consistent with clear escape channels for ionizing radiation in the H I Lyman continuum. Still poorly constrained is the escape fraction of photons in the continuum of He II at 4-ryd (228 Å). While many He II quasars show proximity zones of various sizes (Schmidt et al. 2018), the large line-of-sight proximity zone of Q0302-002 (Syphers & Shull 2014) is unusual compared to those in the two brightest He II quasars. HS 1700+6416 has a small zone (Syphers & Shull 2013), and HE 2347-4342 has no proximity zone at all, and shows evidence for associated absorption within the AGN (Figure 2).
3 Analytic Photoionization Models
We extend the formalism (Fardal et al. 1998) developed to assess the softening of the AGN ionizing spectrum as a result of radiative transfer through the IGM. To quantify the effects of absorption internal to the AGN, we constructed a radiative equilibrium model with reprocessing by both IGM and internal AGN absorption. The emissivity of ionizing radiation () is produced by AGN sources with spectral index and flux escape fractions, and in the H I and He II ionizing continua at 1 ryd and 4 ryd respectively. We assume that H I and He II are photoionized by metagalactic radiation with a modified spectral index characterizing the re-processed spectrum between 1–4 ryd (H I and He II ionization edges). The specific intensity is assumed to be in radiative equilibrium, so that the local source function, . The IGM opacity comes from H I absorbers with a distribution in H I column density, . Appendix A gives a full discussion of the integrated opacities of H I and He II. In radiative equilibrium, the specific intensity develops a softer spectrum with spectral index . Using updated rates for H I and He II photoionization and recombination, we derive a formula for in terms of , , and the ratio .
For the photoionization equilibrium in the low-density IGM, we assume Case-A radiative recombination rates to H I and He II. From these parameters, updated from those in Shull et al. (2010), we estimate the ratio of He II and H I column densities,
| (1) |
In this formula, we assume that H+ and He+2 are the dominant ionization stages of H and He, with . For the He/H ratio, we adopt by mass and by number (Peimbert et al. 2007) consistent with estimates of the primordial value, (Aver et al. 2015; Cyburt et al. 2016) and values from the CMB determined baryon density (Planck Collaboration 2015) and Big Bang nucleosynthesis (Cooke & Fumagalli 2018). The accuracy of the He/H ratio demonstrates that it is not the limiting factor in modeling the spectral index from He II/H I ratios.
In equation (1), the quantities , , , and are case-A radiative recombination rate coefficients and photoionization rates for H I and He II. We adopt the fits to radiative recombination rate coefficients from Shull et al. (2010) of and , scaled to electron temperature . In the approximation that photoionization cross sections for H I and He II scale as above threshold, we write and . Here, , and and represent specific intensities of the ionizing radiation field at 1 ryd and 4 ryd. The parameters and represent the spectral indices of the specific intensities at the ionization edges of H I (1 ryd) and He II (4 ryd) and they arise from the photoionization integrals for and . Hereafter, we adopt with the assumptions that and . The ratio is insensitive to .
The metagalactic ionizing background radiation is strongly influenced by intergalactic absorption (Ly-forest absorbers) in the ionizing continua of both H I ( eV) and He II ( eV). There may also be internal opacity within the AGN sources, which we parameterize as flux escape fractions (). These internal opacities may be responsible for the small He II proximity zones seen in some QSOs (Schmidt et al. 2018). To evaluate the radiative-transfer effects of QSO emission and IGM absorption, we assume that IGM filtering results in a radiative source function , with emissivity and opacity . The individual QSO sources are characterized by ionizing flux distributions, , multiplied by escape fractions, and at 1 ryd and 4 ryd. The distribution of H I absorbers is expressed as . Studies of the Ly forest with the VLT/UVES spectrograph (Kim et al. 2002) toward eight QSOs covering the Ly forest at found over the range . A more recent survey (Rudie et al. 2013) of 15 AGN at with the Keck/HIRES spectrometer fitted the Ly forest absorbers with a power-law index, between . They also considered broken power-law distributions to better fit the incidence of strong absorbers with , the so-called Lyman-Limit systems (LLS). The high- absorbers () were fitted with a flatter index, . We regard the slope () as a less constrained parameter, depending on which range of column densities is most relevant.
In Appendix A, we describe analytic approximations to the integrated IGM opacities in the Ly forest, using a single index () over appropriate ranges of or . This formulation neglects the opacity from the CGM of galaxies along the sightline. These LLS are rare, and their opacity is non-local, since they typically arise well outside the mean-free path of H I-ionizing photons, physical Mpc (Rudie et al. 2013). In addition, these strong H I absorbers do not contribute appreciably to , since the He II opacity occurs in absorbers with . To a good approximation, we can analyze the ionization conditions in the diffuse IGM from the ratio of emissivities and opacities at the photoionizing continuum edges, 1 ryd (H I) and 4 ryd (He II),
| (2) |
Because the ionization states of H I and He II are largely controlled by the ionizing intensities, , at the two edges, we define , where is the IGM-softened spectral index between 1 and 4 ryd. Assuming radiative equilibrium, . Using equation (2) to evaluate the source function at the two edges, we can express equation (1) as:
| (3) |
where . For convenience, we define the escape-fraction ratio, . In most cases we expect that , since the internal opacity of He II generally exceeds that of H I. After taking the logarithm of both sides and substituting for , we arrive at an analytic expression for the effective spectral index,
| (4) |
The last term on the right-hand side,
| (5) |
represents the additional spectral softening produced by internal absorption in the AGN. This term will be zero () if the H I and He II escape fractions are 100% (or equal).
4 Summary and Implications
A number of papers in the past two decades have calculated the production rates and cosmological radiative transfer of the photons that ionize gas in the IGM and CGM. These include a series of models (Haardt & Madau 1996, 2001, 2012; Madau & Haardt 2009; Fardal et al. 1998; Shull et al. 1999; Faucher-Giguère et al. 2009, 2020). These calculations all assumed 100% escape fractions in the H I and He II continua of Type 1 AGN and steep ionizing spectra with various spectral indices, (Madau & Haardt 2009; Haardt & Madau 2012), (Faucher-Giguère et al. 2009), (Faucher-Giguère 2020), and (Fardal et al. 1998; Shull et al. 1999) based on previous AGN composite spectra from HST/FOS (Zheng et al. 1997; Telfer et al. 2002). The recent composite spectrum of 159 AGN measured by HST/COS has a harder index, between 1–2 ryd. Observations of He II/H I ratios in QSO absorbers require an ionizing background considerably softer than an extrapolation of the spectrum from 1 ryd out to 4 ryd. The intervening IGM may provide insufficient softening to reproduce the large He II/H I ratios.
We propose that many quasars have internal absorption in their He II continuum, to explain the large He II/H I ratios in the IGM and the He II proximity zones around many AGN. Although wavelengths Å are inaccessible to most QSO observations, there is indirect evidence for 4-ryd flux blockage from the small proximity zones of a number of AGN (Schmidt et al. 2018). Observations of the distribution of the He II/H I ratios, , provide constraints on the metagalactic spectral index, , and the escape fraction of 4-ryd continuum photons. To illustrate this quantitatively, we consider mean slopes, and , of the H I absorber distribution found in two recent surveys. Equation (4) with reduces to
| (6) | |||||
| (7) |
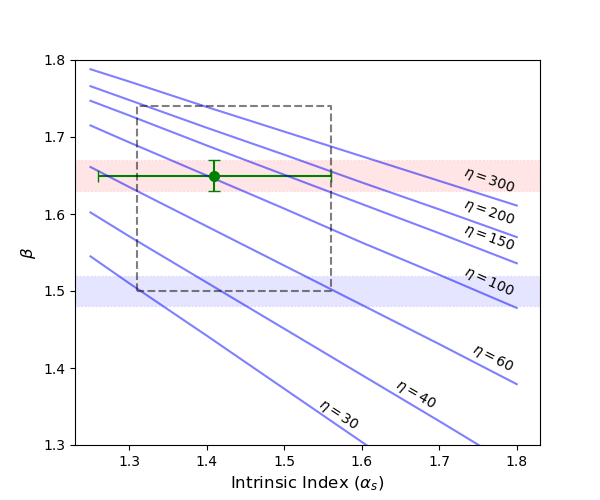
The He II/H I ratio follows from . Figure 4 shows curves of constant on a two-parameter (, ) grid. Recent determinations of are marked as horizontal bands in blue ( from Kim et al. 2002) and red ( from Rudie et al. 2013). The green dot and error bars show possible values for and , and the dashed rectangle covers the approximate range of observations in both HE 2347-4342 and HS 1700+6416. Although the steeper slope () proposed by Rudie et al. (2013) provides reasonable agreement with observed values of , that slope applies to their low-column H I absorbers (). Their sample at high H I column densities is small, with just 11 and 12 absorbers in the last two bins ( and 17.0).
Appendix A shows that most of the IGM opacity comes from strong absorbers, in the range known as partial Lyman-Limit systems: for H I at 1 ryd and for He II at 4 ryd (assuming ). Over this high-column range, Rudie et al. (2013) found that provided a better broken power-law fit, with for the lower column Ly forest. For these reasons, we believe the blue band () may be a better characterization of the opacity of the IGM required for our local source-function modeling. We now discuss the case for internal absorption. We assume that all of the H I-ionizing radiation escapes the AGN () and explore He II escape fractions in the range (). For (or ) internal He II absorption would soften the spectral index of the metagalactic background by an additional for () or by for (). These increases in background spectral index would correspond to ranges of (for ) and (for ).
Our analytic formalism also places a lower limit on the internal absorption at the He II edge, for consistency with maximum values of and the relation . Adopting an upper bound of on He II/H I, we find . The additional spectral softening, , from internal AGN absorption provides a lower limit on . As shown in Table 2 for , the effective indices with (no internal AGN absorption) are ( and (. Thus, the limit () requires () and (). From these limits, we infer that and (). For , these limits are and These values are illustrative, but they suggest that typical He II escape fractions from AGN could range from 50% to 90%. Because individual AGN exhibit variations in spectral index about the mean value (Stevans et al. 2014), a few AGN could have smaller escape fractions, . These sources would produce Ly absorbers with in the proximity zone of the background source or near quasars transverse to the sight line.
In addition to its effects on -ratios, the harder QSO composite index, , could alter the thermal history of the IGM through photoelectric heating. Appendix B analyzes this heating, showing that He II photoelectric heating augments the H I heating by a constant factor (2.77) independent of . This factor arises because a lower intensity at the 4 ryd edge decreases the He II photoionization rate but increases the He II/H I abundance ratio. A naive model, neglecting cosmological adiabatic expansion and balancing H I photoelectric heating with cooling from radiative recombination and free-free emission, would predict large equilibrium temperatures, K, that are relatively insensitive to AGN spectral indices, . The much lower inferred Ly absorber temperatures, K at (Becker et al. 2011; Hiss et al. 2019), likely result from non-equilibrium heating and cooling, including cosmological expansion and Compton cooling off the cosmic microwave background (McQuinn & Upton Sanderbeck 2016).
The existence of internal AGN He II (4-ryd) AGN absorption has several implications:
-
1.
The observed absorption ratios (He II/H I ) and mean AGN spectral index suggest that many AGN have partial flux blockage in their emergent 4-ryd continuum, with . Internal He II absorption at Å reduces the AGN production rate of He II continuum photons and shifts the He II epoch of reionization to lower redshifts.
-
2.
An AGN absorption edge at 54.4 eV, together with flux recovery at higher energies, will affect photoionization models of heavy elements with photoionization thresholds between 3–10 ryd, including effects of cosmological radiative transfer. These effects are significant for ions such as C IV (47.89 eV), C IV (64.49 eV), N IV (47.45 eV), N V (71.47 eV), O III (54.94 eV), as well as higher ions O VI and Ne VIII.
-
3.
Internal AGN absorption at 4 ryd may be responsible for the small He II proximity regions seen in some AGN. The variable sizes of these zones depends on variations in both AGN intrinsic spectral index () and escape fraction (). Separating these effects will require observing large numbers of QSOs to measure the distribution of and and searching for correlation of with the size of proximity zones.
-
4.
Our analytic model for spectral softening by IGM and AGN absorption uses mean values of parameters (, , ). Numerical simulations could improve the model by selecting AGN with a range of spectral indices and escape fractions. These parameters probably depend on properties of the AGN and its host galaxy and vary with redshift.
Appendix A Appendix A: IGM Opacity of H I and He II
As shown below, the opacity at 1 ryd in the photoionized IGM is dominated by Ly-forest absorbers with continuum optical depths (), whereas the He II opacity at 4 ryd comes from absorbers with . This lower range arises from the large He II abundance (He II/H I ). At the photoionization continuum edge of H I, the absorption cross section is cm2. The He II photoionization cross section at 4 ryd is four times smaller, cm2. The column densities, , needed to produce continuum optical depths are cm-2 and cm-2.
The opacity ratio, , therefore samples the Ly forest at different portions of the column-density distribution, expressed here as a power law, . From their Keck/HIRES spectroscopic survey probing the IGM at , Rudie et al. (2013) found that a single index provides a reliable fit for (see their Figure 2). They noted that “a single power law reproduces the distribution with reasonable fidelity” and that “no strong breaks in the distribution are evident.” They also considered broken power-laws to fit the incidence of high column density LLS absorbers (O’Meara et al. 2013), particularly those with . By separately considering pathlengths through the CGM of galaxies located within 300 physical kpc of the sight line, they found additional opacity with power-law indices . Although these broken power-law fits provide more accurate total opacities, we only consider Ly absorbers with to describe radiative conditions in the diffuse IGM. We do so for several reasons. First, the source function, , must reflect local conditions, not opacities from rare, more distant LLS. Second, the higher absorbers are associated with intervening galaxies and overdense portions of the CGM. Third, strong absorbers with are self-shielding in the Lyman continuum () and do not contribute appreciably to the source function. Thus, in the diffuse IGM at , the ionization conditions are dominated by quasars, whose ionizing radiation escapes their host galaxy.
For Poisson distributed absorbers with H I column densities , the mean H I (1 ryd) opacity of the IGM can be expressed (Paresce et al. 1980) as
| (A1) |
where is the distribution of H I absorbers and is the H I continuum optical depth at 1 ryd. We integrate the opacity from to (). Since , we approximate the factor to find
| (A2) |
For observed values, , the H I opacity integral is dominated by absorbers at the upper end of the distribution (). For example, 64% of the opacity (for ) comes from “partial LLS” with . Extending the integration to LLS with would provide an additional 39% to the opacity. However, these LLS are associated with galaxies and their CGM, and they would be opaque in both continua ( and ). In our source-function approach to the ionizing radiation and He II/H I observations, we concentrate on absorbers in the diffuse IGM that are optically thin in 1 ryd and 4 ryd continua.
To evaluate the mean He II opacity at 4 ryd in the optically thin Ly forest, we adopt a constant abundance ratio, , and a ratio of photoionization cross sections, , Because , the upper limit of the He II integral, , corresponds to a smaller H I column density, , at which ,
| (A3) |
With these approximations, we can express the ratio of opacities as
| (A4) |
This analytic relation is employed in equation (2), and it assumes that the local opacities in the IGM are governed by Ly absorbers up to . This formulation neglects the additional opacity from the CGM of galaxies along the sightline. Because these LLS are rare, their opacity is non-local and their numbers are stochastic. In addition, these strong H I absorbers do not contribute appreciably to , since the upper limit of integration for He II () only extends to for , where a single index is a good fit to the distribution of column densities.
Appendix B Appendix B: Thermal Equilibrium with H I and He II Photoionization
In this Appendix, we compute the photoelectric heating of H I and He II and estimate equilibrium temperatures, when balanced against radiative cooling from recombination and free-free emission from H+ and He+2. We also consider other sources of cooling, including cosmological adiabatic expansion and collisional excitation of Ly and metal forbidden-lines. The IGM absorbers are not in equilibrium, and adiabatic cooling can be effective at (Hui & Gnedin 1997). Compton cooling by photons in the cosmic microwave background can be a minor source (McQuinn & Upton Sanderbeck 2016).
The photoionization rates of H I and He II can be approximated as
| (B1) | |||||
| (B3) |
We approximate the photoionization cross sections as and define the cross sections cm2 and cm2 at ionization threshold energies eV (H I) and eV (He II). Here, is the specific intensity (erg cm-2 s-1 Hz-1) integrated over sterradians, and and are the spectral indices of the continuum at 1 ryd and 4 ryd, respectively. After IGM filtering and reprocessing, these indices are uncertain, but we assume they are the same. For highly ionized gas with , the electron density . If the Ly absorbers are in photoionization equilibrium with radiative recombination, , and
| (B4) |
We use the case-A recombination rate coefficient, , for low-density absorbers, which are optically thin to Lyman continuum photons from recombinations to the ground state.
The ionizing radiation injects photoelectrons into the gas, heating the gas at rates and per unit volume, with rate coefficients (erg cm3 s-1)
| (B5) | |||||
| (B6) |
The mean photoelectron energy per ionization, , reflects the fact that photoionization cross sections drop off rapidly above the ionization edges. From the above equations, we find a constant ratio of He II to H I photoelectric heating rates,
| (B7) |
the result of the three relations: , , and the assumption that the term inside brackets is unity. The He II photoelectric heating augments the H I heating by a constant factor (2.77); a lower intensity at the 4 ryd edge decreases but increases the He II/H I abundance ratio (). For the same reasons, the relative values of He II and H I heating should not change with moderate internal AGN absorption.
For a pure hydrogen plasma in thermal equilibrium, ignoring adiabatic expansion or Compton cooling, we balance photoelectric heating (eq. [B5]) with cooling from radiative recombination and free-free emission, expressed as . The factor 1.13 roughly accounts for free-free cooling at K. Substituting for (eq. [B4]), we find a large equilibrium temperature,
| (B8) |
for the QSO spectral index from the HST/COS composite spectrum (Stevans et al. 2014). The temperature drops slightly for the softer spectral indices: 39,500 K for (Telfer et al. 2002) and 37,000 K for (Lusso et al. 2015). Including He II photoelectric boosts the heating from H I alone by a factor of 2.77, and He III radiative raises the cooling by a factor of 1.45. This would lead to an even higher characteristic temperature,
| (B9) |
However, significant cooling comes from cosmological adiabatic expansion, at a rate per unit volume, . The Hubble expansion parameter at can be approximated as . We adopt a total particle density , with mean IGM density and baryon overdensity factor . The ratio of adiabatic cooling to photoelectric heating is then,
| (B10) |
a significant contribution at , although less so for Ly absorbers with . Overdense absorbers will experience relatively more photoelectric heating, since whereas adiabatic cooling is linear with .
Most Ly absorbers have insufficient temperatures to produce significant collisional excitation of the first excited state of hydrogen at 10.2 eV. At , temperatures inferred from Ly line widths and curvature (Becker et al. 2011; Hiss et al. 2019) suggest that K, too low for significant Ly cooling. Collisional excitation of forbidden lines of trace metal ions will contribute some cooling. However, at typical Ly-forest metallicities (), cooling from [O II] and [O III] at 12,000 K is only 10% that from hydrogen radiative recombination and free-free emission.
References
- (1)
- (2) Aver, E., Olive, K. A., & Skillman, E. D. 2015, JCAP, 7, 011
- (3) Becker, G. D., Bolton, J. S., Haehnelt, M. G., & Sargent, W. L. W. 2011, MNRAS, 410, 1096
- (4) Bian, F., & Fan, X. 2020, MNRAS, 493, L69
- (5) Boksenberg, A. & Sargent, W. L. W. 2015, ApJS, 218, 93
- (6) Cooke, R. J., & Fumagalli, M. 2018, Nature Astronomy, 2, 957
- (7) Cyburt, R. H., Fields, B. D., Olive, K. A., & Yeh, T.-H. 2016, RMP, 88, 015004
- (8) Dall’Aglio, A., Wisotzki, L., & Worseck, G. 2008a, A&A, 480, 459
- (9) Dall’Aglio, A., Wisotzki, L., & Worseck, G. 2008b, A&A, 491, 465
- (10) Fardal, M. A., Giroux, M. L., & Shull, J. M. 1998, AJ, 115, 2206
- (11) Faucher-Giguère, C.-A., Lidz, A., Zaldarriaga, M., & Hernquist, L. 2009, ApJ, 703, 1416
- (12) Faucher-Giguère, C.-A. 2020, MNRAS, 493, 1614
- (13) Fechner, C., Baade, R., & Reimers, D. 2004, A&A, 418, 857
- (14) Fechner, C., Reimers, D., Kriss, G. A., et al. 2006, A&A, 455, 91
- (15) Finkelstein, S. L., D’Aloisio, A., Paardekooper, J.-P., et al. 2019, ApJ, 879, 36
- (16) Fox, A., Bergeron, J., & Petitjean, P. 2008, MNRAS, 388, 1557
- (17) Graziani, L., Maselli, A., & Maio, U. 2019, MNRAS, 482, L112
- (18) Green, J. C., Froning, C. S., Osterman, S., et al. 2012, ApJ, 744, 60
- (19) Gunn, J. E., & Peterson, B. A. 1965, ApJ, 142, 1633
- (20) Haardt, F., & Madau, P. 1996, ApJ, 461, 20
- (21) Haardt, F., & Madau, P. 2001, in Clusters of Galaxies and the High Redshift Universe Observed in X-rays, ed. D. M. Neumann & J. T. V. Tran (Saclay: CEA), 64
- (22) Haardt, F., & Madau, P. 2012, ApJ, 746. 125
- (23) Hiss, H., Walther, M., Oñorbe, J., & Hennawi, J. F. 2019, ApJ, 876, 71
- (24) Hui, L., & Gnedin, N. Y. 1997, MNRAS, 292, 27
- (25) Izotov, Y. I., Schaerer, D., Thuan, T. X., et al. 2018, MNRAS, 461, 3683
- (26) Jakobsen, P., Jansen, R. A., Wagner, S., & Reimers, D. 2003, A&A, 397, 891
- (27) Kim, T.-S., Carswell, R. F., Cristiani, S., D’Odorico, S., & Giallongo, E. 2002, MNRAS, 335, 555
- (28) Kriss, J., Shull, J. M., Oegerle, W., et al. 2001, Science, 293, 1112
- (29) Lusso, E., Worseck, G., Hennawi, J. F., et al. 2015, MNRAS, 449, 4204
- (30) Madau, P., & Dickinson, M. 2014, ARA&A, 52, 415
- (31) Madau, P., & Haardt, F. 2009, ApJ, 693, L100
- (32) Madau, P., & Haardt, F. 2015, ApJ, 813, L8
- (33) McQuinn, M., & Upton Sanderbeck, P. R. 2016, MNRAS, 456, 47
- (34) Miralda-Escudé, J., Cen, R., Rauch, M., & Ostriker, J. P. 1996, ApJ, 471, 582
- (35) O’Meara, J. M., Prochaska, J. X., Worseck, G., Chen, H.-W., & Madau, P. 2013, ApJ, 765, 135
- (36) Paresce, F., McKee, C. F., & Bowyer, S. 1980, ApJ, 240, 387
- (37) Peimbert, M., Luridiana, V., & Peimbert, A. 2007, ApJ, 666, 636
- (38) Planck Collaboration et al. 2015, A&A, 594, A13
- (39) Puchwein, E., Bolton, J. S., Haehnelt, M. G., et al. 2015, MNRAS, 450, 4081
- (40) Puchwein, E., Haardt, F., Haehnelt, M. G., & Madau, P. 2019, MNRAS, 485, 47
- (41) Reimers, D., Köhler, S., Wisotzki, L., et al. 1997, A&A, 327, 890
- (42) Richards, G. T., Strauss, M. A., Fan, X., et al. 2006, AJ, 131, 2766
- (43) Rudie, G. C., Steidel, C. C., Shapley, A. E., & Pettini, M. 2013, ApJ, 769, 146
- (44) Schmidt, T. M., Hennawi, J. F., Davies, F. B., et al. 2018, ApJ, 861, 122
- (45) Shapley, A. E., Steidel, C. C., Strom, A. L., et al. 2016, ApJ, 826, L24
- (46) Shull, J. M., Danforth, C. W., Tilton, E. M., et al. 2017, ApJ, 849, 106
- (47) Shull, J. M., France, K., Danforth, C. W., et al. 2010, ApJ, 722, 1312
- (48) Shull, J. M., Roberts, D., Giroux, M. A., Penton, S. V., & Fardal, M. A. 1999, AJ, 118, 1450
- (49) Shull, J. M., Tumlinson, J., Giroux, M. L., et al. 2004, ApJ, 600, 570
- (50) Stevans, M. L, Shull, J. M., Danforth, C. W., & Tilton, E. M. 2014, ApJ, 794, 75
- (51) Syphers, D., & Shull, J. M. 2013, ApJ, 765, 119
- (52) Syphers, D., & Shull, J. M. 2014, ApJ, 784, 42
- (53) Telfer, R., Zheng, W., Kriss, G. A., & Davidsen, A. F. 2002, ApJ, 656, 773
- (54) Tilton, E. M., Stevans, M. L., Shull, J. M., & Danforth, C. W. 2016, ApJ, 817, 56
- (55) Vanzella, E., Nonino, M., Cupani, G., et al. 2018, MNRAS, 476, L15
- (56) Worseck, G., Prochaska, J. X., Hennawi, J. F., & McQuinn, M. 2016, ApJ, 825, 144
- (57) Zheng, W., Kriss, G. A., Telfer, R. et al. 1997, ApJ, 475, 469
- (58) Zheng, W., Kriss, G. A., Deharveng, J.-M., et al. 2004, ApJ, 605, 631
- (59)
| Grating | Setting | Range | Exp. (s) | Obs. Date | Obs. No. |
|---|---|---|---|---|---|
| G130M | 1222 Å | 1067 - 1363 Å | 14813.76 | 2014 July 08 | lc8i01010 |
| G130M | 1222 Å | 1067 - 1363 Å | 14813.76 | 2014 July 12 | lc8i03010 |
| G130M | 1222 Å | 1067 - 1363 Å | 11766.66 | 2014 Aug 28 | lc8i02010 |
| G140L | 1105 Å | 1118 - 2251 Å | 2920.29 | 2014 Aug 28 | lc8i02020 |
| AGN Index | (, )aaValues of softened spectral index () and corresponding He II/H I ratio, determined from eq. (4) for several values of AGN intrinsic spectral index () and Ly-forest column density distributions (, 1.45, 1.50, 1.65). These values neglect the escape fraction term by setting in eq. (4). Internal He II absorption within the AGN would further soften the background spectral index, by , where . | (, )aaValues of softened spectral index () and corresponding He II/H I ratio, determined from eq. (4) for several values of AGN intrinsic spectral index () and Ly-forest column density distributions (, 1.45, 1.50, 1.65). These values neglect the escape fraction term by setting in eq. (4). Internal He II absorption within the AGN would further soften the background spectral index, by , where . | (, )aaValues of softened spectral index () and corresponding He II/H I ratio, determined from eq. (4) for several values of AGN intrinsic spectral index () and Ly-forest column density distributions (, 1.45, 1.50, 1.65). These values neglect the escape fraction term by setting in eq. (4). Internal He II absorption within the AGN would further soften the background spectral index, by , where . | (, )aaValues of softened spectral index () and corresponding He II/H I ratio, determined from eq. (4) for several values of AGN intrinsic spectral index () and Ly-forest column density distributions (, 1.45, 1.50, 1.65). These values neglect the escape fraction term by setting in eq. (4). Internal He II absorption within the AGN would further soften the background spectral index, by , where . |
|---|---|---|---|---|
| (1.78, 21) | (1.88, 24) | (2.01, 29) | (2.67, 67) | |
| (1.94, 26) | (2.06, 31) | (2.21, 38) | (2.91, 100) | |
| (2.11, 33) | (2.25, 40) | (2.41, 50) | (3.19, 148) | |
| (2.28, 42) | (2.43, 51) | (2.61, 66) | (3.48, 220) | |
| (2.44, 52) | (2.61, 66) | (2.81, 81) | (3.77, 327) |