The Effect of Class Imbalance on Precision-Recall Curves
Abstract
In this note I study how the precision of a binary classifier depends on the ratio of positive to negative cases in the test set, as well as the classifier’s true and false positive rates. This relationship allows prediction of how the precision-recall curve will change with , which seems not to be well known. It also allows prediction of how and the Precision Gain and Recall Gain measures of Flach and Kull, (2015) vary with .
Consider a binary classifier, where the predictions change as the threshold for deciding between the two classes is varied. The Receiver Operating Characteristic (or ROC) curve and the Precision-Recall (PR) curve are two ways of summarizing the performance of classifier in this situation. The ROC curve is invariant to the ratio of positive to negative cases in the test set in the population limit, but the PR curve is affected by . Below I show explicitly how the PR curve and derived quantities like the measure (due to Van Rijsbergen, 1979) are affected by . As these are frequently used to assess the performance of classifiers, it is important that the effect of is well understood, and adjusted for (if necessary).
The standard notation (see e.g., Witten et al., 2017, sec. 5.8) for binary classification is summarized below:
| Predicted | Sum | ||
|---|---|---|---|
| Actual | positive | negative | |
| positive | |||
| negative | |||
There are positive and negative datapoints in the dataset, with the true positive rate () and false positive rate () defined as
| (1) |
Let the fraction of positives in the dataset be denoted by , and define the ratio . If we consider the table above normalized by the sample size , then we observe that the table’s entries are fully characterized by the three quantities , and , as the sum of the normalized entries must be 1. The values in the table are usually thought of as empirical counts from a sample of size . However, one can consider the normalized table in the limit , which describes the population properties of the classifier at the threshold chosen.
The ROC curve is a plot of against . As is well known (see e.g., Fawcett, 2006), the population ROC is invariant to ; this is immediate from the definitions of and , which are ratios within the positives and negatives respectively. Empirical ROC curves for will exhibit some variability as varies (and indeed across different samples of the same size).
Precision is defined as
| (2) |
Thus the precision has an explicit dependence on . Note that the as , and also that as if .
The precision-recall curve plots the precision against recall , which is another name for the true positive rate. As recall is invariant to class imbalance, we can consider how the precision varies with at fixed recall. If we start with balanced classes at and gradually decrease 111PR curves are typically used when is small, e.g. in information retrieval settings., we see that the corresponding precision will decrease, because the denominator increases.
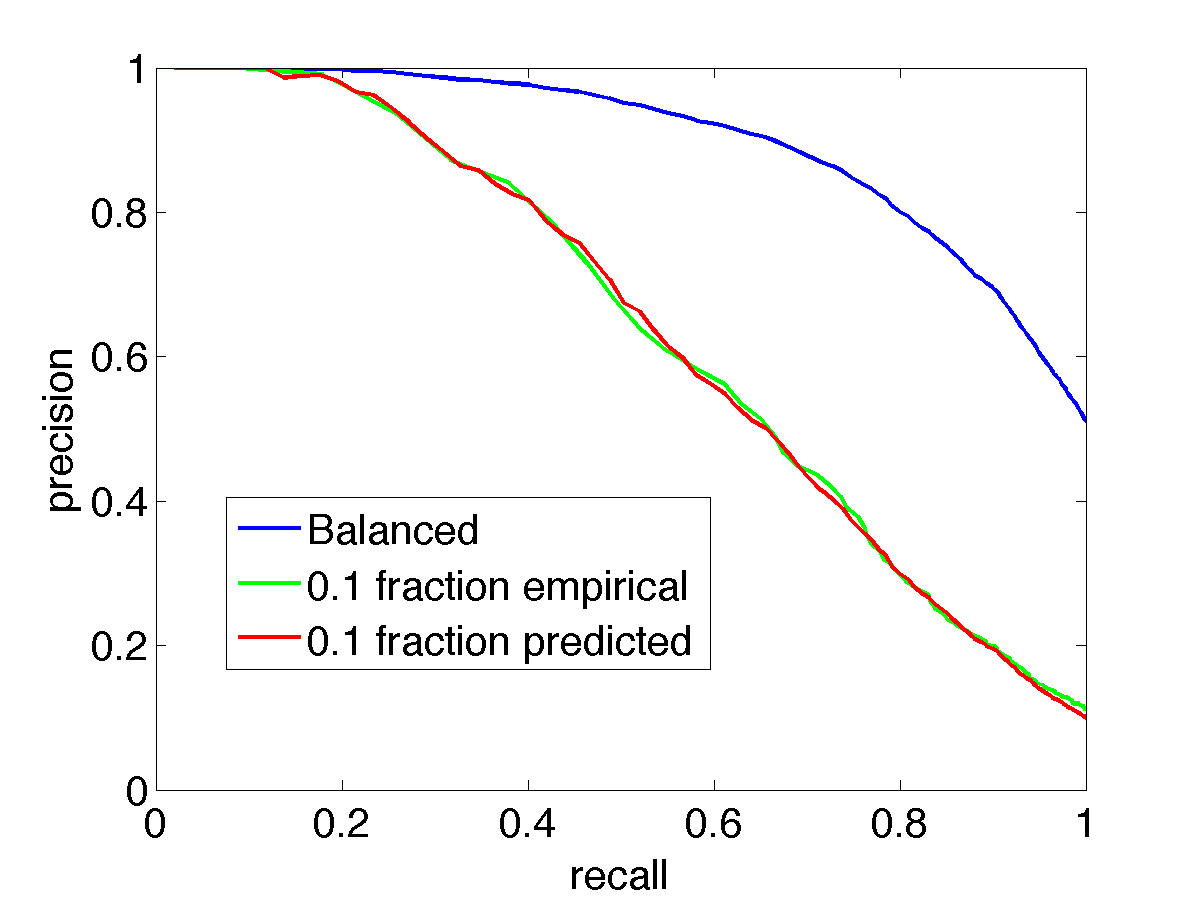
For population values of , and , eq. 2 allows us to transform the precision as a function of . For an empirical sample, it allows us to predict how the PR curve will change with using the empirical values of and . This is illustrated in Fig 1. In this case a simple classification problem with 2d Gaussians was set up, and a logistic regression classifier trained. For a test set with and the blue curve was obtained, and for (, ) the green empirical curve. If at each value of recall the blue curve is scaled as per eq. 2, the red curve is obtained. Note the good agreement between the predicted and actual curves; the differences can be explained by the fact that the empirical green curve uses a smaller number of samples than the red curve (which reweights all of the balanced samples).
The ability to predict how the PR curve varies with does not seem to be well known. For example, Fawcett, (2006, sec 4.2) discusses “class skew” and shows PR curves for and , but makes no comment on their relationship. However, Hoiem et al., (2012) have pointed out that when comparing PR curves for the detection of different visual object classes, the average precision score is sensitive to the value of for each class. To enable a fairer comparison, they suggested using “normalized precision”, which uses a standard value of across classes222Hoiem et al., (2012) considered the PASCAL Visual Object Classes (VOC) dataset across 20 object classes, and chose their standard based on the average proportion of positives across the classes..
Note that class imbalance in the training data should not have an effect on the test ROC and PR curves of a probabilistic classifier333Or of one that provides a graded real-valued output, like a SVM.. To see this, consider the log odds ratio
| (3) |
where . For a generative classifier the LHS is obtained from the RHS and the effect of is immediate. For a discriminative classifier eq. 3 can be used to understand the effect of on the decision boundary. The test ROC and PR curves only depend on the sequence of confusion matrices obtained as the threshold on the classifier’s log odds ratio is changed—the effect of changes in is to shift the threshold, but not to change the sequence obtained.
The measure is commonly used as a figure-of-merit that combines precision and recall. It is defined as a weighted harmonic average
| (4) |
Substituting the expression for the precision from eq. 2, we obtain
| (5) |
and hence
| (6) |
which demonstrates the explicit dependence of on .
The performance of a classifier is often summarized by the area under the PR curve (AUPR), by analogy to the area under the ROC curve (AUROC). However, Flach and Kull, (2015) argue that it is better to summarize precision-recall performance based on the score. This leads them to introduce the Precision Gain and Recall Gain , defined as
| (7) |
Their Precision-Recall-Gain curve plots Precision Gain on the y-axis against Recall Gain on the x-axis in the unit square (i.e., negative gains are ignored). It is interesting to express and in terms of , and . Using we obtain
| (8) | ||||
| (9) |
Notice how is in fact independent of , while has an affine rescaling due to . Interestingly, both and each only depend on two out of the three quantities , and .
The key point of the above analyses is to highlight the explicit effect of the class imbalance as expressed by on the precision, and the precision/recall gains, and to show how these quantities can be adjusted for different if necessary. Like Hoiem et al., (2012), Siblini et al., (2020) make use of a fixed class ratio , and use it to define AUPR, F-score and AUPR Gain scores that thus do not depend on .
Acknowledgements
I thank Nick Radcliffe for a question that started this work off, Tom Dietterich for pointing out the work of Flach and Kull, (2015), Peter Flach for pointing out a typo in eq. 6 in an earlier version, Wissam Siblini for alerting me to Siblini et al., (2020), the anonymous referees for comments that helped improve the paper, and Simão Eduardo, Alfredo Nazábal and Charles Sutton for helpful discussions.
References
- Fawcett, (2006) Fawcett, T. (2006). An introduction to ROC analysis. Pattern Recognition Letters, 27:861–874.
- Flach and Kull, (2015) Flach, P. A. and Kull, M. (2015). Precision-Recall-Gain Curves: PR Analysis Done Right. In Cortes, C., Lawrence, N. D., Lee, D. D., Sugiyama, M., and Garnett, R., editors, Advances in Neural Information Processing Systems 28, pages 838–846.
- Hoiem et al., (2012) Hoiem, D., Chodpathumwam, Y., and Dai, Q. (2012). Diagnosing Error in Object Detectors. In Proceedings of the 12th European Conference on Computer Vision, ECCV 2012.
- Siblini et al., (2020) Siblini, W., Fréry, J., He-Guelton, L., Oblé, F., and Wang, Y. Q. (2020). Master Your Metrics with Calibration. In Berthold, M., Feelders, A., and G., K., editors, Advances in Intelligent Data Analysis XVIII. IDA 2020. Springer, Cham. Lecture Notes in Computer Science, vol 12080.
- Van Rijsbergen, (1979) Van Rijsbergen, C. J. (1979). Information Retrieval. Butterworth-Heinemann, second edition.
- Witten et al., (2017) Witten, I. H., Frank, E., Hall, M. A., and Pal, C. J. (2017). Data Mining. Morgan Kaufmann, fourth edition.