Nearby source interpretation of differences among light and medium composition spectra in cosmic rays
Abstract
Recently the AMS-02 reported the precise measurements of the energy spectra of medium-mass compositions (Neon, Magnesium, Silicon) of primary cosmic rays, which reveal different properties from those of light compositions (Helium, Carbon, Oxygen). Here we propose a nearby source scenario, together with the background source contribution, to explain the newly measured spectra of cosmic ray Ne, Mg, Si, and particularly their differences from that of He, C, O. Their differences at high energies can be naturally accounted for by the element abundance of the nearby source. Specifically, the abundance ratio of the nearby source to the background of the Ne, Mg, Si elements is lower by a factor of than that of the He, C, O elements. Such a difference could be due to the abundance difference of the stellar evolution of the progenitor star or the acceleration process/environment, of the nearby source. This scenario can simultaneously explain the high-energy spectral softening features of cosmic ray spectra revealed recently by CREAM/NUCLEON/DAMPE, as well as the energy-dependent behaviors of the large-scale anisotropies. It is predicted that the dipole anisotropy amplitudes below PeV energies of the Ne, Mg, Si group are smaller than that of the He, C, O group, which can be tested with future measurements.
pacs:
95.85.Ry,96.50.S-,98.38.−j,94.20.wcI Introduction
The measurements of the energy spectra of Galactic cosmic rays (CRs) have entered a precise era, thanks to the contributions of a series of new experiments such as PAMELA, AMS-02, CALET, and DAMPE. Several new features of the CR spectra have been revealed recently, including the hundred-GV hardenings Panov et al. (2009); Ahn et al. (2010); Adriani et al. (2011); Aguilar et al. (2015a, b); Aguilar et al. (2017); Adriani et al. (2019); An et al. (2019) and TV softenings Yoon et al. (2017); Atkin et al. (2018); An et al. (2019). These new results challenge our traditional understanding about the framework of CR production and propagation, imposing new processes or ingredients of the CR problems (e.g., Ohira and Ioka (2011); Yuan et al. (2011); Vladimirov et al. (2012); Tomassetti (2012); Blasi et al. (2012); Guo et al. (2016); Guo and Yuan (2018); Karmanov et al. (2019); Yue et al. (2020); Fang et al. (2020)).
Very recently, the AMS-02 group reported the measurements of the primary CR spectra of mdeium-mass compositions, including the Neon (Ne), Magnesium (Mg), and Silicon (Si) Aguilar et al. (2020). Spectral hardenings above GV have been clearly revealed, consistent with those of other nuclei. Unexpectedly, the rigidity dependence of the mdeium-mass group shows distinct properties from that of lighter compositions above 86.5 GV, which is supposed to be an indication of two different classes of primary CRs Aguilar et al. (2020).
A natural explanation of the AMS-02 results would be a background plus nearby source model, in which the nearby source contributes a small fraction of the CR fluxes above a few hundred GV of rigidities Sveshnikova et al. (2013); Savchenko et al. (2015); Liu et al. (2019); Qiao et al. (2019). This model was shown to be able to explain also the softening behavior of the CR spectra above TV Yoon et al. (2017); Atkin et al. (2018); An et al. (2019). Given proper direction of the nearby source (close to the birth place of the Geminga supernova), the energy-dependences of the amplitudes and phases of the large-scale anisotropies (e.g., Aglietta et al. (1996); Amenomori et al. (2006); Aglietta et al. (2009); Aartsen et al. (2016); Amenomori et al. (2017)) can be well recovered Liu et al. (2019); Qiao et al. (2019). If the abundances of the medium-mass elements of the nearby source are slightly lower than the average of background sources, the resulting high-energy spectra of Ne, Mg, and Si would be softer than that of lighter elements. If this scenario is correct, the CR data provides very useful implications on the chemical composition of the nearby source — either its progenitor or the acceleration process. This is a very important clue in identifying this nearby CR accelerator.
In this work, we work out this model in detail to fit the AMS-02 measurements. Compared with previous works Refs. Liu et al. (2019); Qiao et al. (2019), we pay special attention to the spectral differences between the He, C, O group and the Ne, Mg, Si group as emphasized by the AMS-02 experiment. We argue that such differences actually offer an additional support to the nearby source model, and the precise measurements can help to infer the source properties of CRs. In Sec. II we describe the framework and parameters of the model. In Sec. III we present the fitting results. We conclude our work in Sec. IV with some discussion of the properties of the nearby source.
II Model framework
The sources of the model include two components, a background component diffusively distributed in the Milky Way, and a nearby source. For the background component, we adopt a broken power-law with an exponential cutoff form in rigidity to describe the injection spectrum. The break is to fit the low-energy spectra Yuan (2019). For the nearby source component, a single power-law form with an exponential cutoff is assumed. The spatial distribution of the background source is parameterized as
| (1) |
where kpc, kpc, , and , which roughly traces the distribution of supernova remnants Case and Bhattacharya (1998) but slightly adjusted.
For the propagation of CRs in the Milky Way, we adopt a spatially-dependent diffusion approach Tomassetti (2012, 2015); Guo et al. (2016); Feng et al. (2016). Note that the original motivation of the spatially-dependent diffusion was to explain the hundred-GV spectral hardenings of CRs. In principle it is not necessary to keep this requirement in our current model if we limit our studies to the CR spectra only. Nevertheless, the spatially-dependent diffusion assumption adopted here is well motivated by the HAWC observations of extraordinary slow diffusion of particles around pulsars in the Galactic plane Abeysekara et al. (2017) compared with that inferred from the secondary CRs Yuan et al. (2017), as well as the explanation of the anisotropy amplitudes at very high energies ( TeV) Liu et al. (2019); Qiao et al. (2019).
The general picture is that CRs diffuse much slower in the Galactic disk where many sources drive the medium to a very turbulent state, and faster in the halo. The spatial diffusion coefficient is parameterized as
| (2) |
where is the particle velocity, is the rigidity, and is the normalization and power-law slope of the diffusion coefficient in the halo (when ). The spatially-dependent part of the diffusion coefficient is assumed to be inversely correlated with the source distribution as
| (3) | |||||
where denotes the half thickness of the slow-diffusion halo, is a normalization factor, and characterizes the sharpness between the disk and halo. For (the disk), the diffusion coefficient is obviously anti-correlated with the source distribution . The diffusion coefficient becomes to the traditional form of in the halo. The reacceleration effect can be characterized by a diffusion in the momentum space. The momentum diffusion coefficient relates to via the effective Alfvenic velocity Seo and Ptuskin (1994), as , where .
III Results
Fig. 1 displays the comparison between the model predictions and the measurements, for the energy spectra of He, C, O, and Ne, Mg, Si species of CRs. In this calculation, the spectral indices of the background are 2.20 and 2.36 for rigidities below and above 7.2 GV, and the cutoff rigidity is about 7.0 PV. The spectral index for the nearby source is 2.06, and the cutoff rigidity is about 30 TV. Note that the model parameters differ slightly from that of previous works Liu et al. (2019); Qiao et al. (2019), due partly to the inclusion of new AMS-02 Ne, Mg, Si data in the fitting. Furthermore, we extend the fitting to energies below 100 GeV, taking into account the solar modulation effect, which is expected to be more self-consistent. The nearby source is assumed to be located at , . Its distance is adopted to be kpc, and its age is yr, which are similar with that of (the birth place of) Geminga Smith et al. (1994); Manchester et al. (2005). As for the relative abundances, the ratio of the nearby source to the background is assumed to be 1.7 times lower for the Ne, Mg, Si group than that for the He, C, O group. To fit the low-energy data, a force-field solar modulation model with a modulation potential of GV is applied Gleeson and Axford (1968). It is shown that this model can well describe the data.
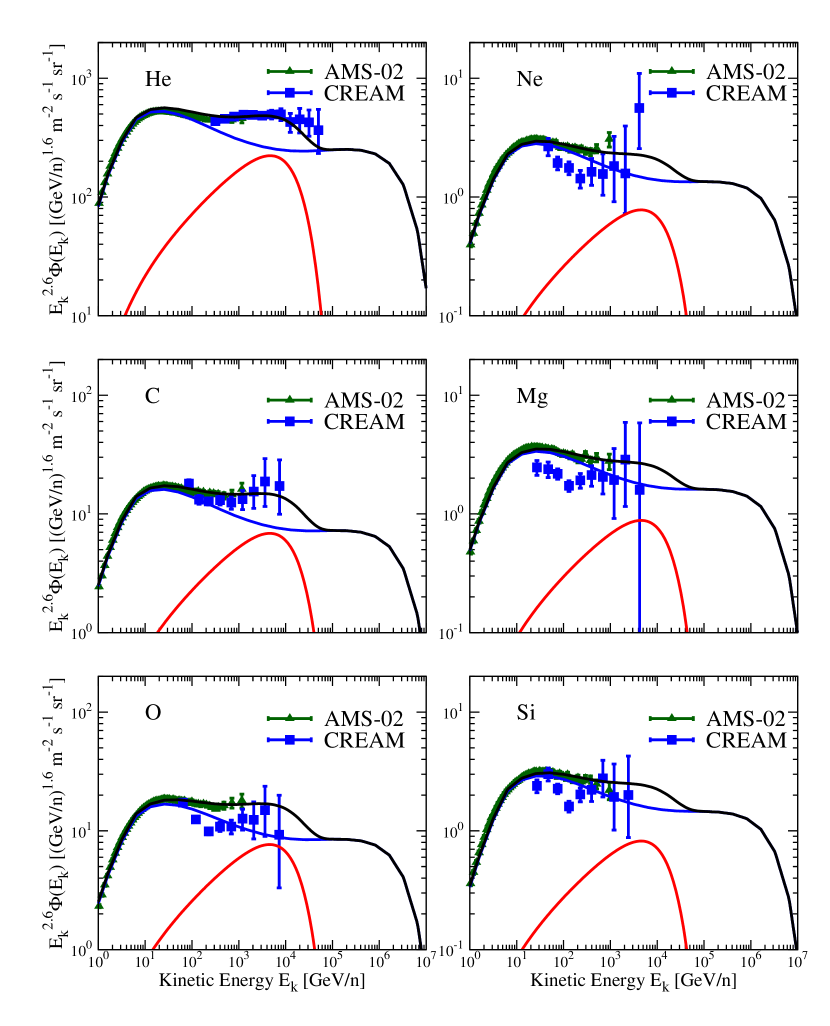
For the background spectra, the spatially-dependent diffusion can give a gradual spectral hardening, due to the fact that the rigidity-dependence slope of the diffusion coefficient is smaller in the disk, resulting in a harder high-energy component Feng et al. (2016). This property should be universal for all species, and thus is not enough to account for the differences between the He, C, O group and the Ne, Mg, Si group. As we have discussed before, the spatially-dependent diffusion is well motivated by the -ray and the very-high-energy anisotropy observations, which is therefore included in this work.
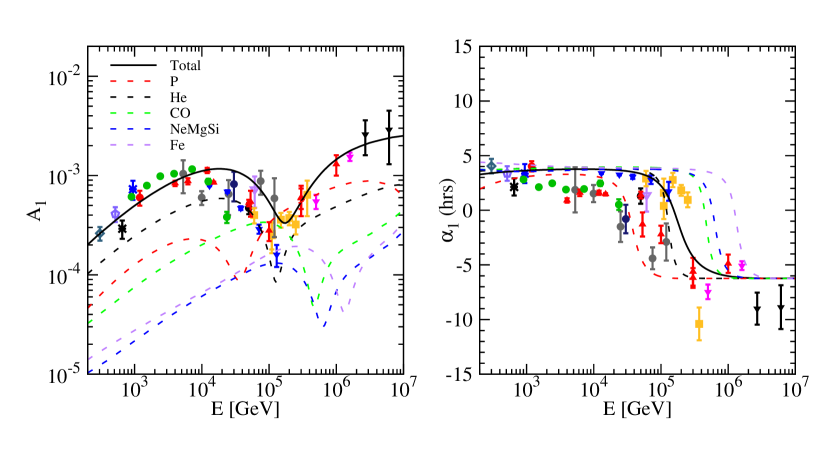
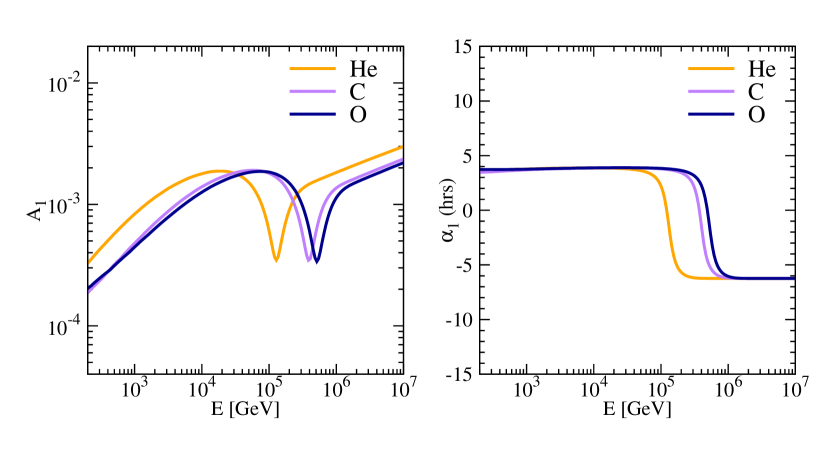
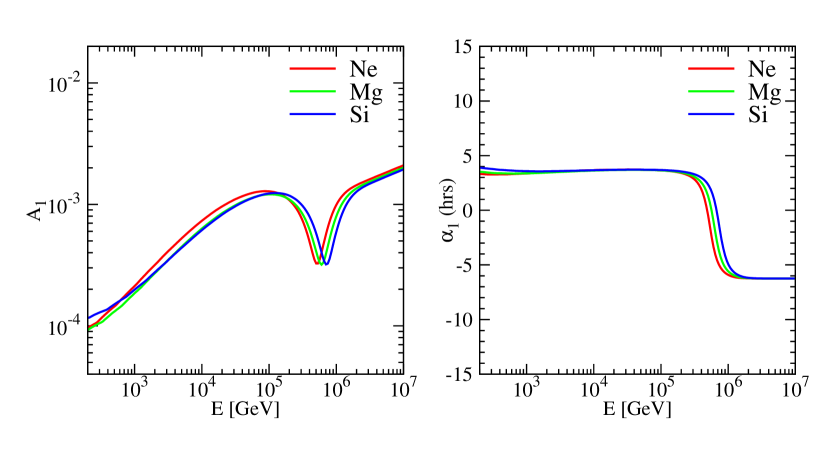
Fig. 2 shows the model predicted amplitudes and phases of the dipole anisotropies as functions of energies, compared with the data. The dip of the amplitudes and phase-flipping around 100 TeV are due to the transition of the dominant component of the CR streamings from the nearby source to the background component, as shown in Ref. Liu et al. (2019). The contribution to the energy spectra from the nearby source is, however, sub-dominant compared with the background component. It is interesting to note that below the dip, the anisitropies are dominated by the helium component. In this model, the anisotropy amplitude is sensitive to the relative flux differences between the background component and the nearby source component. Due to a relatively high helium contribution from the nearby source Qiao et al. (2019), helium nuclei dominate the total anisotropies of all CR particles in the low energy range.
The differences of the element abundances between the nearby source and the background directly imprint on the anisotropies of different species, as shown in Fig. 3. The peak values of the anisotropy amplitudes around 100 TeV, which are mainly due to the nearby source, show a difference of between the He, C, O group and the Ne, Mg, Si group. The forthcoming measurements of the evolution of anisotropies of different mass groups by e.g., the Large High Altitude Air Shower Observatory Bai et al. (2019) may test this prediction.
IV Conclusion and discussion
In this work we employ the nearby source scenario to explain the newest measurements of spectral structures of CRs. This simple model can naturally explain the spectral hardenings of CR nuclei around 200 GV, the softenings around 10 TV, and the energy-dependence of the amplitudes and phases of the large-scale anisotropies. The observed spectral differences between the He, C, O group and the Ne, Mg, Si group can be understood as the slightly different element abundances of the nearby source from that of the background sources. It is natural that the source abundances of CRs differ from one to another, depending on e.g., the progenitor star’s properties and/or the environments of the CR acceleration. The amplitudes of low-energy (PeV) anisotropies, which are dominated by the nearby source in this model, are smaller by a factor of for the Ne, Mg, Si group than the He, C, O group. This prediction can be tested with future measurements of anisotropies of different mass groups.
To fit the data, it is required that the nearby source has relatively higher abundances of He, C, O, compared with Ne, Mg, Si. There are many factors affecting the nucleosynthesis inside a star. Some key parameters include the mass, initial metalicity, rotation, convection, and so on. It is likely that a star with relatively higher mass or higher spin tends to generate less Ne, Mg, Si, compared with a lower mass/spin star (e.g., Hirschi et al. (2005)). Therefore, the AMS-02 results may suggest that the progenitor of the nearby source is a relatively high-mass/high-spin star.
It is also possible that the acceleration of different elements at the source may give such a difference. The particle acceleration depends on the shock properties and the environment parameters. Although all these species discussed in this work have , their ionization histories may be different due to different energy levels of electrons. The ionization histories may affect the injection and acceleration efficiency of the nuclei, resulting in different abundances in CRs (e.g., Casse and Goret (1978)). Alternatively, it was expected that the condensation of elements into grains affect the acceleration efficiencies of different species (e.g., Ellison et al. (1997)). The so-called refractory elements such as Mg, Al, Si are likely locked into grains are accelerated more efficiently than in the interstellar gas phase. If the dust fraction of the nearby source environment is smaller than that of the Milky Way average, the relative abundances of the Ne, Mg, Si particles could be lower.
Acknowledgements.
We thank Hai-Ning Li, Xin-Lian Luo, and Bo Zhang for helpful discussion. This work is supported by the National Key Research and Development Program of China (Nos. 2018YFA0404203, 2016YFA0400200), the National Natural Science Foundation of China (Nos. 11722328, 11525313, U1738205, 11851305), the 100 Talents program of Chinese Academy of Sciences, and the Program for Innovative Talents and Entrepreneur in Jiangsu.References
- Panov et al. (2009) A. D. Panov, et al., Bulletin of the Russian Academy of Science, Phys. 73, 564 (2009), eprint 1101.3246.
- Ahn et al. (2010) H. S. Ahn, et al., Astrophys. J. Lett. 714, L89 (2010), eprint 1004.1123.
- Adriani et al. (2011) O. Adriani, et al., Science 332, 69 (2011), eprint 1103.4055.
- Aguilar et al. (2015a) M. Aguilar, et al., Phys. Rev. Lett. 114, 171103 (2015a).
- Aguilar et al. (2015b) M. Aguilar, et al., Phys. Rev. Lett. 115, 211101 (2015b).
- Aguilar et al. (2017) M. Aguilar, et al., Phys. Rev. Lett. 119, 251101 (2017).
- Adriani et al. (2019) O. Adriani, et al., Phys. Rev. Lett. 122, 181102 (2019), eprint 1905.04229.
- An et al. (2019) Q. An, et al., Science Advances 5, eaax3793 (2019), eprint 1909.12860.
- Yoon et al. (2017) Y. S. Yoon, et al., Astrophys. J. 839, 5 (2017), eprint 1704.02512.
- Atkin et al. (2018) E. Atkin, et al., Soviet Journal of Experimental and Theoretical Physics Letters 108, 5 (2018), eprint 1805.07119.
- Ohira and Ioka (2011) Y. Ohira and K. Ioka, Astrophys. J. Lett. 729, L13 (2011), eprint 1011.4405.
- Yuan et al. (2011) Q. Yuan, B. Zhang, and X.-J. Bi, Phys. Rev. D 84, 043002 (2011), eprint 1104.3357.
- Vladimirov et al. (2012) A. E. Vladimirov, G. Jóhannesson, I. V. Moskalenko, and T. A. Porter, Astrophys. J. 752, 68 (2012), eprint 1108.1023.
- Tomassetti (2012) N. Tomassetti, Astrophys. J. Lett. 752, L13 (2012), eprint 1204.4492.
- Blasi et al. (2012) P. Blasi, E. Amato, and P. D. Serpico, Phys. Rev. Lett. 109, 061101 (2012), eprint 1207.3706.
- Guo et al. (2016) Y.-Q. Guo, Z. Tian, and C. Jin, Astrophys. J. 819, 54 (2016).
- Guo and Yuan (2018) Y.-Q. Guo and Q. Yuan, Phys. Rev. D 97, 063008 (2018), eprint 1801.05904.
- Karmanov et al. (2019) D. Karmanov, I. Kovalev, I. Kudryashov, A. Kurganov, V. Latonov, A. Panov, D. Podorozhnyy, and A. Turundaevskiy, arXiv e-prints arXiv:1907.05987 (2019), eprint 1907.05987.
- Yue et al. (2020) C. Yue, et al., Frontiers of Physics 15, 24601 (2020), eprint 1909.12857.
- Fang et al. (2020) K. Fang, X.-J. Bi, and P.-F. Yin, arXiv e-prints arXiv:2003.13635 (2020), eprint 2003.13635.
- Aguilar et al. (2020) M. Aguilar, et al., Phys. Rev. Lett. 124, 211102 (2020).
- Sveshnikova et al. (2013) L. G. Sveshnikova, O. N. Strelnikova, and V. S. Ptuskin, Astroparticle Physics 50, 33 (2013), eprint 1301.2028.
- Savchenko et al. (2015) V. Savchenko, M. Kachelrieß, and D. V. Semikoz, Astrophys. J. Lett. 809, L23 (2015), eprint 1505.02720.
- Liu et al. (2019) W. Liu, Y.-Q. Guo, and Q. Yuan, J. Cosmol. Astropart. Phys. 10, 010 (2019), eprint 1812.09673.
- Qiao et al. (2019) B.-Q. Qiao, W. Liu, Y.-Q. Guo, and Q. Yuan, J. Cosmol. Astropart. Phys. 2019, 007 (2019), eprint 1905.12505.
- Aglietta et al. (1996) M. Aglietta, et al., Astrophys. J. 470, 501 (1996).
- Amenomori et al. (2006) M. Amenomori, et al., Science 314, 439 (2006), eprint astro-ph/0610671.
- Aglietta et al. (2009) M. Aglietta, et al., Astrophys. J. Lett. 692, L130 (2009), eprint 0901.2740.
- Aartsen et al. (2016) M. G. Aartsen, et al., Astrophys. J. 826, 220 (2016), eprint 1603.01227.
- Amenomori et al. (2017) M. Amenomori, et al., Astrophys. J. 836, 153 (2017), eprint 1701.07144.
- Yuan (2019) Q. Yuan, Science China Physics, Mechanics, and Astronomy 62, 49511 (2019), eprint 1805.10649.
- Case and Bhattacharya (1998) G. L. Case and D. Bhattacharya, Astrophys. J. 504, 761 (1998), eprint astro-ph/9807162.
- Tomassetti (2015) N. Tomassetti, Phys. Rev. D 92, 081301 (2015), eprint 1509.05775.
- Feng et al. (2016) J. Feng, N. Tomassetti, and A. Oliva, Phys. Rev. D 94, 123007 (2016), eprint 1610.06182.
- Abeysekara et al. (2017) A. U. Abeysekara, et al., Science 358, 911 (2017), eprint 1711.06223.
- Yuan et al. (2017) Q. Yuan, S.-J. Lin, K. Fang, and X.-J. Bi, Phys. Rev. D 95, 083007 (2017), eprint 1701.06149.
- Seo and Ptuskin (1994) E. S. Seo and V. S. Ptuskin, Astrophys. J. 431, 705 (1994).
- Evoli et al. (2008) C. Evoli, D. Gaggero, D. Grasso, and L. Maccione, J. Cosmol. Astropart. Phys. 10, 18 (2008), eprint 0807.4730.
- Evoli et al. (2017) C. Evoli, D. Gaggero, A. Vittino, G. Di Bernardo, M. Di Mauro, A. Ligorini, P. Ullio, and D. Grasso, J. Cosmol. Astropart. Phys. 2, 015 (2017), eprint 1607.07886.
- Smith et al. (1994) V. V. Smith, K. Cunha, and B. Plez, Astron. Astrophys. 281, L41 (1994).
- Manchester et al. (2005) R. N. Manchester, G. B. Hobbs, A. Teoh, and M. Hobbs, Astron. J. 129, 1993 (2005), eprint astro-ph/0412641.
- Gleeson and Axford (1968) L. J. Gleeson and W. I. Axford, Astrophys. J. 154, 1011 (1968).
- Sakakibara et al. (1973) S. Sakakibara, H. Ueno, K. Fujimoto, I. Kondo, and K. Nagashima, in International Cosmic Ray Conference (1973), vol. 2 of International Cosmic Ray Conference, p. 1058.
- Bercovitch and Agrawal (1981) M. Bercovitch and S. P. Agrawal, in International Cosmic Ray Conference (1981), vol. 10 of International Cosmic Ray Conference, pp. 246–249.
- Alexeyenko et al. (1981) V. V. Alexeyenko, A. E. Chudakov, E. N. Gulieva, and V. G. Sborschikov, in International Cosmic Ray Conference (1981), vol. 2 of International Cosmic Ray Conference, p. 146.
- Alekseenko et al. (2009) V. V. Alekseenko, A. B. Cherniaev, D. D. Djappuev, A. U. Kudjaev, O. I. Michailova, Y. V. Stenkin, V. I. Stepanov, and V. I. Volchenko, Nuclear Physics B Proceedings Supplements 196, 179 (2009), eprint 0902.2967.
- Andreyev et al. (1987) Y. M. Andreyev, A. E. Chudakov, V. A. Kozyarivsky, A. M. Sidorenko, T. I. Tulupova, and A. V. Voevodsky, in International Cosmic Ray Conference (1987), vol. 2 of International Cosmic Ray Conference, p. 22.
- Swinson and Nagashima (1985) D. B. Swinson and K. Nagashima, Planet. Space Sci. 33, 1069 (1985).
- Munakata et al. (1995) K. Munakata, et al., in International Cosmic Ray Conference (1995), vol. 4, p. 639.
- Mori et al. (1995) S. Mori, S. Yasue, K. Munakata, C. Kato, S. Akahane, M. Koyama, and T. Kitawada, in International Cosmic Ray Conference (1995), vol. 4 of International Cosmic Ray Conference, p. 648.
- Fenton et al. (1995) K. B. Fenton, A. G. Fenton, and J. E. Humble, in International Cosmic Ray Conference (1995), vol. 4, p. 635.
- Ambrosio et al. (2003) M. Ambrosio, et al., Phys. Rev. D 67, 042002 (2003), eprint astro-ph/0211119.
- Gombosi et al. (1975) T. Gombosi, J. Kóta, A. J. Somogyi, A. Varga, B. Betev, L. Katsarski, S. Kavlakov, and I. Khirov, in International Cosmic Ray Conference (1975), vol. 2 of International Cosmic Ray Conference, pp. 586–591.
- Aglietta et al. (1995) M. Aglietta, et al., in International Cosmic Ray Conference (1995), vol. 2 of International Cosmic Ray Conference, p. 800.
- Chiavassa et al. (2015) A. Chiavassa, et al., in 34th International Cosmic Ray Conference (ICRC2015) (2015), vol. 34 of International Cosmic Ray Conference, p. 281.
- Abbasi et al. (2010) R. Abbasi, et al., Astrophys. J. Lett. 718, L194 (2010), eprint 1005.2960.
- Aartsen et al. (2013) M. G. Aartsen, et al., Astrophys. J. 765, 55 (2013), eprint 1210.5278.
- Bartoli et al. (2015) B. Bartoli, et al., Astrophys. J. 809, 90 (2015).
- Amenomori et al. (2005) M. Amenomori, et al., Astrophys. J. Lett. 626, L29 (2005), eprint astro-ph/0505114.
- Amenomori et al. (2015) M. Amenomori, et al., in 34th International Cosmic Ray Conference (ICRC2015) (2015), vol. 34 of International Cosmic Ray Conference, p. 355.
- Bai et al. (2019) X. Bai, et al., arXiv e-prints (2019), eprint 1905.02773.
- Hirschi et al. (2005) R. Hirschi, G. Meynet, and A. Maeder, Astron. Astrophys. 433, 1013 (2005), eprint astro-ph/0412454.
- Casse and Goret (1978) M. Casse and P. Goret, Astrophys. J. 221, 703 (1978).
- Ellison et al. (1997) D. C. Ellison, L. O. Drury, and J.-P. Meyer, Astrophys. J. 487, 197 (1997), eprint astro-ph/9704293.