Effect of uniaxial stress on the electronic band structure of NbP
Abstract
The Weyl semimetal NbP exhibits a very small Fermi surface consisting of two electron and two hole pockets, whose fourfold degeneracy in space is tied to the rotational symmetry of the underlying tetragonal crystal lattice. By applying uniaxial stress, the crystal symmetry can be reduced, which successively leads to a degeneracy lifting of the Fermi-surface pockets. This is reflected by a splitting of the Shubnikov-de Haas frequencies when the magnetic field is aligned along the axis of the tetragonal lattice. In this study, we present the measurement of Shubnikov-de Haas oscillations of single-crystalline NbP samples under uniaxial tension, combined with state-of-the-art calculations of the electronic band structure. Our results show qualitative agreement between calculated and experimentally determined Shubnikov-de Haas frequencies, demonstrating the robustness of the band-structure calculations upon introducing strain. Furthermore, we predict a significant shift of the Weyl points with increasing uniaxial tension, allowing for an effective tuning to the Fermi level at only 0.8 % of strain along the axis.
I Introduction
The symmetry and topology of electronic band structures in crystalline materials is inherently connected to the symmetry of the underlying crystal lattice. A powerful experimental tool for the exploration of the symmetry dependence of electronic properties is the application of uniaxial stress, as it allows to reduce the symmetry of the crystal lattice and thus provides a rather different kind of information than application of hydrostatic pressure. In recent years, the interest in topological properties of electronic band structures surged, which also aroused the interest in studying the uniaxial strain response of materials with remarkable topological band-structure features, using both theoreticalLiu2014 ; Young2011 ; Liu2011 ; Battilomo2019 ; Lima2019 ; Zhao2015 ; Zhang2016 ; Winterfeld2013 ; Zhang2011 ; Teshome2019 ; Shao2017 ; Tajkov2019 and experimental Mutch2019 ; LiuY2014 ; Wang2017 ; Schindler2017 ; Hwang2014 methods.
One of those materials is the semimetallic transition-metal monopnictide NbP, which has recently stimulated numerous studiesShekhar2015 ; Klotz2016 ; Lee2015 ; Wu2017 ; Liu2016 ; dosReis2016 ; Belopolski2016 ; Souma2016 ; Zheng2016 ; Wang2016 ; Niemann2017 ; Gooth2017 ; Sergelius2016 ; Modic2019 ; Neubauer2018 ; Xu2017 ; Zheng2017 ; Chang2016 ; Sun2015 . It exhibits a very small Fermi sea consisting of two electron and two hole pocketsLee2015 ; Klotz2016 , whose fourfold degeneracy in space is tied the rotational symmetry of the underlying tetragonal lattice. Cyclotron masses in the order of 5-15% of the free electron mass and large charge-carrier mobilities in the order of Shekhar2015 give rise to an extremely large magnetoresistance (MR) of up to at 1.8 K and 9 T in the cleanest NbP samplesShekhar2015 , superimposed by pronounced Shubnikov-de Haas (SdH) oscillations. The small and highly degenerate pockets and the accompanied experimental access via SdH oscillations render NbP a promising platform for studying the symmetry-breaking of the electronic bands induced by uniaxial stress. As a member of the TaAs family, NbP is predictedHuang2015 ; Weng2015 to exhibit 12 pairs of Weyl points, i.e., crossings of valence and conduction bands with nearly linear energy-momentum dispersion which are topologically protected by the broken inversion symmetry of the crystal lattice. They can be classified into two four- and eightfold energy-degenerate groups, whose degeneracy is also tied to the rotational symmetry of the crystal lattice. The existence of Weyl points near the Fermi level is thought to account for the ultrahigh mobilities observed in NbPShekhar2015 ; Wang2016 . The Fermi surface of NbP has been studiedKlotz2016 theoretically by means of ab-initio density functional theory (DFT) calculations as well as experimentally by analyzing the de Haas-van Alphen oscillations found in the magnetic-torque signal. Measuring magnetic quantum oscillations by means of SdH experiments, also the evolution of the Fermi surface of NbP with applying hydrostatic pressure has been probeddosReis2016 . These experiments showed a relatively stable behavior of the SdH frequencies but significant changes of their amplitudes, indicating slight deformation of the electron and hole pockets. The effect of uniaxial stress on the electronic band structure of NbP has not yet been investigated, however, it is particularly interesting as the stress-induced breaking of the fourfold rotational symmetry is expected to lift the degeneracies of the Fermi pockets and the Weyl points.
In this paper, we report on the effect of uniaxial stress on the Fermi surface of NbP, determined via SdH oscillations in the MR of two single-crystalline NbP samples (Sample 1 and 2) subjected to direct application of uniaxial tension in a three-piezo stack apparatus (CS100, Razorbill Instruments Ltd). For Sample 1, the magnetic field was applied along a high-symmetry direction, resulting in a splitting of the SdH frequencies upon applying uniaxial stress due to the breaking of the fourfold rotational symmetry and thus lifting of the Fermi-pocket degeneracy. In contrast, the SdH frequencies in Sample 2, for which has been applied along a low-symmetry direction, did not exhibit splitting and just shifted upon increasing strain, as in that direction no crystalline symmetry is broken. Both trends are consistent and reversible with varying , and are in good agreement with our DFT calculations.
II Methods
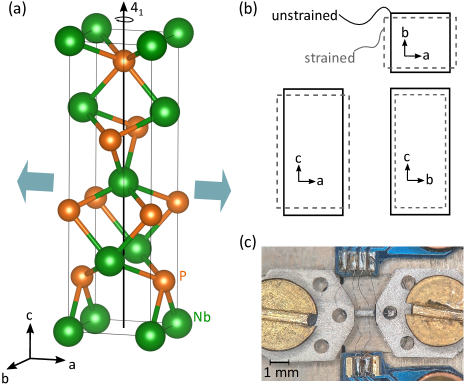
NbP has a non-centrosymmetric tetragonal crystal lattice (space group , No. 109) with the lattice parameters and Greenblatt1996 . The crystal structure is shown in Fig. 1(a).
Single crystals of NbP were grown using chemical vapor transport reactions and oriented using X-ray diffraction. We cut two 3 mm-long bar-shaped samples along the axis from the same single-crystalline piece. Sample 1 is wide and thick, with the shortest side along the axis. Sample 2 is wide and thick, with the shortest side along the axis.
In order to determine the elastic response of NbP to applied uniaxial stress, the elastic constants have been measured on a third sample of the same batch using an ultrasound pulse-echo technique at liquid-nitrogen temperature. For that, the main crystal planes as well as the [110]-planes were carefully polished and two lithium niobate () transducers (Z-cut for longitudinal waves and X-cut for transverse waves) were glued to opposite parallel surfaces for excitation and detection of elastic waves. Ultrasound propagation was measured at with sound-pulse durations ranging from .
For studying the SdH oscillations, electrical-transport measurements have been carried out at temperatures between and in a Quantum Design Physical Property Measurement system (PPMS) equipped with a 9 T magnet (results shown only for ). In all measurements, current has been applied along the axis, i.e., parallel to the uniaxial stress . The resistivity and Hall resistivity have been measured in a 4-probe configuration using Stanford SR-830 lock-in amplifiers with a reference frequency of 117.23 Hz and an excitation current of 1 mA. Electrical contacts were fabricated using Pt wire and silver paint.
After characterizing the samples in the unstrained state, they were subsequently mounted to the strain cell using titanium plates and spacers with the same height as the samples, glued from top and bottom with insulating expoxy (Stycast 2850FT, Loctite) and tightened with brass screws [see Fig. 1(c)]. The length of the strained part of the sample is approximately 1-1.5 mm. The displacement is measured via a pre-calibrated capacitor, using an LCR-Meter (E4980 AL, Keysight) at 27.7 kHz. The peculiarities of this strain cell are extensively covered in Ref. Hicks2014, . Notably, the size and homogeneity of the effective strain sensitively depend on a number of parameters, most importantly the sample’s spring constant as well as the thickness and stiffness of the epoxy. The setup with fixation from both bottom and top of the sample has been reportedHicks2014 to exhibit a reasonable degree of homogeneity in the center part of the strained sample, which is where we probed the voltage. At 2 K, the maximum capacitance range in our strain cell was 880-945 fF for Sample 1 and 925-950 fF for Sample 2; in that range the displacement (few ) as a function of capacitance can be approximated as linear. Overreading of the displacement due to device deformation is taken into account with a correction factor , where is the torsional stiffness of the strain cell and accounts for geometric details. Strain losses due to the finite shear stiffness of the epoxy are accounted for with another correction factor, which is taken to be 80% as estimated in previous works on this type of strain cell and same epoxySteppke2017 ; Jo2019 . During the mounting procedure, heat curing of the epoxy and thus thermal expansion of the piezoelectric stacks and other parts of the chassis lead to a deviation of the sample from the zero-strain state with respect to the calibration when cooled back to room temperature. We account for this by subtracting a constant offset, such that a linear extrapolation of the SdH frequencies under strain intersects with the SdH frequency in the unstrained state. This yielded a moderate compression of for Sample 1 and for Sample 2 at room temperature without having any voltage applied to the piezoelectric stacks.
For our ab-initio investigations of the electronic band structure, we employ DFT as implemented in the VASP package kresse1996 . Here, plane waves with pseudopotentials are used as a basis set and the generalized-gradient approximation (GGA) perdew1996 is utilized for the description of the exchange-correlation potential. For calculating fine meshes in the Brillouin zone we create a tight-binding Hamiltonian from Wannier functions using the Wannier90 package Mostofi2008 with initial projections to the orbitals of Nb and to the orbitals of P. For the evaluation of the extremal orbits a mesh with a resolution better than 0.004 was used.
III Elastic properties
To determine the elastic response for a given applied uniaxial stress and to be able to estimate the effectively applied strain in the samples, the elastic stiffness tensor of NbP needs to be considered. Using Voigt notation (, , , , , ), the sample’s strain components are related to the applied stress components via . For a tetragonal crystal holds
| (1) |
We determined all elastic constants except for via measurement of the speed of sound for longitudinal and transverse modes along the main axes as well as along [110], being the mass density ( for NbPGreenblatt1996 ). The results are shown in Tab. 1 and show good agreement with the values calculated from DFTLiu2017 .
Applying uniaxial tension along (, = 0 for ) results in strain along the same axis, where the Young’s modulus in that configuration holds
| (2) |
being the first component of the elastic compliance tensor . Given the good agreement between experimentally determined and theoretical elastic constants, we used the calculated valueLiu2017 to estimate the Young’s modulus, yielding ( using only the calculated values). With , being the sample cross section area and its length, the sample spring constant yields for Sample 1 and for Sample 2. This results in an about and too large displacement value due to cell deformation in Sample 1 and Sample 2, respectively.
Naturally, tension along results in compression along with the Poisson ratio
| (3) |
and along , respectively, with
| (4) |
This yields and ( and from calculated values). In our DFT calculations, the latter were used. The effect of uniaxial stress on the crystal symmetry is illustrated in Fig. 1(b): the fourfold rotational symmetry, more precisely the screw operation parallel to the axis of the tetragonal lattice, is broken and the crystal symmetry reduces to an orthorhombic lattice. In our setup, only the displacement along the axis is measured, allowing for the determination of .
| Mode | 111The theoretical values are taken from Ref. Liu2017, . | ||
| 7.33(14) | 350(13) | 349.2 | |
| 6.4(5) | 270(40) | 285.9 | |
| 4.09(5) | 109(3) | 111.9 | |
| 5.53(8) | 200(6) | 199.7 | |
| 3.2(2) | 210(40) () | 164.7 () |
IV Results
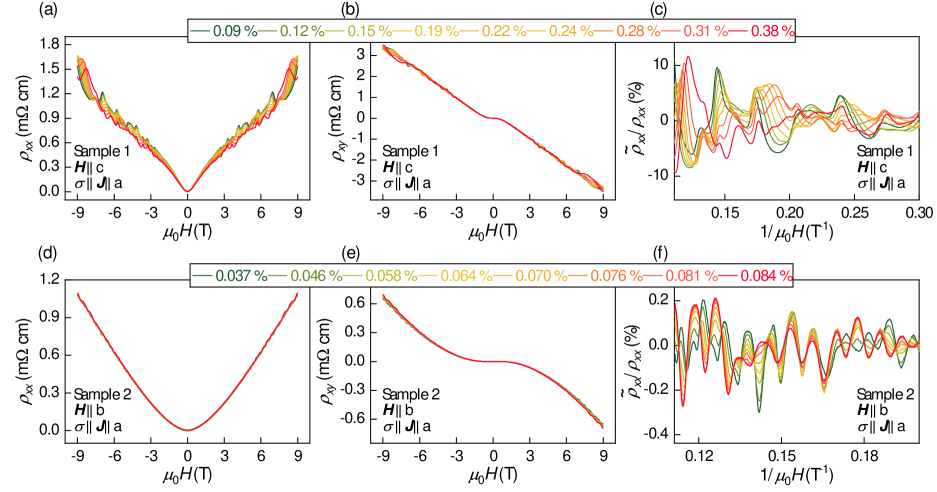
The MR and Hall resistivity of both samples are shown at different (tensile) strains in Fig. IV, whereby has been applied along for Sample 1 and along for Sample 2. Both samples exhibit a large MR characteristic for NbPShekhar2015 , superimposed by SdH oscillations. In agreement with previous reports, the amplitude of the SdH oscillations strongly varies depending on the direction and is most pronounced for along , which is also apparent comparing the MR in Sample 1 and Sample 2. Quantum oscillations are also superimposed on indicating an oscillating number of charge carriers and a somewhat fixed Fermi level. Likewise, the oscillations in are more pronounced for [Figs. IV(b) and IV(e)]. A continuous evolution of the quantum oscillations with increasing strain is observed, better visible in the oscillatory part versus [Figs. IV(c) and IV(f)], which has been extracted from the MR by subtracting a smooth polynomial of third order. The strain response of and was completely elastic, i.e., no hysteresis was observed upon increasing or decreasing the stress and all curves could be reproduced by applying the same stress again. This provides an ideal playground for in-situ manipulation of the band structure, without introducing additional disorder or facing the irreversibility of high-pressure experiments. Notably, both MR and Hall resistivity do not exhibit significant changes apart from the superimposed oscillations, which shows that the deformation of the Fermi surface does not have a strong effect on the general charge-carrier properties, e.g., density and mobility, but rather leads to a redistribution of the carriers in space. This is in contrast to the effect of hydrostatic pressure on NbPdosReis2016 , where both MR and Hall resistivity change considerably.
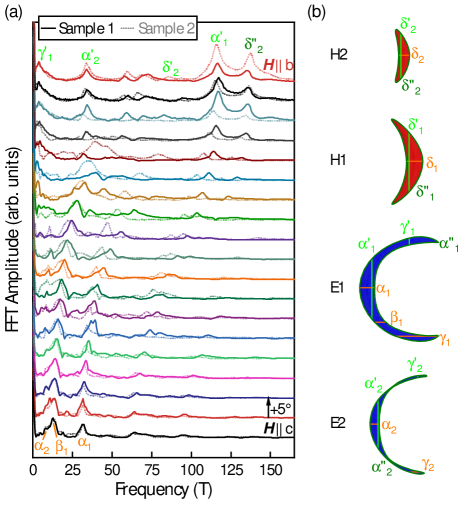
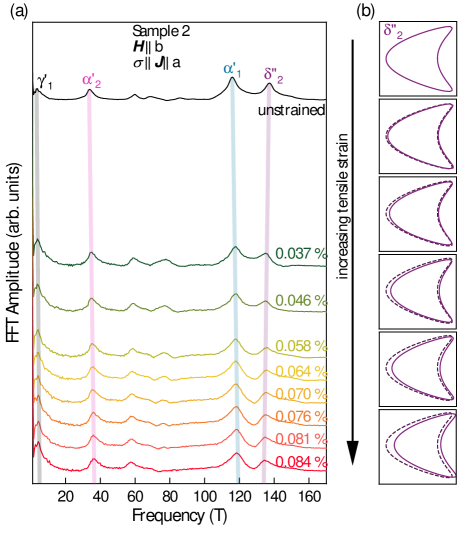
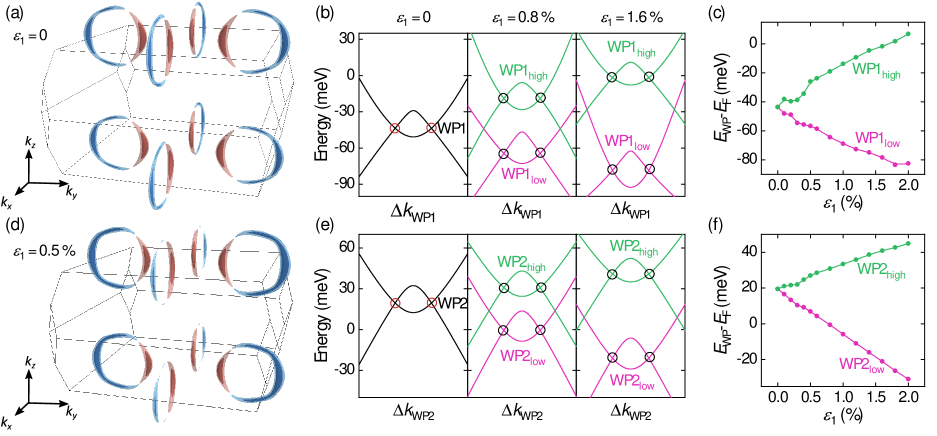
By Fourier transformation of , a characteristic spectrum is revealed. Via the Onsager relationShoenberg , each SdH frequency is related to an extremal orbit of the Fermi surface plane perpendicular to the applied , where is the area enclosed by this orbit and is the magnetic flux quantum. The SdH spectra of the two samples in the unstrained state are shown in Fig. 3(a), for rotated from the to the axis. Noticeable differences in the intermediate range between 20 and occur, presumably due to a bigger sensitivity to misalignments in that range. However, for along and the spectrum of the two samples is in good agreement and is roughly stable upon misalignments of . This is expected, as both samples are cut from the same piece and thus the Fermi level should be nearly identical. The direction in our strain setup is fixed, thus, the matching of the SdH spectra is a necessary check to justify the comparison of the two samples.
The Fermi surface of NbP is shown in Fig. 8(a). There are a number of extremal orbits [schematically shown in Fig. 3(b)], which we labeled as in Ref. Klotz2016, , resulting in a complex spectrum. The two hole pockets, H1 and H2, exhibit only maximum orbits. For along , the orbit is termed as (). For along or , the fourfold rotational symmetry yields two maximum orbits per hole pocket, termed as and ( and ). The two electron pockets, E1 and E2, exhibit a number of both maximum and minimum orbits. For along , E1 (E2) exhibits two maxima, () and (), and a minimum orbit [ yields a SdH frequency smaller than 1 T and is not shown in Fig. 3(b)]. For along or , there are three possible orbits for E1 (E2), termed (), (), and (). Variation of the Fermi level to 11 meV above the charge-neutral point resulted in the best matching between calculated and experimental SdH frequencies. However, we could not attribute each orbit to a peak in the experimental spectra. Also, we observe experimental peaks in a range where DFT yields no fundamental frequencies, some of which can be attributed to higher harmonics. Some orbits yield very similar SdH frequencies, as for example (32.8 T) and (31.1 T), which falls below our experimental resolution. In case of two calculated frequencies lying close to a peak in the experimental spectrum, we chose the orbit with the highest congruency of the calculated and experimental . This procedure led to the same assignments of experimental and calculated values as in Refs. Klotz2016, ; dosReis2016, . Further challenges of disentangling the rich spectrum of NbP are thoroughly covered in Ref. Klotz2016, . In the following, we focus on Fourier peaks which are distinct and could be attributed to a theoretical orbit with good agreement, marked in Fig. 3(a) and summarized in Table 2.
| Orbit | Theory | Experiment | ||
| (Sample 1) | ||||
| 7.92 | 13.81 | 8.5 | 14(2) | |
| -8.37 | -7(2) | |||
| 11.3 | 24.08 | 12.7 | 13(1) | |
| -22.1 | -15(2) | |||
| 32.8 | 25.12 | 31.3 | 7(1) | |
| -20.2 | -14(2) | |||
| (Sample 2) | ||||
| 5.6 | 11 | 3.2 | 18(4) | |
| 37.17 | 40.3 | 33.4 | 29(7) | |
| 124.56 | 77.6 | 116 | 29(4) | |
| 148.89 | -30.6 | 137 | -26(5) | |
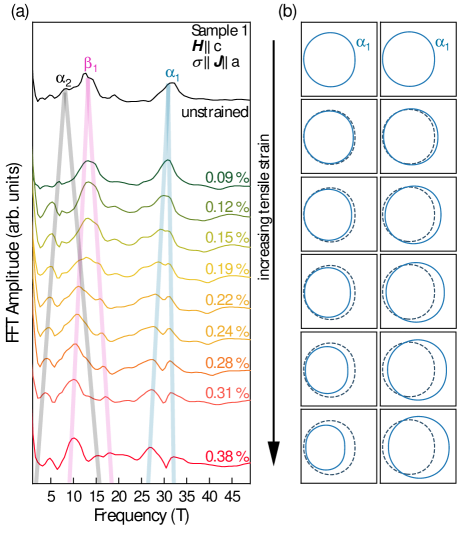
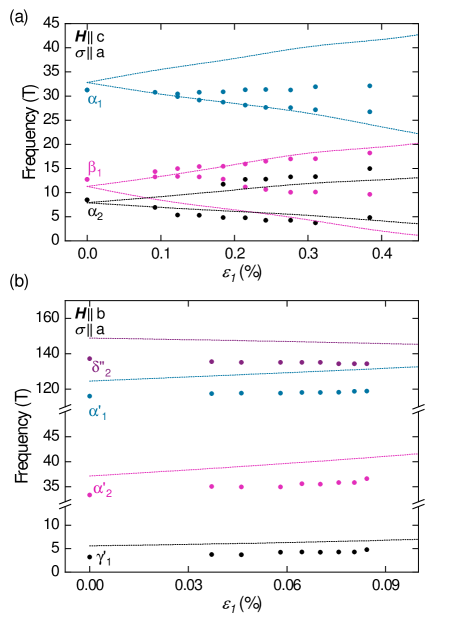
The Fourier spectra for (Sample 1) for different strains are shown in Fig. 4(a). A clear splitting of the and peaks into an increasing and a decreasing branch upon increasing is observed. The evolution of is less pronounced, however, signatures of the peak found for some of the strain values are indicative of a splitting as well. As the increasing branch of is crossing the decreasing branch of , and the amplitude of surpasses that of , the increasing branch of the peak cannot be fully traced. The splitting of the peaks is consistent with our DFT calculations and is a strong evidence for the lifting of the degeneracy of the Fermi pockets via breaking the fourfold rotational symmetry of the tetragonal crystal lattice. As illustrated in Figs. 4(b), each fourfold degenerate orbit splits into two shrinking and two expanding orbits, resulting in two branches of SdH frequencies [see also Fig. 8(d)].
In contrast, the Fourier peaks for (Sample 2) do not exhibit a splitting or broadening and just shift upon increasing strain [Fig. 5(a)]. This qualitative behavior is congruent with our DFT calculations and serves as a control experiment, confirming that the splitting of the SdH frequencies is tied to the orientation of along the screw axis of the crystal lattice.
The experimental and calculated SdH frequencies for the attributed orbits are plotted versus in Fig. 6. All calculated trends are qualitatively reproduced by the experimental values, demonstrating that the strain evolution of the Fermi surface of NbP is well described by DFT. We note, however, that the absolute values of the majority of experimentally determined frequencies differ from the calculated values by 10%. This deviation is of similar magnitude as in the previous reports comparing quantum oscillations and DFT results for NbPKlotz2016 ; dosReis2016 . The derivatives are extracted by linear fits of and are given next to the DFT results in Table 2. The sign and order of magnitude of the values are in good agreement between theory and experiment for most orbits, whereas matching in terms of absolute values for some orbits, e.g., and differs by more than 100%. Erroneous extraction of the experimental values might be caused by the smearing of the peaks due to the field-dependent damping of the SdH amplitude.
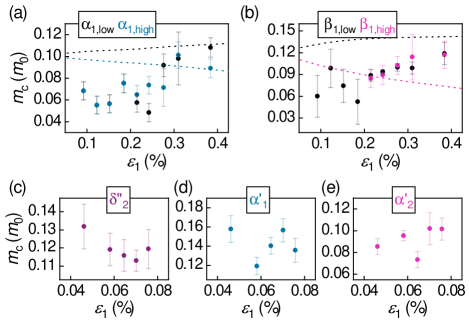
The cyclotron masses of the corresponding orbits of area at the Fermi energy are extracted from the -dependent damping of the Fourier peaks viaShoenberg
| (5) |
where is the amplitude factor, the reduced Planck constant, the electron charge, and the Boltzmann constant. is taken as the average of the Fourier window . We extracted for several orbits (Fig. 7) from the Fourier spectra at . Close to zero strain, the experimental values for and are in good agreement with those reported in Ref. Klotz2016, , and similarly deviate from the higher calculated values. Cyclotron masses extracted from Fourier spectra, especially with frequencies below , are usually underestimated by up to 50-60 %Audourd2018 ; Mercure2008 due to the strong field dependence of the SdH amplitude. The extracted mass heavily depends on and , whereas decreasing generally yields values closer to the real one. However, as the sampling interval of the discrete Fourier spectrum is , decreasing drastically reduces the resolution and makes identifying distinct peaks for (Sample 1) impossible. Additional complication arises from the overlapping of the Fourier peaks. Therefore, the large error bars in Fig. 7 are estimated by extracting for different and as well as fitting Eq. (5) to Fourier spectra of simulated data with similar frequencies and cyclotron masses. Notably, envelope extraction via inverse Fourier transformation of a frequency window (with rounded cornersMercure2008 ) enclosing a Fourier peak of the simulated data also did not result in reliable determination of . Due to the large uncertainty, we were not able to resolve the splitting of predicted by DFT; the extracted values can only be considered as a rough estimate. The cyclotron masses for (Sample 2) are presumably slightly more reliable, as the peaks are more distinguishable and a smaller window could be used.
The overall qualitative (and in some parts quantitative) agreement of the DFT calculations with the SdH data might as well allow us to draw conclusions about the Weyl points in NbP under uniaxial stress. The 12 pairs of Weyl points in NbP fall in two groups: four pairs in the plane (WP1) and eight pairs in the plane (WP2). Upon increasing , the four (eight) WP1 (WP2) pairs split into two types of two (four) pairs each, labelled “high” and “low” [see Figs. 8(b),(e)], shifting up and down in energy, respectively. Notably, the energy shift is quite significant, with tens of meV (or hundreds of K in terms of ) at a few percent of strain [Fig. 8(c),(f)]. Predicted by our calculations, the pairs should be situated at the Fermi level at , and pairs at , respectively. In contrast to the application of hydrostatic pressuredosReis2016 , where several GPa are required to tune WP2 a few meV closer to the Fermi level and WP1 does not exhibit any notable shift, uniaxial stress might allow for effective tuning of the Weyl points without having to deal with additional disorder as is the case with chemical doping. As epitaxial thin films of NbP have already been grownBedoya2020 , realization of strained thin films might render a promising opportunity towards “Weyl-tronic” devices.
V Summary
In summary, we studied the response of SdH oscillations in NbP to direct application of uniaxial stress and combined the experimental results with DFT calculations. By applying stress along one of the axes of the square plane of the tetragonal crystal lattice, the fourfold rotational symmetry is broken. This is reflected by a splitting of the peaks in the Fourier spectra of the SdH oscillations for along the axis. When is applied along one of the equal axes, the symmetry of the orbits on the Fermi surface remains unchanged, thus only shifting of the Fourier peaks is observed. Our observations are qualitatively congruent with the DFT calculations, demonstrating their robustness for NbP in the strained state. Furthermore, we predict a significant energy shifting of the Weyl points, whereas increasing tensile strain of one percent leads to a shift of tens of meV. This might be an effective way to tune the Weyl points to the Fermi level in order to realize Weyl-based devices.
Acknowledgements.
C. S. thanks R. Koban and H. Borrmann for providing technical support as well as D. Gorbunov and S. Zherlitsyn for assistance with the ultrasound pulse-echo measurements. C. S. acknowledges financial support by the International Max Planck Research School for Chemistry and Physics of Quantum Materials (IMPRS-CPQM). J. G. acknowledges support from the European Union’s Horizon 2020 research and innovation program under Grant Agreement ID 829044 “SCHINES”. The work was supported by the Deutsche Forschungsgemeinschaft (DFG) through SFB 1143 and the Würzburg-Dresden Cluster of Excellence on Complexity and Topology in Quantum Matter– (EXC 2147, Project No. 390858490), by Hochfeld-Magnetlabor Dresden (HLD) at HZDR, member of the European Magnetic Field Laboratory (EMFL), and by the ERC Advanced Grant No. 742068 “TOPMAT”.References
- (1) J. Liu, Y. Xu, J. Wu, B.-L. Gu, S. B. Zhang & W. Duan, Manipulating topological phase transition by strain, Acta Cryst. C 70, 118 (2014).
- (2) S. M. Young, S. Chowdhury, E. J. Walter, E. J. Mele, C. L. Kane & A. M. Rappe, Theoretical investigation of the evolution of the topological phase of under mechanical strain, Phys. Rev. B 84, 085106 (2011).
- (3) W. Liu, X. Peng, C. Tang, L. Sun, K. Zhang & J. Zhong, Anisotropic interactions and strain-induced topological phase transition in and , Phys. Rev. B 84, 245105 (2011).
- (4) R. Battilomo, N. Scopigno & C. Ortix, Tuning topology in thin films of topological insulators by strain gradients, Phys. Rev. B 100, 115131 (2019).
- (5) E. N. Lima, T. M. Schmidt & R. W. Nunes, Structural and topological phase transitions induced by strain in two-dimensional bismuth, J. Phys.: Condens. Matter 31, 475001 (2019).
- (6) M. Zhao, X. Zhang & L. Li, Strain-driven band inversion and topological aspects in Antimonene, Sci. Rep. 5, 16108 (2015).
- (7) S. Zhang, M. Xie, B. Cai, H. Zhang, Y. Ma, Z. Chen, Z. Zhu, Z. Hu & H. Zeng, Semiconductor-topological insulator transition of two-dimensional SbAs induced by biaxial tensile strain, Phys. Rev. B 93, 245303 (2016).
- (8) L. Winterfeld, L. A. Agapito, J. Li, N. Kioussis, P. Blaha & Y. P. Chen, Strain-induced topological insulator phase transition in HgSe, Phys. Rev. B 87, 075143 (2013).
- (9) X. M. Zhang, W. H. Wang, E. K. Liu, G. D. Liu, Z. Y. Liu & G. H. Wu, Influence of tetragonal distortion on the topological electronic structure of the half-Heusler compound LaPtBi from first principles, Appl. Phys. Lett. 99, 071901 (2011).
- (10) T. Teshome & A. Datta, Topological Phase Transition in Assisted by Strain, ACS Omega 4, 8701 (2019).
- (11) D. Shao, J. Ruan, J. Wu, T. Chen, Z. Guo, H. Zhang, J. Sun, L. Sheng & D. Xing, Strain-induced quantum topological phase transitions in , Phys. Rev. B 96, 075112 (2017).
- (12) Z. Tajkov, D. Visontai, L. Oroszlány & J. Koltai, Uniaxial strain induced topological phase transition in bismuth-–tellurohalide-–graphene heterostructures, Nanoscale 11, 12704 (2019).
- (13) J. Mutch, W.-C. Chen, P. Went, T. Qian, I. Z. Wilson, A. Adreev, C.-C. Chen & J.-H. Chu, Evidence for a strain-tuned topological phase transition in , Sci. Adv. 5, eaav9771 (2019).
- (14) D. Wang, L. Chen, H. Liu, C. Shi, X. Wang, G. Cui, P. Zhang & Y. Chen, Strain induced band inversion and topological phase transition in methyl-decorated stanene film, Sci. Rep. 7, 17089 (2017).
- (15) Y. Liu, Y. Y. Li, S. Rajput, D. Gilks, L. Lari, P. L. Gallindo, M. Weinert, V. K. Lazarov & L. Li, Tuning Dirac states by strain in the topological insulator , Nat. Phys. 10, 294 (2014).
- (16) C. Schindler, C. Wiegand, J. Sichau, L. Tiemann, K. Nielsch, R. Zierold & R. Blick, Strain-induced Dirac state shift in topological insulator nanowires, Appl. Phys. Lett. 111, 171601 (2017).
- (17) J. H. Hwang, S. Kwon, J. Park, J. H. Kim, J. Lee, J. S. Kim, H.-K. Lyeo & J. Y. Park, Strain effects on in-plane conductance of the topological insulator , Appl. Phys. Lett. 104, 161613 (2014).
- (18) J. Klotz, S.-C. Wu, C. Shekhar, Y. Sun, M. Schmidt, M. Nicklas, M. Baenitz, M. Uhlarz, J. Wosnitza, C. Felser & B. Yan, Quantum oscillations and the Fermi surface topology of the Weyl semimetal NbP, Phys. Rev. B 93, 121105(R) (2016).
- (19) C.-C. Lee, S.-Y. Xu, S.-M. Huang, D. S. Sanchez, I. Belopolski, G. Chang, G. Bian, N. Alidoust, H. Zheng, M. Neupane et al., Fermi surface interconnectivity and topology in Weyl fermion semimetals TaAs, TaP, NbAs, and NbP, Phys. Rev. B 92, 235104 (2015).
- (20) C. Shekhar, A. N. Nayak, Y. Sun, M. Schmidt, M. Nicklas, I. Leermakers, U. Zeitler, Y. Skourski, J. Wosnitza, Z. Liu et al., Extremely large magnetoresistance and ultrahigh mobility in the topological Weyl semimetal candidate NbP, Nat. Phys. 11, 645 (2015).
- (21) Z. Wang, Y. Zheng, Z. Shen, Y. Lu, H. Fang, F. Sheng, Y. Zhou, X. Yang, Y. Li, C. Feng & Z.-A. Xu, Helicity-protected ultrahigh mobility Weyl fermions in NbP, Phys. Rev. B 93, 121112(R) (2016).
- (22) R. D. dos Reis, S.-C. Wu, Y. Sun, M. O. Ajeesh, C. Shekhar, M. Schmidt, C. Felser, B. Yan & M. Nicklas, Pressure tuning the Fermi surface topology of the Weyl semimetal NbP, Phys. Rev. B 93, 205102 (2016).
- (23) S.-C. Wu, Y. Sun, C. Felser & B. Yan, Hidden type-II Weyl points in the Weyl semimetal NbP, Phys. Rev. B 96, 165113 (2017).
- (24) Z. K. Liu, L. X. Yang, T. Zhang, H. Peng, H. F. Yang, C. Chen, Y. Zhang, Y. F. Guo, D. Prabhakaran, M. Schmidt et al., Evolution of the Fermi surface of Weyl semimetals in the transition metal pnictide family, Nat. Mat. 15, 27 (2015).
- (25) I. Belopolski, S.-Y. Xu, D. S. Sanchez, G. Chang, C. Guo, M. Neupane, H. Zheng, C.-C. Lee, S.-M. Huang, G. Bian et al., Criteria for Directly Detecting Topological Fermi Arcs in Weyl Semimetals, Phys. Rev. Lett. 116, 066802 (2016).
- (26) S. Souma, Z. Wang, H. Kotaka, T. Sato, K. Nakayama, Y. Tanaka, H. Kimizuka, T. Takahashi, K. Yamauchi, T. Oguchi et al., Direct observation of nonequivalent Fermi-arc states of opposite surfaces in the noncentrosymmetric Weyl semimetal NbP, Phys. Rev. B 93, 161112(R) (2016).
- (27) H. Zheng, S.-Y. Xu, G. Bian, C. Guo, G. Chang, D. S. Sanchez, I. Belopolski, C.-C. Lee, S.-M. Huang, X. Zhang et al., Atomic-Scale Visualization of Quantum Interference on a Weyl Semimetal Surface by Scanning Tunneling Microscopy, ACS Nano 10, 1378 (2016).
- (28) A. C. Niemann, J. Gooth, S.-C. Wu, S. Bäßler, P. Sergelius, R. Hühne, B. Rellinghaus, C. Shekhar, V. Süß, M. Schmidt et al., Chiral magnetoresistance in the Weyl semimetal NbP, Sci. Rep. 7, 43394 (2017).
- (29) P. Sergelius, J. Gooth, S. Bäßler, R. Zierold, C. Wiegand, A. C. Niemann, H. Reith, C. Shekhar, C. Felser, B. Yan & K. Nielsch, Berry phase and band structure analysis of the Weyl semimetal NbP, Sci. Rep. 6, 33859 (2016).
- (30) J. Gooth, A. C. Niemann, T. Meng, A. G. Grushin, K. Landsteiner, B. Gotsmann, F. Menges, M. Schmidt, C. Shekhar, V. Süß et al., Experimental signatures of the mixed axial–gravitational anomaly in the Weyl semimetal NbP, Nature 547, 324 (2017).
- (31) K. A. Modic, T. Meng, F. Ronning, E. D. Bauer, P. J. W. Moll & B. J. Ramshaw, Thermodynamic Signatures of Weyl Fermions in NbP, Sci. Rep. 9, 2095 (2019).
- (32) D. Neubauer, A. Yaresko, W. Li, A. Löhle, R. Hübner, M. B. Schilling, C. Shekhar, C. Felser, M. Dressel & A. V. Pronin, Optical conductivity of the Weyl semimetal NbP, Phys. Rev. B 98, 195203 (2018).
- (33) J. Xu, D. E. Bugaris, Z. L. Xiao, Y. L. Wang, D. Y. Chung, M. G. Kanatzidis & W. K. Kwok, Reentrant metallic behavior in the Weyl semimetal NbP, Phys. Rev. B 96, 115152 (2017).
- (34) H. Zheng, G. Chang, S.-M. Huang, C. Guo, X. Zhang, S. Zhang, J. Yin, S.-Y. Xu, I. Belopolski, N. Alidoust et al., Mirror Protected Dirac Fermions on a Weyl Semimetal NbP Surface, Phys. Rev. Lett. 119, 196403 (2017).
- (35) G. Chang, S.-Y. Xu, H. Zheng, C.-C. Lee, S.-M. Huang, I. Belopolski, D. S. Sanchez, G. Bian, N. Alidoust, T.-R. Chang et al., Signatures of Fermi Arcs in the Quasiparticle Interferences of the Weyl Semimetals TaAs and NbP, Phys. Rev. Lett. 116, 066601 (2016).
- (36) Y. Sun, S.-C. Wu & B. Yan Topological surface states and Fermi arcs of the noncentrosymmetric Weyl semimetals TaAs, TaP, NbAs, and NbP. Phys. Rev. B 92, 115428 (2015).
- (37) H. Weng, C. Fang, Z. Fang, B. A. Bernevig & X. Dai, Weyl Semimetal Phase in Noncentrosymmetric Transition-Metal Monophosphides, Phys. Rev. X 5, 011029 (2015).
- (38) S.-M. Huang, S.-Y. Xu, I. Belopolski, C.-C. Lee, G. Chang, B. Wang, N. Alidoust, G. Bian, M. Neupane, C. Zhang et al., A Weyl Fermion semimetal with surface Fermi arcs in the transition metal monopnictide TaAs class, Nat. Comm. 6, 7373 (2015).
- (39) J. Xu, J. M. Greenblatt, T. Emge & P. Höhn, Crystal Structure, Electrical Transport, and Magnetic Properties of Niobium Monophosphide, Inorg. Chem. 35, 845 (1996).
- (40) C. W. Hicks, M. E. Barber, S. D. Edkins, D. O. Brodsky & A. P. Mackenzie, Piezoelectric-based apparatus for strain tuning, Rev. Sci. Instrum. 85, 065003 (2014).
- (41) A. Steppke, L. Zhao, M. E. Barber, T. Scaffidi, F. Jerzembeck, H. Rosner, A. S. Gibbs, Y. Maeno, S. H. Simon, A. P. Mackenzie & C. W. Hicks, Strong peak in of under uniaxial pressure, Science 13, eaaf9398 (2017).
- (42) N. H. Jo, L.-L. Wang, P. P. Orth, S. Bud’ko & P. C. Canfield, Magnetoelastoresistance in : Exploring electronic structure and extremely large magnetoresistance under strain, Proc. Natl. Acad. Sci. USA 116, 25524 (2019).
- (43) G. Kresse & J. Furthmüller, Efficiency of ab-initio total energy calculations for metals and semiconductors using a plane-wave basis set, Computational Materials Science 6, 15 (1996).
- (44) J. P. Perdew, K. Burke & M. Ernzerhof, Generalized Gradient Approximation Made Simple, Phys. Rev. Lett. 77, 3865 (1996).
- (45) A. A. Mostofi, J. R. Yates, Y.-S. Lee, I. Souza, D. Vanderbilt & N. Marzari, wannier90: A tool for obtaining maximally-localised Wannier functions, Comp. Phys. Comm. 178, 685 (2008).
- (46) L. Liu, Z.-Q. Wang, C.-E. Hu, Y. Cheng & G.-F. Ji, Comparative study on structural, elastic, dynamical, and thermodynamic properties of Weyl semimetals MX (M = Ta or Nb; X = As or P), Solid State Commun. 263, 10 (2017).
- (47) D. Shoenberg, Magnetic Oscillations in Metals (Cambridge Univ. Press, 1984).
- (48) A. Audouard & J. Fortin, Does Fourier analysis yield reliable amplitudes of quantum oscillations?, EPJ Appl. Phys. 83, 30201 (2018).
- (49) J.-F. Mercure, The de Haas van Alphen effect near a quantum critical end point in (Univ. of St. Andrews, 2008), https://arxiv.org/abs/1001.3980.
- (50) A. Bedoya-Pinto, A. K. Pandeya, D. Liu, H. Deniz, K. Chang, H. Tan, H. Han, J. Jena, I. Kostanovskiy & S. P. Parkin, Realization of Epitaxial NbP and TaP Weyl Semimetal Thin Films, ACS Nano 14, 4405 (2020).