Investigating the influence of relativistic effects on absorption spectra for platinum complexes with light-activated activity against cancer cells.
Abstract
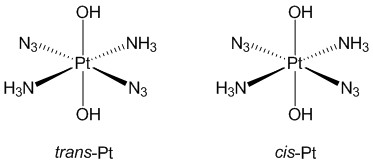
Abstract: We report the first investigation of relativistic effects on the UV-vis spectra of two prototype complexes for so-called photo-activated chemotherapy (PACT), trans-trans-trans-\ce[Pt(N3)2(OH)2(NH3)2] and cis-trans-cis-\ce[Pt(N3)2(OH)2(NH3)2]. In PACT, design of new drugs requires in-depth understanding of the photo-activation mechanisms. A first step is usually to rationalize their UV-vis spectra for which time-dependent density functional theory (TD-DFT) is an indispensable tool.
We carried out TD-DFT calculations with a systematic series of non-relativistic (NR), scalar-relativistic (SR), and four-component (4c) Hamiltonians. Large differences are found between spectra calculated within 4c and NR frameworks, while the most intense features (found at higher energies below 300 nm) can be reasonably well reproduced within a SR framework. Yet the underlying transitions can be strongly influenced by spin-orbit coupling introduced in the 4c framework: while this can affect both intense and less intense transitions in the spectra, the effect is most pronounced for weaker transitions at lower energies, above 300 nm. Since the investigated complexes are activated with light of wavelengths above 300 nm, employing a method with explicit inclusion of spin-orbit coupling may be crucial to rationalize the activation mechanism.
All calculations were carried out with both the CAM-B3LYP and B3LYP functionals; we generally find the former to perform best in comparison with experimental spectra.
pacs:
Valid PACS appear hereI Introduction
The use of platinum complexes in cancer therapy is among the most influential results of medicinal inorganic chemistry. Three simple platinum complexes are today approved worldwide for chemotherapy (cisplatin, carboplatin, and oxaliplatin), while three additional complexes (nedaplatin, lobaplatin, and heptaplatin) are approved in a few countries.Johnstone, Suntharalingam, and Lippard (2016) All these complexes contain Pt(II) centers and the activity against cancer cells is caused by the labile nature of Pt(II). Yet, this labile nature also causes severe side-effects (e.g., nausea and chronic kidney disease), limiting the use of Pt(II)-based medicine. Another limitation is due to cancer cells with intrinsic or developed resistance. Complexes with fewer side-effects and different mechanisms to harm cancer cells are therefore sought for.
Recent investigations have a focus on pro-drugs, i.e., biologically inactive complexes that can be activated at the site of the tumor. For platinum, good candidates for pro-drugs are octahedral, low-spin Pt(IV) complexes, which are kinetically stable (non-labile), compared to the square planar Pt(II) counterparts. Different activation mechanisms have been used: one strategy has been to rely on bio-reducing reagents, such as ascorbic acid or glutathione, reducing Pt(IV) to Pt(II).Hall and Hambley (2002); Graf and Lippard (2012) An alternative is to use light-activation in what have become known as photo-activated chemotherapy (PACT) or photodynamic therapy (PDT).Butler and Sadler (2013); Farrer, Salassa, and Sadler (2009); Bonnet (2018) The PACT process involves an initial electronic excitation of the pro-drug, followed by a chemical transformation (e.g. a reduction) into an active form. In this way, PACT differs from PDT, which employs a chemical substance (denoted photo-sensitizer) to form an electronically excited state, which in turn induces generation of reactive oxygen species (ROS), harmful to cancer cells. The PACT process is not as far in development as PDT for clinical useBrown, Brown, and Walker (2004), but PACT offers advantages for cells with low oxygen levelsChen et al. (2015), which are among the most resistant to therapy.Brown, Brown, and Walker (2004); Wilson and Hay (2011)
For complexes involved in PACT (and similar for PDT), theoretical methods are often required to understand the (usually complex) activation mechanisms. Time-dependent density functional theory (TD-DFT) is a powerful tool to investigate the initial process of excitation and to analyze the character of the excited states generated upon radiation. In several studies, TD-DFT has been used with great insight to explain the experimentally observed photochemistry of platinum complexes used in PACT.Salassa, Phillips, and Sadler (2009); Mackay et al. (2009); Farrer et al. (2010); Westendorf et al. (2011, 2012); Zhao et al. (2013a, b); Shaili et al. (2019) In one case, several DFT functionals were also benchmarked against complete active space second-order perturbation theory (CASPT2) and it was concluded that range-separated functionals reproduce both experiment and CASPT2 results best.Sokolov and Schaefer III (2011) Despite this result, only a few investigations have employed range-separated functionals. Perhaps even more surprising is that none of the investigations have focused on the importance of relativistic effects, in particular concerning explicit inclusion of spin-orbit coupling. Instead, relativistic effects have usually been included indirectly through effective core potentials (ECPs) combined with a non-relativistic Hamiltonian. In one instance, relativistic effects have also been included through Douglass-Kroll-Hess to second order (DKH2), focusing on scalar-relativistic (SR) parts.Sokolov and Schaefer III (2011)
The lack of systematic studies of relativistic effects can perhaps be attributed to that TD-DFT implementations first relatively recently were developed for a large arsenal of relativistic Hamiltonians. Yet, several formulations of relativistic TD-DFTLiu and Xiao (2018); Saue et al. (2020); Repiský et al. (2020) ranging from four-component (4c) Dirac-Kohn-ShamGao et al. (2004, 2005); Bast, Jensen, and Saue (2009) to various two-component frameworksWang et al. (2005); Peng, Zou, and Liu (2005); Bast, Jensen, and Saue (2009); Kühn and Weigend (2013); Egidi et al. (2016) exist today.
In this paper, we study the effect of employing TD-DFT based on relativistic Hamiltonians for complexes involved in PACT. We systematically investigate both non-relativistic (NR), scalar relativistic (SR) and four-component (4c) frameworks. In addition, we employ both the B3LYP functional and a range-separated variant (CAM-B3LYP). As targets, we employ two prototypical complexes (here denoted trans-Pt and cis-Pt), shown in Figure 1. These two complexes are both active against tumors upon radiation with lightMüller et al. (2003); Mackay et al. (2006); Bednarski et al. (2006); Imran et al. (2018) and are among the first reported platinum complexes for use in PACT. They are further the simplest among a number of related complexes which subsequently have shown similar photo-activity.Kašpárková et al. (2003); Mackay et al. (2007, 2009); Farrer et al. (2010); Pracharova et al. (2012); Westendorf et al. (2011, 2012); Min et al. (2014); Zhao et al. (2013a, b); Gandioso et al. (2015); Shaili et al. (2019); Imberti et al. (2020) The exact mechanism of photo-activation is not known in detail. However, the UV-vis spectra in combination with TD-DFT calculationsMackay et al. (2006); Salassa, Phillips, and Sadler (2009) have shown that both trans- and cis-Pt complexes display ligand-to-metal charge-transfer (LMCT) excitations. The population of the resulting states leads to decomposition, likely through multiple pathwaysImberti et al. (2020); Ronconi and Sadler (2008, 2011) , including dissociation of \ceN3- and/or \ceNH3 ligands, generation of \ceO2, and reduction to Pt(II). Possibly the photoreactions also involve triplet states which have been shown to be dissociative.Salassa, Phillips, and Sadler (2009); Westendorf et al. (2011)
Intriguingly, the complexes in Figure 1 only have intense transitions in high-energy part of the spectrum (285 and 256 nm for trans- and cis-Pt, respectively)Müller et al. (2003); Mackay et al. (2006); Bednarski et al. (2006); Salassa, Phillips, and Sadler (2009). Yet, the light-induced reactivity has been achieved in regions without strong absorption. For instance trans-Pt react with DNA or DNA models (guanosine 5’monophosphate) upon exposure of light at 365–366 nm and 647 nmMackay et al. (2006) (although the latter only slugishly), while cis-Pt reacts after exposure to light at both 365–366 nm, 458 nm, and 647 nm.Kašpárková et al. (2003); Müller et al. (2003); Bednarski et al. (2006) Our study therefore focuses on both high-energy parts of the spectra (approximately 250–300 nm) where the complexes absorb strongly, as well as lower-energy parts (above 300 nm) where the transitions are weaker, yet potentially important for anti-cancer activity.
II Computational details
The structures of trans-trans-trans-[Pt(N3)2(OH)2(NH3)2] (denoted trans-Pt) and cis-trans-cis-[Pt(N3)2(OH)2(NH3)2] (denoted cis-Pt) were optimized with Turbomole 7.1Ahlrichs et al. (1989), employing the TPSSTao et al. (2003) functional and a def2-SV(P) basis setSchäfer, Horn, and Ahlrichs (1992). Calculations in Turbomole were sped up by expanding the Coulomb interactions in an auxiliary basis set (the resolution-of-identity approximation)Eichkorn et al. (1995, 1997), employing standard def2-SV(P) auxiliary basis sets.
All subsequent calculations of UV-vis spectra were performed with the DIRAC programDIR ; Saue et al. (2020), employing these optimized structures. The calculations were carried out with the def2-SV(P)Andrae et al. (1990); Schäfer, Horn, and Ahlrichs (1992); Weigend and Ahlrichs (2005) basis set for the ligands, and the dyall.v2z Dyall and Gomes (2009) basis set for the platinum atom. The basis set for Pt was employed uncontracted. We initially tested the effect of employing a completely uncontracted basis set, but since the obtained spectra were close to identical to calculations with contracted basis sets, all calculations reported here employed contracted basis sets for the ligands.
The calculated spectra were obtained with TD-DFT within a four component (4c) Dirac-Kohn-Sham framework, using a Dirac–Coulomb Hamiltonian with (SSSS) integrals replaced by interatomic SS energy corrections.Visscher (1997) For the exchange-correlation functional, we employed the range-separated CAM-B3LYPYanai, Tew, and Handy (2004) functional as well as the B3LYPBecke (1988); Lee, Yang, and Parr (1988); Becke (1993) functional. The NR and SR calculations employed the same basis set and functional but invoked the Lévy-Leblond,Lévy-Leblond (1967) and Dyall’s spin-freeDyall (1994); Visscher and Saue (2000) Hamiltonians, respectively. All TD-DFT calculations (relativistic and non-relativistic) were performed with 80 roots. The spectra obtained were then broadened using a gaussian convolution with a broadening factor of 0.3 eV. Assignments of transitions were based on analyses of the response vectors for each transition, in combination with visual inspection. Even if not all 80 transitions are relevant, the density of states with non-zero intensities is still too high to warrant discussion of each transition (particular for the 4c calculations). Therefore, we have divided the spectra into regions (1–6 for trans-Pt and 1–9 for cis-Pt) from which we discuss the most intense transitions. We have as far as possible attempted to group the transitions in the regions according to their character so that the regions are comparable across different Hamiltonians and functionals. However, one-to-one correspondence could not always be achieved (especially when comparing functionals). Selected transition energies, oscillator strengths, and assignments are given (in terms of contributing orbitals) for each region in the supporting information (SI), Tables S1–S12. Many of the discussed transitions are of similar character and to avoid tedious repetition, we will use to short-hand notation for the ligand-to-metal charge transfer (LMCT) transitions between -orbitals on \ceN3- to orbitals of platinum d-character. Transitions between orbitals of d-character are denoted , while transitions from orbitals with p-character (lone pairs) on the \ceOH- oxygen are denoted . This nomenclature has also been employed in the Tables in the SI. In addition to Tables S1–S12, selected orbital densities are displayed in the SI, Figures S1–S12. The orbitals in the 4c calculations differ from orbitals in SR and NR calculations by (due to spin-orbit coupling) having both - or -spin parts. Yet, most orbitals (the orbital densities are shown in Figures S1–S12) have a Mulliken population over 0.9 of either the - or the -part. We denote orbitals with a mixing degree lower than this as ”spin-mixed” ( and populations of the orbitals are also reported in the Figures in the SI).
III Results
III.1 Optimized structures
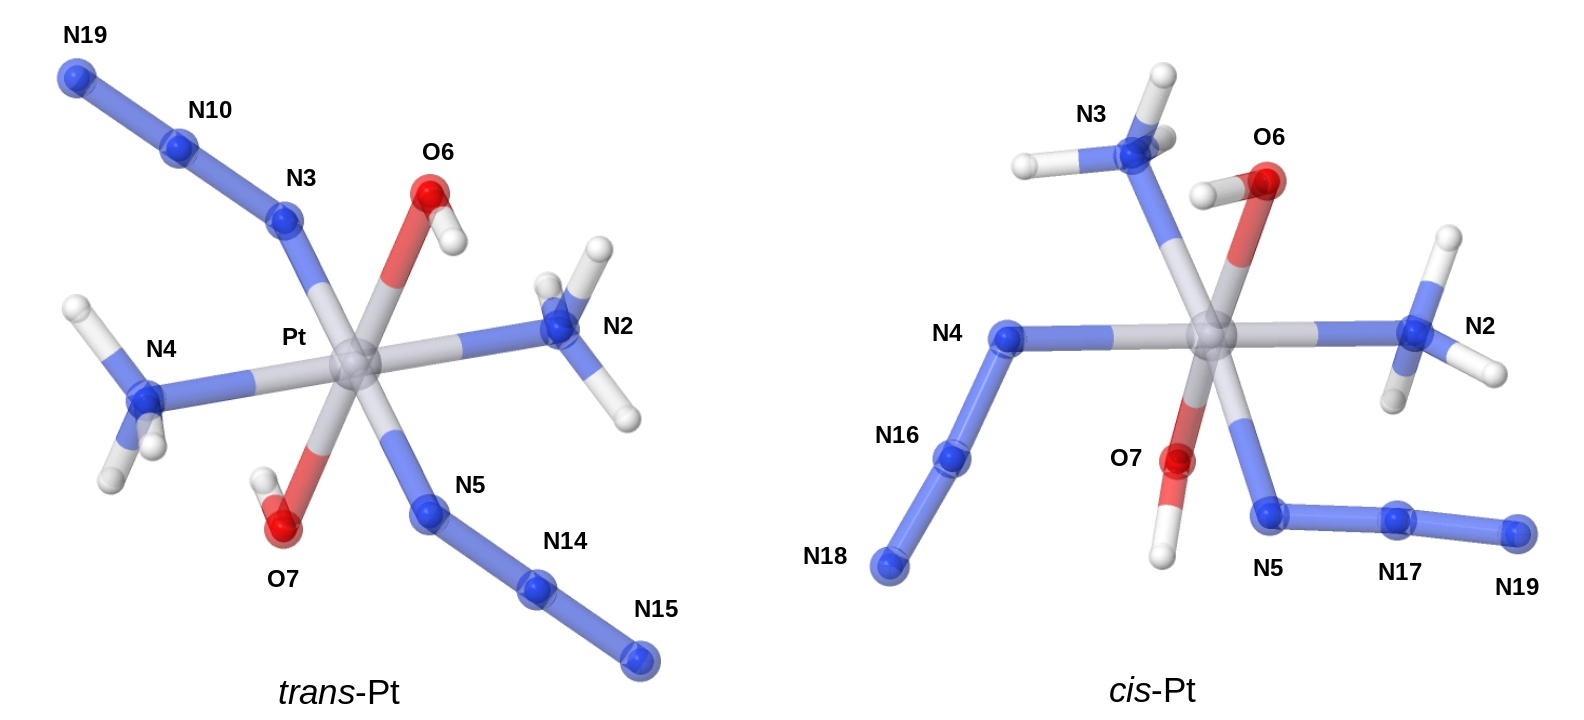
The optimized structures of trans-Pt and cis-Pt complexes are shown in Figure 2 and selected structural parameters are reported together with experimental valuesMüller et al. (2003); Mackay et al. (2006) in Table 1. The results are overall in good agreement with both experimental and earlier computational studies Sokolov and Schaefer III (2011) (where several other functionals were employed). This good correspondence is illustrated by the fact that the main difference is the \cePt-N-N and \ceN-N-N angles for trans-Pt only deviate from the experimental results (previous DFT results have deviations around ). The differences for cis-Pt complex are even smaller.
| trans-Pt | ||||||
| \cePt-N2 | \cePt-N3 | \cePt-O6 | \cePt-N3-N10 | \ceN3-N10-N19 | ||
| Calc. | 2.072 | 2.101 | 2.053 | 114.0 | 177.05 | |
| Exp. | 2.036 | 2.046 | 2.006 | 117.2 | 174.5 | |
| cis-Pt | ||||||
| \cePt-N2 | \cePt-N4 | \cePt-O6 | \cePt-N4-N16 | \ceN4-N16-N18 | ||
| Calc. | 2.136 | 2.057 | 2.047 | 116.4 | 174.5 | |
| Exp. | 2.022 | 2.036 | 2.005 | 117.3 | 172.9 | |
| 2.043 | 2.038 | 2.007 | 115.2 | |||
Further, the bonds from the platinum center to \ceNH3 ligands are also slightly elongated, compared to previous resultsSokolov and Schaefer III (2011). This elongation is seen for both isomers; for instance the B3LYP result from Ref. 18 for the trans-Pt complex is 2.087 Å versus 2.101 Å for TPSS (the corresponding numbers for cis-Pt are 2.046 Å versus 2.057/2.063 Å). Yet, these elongations can still be considered minor.
III.2 UV-vis spectra of the trans-Pt complex
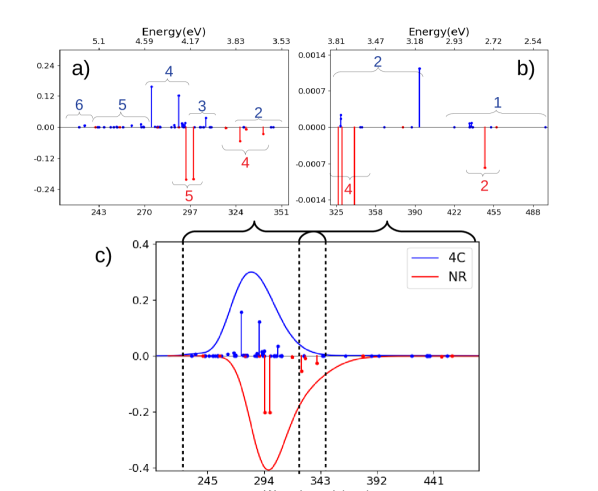
CAM-B3LYP results: The spectra calculated in 4c and NR frameworks are compared in Figure 3. Note that transitions of higher energy are significantly more intense than transitions of lower energy and accordingly, Figures 3(a) and 3(b) display high- and low-energy parts of the spectrum separately (with regions 1–6 marked), while the full spectrum is shown in Figure 3(c). From the latter figure, we immediately see that spectra from NR and 4c frameworks are rather different.
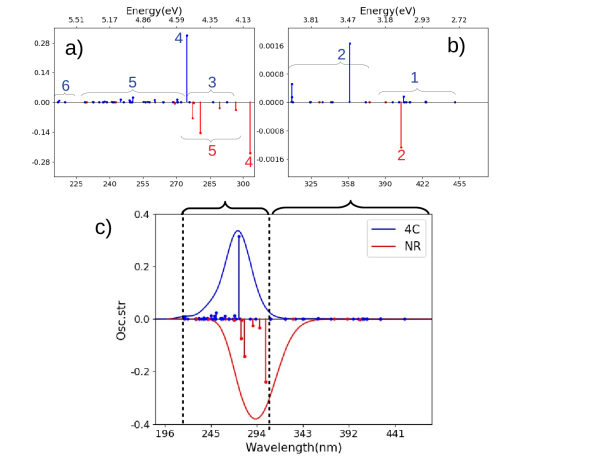
At high energies (5.71–4.59 eV or 217–270 nm) a number of transitions of low intensity are found for the 4c calculation, labeled 6 and 5 in Figure 3(a). These transitions are mainly of LMCT character and contain a mixture of transitions from - and -orbitals (on \ceOH- and \ceN3-, respectively) to a -orbital on platinum. The most intense transition (found in region 5 at 4.95 eV or 250 nm) is mainly of character (cf. Table S1). We note that all transitions in region 5 also involve (to varying degree) transitions from the oxygen lone-pairs to the metal center (). Due to the neglect of all excitations to triplet states, the density of states is generally lower in the NR calculation and few transitions occur between 5.7–4.6 eV (i.e. in what corresponds to regions 6 and 5 in the 4c calculation). Rather, the transitions labeled 5 for the NR calculation appear somewhat red-shifted at 4.47–4.18 eV (277–297 nm) and with much higher intensity. In the NR calculation, the transition with highest intensity in region 5 (4.42 eV or 281 nm) primarily involves orbitals on oxygen and the metal center (), but otherwise the transitions in 5 have compositions similar to those in the 4c calculation (i.e. mixture of and , cf. Table S2).
The transitions labeled 4 are intense in both 4c and NR frameworks and corresponds in both cases to a transition of character (cf. Tables S1 and S2). As seen from Figure 3(a) the NR calculation is again red-shifted (4.09 eV or 303 nm, compared to 4.51 eV or 275 nm in the 4c case). No intense transitions are found immediately after region 4 in the 4c-CAM-B3LYP calculation, although a few transitions with intensities close to zero can be seen in this region (denoted 3 in Figure 3a).
Moving to the lower-energy transitions in Figure 3(b), no transitions in the NR calculation match the (mainly ) transitions in region 1 around 3.08–2.75 eV (402–451 nm) in the 4c calculation. Region 2 is also quite different in 4c and NR frameworks: in the former, the region is a mixture of and transitions of which the most intense (at 3.46 eV or 358 nm) is of character. Only one transition is seen in the NR framework (also of character), but is considerable red shifted compared to the 4c counterpart (3.07 eV or 404 nm, compared to 4.03–3.46 eV or 308–359 nm).
While the NR and 4c calculations are both qualitatively and quantitatively different, we also investigated whether including only SR effects lead to improvement. A comparison of spectra obtained with 4c and SR Hamiltonians are given in Figure 4, employing the same regions 1–6 as above (Figure 4a and 4b). From Figures 4(a) and 4(c) we see that the SR calculation qualitatively reproduce the most intense features of the high-energy region, although the density of states (as expected) is higher in the 4c calculation. The characters of the transitions labeled 6–3 are to large degree similar in 4c and SR calculations, respectively (cf. Tables S1 and S3). For instance, the most intense transition (region 4) is in both cases of LMCT character.
Reproducing the most intense feature in the spectrum is sufficient to provide a seemingly correct description of the full spectrum in Figure 4(c). However, important differences occurs for the lower-energy part in Figure 4(b): while the most intense transitions in region 2 occur at similar energies in 4c and SR calculations (3.46 and 3.43 eV or 358 and 361 nm) – and both have LMCT character – a closer investigation shows that the involved transitions are different: in the 4c calculation: they either involve spin-mixed orbitals (cf. Table S1 and Figure S1) or have dominantly triplet character, none of which can be reproduced by the SR calculation due to lack of spin-orbit coupling. The same is also true for the transitions labeled 1, which do not even occur in the SR calculation. This illustrates that many transitions (due to spin-orbit coupling) have low, but non-zero intensity in the 4c calculation as opposed to the SR (and NR) calculation(s). These differences will be more pronounced in the cis-Pt complex discussed below.
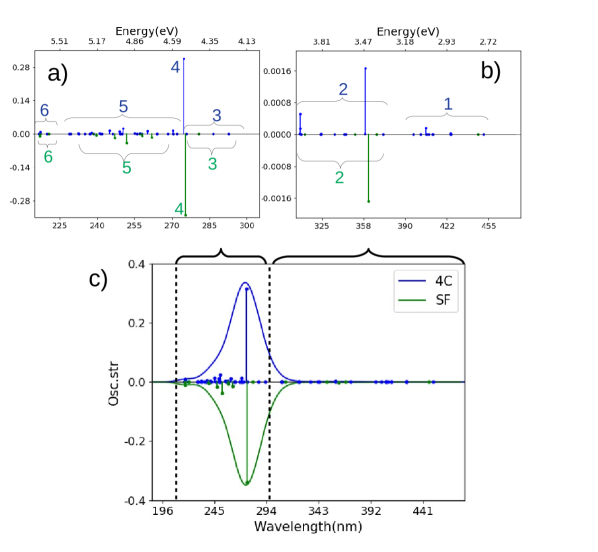
B3LYP results: Since B3LYP has been employed extensively for complexes involved in PACTSalassa, Phillips, and Sadler (2009); Farrer, Salassa, and Sadler (2009); Mackay et al. (2009); Garino and Salassa (2013), we repeated the above calculations with the B3LYP functional. The resulting spectra are shown in Figures 5 and 6. We start by comparing 4c-B3LYP and 4c-CAM-B3LYP calculations (see e.g. Figures 3 and 5): from this comparison, we see that B3LYP generally predicts a larger number of intense transitions, particular in the high-energy region (this is most evident in regions 4 and 3). A similar observation was made by Solokov and SchaeferSokolov and Schaefer III (2011), comparing the range-separated B97 and B97X functionals with a number of hybrid and pure GGA functionals (with ECPs accounting for relativistic effects). As far as it is possible to compare the regions between the two functionals, B3LYP generally red-shifts the most intense transitions about 0.2–0.4 eV in the 4c calculations and 0.3–0.4 eV in the NR calculations.
Despite the differences between the B3LYP and the range-separated variant, the changes between 4c-B3LYP and NR-B3LYP calculations are qualitatively the same as seen for CAM-B3LYP. Thus, the density of states is (as expected) much lower for the spectra calculated in the NR and SR frameworks. Further, for region 5 the transitions in NR-B3LYP are much more intense than predicted by the corresponding 4c calculation and also considerably red-shifted (4.21–4.14 vs. 4.60–4.89 eV). Yet, the character of the transitions in region 5 (a mix of and ) is the same in both 4c and NR frameworks. Meanwhile, in region 4 the intense transitions are red-shifted (as for CAM-B3LYP); they appear at 4.52–4.21 eV (274–294 nm) and 3.90–3.65 eV (318–340 nm) in 4c- and NR-B3LYP calculations, respectively. Also here, the character of the transition is the same, i.e. comprised mostly of transitions and to less degree of transitions (cf. Table S4). The region immediately after 4 contains (contrary to 4c- and SR-CAM-B3LYP), transitions with significant intensity: the region is denoted 3 in Figures 5(a) and 6(a) and has for 4c- and SR-B3LYP transitions (at 4.05 and 4.02 eV or 306 and 308 nm) with character.
Overall, the changes introduced when employing SR-B3LYP are the same as for CAM-B3LYP, i.e., most of the intense transitions in the high-energy parts are predicted in quite reasonable correspondence to the 4c-B3LYP calculations. However, the low-energy parts differ as the transitions in regions 2 and 1 (of character) also for 4c-B3LYP are considerably spin mixed. Thus, several transitions in region 2 do not occur in the SR-calculation and region 1 is entirely missing (as seem for CAM-B3LYP).
Comparison with experiment: The experimental spectrum has one strong absorption (without structure) at 285 nm (4.35 eV) assigned as a LMCT transition.Mackay et al. (2006) The charge-transfer character of this excitation would suggest that employing a range-separated functional is most appropriate.Dreuw and Head-Gordon (2004) Yet, judging only from most intense transitions at 4.51 eV (275 nm) with 4c-CAM-B3LYP and at 274 nm (4.52 eV) with 4c-B3LYP, little differences is seen for the two functionals, although 4c- and SR-B3LYP calculations obtain a range of transitions with high intensities around the experimental peak at 285 nm (regions 4 and 3 from 4.05–4.52 eV or 274–306 nm, cf. Figures 4 and 6). Meanwhile, the range-separated functional only obtain one intense transition (cf. Figures 3 and 4). We therefore tentatively suggests that CAM-B3LYP best reproduces the experimental excitation profile, but the experimental resolution does not allow us to unequivocally conclude that CAM-B3LYP performs best for the trans-Pt complex. Notably, the results for the cis-Pt complex leads to the same conclusion, but are more clear (see below).
Direct comparison with experiment is not possible in the lower energy parts of the spectrum where the transitions have significantly lower intensity. We will in the following only consider the relativistic calculations (4c and SR) with CAM-B3LYP. As found in previous studies (see e.g. Ref. 18), the LMCT ( and ) transitions extend into the regions above 300 nm. Interstingly, light-induced activity has been observed for trans-Pt around 365 nm (3.40 eV)Mackay et al. (2006); Ronconi and Sadler (2011) which corresponds well with regions 1–3, having a number of transitions in the range 4.02–2.83 eV (308–438 nm). In particular, the 4c-CAM-B3LYP calculation have a transition at 3.46 eV (359 nm; region 2) which fits well with induced reactivity at 366 nm. While the SR calculation also displays a transition in this region (e.g. in region 2 at 3.43 eV), the 4c calculation reveals that the density of states (with non-zero intensity) in this region is higher than the SR calculation due to inclusion of excitation with triplet character through spin-orbit coupling. Thus, several more states may participate in the photo-induced reactivity than expected from the SR (or NR) calculation. It is also noted that the transitions in 2 were found to be considerably spin-mixed (the same is true for 1 and 3), which is not captured by the SR (or NR) calculation.
Finally, we note that no transitions were found at 647 nm, and the activity induced from light of this wavelength cannot be explained from our current calculations.
III.3 UV-vis spectra of cis-Pt
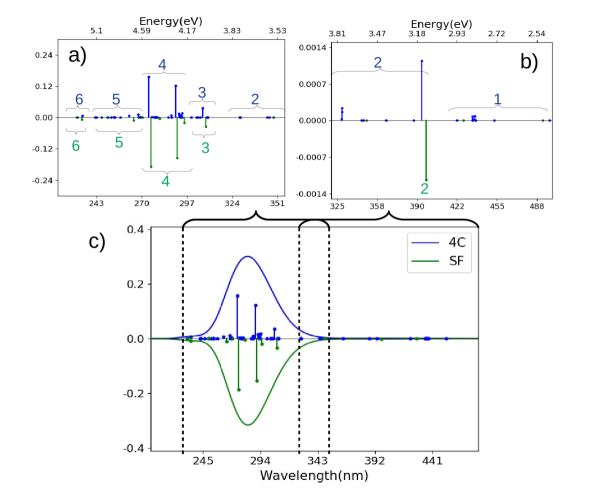
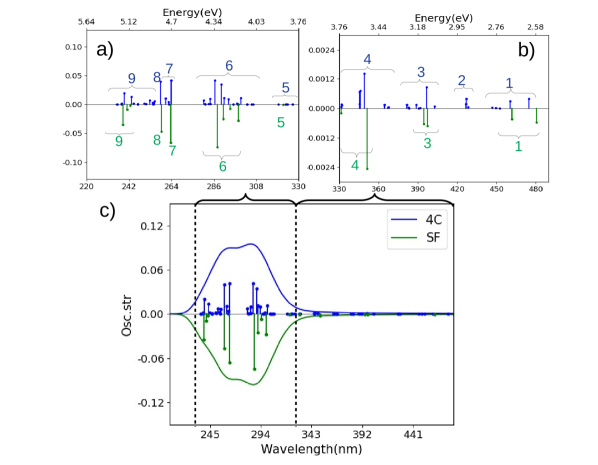
CAM-B3LYP results: The spectra obtained with 4c and NR frameworks are shown in Figure 7. The spectra contain significantly more transitions with relatively high intensities, compared to trans-Pt, and have therefore been divided into nine regions 1–9, shown in Figure 7(a) and 7(b). The full spectra are shown in Figure 7(c) and it can from this figure be seen that also for cis-Pt, the NR calculation varies considerably from the 4c calculation.
The transitions at highest energy, 9–7 (5.80–5.40 eV or 214–230 nm) in the 4c calculation, are qualitatively different from their NR counterparts. For the latter we only see few transitions (of character) at these high energies: they occur at 5.47–5.27 eV or 227–235 nm and are labeled 8 in Figure 7(a). The transitions labeled 9 in the 4c calculations involve almost exclusively transitions of character, consistent with their low intensity, while 8 involves a mixture of transitions with and (LMCT) character.
The next group of transitions (7 at 5.08–4.98 eV or 244–249 nm) in Figure 7a are only seen in the 4c calculation and have relatively low intensity; the most intense transition has character. Meanwhile, the most intense transitions in the spectrum are for the 4c calculation found in region 6 at 4.85–4.61 eV (256–269 nm) and are followed by several transitions of lower intensity (5) at 4.46–4.26 eV (278–291 nm). Both regions 6 and 5 are of LMCT character with a mixtures of and transitions, where region 5 has larger weight of the former and region 6 has larger weight of the latter. The NR calculation also has intense transitions in regions 6 and 5 with similar character (apart from the lower density of states): region 6 is at 4.75–4.73 eV (261–262 nm) and 5 is at 4.36–4.13 eV (284–300 nm); the transitions at 5 generally have considerably higher intensity compared to 4c counterpart.
In the low-energy parts of the spectrum (Figure 7b), the first group of transitions (4) at 4.07–3.78 eV (305–328 nm) in the 4c calculation is a mixture of transitions with and characters; the next region (3 at 3.56 eV; 348 nm) is of character. In the NR case, regions 4 and 3 have similar characters as the 4c calculation, but 3 is significantly red-shifted (at 3.26–3.22 eV or 380–385 nm). Interestingly, region 2 in the 4c calculation consists of many low-intensity LMCT transitions (of mixed and character) at 3.28–3.02 eV eV (378–410 nm), but no match is found in the NR calculations. The last region (1) is in both 4c and NR calculations of LMCT character (), and is also red-shifted in the NR calculation (2.69–2.62 eV or 460–472 nm compared to 2.89–2.84 eV or 430–435 nm in the 4c calculation).
As for the trans-Pt complex, the NR calculation is both quantitatively and qualitatively different from the 4c calculation. We have therefore also investigated whether inclusion of only SR effects can remedy the errors seen in the NR calculation: as seen from Figure 8(c), the SR calculation overall reproduces the most dominant features of the spectrum in the high-energy parts, although there are important differences: as expected, spin-orbit coupling gives rise to significantly higher density of states in the 4c calculation and many of these states have significant intensity, cf. Figure 8(b). The higher density of states is evident for all groups of transitions in the high-energy regions (9–6), but perhaps most pronounced for region 6: in the 4c calculation this region has five intense transitions (and a number of less intense ones), whereas the SR calculation only has four intense transitions in this region. Analyzing the underlying transitions shows that their character in 4c and SR calculations corresponds fairly well to each other ( and ). However, the transitions in the 4c framework have both large triplet character and contain spin-mixed orbitals (see Table S10 and Figure S4), causing the differences between 4c and SR (as well as NR) frameworks.
In the lower-energy parts of the spectrum (regions 4–1 in Figure 8b), we also see differences between 4c and SR calculations: region 4 at 4.01 eV or 310 nm in the SR calculation is almost exclusively of character, compared to a mix between and in the 4c counterpart. Further, the transitions in region 4 involve orbitals that are significantly spin-mixed (and some are also of dominant triplet character) in the 4c calculations, cf. Table S7 and Figure S4. Accordingly, region 4 has a number of relatively intense transitions, not seen in the SR calculation. The character of transitions in regions 3 (mainly of ) and 1 () in the SR calculation corresponds reasonably well with the 4c calculation, while no transitions occurs in region 2 in the SR (or NR) calculation. From the 4c calculation, the underlying transitions in region 2 are found to be considerably spin-mixed, explaining their absence in the NR and SR calculations.
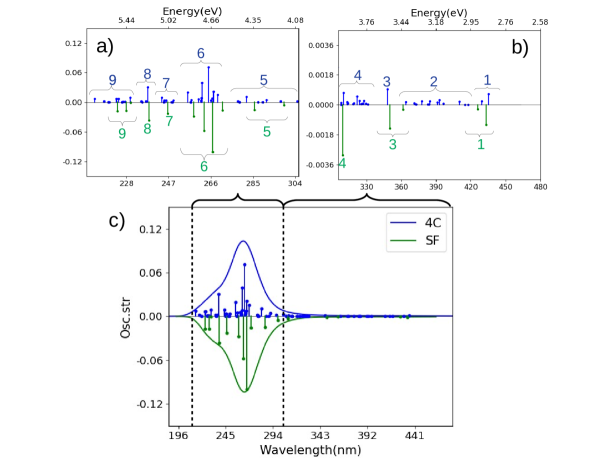
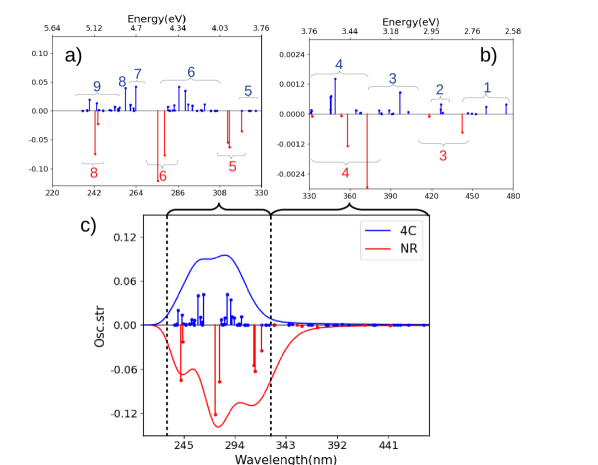
B3LYP results: Results for 4c, NR and SR Hamiltonians and B3LYP are given in Figures 9 and 10. We also here divide the spectrum into nine regions 1–9 (cf. Figures 9a and b as well as Figures 10a and b). We start by comparing 4c-B3LYP with 4c-CAM-B3LYP in the high-energy regions 9–5 in Figure 9(a). The underlying transitions are roughly similar with the two functionals (cf. Tables S7 and S11), although they on several occasions are predicted more intense with B3LYP, particular for regions 9–7. To the extend comparison between the regions is possible, they are generally red-shifted (between 0.2–0.5 eV) in the 4c-B3LYP calculations, compared to 4c-CAM-B3LYP. Moving to the NR case, the two functionals yield qualitatively similar spectra: as seen for NR-CAM-B3LYP, the NR-B3LYP calculation shows intense transitions in regions 8, 6 and 5 and the character of the underlying transitions are similar, although the three regions also for NR-B3LYP are red-shifted with 0.2–0.5 eV, compared to NR-CAM-B3LYP. The NR-B3LYP calculation also overestimates the intensities in region 5 compared to the relativistic counterparts (as seen with CAM-B3LYP).
For the low-energy part of the spectrum (regions 4–1, Figure 9), the energy-shifts of 0.5–0.2 eV between regions in B3LYP and CAM-B3LYP seen for the high-energy parts remains for both 4c and NR calculations. Further, both 4c- and NR-B3LYP calculations obtain roughly the same character for the transitions as for CAM-B3LYP (i.e. LMCT-transitions of and character). However, region 1 ( for 4c and NR-CAM-B3LYP) is not seen for NR-B3LYP.
Introducing SR effects in the B3LYP calculations (Figure 10) has the same effect as seen with CAM-B3LYP: the most intense features of the spectrum (regions 9–5) from the 4c calculation are reproduced, and the transitions are of similar character. Yet, a number of transitions with significant intensity are not seen in the SR calculation due to the lack of spin-orbit coupling. We highlight again region 6 which (as for CAM-B3LYP) in the 4c framework contain both transition with dominant triplet character and orbitals that are considerably spin mixed (cf. Table S10 and Figure S10). Ultimately, this leads to five intense transitions (and several more of lower intensity), compared to only four in the SR calculation. A similar scenario is found for the lower-energy regions (4–1); as for 4c-CAM-B3LYP the transitions in these regions are considerably spin-mixed and region 2 is completely missing in SR (and NR) calculations.
Comparison with experiment: The B3LYP calculation predicts either three (NR-B3LYP) or two (4c- and SR-B3LYP) intense bands while the experimental spectrumMackay et al. (2006) contains only one band (single peak at 256 nm or 4.84 eV): regions 7–8 at 4.80 eV–4.70 eV (259–264 nm) in the 4c-B3LYP calculation corresponds well with experiment. However, 4c-B3LYP also predicts almost equally intense transitions at 4.36 eV or 284 nm (region 6), which is not reflected in the experimental spectrum. A similar result was reported by Solokov and SchaeferSokolov and Schaefer III (2011) and Salassa et al.Salassa, Phillips, and Sadler (2009). The 4c- (or SR-) CAM-B3LYP calculation shows closer resemblance to experiment with one transition having significantly higher intensity than all other transitions (region 6 at 4.68 eV or 264 nm for the 4c calculation). Thus, the 4c-CAM-B3LYP overall reproduces the experimental spectrum best. In the following we therefore focus on 4c- and SR-CAM-B3LYP
Analyzing the lower-energy parts of the spectrum with 4c-CAM-B3LYP, we note that the cis-Pt complex reacts with DNA after exposure to light at 366 nm, 457.9 nm and also 647.1 nm.Kašpárková et al. (2003); Müller et al. (2003); Bednarski et al. (2006) From the spectra calculated with 4c-CAM-B3LYP (see Figure 7 or 8) we see that regions 3 (3.56 eV or 348 nm) and 2 (3.28–3.02 eV or 378–411 nm) in the 4c calculations have transitions that corresponds well with 366 nm (3.39 eV). However, as seen for trans-Pt, these regions are considerably spin mixed in the 4c calculation and hence has a denser manifold of states (especially for region 2), compared to the SR calculation. Similar arguments holds for region 1 (2.89–2.85 eV or 429–435 nm) in the 4c-CAM-B3LYP calculation, where several transitions correspond well with transitions at 458 nm (2.7 eV). As for the trans-Pt complex, we have not found any transitions at 647 nm.
IV Conclusion
Using TD-DFT, we have carried out a systematic investigation of the effect of using NR, SR and 4c Hamiltonians in calculations of UV-vis spectra on two Pt(IV) complexes. Both complexes are known to have light-activated activity against cancer cells. We have used both B3LYP and the long-range corrected CAM-B3LYP functionals. We find that 4c-CAM-B3LYP overall compares better with experimental spectra than 4c-B3LYP. However, the changes between NR, SR and 4c Hamiltonains are similar for the two functionals, ensuring that our conclusions are not merely artifacts from the functional choice. For both functionals, we find that (as might have been expected) a NR Hamiltonian does not reproduce the spectra obtained within a 4c framework. The SR calculations perform better. In fact, employing a SR Hamiltonian is sufficient to reproduce the main features of the experimental spectra, which are dominated by one strong absorption. However, the 4c-calculations shows that the underlying transitions are not always properly reproduced in the SR calculations, due to the lack of spin-orbit coupling: thus, intense bands in the higher energy parts (below 300 nm) as well as transitions of lower intensity (above 300 nm) can be considerably spin mixed and/or contain transitions of triplet character. This cannot be properly reproduced with SR and NR Hamiltonians. Notably, this can also be expected with ECPs if they are used together with a non-relativistic Hamiltonian.
Seeing that incident light with wavelength above 300 nm is usually employed to photo-activate trans-Pt and cis-Pt, inclusion spin-orbit coupling seems pertinent to fully understand the activation mechanism. For instance, the 4c-CAM-B3LYP calculations predict a dense manifold of states with low, yet non-zero intensities in regions around 366 nm (a wavelength use to activate both complexes). These transitions either have triplet character and/or involve significantly spin-mixed orbitals (and a similar scenario occurs for cis-Pt around 458 nm).
While our present results show that it is advantageous to include spin-orbit coupling in investigations of Pt complexes used for PACT, it is probably not necessary to use a 4c framework; we anticipate that various two-component methods will be sufficient. Further, we note that our present study did not take any solvent effects into account. We have recently extended the so-called polarizable embedding model for this purposeHedegård et al. (2017) and we plan to investigate the solvent effect in a forthcoming paper.
Acknowledgments
E.D.H. acknowledges financial support from the European Commission (MetEmbed, Project No. 745967) and the Villum Foundation (Young Investigator Program, Grant No. 29412).
References
- Johnstone, Suntharalingam, and Lippard (2016) T. C. Johnstone, K. Suntharalingam, and S. J. Lippard, Chem. Rev. 116, 3436 (2016).
- Hall and Hambley (2002) M. D. Hall and T. W. Hambley, Coord. Chem. Rev. 232, 49 (2002).
- Graf and Lippard (2012) N. Graf and S. J. Lippard, Adv. Drug Deliv. Rev. 64, 993 (2012).
- Butler and Sadler (2013) J. S. Butler and P. J. Sadler, Curr. Opin. Chem. Biol. 17, 175 (2013).
- Farrer, Salassa, and Sadler (2009) N. J. Farrer, L. Salassa, and P. J. Sadler, Dalton Trans. 48, 10690 (2009).
- Bonnet (2018) S. Bonnet, Dalton Trans. 47, 10330 (2018).
- Brown, Brown, and Walker (2004) S. B. Brown, E. A. Brown, and I. Walker, Lancet Oncol. 5, 497 (2004).
- Chen et al. (2015) H. Chen, J. Tian, W. He, and Z. Guo, J. Am. Chem. Soc. 137, 1539 (2015).
- Wilson and Hay (2011) W. R. Wilson and M. P. Hay, Nat. Rev. Cancer 11, 393 (2011).
- Salassa, Phillips, and Sadler (2009) L. Salassa, H. I. A. Phillips, and P. J. Sadler, Phys. Chem. Chem. Phys. 11, 10311 (2009).
- Mackay et al. (2009) F. S. Mackay, N. J. Farrer, L. Salassa, H.-C. Tai, R. J. Deeth, S. A. Moggach, P. A. Wood, S. Parsonsa, and P. J. Sadler, Dalton Trans. 13, 2315 (2009).
- Farrer et al. (2010) N. J. Farrer, J. A. Woods, L. Salassa, Y. Zhao, K. S. Robinson, G. Clarkson, F. S. Mackay, and P. J. Sadler, Angew. Chem. Int. Ed. 49, 8905 (2010).
- Westendorf et al. (2011) A. F. Westendorf, L. Zerzankova, L. Salassa, P. J. Sadler, V. Brabec, and P. J. Bednarski, J. Inorg. Biochem. 105, 652 (2011).
- Westendorf et al. (2012) A. F. Westendorf, J. A. Woods, K. Korpis, N. J. Farrer, L. Salassa, K. Robinson, V. Appleyard, K. Murray, R. Grünert, A. M. Thompson, P. J. Sadler, and P. J. Bednarski, Mol. Cancer Ther. 11, 1894 (2012).
- Zhao et al. (2013a) Y. Zhao, J. A. Woods, N. J. Farrer, K. S. Robinson, J. Pracharova, J. Kašpárková, O. Novakova, H. Li, L. Salassa, A. M. Pizarro, G. J. Clarkson, L. Song, V. Brabec, and P. J. Sadler, Chem. Eur. J. 19, 9578 (2013a).
- Zhao et al. (2013b) Y. Zhao, N. J. Farrer, H. Li, J. S. Butler, R. J. Mcquitty, A. Habtemariam, F. Wang, and P. J. Sadler, Angew. Chem. Int. Ed. 125, 13878 (2013b).
- Shaili et al. (2019) E. Shaili, L. Salassa, J. A. Woods, G. Clarkson, P. J. Sadler, and N. J. Farrer, Chem. Sci. 10, 8610 (2019).
- Sokolov and Schaefer III (2011) A. Y. Sokolov and H. F. Schaefer III, Dalton Trans. 40, 7571 (2011).
- Liu and Xiao (2018) W. Liu and Y. Xiao, Chem. Soc. Rev. 47, 4481 (2018).
- Saue et al. (2020) T. Saue, R. Bast, A. S. P. Gomes, H. J. Aa. Jensen, L. Visscher, I. A. Aucar, R. Di Remigio, K. G. Dyall, E. Eliav, E. Fasshauer, T. Fleig, L. Halbert, E. D. Hedegård, B. Helmich-Paris, M. Iliaš, C. R. Jacob, S. Knecht, J. K. Lædahl, M. L. Vidal, M. K. Nayak, M. Olejniczak, J. M. H. Olsen, M. Pernpointner, B. Senjean, A. Shee, A. Sunaga, and J. N. P. van Stralen, J. Chem. Phys. 152, 204104 (2020).
- Repiský et al. (2020) M. Repiský, S. Komorovský, M. Kadek, L. Konecny, U. Ekström, E. Malkin, M. Kaupp, K. Ruud, O. L. Malkina, and V. G. Malkin, J. Chem. Phys. 152, 184101 (2020).
- Gao et al. (2004) J. Gao, W. Liu, B. Song, and C. Liu, J. Chem. Phys. 121, 6658 (2004).
- Gao et al. (2005) J. Gao, W. Zou, W. Liu, Y. Xiao, D. Peng, B. Song, and C. Liu, J. Chem. Phys. 123, 054102 (2005).
- Bast, Jensen, and Saue (2009) R. Bast, H. J. Aa. Jensen, and T. Saue, Int. J. Quantum Chem. 109, 2091 (2009).
- Wang et al. (2005) F. Wang, T. Ziegler, E. Van Lenthe, S. Van Gisbergen, and E. J. Baerends, J. Chem. Phys. 122, 204103 (2005).
- Peng, Zou, and Liu (2005) D. Peng, W. Zou, and W. Liu, J. Chem. Phys. 123, 144101 (2005).
- Kühn and Weigend (2013) M. Kühn and F. Weigend, J. Chem. Theory Comput. 19, 5341 (2013).
- Egidi et al. (2016) F. Egidi, J. J. Goings, M. J. Frisch, and X. Li, J. Chem. Theory Comput. 12, 3711 (2016).
- Müller et al. (2003) P. Müller, B. Schröder, J. A. Parkinson, N. A. Kratochwil, R. A. Coxall, A. Parkin, S. Parsons, and P. J. Sadler, Angew. Chem. Int. Ed. 42, 335 (2003).
- Mackay et al. (2006) F. S. Mackay, J. A. Woods, H. Moseley, J. Ferguson, A. Dawson, S. Parsons, and P. J. Sadler, Chem. Eur. J. 12, 3155 (2006).
- Bednarski et al. (2006) P. J. Bednarski, R. Grünert, M. Zielzki, A. Wellner, F. S. Mackay, and P. J. Sadler, Chem. Biol. 13, 61 (2006).
- Imran et al. (2018) M. Imran, W. Ayub, I. S. Butler, and Z.-u. Rehman, Coord. Chem. Rev. 376, 405 (2018).
- Kašpárková et al. (2003) J. Kašpárková, F. S. Mackay, V. Brabec, and P. J. Sadler, J Biol. Inorg. Chem. 8, 741 (2003).
- Mackay et al. (2007) F. S. Mackay, J. A. Woods, P. Heringová, J. Kašpárková, A. M. Pizarro, S. A. Moggach, S. Parsons, V. Brabec, and P. J. Sadler, Proc. Nat. Acad. Sci. U.S.A. 104, 20743 (2007).
- Pracharova et al. (2012) J. Pracharova, L. Zerzankova, J. Stepankova, O. Novakova, N. J. Farrer, P. J. Sadler, V. Brabec, and J. Kašpárková, Chem. Res. Toxicol. 25, 1099 (2012).
- Min et al. (2014) Y. Min, J. Li, F. Liu, E. K. L. Yeow, and B. Xing, Angew. Chem. Int. Ed. 53, 1012 (2014).
- Gandioso et al. (2015) A. Gandioso, E. Shaili, A. Massaguer, G. Artigas, A. González-Canto, J. A. Woods, P. J. Sadler, and Vicente Marchán, Chem. Commun. 51, 9169 (2015).
- Imberti et al. (2020) C. Imberti, P. Zhang, H. Huang, and P. J. Sadler, Angew. Chem. Int. Ed. 59, 61 (2020).
- Ronconi and Sadler (2008) L. Ronconi and P. J. Sadler, Chem. Commun. 2, 235 (2008).
- Ronconi and Sadler (2011) L. Ronconi and P. J. Sadler, Dalton Trans. 40, 262 (2011).
- Ahlrichs et al. (1989) R. Ahlrichs, M. Bär, M. Häser, H. Horn, and C. Kölmel, Chem. Phys. Lett. 162, 165 (1989).
- Tao et al. (2003) J. Tao, J. P. Perdew, Staroverov, and G. E. Scuseria, Phys. Rev. Lett. 91, 146401 (2003).
- Schäfer, Horn, and Ahlrichs (1992) A. Schäfer, H. Horn, and R. Ahlrichs, J. Chem. Phys. 97, 2571 (1992).
- Eichkorn et al. (1995) K. Eichkorn, T. Oliver, H. Öhm, M. Häser, and R. Ahlrichs, Chem. Phys. Lett. 240, 283 (1995).
- Eichkorn et al. (1997) K. Eichkorn, F. Weigend, O. Treutler, and R. Ahlrichs, Theor. Chem. Acc. 97, 119 (1997).
- (46) DIRAC, a relativistic ab initio electronic structure program, Release DIRAC18 (2018), written by T. Saue, L. Visscher, H. J. Aa. Jensen, and R. Bast, with contributions from V. Bakken, K. G. Dyall, S. Dubillard, U. Ekström, E. Eliav, T. Enevoldsen, E. Faßhauer, T. Fleig, O. Fossgaard, A. S. P. Gomes, E. D. Hedegård, T. Helgaker, J. Henriksson, M. Iliaš, C. R. Jacob, S. Knecht, S. Komorovský, O. Kullie, J. K. Lærdahl, C. V. Larsen, Y. S. Lee, H. S. Nataraj, M. K. Nayak, P. Norman, G. Olejniczak, J. Olsen, J. M. H. Olsen, Y. C. Park, J. K. Pedersen, M. Pernpointner, R. Di Remigio, K. Ruud, P. Sałek, B. Schimmelpfennig, A. Shee, J. Sikkema, A. J. Thorvaldsen, J. Thyssen, J. van Stralen, S. Villaume, O. Visser, T. Winther, and S. Yamamoto (available at https://doi.org/10.5281/zenodo.2253986, see also http://www.diracprogram.org).
- Andrae et al. (1990) D. Andrae, U. Häußermann, M. Dolg, H. Stoll, and H. Preuß, Theor. Chim. Acta 77, 123 (1990).
- Weigend and Ahlrichs (2005) F. Weigend and R. Ahlrichs, Phys. Chem. Chem. Phys. 7, 3297 (2005).
- Dyall and Gomes (2009) K. G. Dyall and A. S. P. Gomes, Theor. Chem. Acc. 125, 97 (2009).
- Visscher (1997) L. Visscher, Theor. Chim. Acta 98, 68 (1997).
- Yanai, Tew, and Handy (2004) T. Yanai, D. P. Tew, and N. C. Handy, Chem. Phys. Lett. 393, 51 (2004).
- Becke (1988) A. D. Becke, Phys. Rev. A 38, 3098 (1988).
- Lee, Yang, and Parr (1988) C. Lee, W. Yang, and R. G. Parr, Phys. Rev. B 37, 785 (1988).
- Becke (1993) A. D. Becke, J. Chem. Phys. 98, 5648 (1993).
- Lévy-Leblond (1967) J.-M. Lévy-Leblond, Commun. Math. Phys. 6, 286 (1967).
- Dyall (1994) K. G. Dyall, J. Chem. Phys. 100, 2118 (1994).
- Visscher and Saue (2000) L. Visscher and T. Saue, J. Chem. Phys. 113, 3996 (2000).
- Garino and Salassa (2013) C. Garino and L. Salassa, Phil. Trans. R. Soc. A 371, 20120134 (2013).
- Dreuw and Head-Gordon (2004) A. Dreuw and M. Head-Gordon, J. Am. Chem. Soc. 126, 4007 (2004).
- Hedegård et al. (2017) E. D. Hedegård, R. Bast, J. Kongsted, J. M. H. Olsen, and H. J. Aa. Jensen, J. Chem. Theory Comput. 13, 2870 (2017).