Detection of the microquasar V404 Cygni at -rays revisited: short flaring events in quiescence
Abstract
The microquasar V404 Cygni (also known as GS 2023+338) was previously reported to have weak GeV -ray emission in sub-day time periods during its 2015 outburst. In order to provide more detailed information at the high energy range for this black hole binary system, we conduct analysis to the data obtained with the Large Area Telescope (LAT) onboard the Fermi Gamma-ray Space Telescope (Fermi). Both LAT database and source catalog used are the latest. In addition to the previously reported detection at the peak of the 2015 outburst, we find possible detection () of the source during 3-day time period of 2015 Aug. 17–19 (at the end of the 2015 outburst) and one convincing detection () in 2016 Aug. 23–25. The latter high-significance detection shows that the -ray emission of the source is soft with photon index . As -ray emission from microquasars is considered to be associated with their jet activity, we discuss the results by comparing with those well studied cases, namely Cyg X-3 and Cyg X-1. The detection helps identify V404 Cygni as a microquasar with detectable -ray emission in its quiescent state, and adds interesting features to the microquasar group, or in a more general context to X-ray binaries with jets.
1 Introduction
The X-ray binary V404 Cygni (or GS 2023+338) is a stellar-mass black hole system, consisting of a black hole and a 1 low-mass companion star (Casares et al., 1992; Casares & Charles, 1994; Khargharia et al., 2010). The system has an orbital period of 6.5 days (Casares & Charles, 1994) and is at a distance of 2.39 kpc (Miller-Jones et al., 2009). Long after a previous outburst in 1989 (Makino, 1989), it underwent a second outburst in 2015, both events triggering extensive observations at multi-frequencies. In particular, the recent outburst, which lasted from 2015 Jun. 15 (Barthelmy et al., 2015) to mid Aug. (Sivakoff et al., 2015; Plotkin et al., 2017), was monitored with a variety of radio, optical, X-ray, and -ray facilities. With particular attention paid to physical processes related to the black hole accretion (see, e.g., Belloni & Motta 2016), different aspects of the binary have been learned from these observations (e.g., Rodriguez et al. 2015; Plotkin et al. 2017; Walton et al. 2017; Tetarenko et al. 2017; Maitra et al. 2017 and references therein). In addition, an approximately month-long mini-outburst from the source was seen at the end of 2015. This mini-outburst exhibited similar features to those in the main outburst, but at a lesser intensity (4–14 times fainter, depending on the energy range; see Muñoz-Darias et al. 2017 and references therein).
This black hole binary belongs to the microquasar category (Mirabel & Rodríguez, 1999), as jets associated with the black hole have been observed in its quiescence state (e.g., Gallo et al. 2005; Rana et al. 2016; Plotkin et al. 2019), as were additional jet ejecta observed in the 2015 outburst (e.g., Walton et al. 2017; Tetarenko et al. 2017, 2019).
Microquasars are theoretically expected to be -ray–emitters (e.g., Atoyan & Aharonian 1999; Georganopoulos et al. 2002; Romero et al. 2003). Observationally the microquasars Cyg X-3 and Cyg X-1 were detected and relatively well studied at -rays (Fermi LAT Collaboration et al., 2009; Tavani et al., 2009; Sabatini et al., 2010; Bodaghee et al., 2013; Malyshev et al., 2013; Zanin et al., 2016; Zdziarski et al., 2017). As for V404 Cygni, during the second outburst, Loh et al. (2016) reported the source detection () above 100 MeV in a 12-h time bin on 2015 Jun. 26, with the data obtained with the Large Area Telescope (LAT) onboard the Fermi Gamma-ray Space Telescope (Fermi). The detection was confirmed by the AGILE observation (Piano et al., 2017), a 4.3 significance detection at nearly the same time in the energy range of 60–400 MeV. Very-high-energy -ray observations were also conducted using the MAGIC telescopes in 2015 Jun., but the source was undetected in the 200–1250 GeV energy range (Ahnen et al., 2017).
Given that Fermi LAT has been collecting data for nearly 12 years, and that both the database and source catalog have been updated several times since the previous work by Loh et al. (2016), we reanalyzed the -ray data for V404 Cygni, searching for new detection whilst re-examining previous detection results. From our detailed analyses, additional short-term flaring events, not in the outburst but in quiescence, were found.
2 LAT Data Analysis and Results
2.1 LAT data and source model
LAT has been scanning the whole sky continuously and collecting data in the energy range from 50 MeV to 1 TeV since 2008 Aug. (Atwood et al., 2009; Abdollahi et al., 2020). We selected the 0.06–500 GeV LAT events from 2008-08-04 15:43:36 (UTC) to 2020-03-05 01:16:35 (UTC; approximately 11.5 yrs) within a region centered at the position of V404 Cygni. The latest Fermi Pass 8 database was used. Following the recommendations of the LAT team111http://fermi.gsfc.nasa.gov/ssc/data/analysis/scitools/, the events with quality flags of ‘bad’ and zenith angles larger than 90 degrees were excluded; the latter to prevent contamination from the Earth’s limb.
Using the recently released Fermi LAT 10-year source catalog (4FGL-DR2; Ballet et al. 2020), we constructed a source model (for 4FGL, see Abdollahi et al. 2020). The sources listed in 4FGL-DR2 that are within a 20-degree radius of V404 Cygni were included. Their spectral forms are provided in the catalog. In our analysis, the spectral parameters of the sources 5 degrees farther from the target were fixed at the values given in the catalog. The background Galactic and extragalactic diffuse spectral models (gll_iem_v07.fits and iso_P8R3_SOURCE_V2_v1.txt respectively) were also included in the source model, with their normalizations set as free parameters in the analysis.
2.2 Search for possible detection in the LAT time period
We analyzed the 11.5 yr LAT data to search for possible -ray emission from V404 Cygni. Because the instrument response function of LAT has relatively large uncertainties in the 0.3 GeV energy range, and four catalog sources located close to V404 Cygni (see below section 2.2.1 for details) may easily contaminate the search results due to the large point spread function (PSF) of LAT in the low energy, we used mainly the 0.3–500 GeV data in our analysis. We first performed the binned likelihood analysis to the whole selected LAT data. No emission was found at the position of the target, as the obtained test statistic (TS) value was .
Given that both microquasars Cyg X-3 and Cyg X-1 show variable -ray emission (e.g., Corbel et al. 2012; Bodaghee et al. 2013) and were significantly detected in short time periods such as one day (e.g., Sabatini et al. 2010; Zanin et al. 2016; Zdziarski et al. 2018), we focused on searching for detection in different short time bins. By testing for 1-day, 3-day, or 6.5-day (i.e., the orbital period of V404 Cygni), we found that the analysis to the data in 3-day bins well show possible detection over the LAT data time period.
2.2.1 Nearby sources
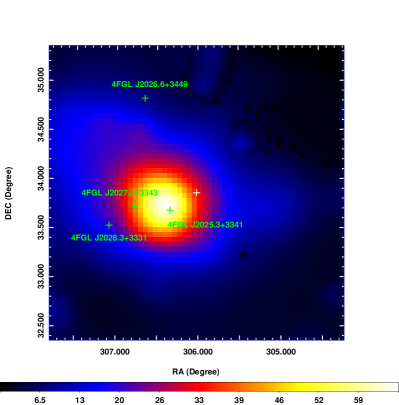
There are four nearby sources listed in the 4FGL catalog, which are 4FGL J2028.3+3331, 4FGL J2026.6+3449, 4FGL J2027.0+3343, and 4FGL J2025.3+3341 (see Figure 1). One of them, 4FGL J2025.3+3341, is a blazar (QSO B2023336) that was found to have had a flare at the beginning of the LAT data time period (Kara et al., 2012). We thus first checked properties of the sources to avoid possible contamination. 4FGL J2028.3+3331 is a pulsar (PSR J2028+3332) and had stable emission (TS6000 in the whole data), while 4FGL J2026.6+3449 and 4FGL J2027.0+3343 on the other hand were faint, having TS59 and 34 respectively in the whole LAT data. The former is a blazar and the latter an unknown source, and neither showed any significant flux variations.
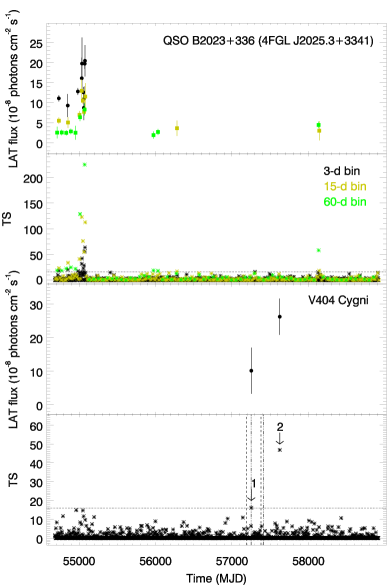
The blazar 4FGL J2025.3+3341 is the closest to V404 Cygni, having a separation of only 028. Previously, its -ray properties were studied by Kara et al. (2012) using the first 31-month LAT data, during which time it displayed clear -ray variations. We then proceeded to analyze sets of data in time bins of 3-, 15-, and 60-days for this source. In Figure 1, we show a TS map during MJD 55076–55078, which according to the 3-day binned data determined to be at the peak time of a major flare. As can be seen, the source’s flare could contaminate our search results for short flares from V404 Cygni due to its proximity. Based on the light curve results obtained from the 15- and 60-day binned data (see the top two panels of Figure 2), the flare was estimated to have lasted from the beginning of the LAT data to MJD 55103. After this active phase, several occasional short flaring events occurred in the rest of the time period as well. We performed binned analysis to the LAT data in both the active phase (MJD 54682–55103) as well as the rest of the time period for this blazar. No significant spectral changes were found, as the photon index was 2.75 in the former time period and 2.770.04 in the latter.
2.2.2 Search results for V404 Cygni
We performed unbinned likelihood analysis to 3-day binned LAT data in 0.3–500 GeV band for V404 Cygni. In this analysis, because the nearby blazar 4FGL J2025.33341 had variable flux, its spectral normalization was set as a free parameter, while all other spectral parameters of the 4FGL sources within 5 degrees from the target were fixed, at the values obtained from the above binned likelihood analysis to the whole data. In the bottom panel of Figure 2, the TS values obtained at the position of the target are shown.
The 3-day binned TS data points indicate several low-significance hints of detection (9TS16) of V404 Cygni during the active phase of the nearby blazar. These hints of detection were neglected in order to avoid any contamination due to the overlapping with the active phase. We also analyzed the whole active phase of the blazar 4FGL J2025.33341 (MJD 54682–55103), and V404 Cygni was not detected as a persistent source during this long integration time (TS3). When we required TS16 as a criterion for possible detection, two gamma-ray events have been found: MJD 57251–57253 and 57623–57625. The first one, on 2015 Aug. 17–19 (TS16), occurred at the end of the 2015 multi-frequency outburst. The second one, on 2016 Aug. 23–25, is significant with TS46 and coincident with a quiescent multi-frequency phase of the microquasar. Since they did not occur during the active phase, nor during the short flaring events of the nearby blazar, we focused on these two transient events and analyzed their characteristics in detail.
Considering that the -ray event at the peak of the 2015 outburst, as detected by Fermi LAT and AGILE (Loh et al., 2016; Piano et al., 2017), is characterized by a soft spectrum, we also performed an unbinned likelihood analysis of the 3-day Fermi LAT light curve in the 0.06–0.3 GeV energy range. We found four events with TS16, at MJD 55031–55033, 55037–55039, 55046–55048, and 55064–55066. However, since these events were observed during the major flare of the nearby blazar, possibly indicating a residual contamination from 4FGL J2025.33341 in the low-energy range, we neglected them as possible detections of V404 Cygni. As a result, no significant detections have been found in the low energy range, outside of the active phase of the blazar.
2.2.3 Possible detection in MJD 57251–57253
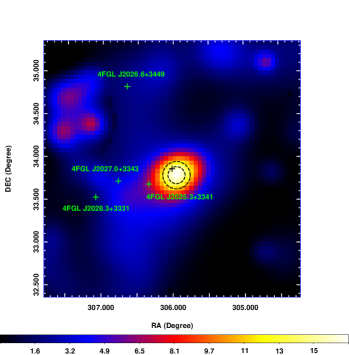
The first possible detection only has TS16, right at the end of the 2015 outburst (during Aug. 17–19; Figure 2). In order to verify the detection, we calculated a TS map of a region centered at the position of V404 Cygni in the 0.3–500 GeV energy range, shown in the left panel of Figure 3. Because the time bin does not overlap with any obvious flares from the nearby blazar, the blazar was considered in the source model and removed in the TS map. Excess emission at the position of V404 Cygni is clearly seen.
We then ran gtfindsrc in Fermitools to determine the position of the excess emission. It has 1 nominal uncertainty of 01, consistent with that of V404 Cygni (see the left panel of Figure 3). We performed unbinned likelihood analysis to the data with the fitted position and obtained a photon index of 2.50.4 and a 0.3–500 GeV flux of 1.10.5 photons s-1 cm-2 (with a TS value of 17).
2.2.4 Detection in MJD 57623–57625
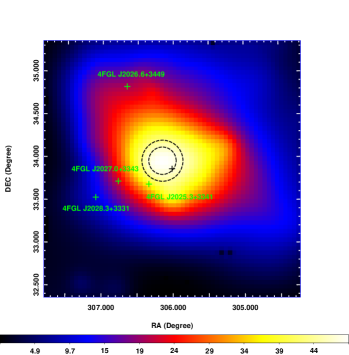
Since this event has TS46, we consider it as a likely detection of V404 Cygni. We performed the same analysis to the 0.3–500 GeV data in the 3-day binned data as mentioned in Section 2.2.3. The TS map of the region shown in the right panel of Figure 3 reveals excess emission at the position of V404 Cygni, with a maximum TS46. The determined position for the excess emission has a nominal uncertainty of 016, and V404 Cygni is in the error circle. The unbinned likelihood analysis gave 0.3 and 2.60.5 photons s-1 cm-2 (with a TS value of 48).

Since the excess emission has a relatively high TS value, we constructed a short-time unbinned light curve over the detection (Figure 4). In this analysis, all spectral parameters of the nearby sources, including the normalization of the blazar, were fixed to the values obtained from the preliminary binned likelihood analysis, using the data after the blazar’s active phase. We found that a light curve built upon 1-day binned data, with 0.25-day shifts between each flux measurement, may uncover the more detailed variations. As shown in Figure 4, the event appears to have a peak-like structure with a duration of 2 days. Using the orbital parameters given in Casares & Charles (1994), we checked the orbital phases for the time period. The start and end times (MJD 57623.0 and 57626.0 respectively) correspond to the orbital phase 0.32 and 0.78 respectively, when the companion star was mostly behind the black hole.
3 Discussion
Having used the latest Fermi LAT database and source catalog, we reanalyzed the LAT data for searching for short -ray events from V404 Cygni. We found possible detection during MJD 57251–57253 (with a significance of ) and another convincing one during MJD 57623–57625 (with a significance of ). Since the positional uncertainties determined from the Fermi LAT observations are relatively large, we checked the SIMBAD Astronomical Database for sources within the 016-radius error circle, the one derived for the convincing detection. There are only several known galaxies, detected by NuSTAR at the hard X-ray range of 3–24 keV and identified at optical and infrared wavelengths (Lansbury et al., 2017). No blazars, the dominant -ray sources in the sky (Abdollahi et al., 2020), are known to be within the error circle.
Because cases of short flares from unknown blazars were seen before (e.g., Loh et al. 2017; Gemes et al. 2019), we tested to quantify the chances of coincidentally detecting a random flare. We randomly chose positions in the sky at high Galactic latitudes (to avoid the complex and crowded Galactic plane). At each position where there were no nearby -ray sources, we generated a 3-day binned light curve from the 11.5-yr LAT data in the 0.3–500 GeV energy range, and checked to see if there was detection indicated by any TS25 data points. In the end, 300 such light curves were generated and no flares were found (Xing & Wang, in preparation). The results imply that the probability of detecting a 3-day short flare from unknown blazars is smaller than 0.33%. This test helps indicate that the flare during MJD 57623–57625 is at a 3 confidence level to have not arisen from an unknown blazar.
In our search for short flaring -ray events from V404 Cygni, by analyzing the Fermi LAT data above 300 MeV, we did not see any significant signals during the main phase of the multi-wavelength 2015 outburst (Jun. 15–30). Instead, we found a low-significance event at the end of the declining phase of the outburst (Aug. 17–19) and a high-significant event (2016 Aug. 23–25) during a quiescent phase of the microquasar. Below, we first present our more detailed analysis of the outburst data and the comparison of the results we obtained with those reported in Loh et al. (2016). We also discuss the two short flares we have found in our search, with a focus on the more significant one, by viewing their properties in a multi-wavelength picture and comparing with those of -ray–emitting microquasars. In the end, we discuss the implications of the case of V404 Cygni.

3.1 2015 outburst
In order to check for any possible detection signals during the outburst, we followed the analysis given in Loh et al. (2016) by constructing a 12-h binned light curve, where each time bin was shifted by 6 h forward (instead of 12 h). For this analysis, the spectral parameters of the 4FGL sources within 5 degrees from the target were firstly obtained from standard binned likelihood analysis to the 0.1–500 GeV LAT data after the active phase of the nearby blazar. Fixing the parameter at the obtained values, unbinned likelihood analysis was performed to the 0.1–500 GeV LAT data in each 12-h bins during the outburst. Since the outburst ended sometime during 2015 mid Aug. (Sivakoff et al., 2015), we extended the analysis to Aug. (compared to Jul. 17 as the end of data in Loh et al. 2016; see also their Figure 1). The obtained TS values are shown in Figure 5. We found a relatively high TS data point, TS8, at MJD 57199.25, and the value indicates a detection significance of . We calculated the 95% flux upper limit in the 0.1–500 GeV band during MJD 57199.0–57199.5 and obtained photons s-1 cm-2. This upper limit is comparable to the flux of () photons s-1 cm-2 obtained in Loh et al. (2016). We tested to set the spectral normalizations of the sources within 5 degrees as free parameters, and nearly the same results were obtained. On the other hand, it can be noted that there are two TS11 data points at MJD 57251 and 57251.25, which correspond to the possible detection event we have found in our search above.
In Loh et al. (2016), the evtype=56 events (the three best partitions from PSF 1 to 3) in the 0.1–100 GeV band were used, which differs from the total data (evtype=3) in the 0.1–500 GeV band used in our above analysis. In addition, our analysis was first run through the binned maximum likelihood process with weights included to reflect systematic uncertainties of the diffuse background, and then via the unbinned process without weighting based on the model obtained from the first step. The differences could be sensitive factors to marginal detection cases, causing inconsistent results.
Nevertheless, in our analysis of the Pass 8 data including the latest catalog sources, we obtained a marginal detection (2.8) at MJD 57199.0–57199.5, consistent with the time interval of the low-significance flare reported in Loh et al. (2016), for a similar set of data parameters. Although the detection significances are relatively low, the contemporaneous observations by Fermi LAT and AGILE of -ray emission at the peak of the multi-wavelength outburst (radio, X-ray and soft -ray) give statistical robustness to this high-energy transient event.
3.2 Properties of the short -ray flares
Both short flaring events found in our search have soft emission, as the obtained photon indices are 2.5 and 2.9 respectively. We note that the emission reported at the peak of the 2015 outburst was even softer (). The softness of the source’s emission is similar to that observed in the flaring events of Cyg X-3 and Cyg X-1 (Fermi LAT Collaboration et al., 2009; Zdziarski et al., 2018, 2017). In addition, -ray emission is seen at spots in the lobes of the jets from the microquasar SS 433 (Abeysekara et al., 2018; Xing et al., 2019), and it is extremely soft with in the energy range of 1.8 GeV (Xing et al., 2019). These similarities support the association of the flaring events with V404 Cygni, and moreover suggest a similar mechanism for -ray emission from microquasars.
Different models with consideration of jets have been proposed to explain -ray emission from microquasars (e.g., Atoyan & Aharonian 1999; Georganopoulos et al. 2002; Romero et al. 2003). Based on detailed studies of Cyg X-1 (also Cyg X-3; see, e.g., Zdziarski et al. 2018), which are able to fit its broad-band spectrum from radio to -rays, the -ray emission is determined to likely contain the components due to the jets’ synchrotron self-Compton radiation and the upscattering of photons from the accretion disk and companion star (Zdziarski et al., 2014, 2017). For V404 Cygni, the same scenario may be at work to give rise to its -ray emission. However, different from Cyg X-1 and Cyg X-3, the densities of photons from the companion star of V404 Cygni would be much lower, leading to the possibility that the photons may arise mainly from the jets themselves, and thus that the jets’ synchrotron self-Compton radiation may be the dominant -ray emission mechanism.
At the peak of the outburst, V404 Cygni was observed to have discrete jet ejecta whose emission is dominant at wavelengths from radio to sub-millimeter (sub-mm; Tetarenko et al. 2017, 2019). Thus, the short transient emission detected by Fermi LAT and AGILE at the peak of the multifrequency outburst (Loh et al., 2016; Piano et al., 2017) could arise from these plasma ejecta along the jets. According to radio and sub-mm observations, the compact jets in the system became dominant over the ejecta several days after the peak. Therefore, the -ray events—occurring during the quiescence phase— could be associated with the compact and persistent jets of this microquasar. By referring to the -ray event of 2016 Aug. 23–25 (MJD 57623–57625), the observed 0.3–500 GeV (isotropic) luminosity is erg s-1. The jet luminosity (collimation corrected; see Lamb et al. 2017) from V404 Cygni could be a factor of 20 larger, that is erg s-1. The mass accretion rate of the binary was estimated to be g s-1 (Muno & Mauerhan, 2006), taken from fitting the optical and infrared broad-band spectrum of the source in quiescence. The rate indicates an accretion power of erg s-1 (where is the efficiency) in the system, suggesting that there is sufficient energy to provide the required power for the jets.
However, no variations correlated with the short flares are seen in X-ray and optical monitoring of V404 Cygni, although we note that both the Swift/BAT (Krimm et al., 2013) and MAXI (Matsuoka et al., 2009) do not provide sufficiently sensitive monitoring of the source at X-rays. In Figure 4, we show the brightness measurements or upper limits from Swift/BAT and the AAVSO database222https://www.aavso.org/ over the MJD 57623–57625 event. No signs of significant brightening events around the flare were seen in the X-ray and optical data. Unfortunately, no simultaneous radio observations of the source are available, as it has been clearly shown in Cyg X-3 that the source’s -ray flares are due to jet activity, indicated by correlated radio variations (Corbel et al., 2012). In any case, V404 Cygni in quiescence has shown both significant long-term and short-term radio flux variations (Plotkin et al., 2019). In the latter cases, the variations were seen to exhibit a possible pattern of fast rise and slow decay. The -ray flare in MJD 57623–57625 may be slightly different, having a sharp peak-like shape (Figure 4) with the timescale ( days) much longer than hour-long variation timescales observed at radio.
3.3 Implications
The detection of the -ray flaring events from V404 Cygni in its quiescent state helps identify the source as another microquasar with detectable -ray emission, although the events were seemingly occasional. The event in MJD 57251–57253, which occurred during the descending phase of the 2015 multi-frequency outburst, might provide a hint of high-energy emission related to discrete relativistic jet ejecta, observed at radio and sub-mm wavelengths or indirectly derived from X-ray observations (Tetarenko et al., 2017, 2019; Walton et al., 2017). On the other hand, the phenomenology of the event detected in MJD 57623–57625 would suggest a different mechanism. In the context of a leptonic emission mechanism (upscattering of soft photons by relativistic jet particles), since no simultaneous optical enhancements were observed (see Figure 4), we can suppose a short increase of the high-energy particle rate along the compact jets. In order to identify how the high-energy emission is related to jet activity in this case, simultaneous -ray and radio detection will provide key information. However it is not easy to obtain such detection since based on our search, detectable -ray flaring events from V404 Cygni are rare.
It is notable that different from Cyg X-3 and Cyg X-1 (as SS 433 is a peculiar case; Abeysekara et al. 2018) that have a high-mass companion, V404 Cygni belongs to the more general low-mass X-ray binary (LMXB) class. We thus may consider that LMXBs with jets (including neutron star LMXBs; e.g., Russell et al. 2006) might all be able to produce some sorts of -ray emission, and searches for short-term flaring events from them might produce interesting results.
References
- Abdollahi et al. (2020) Abdollahi, S., Acero, F., Ackermann, M., et al. 2020, ApJS, 247, 33
- Abeysekara et al. (2018) Abeysekara, A. U., Albert, A., Alfaro, R., et al. 2018, Nature, 562, 82
- Ahnen et al. (2017) Ahnen, M. L., Ansoldi, S., Antonelli, L. A., et al. 2017, MNRAS, 471, 1688
- Atoyan & Aharonian (1999) Atoyan, A. M., & Aharonian, F. A. 1999, MNRAS, 302, 253
- Atwood et al. (2009) Atwood, W. B., Abdo, A. A., Ackermann, M., et al. 2009, ApJ, 697, 1071
- Ballet et al. (2020) Ballet, J., Burnett, T. H., Digel, S. W., & Lott, B. 2020, arXiv e-prints, arXiv:2005.11208
- Barthelmy et al. (2015) Barthelmy, S. D., D’Ai, A., D’Avanzo, P., et al. 2015, GRB Coordinates Network, 17929, 1
- Belloni & Motta (2016) Belloni, T. M., & Motta, S. E. 2016, Astrophysics and Space Science Library, Vol. 440, Transient Black Hole Binaries, 61
- Bodaghee et al. (2013) Bodaghee, A., Tomsick, J. A., Pottschmidt, K., et al. 2013, ApJ, 775, 98
- Casares & Charles (1994) Casares, J., & Charles, P. A. 1994, MNRAS, 271, L5
- Casares et al. (1992) Casares, J., Charles, P. A., & Naylor, T. 1992, Nature, 355, 614
- Corbel et al. (2012) Corbel, S., Dubus, G., Tomsick, J. A., et al. 2012, MNRAS, 421, 2947
- Fermi LAT Collaboration et al. (2009) Fermi LAT Collaboration, Abdo, A. A., Ackermann, M., et al. 2009, Science, 326, 1512
- Gallo et al. (2005) Gallo, E., Fender, R. P., & Hynes, R. I. 2005, MNRAS, 356, 1017
- Gemes et al. (2019) Gemes, A., Gabányi, K. É., Frey, S., et al. 2019, arXiv e-prints, arXiv:1902.07561
- Georganopoulos et al. (2002) Georganopoulos, M., Aharonian, F. A., & Kirk, J. G. 2002, A&A, 388, L25
- Kara et al. (2012) Kara, E., Errando, M., Max-Moerbeck, W. 2012, ApJ, 746, 159
- Khargharia et al. (2010) Khargharia, J., Froning, C. S., & Robinson, E. L. 2010, ApJ, 716, 1105
- Krimm et al. (2013) Krimm, H. A., Holland, S. T., Corbet, R. H. D., et al. 2013, ApJS, 209, 14
- Lamb et al. (2017) Lamb, G. P., Kobayashi, S., & Pian, E. 2017, MNRAS, 472, 475
- Lansbury et al. (2017) Lansbury, G. B., Stern, D., Aird, J., et al. 2017, ApJ, 836, 99
- Loh et al. (2017) Loh, A., Corbel, S., & Dubus, G. 2017, MNRAS, 467, 4462
- Loh et al. (2016) Loh, A., Corbel, S., Dubus, G., et al. 2016, MNRAS, 462, L111
- Maitra et al. (2017) Maitra, D., Scarpaci, J. F., Grinberg, V., et al. 2017, ApJ, 851, 148
- Makino (1989) Makino, F. 1989, IAU Circ., 4782, 1
- Malyshev et al. (2013) Malyshev, D., Zdziarski, A. A., & Chernyakova, M. 2013, MNRAS, 434, 2380
- Matsuoka et al. (2009) Matsuoka, M., Kawasaki, K., Ueno, S., et al. 2009, PASJ, 61, 999
- Miller-Jones et al. (2009) Miller-Jones, J. C. A., Jonker, P. G., Dhawan, V., et al. 2009, ApJ, 706, L230
- Mirabel & Rodríguez (1999) Mirabel, I. F., & Rodríguez, L. F. 1999, ARA&A, 37, 409
- Muñoz-Darias et al. (2017) Muñoz-Darias, T., Casares, J., Mata Sánchez, D., et al. 2017, MNRAS, 465, L124
- Muno & Mauerhan (2006) Muno, M. P., & Mauerhan, J. 2006, ApJ, 648, L135
- Piano et al. (2017) Piano, G., Munar-Adrover, P., Verrecchia, F., Tavani, M., & Trushkin, S. A. 2017, ApJ, 839, 84
- Plotkin et al. (2019) Plotkin, R. M., Miller-Jones, J. C. A., Chomiuk, L., et al. 2019, ApJ, 874, 13
- Plotkin et al. (2017) Plotkin, R. M., Miller-Jones, J. C. A., Gallo, E., et al. 2017, ApJ, 834, 104
- Rana et al. (2016) Rana, V., Loh, A., Corbel, S., et al. 2016, ApJ, 821, 103
- Rodriguez et al. (2015) Rodriguez, J., Cadolle Bel, M., Alfonso-Garzón, J., et al. 2015, A&A, 581, L9
- Romero et al. (2003) Romero, G. E., Torres, D. F., Kaufman Bernadó, M. M., & Mirabel, I. F. 2003, A&A, 410, L1
- Russell et al. (2006) Russell, D. M., Fender, R. P., Hynes, R. I., et al. 2006, MNRAS, 371, 1334
- Sabatini et al. (2010) Sabatini, S., Tavani, M., Striani, E., et al. 2010, ApJ, 712, L10
- Sivakoff et al. (2015) Sivakoff, G. R., Bahramian, A., Altamirano, D., et al. 2015, The Astronomer’s Telegram, 7959, 1
- Tavani et al. (2009) Tavani, M., Bulgarelli, A., Piano, G., et al. 2009, Nature, 462, 620
- Tetarenko et al. (2017) Tetarenko, A. J., Sivakoff, G. R., Miller-Jones, J. C. A., et al. 2017, MNRAS, 469, 3141
- Tetarenko et al. (2019) —. 2019, MNRAS, 482, 2950
- Walton et al. (2017) Walton, D. J., Mooley, K., King, A. L., et al. 2017, ApJ, 839, 110
- Xing et al. (2019) Xing, Y., Wang, Z., Zhang, X., Chen, Y., & Jithesh, V. 2019, ApJ, 872, 25
- Zanin et al. (2016) Zanin, R., Fernández-Barral, A., de Oña Wilhelmi, E., et al. 2016, A&A, 596, A55
- Zdziarski et al. (2017) Zdziarski, A. A., Malyshev, D., Chernyakova, M., & Pooley, G. G. 2017, MNRAS, 471, 3657
- Zdziarski et al. (2014) Zdziarski, A. A., Pjanka, P., Sikora, M., & Stawarz, Ł. 2014, MNRAS, 442, 3243
- Zdziarski et al. (2018) Zdziarski, A. A., Malyshev, D., Dubus, G., et al. 2018, MNRAS, 479, 4399