When did Population III star formation end?
1Department of Astronomy, University of Texas, Austin, TX 78712, USA
Abstract
We construct a theoretical framework to study Population III (Pop III) star formation in the post-reionization epoch () by combining cosmological simulation data with semi-analytical models. We find that due to radiative feedback (i.e. Lyman-Werner and ionizing radiation) massive haloes () are the major (%) hosts for potential Pop III star formation at , where dense pockets of metal-poor gas may survive to form Pop III stars, under inefficient mixing of metals released by supernovae. Metal mixing is the key process that determines not only when Pop III star formation ends, but also the total mass, , of active Pop III stars per host halo, which is a crucial parameter for direct detection and identification of Pop III hosts. Both aspects are still uncertain due to our limited knowledge of metal mixing during structure formation. Current predictions range from early termination at the end of reionization () to continuous Pop III star formation extended to at a non-negligible rate , with . This leads to a broad range of redshift limits for direct detection of Pop III hosts, , with detection rates , for current and future space telescopes (e.g. HST, WFIRST and JWST). Our model also predicts that the majority (%) of the cosmic volume is occupied by metal-free gas. Measuring the volume filling fractions of this metal-free phase can constrain metal mixing parameters and Pop III star formation.
keywords:
early universe – dark ages, reionization, first stars – galaxies: dwarf1 Introduction
The ‘standard model’ of early star formation predicts that the first generation of stars, the so-called Population III (Pop III), started to form at redshift in minihaloes of (Abel et al., 2002; Bromm et al., 2002; Bromm, 2013), driven by cooling from and molecules in primordial gas (Johnson & Bromm, 2006; Liu & Bromm, 2018). Although the properties of Pop III stars are still uncertain in the absence of direct observations, current theoretical models (e.g. Stacy & Bromm 2013; Susa et al. 2014; Hirano et al. 2015; Machida & Nakamura 2015; Stacy et al. 2016; Hirano & Bromm 2017; Sugimura et al. 2020), and indirect observational constraints (e.g. Frebel & Norris 2015; Ji et al. 2015; Hartwig et al. 2015; Magg et al. 2019; Ishigaki et al. 2018; Tarumi et al. 2020) converge on the picture that Pop III stars are characterized by a top-heavy initial mass function (IMF), covering a few to a few hundred . As a result, they have distinct features compared with present-day stars formed in metal-enriched enrionments, such as bluer spectra with narrow He ii emission lines and higher efficiencies of producing supernovae (SNe) and (binary) black holes (e.g. Nagao et al. 2008; Whalen et al. 2013; Kinugawa et al. 2014; Sobral et al. 2015; Belczynski et al. 2017; Ishigaki et al. 2018).
A fundamental question regarding Pop III stars is when in cosmic history this special mode of star formation was terminated, which is intricately linked to our understanding of the feedback mechanisms that not only regulate Pop III star formation, but also drive cosmic thermal and chemical evolution. An important goal is to provide guidance to observational campaigns searching for Pop III stars at lower, more accessible, redshifts (), possibly even extending to recent times. If detected at lower redshifts, Pop III systems could be studied in detail, directly measuring their IMF, which is out of reach at high redshifts, even with the next generation of telescopes, such as the James Webb Space Telescope (JWST). The challenge is to identify any such pockets of Pop III star formation at more recent epochs, which would be extremely rare.
There are three main physical processes that regulate Pop III star formation: (i) metal enrichment, (ii) Lyman-Werner (LW) radiation, and (iii) reionization. Locally, once the metallicity is above some critical value (e.g. Bromm & Loeb 2003; Omukai et al. 2005; Smith et al. 2009), star formation is shifted to the low-mass Population II/I (Pop II/I) mode. This threshold is typically exceeded within atomic cooling haloes (), which host the first galaxies (e.g. Wise et al. 2011; Pawlik et al. 2013; Jeon & Bromm 2019), and minihaloes externally enriched by nearby SNe (Wise et al., 2014; Smith et al., 2015; Jeon et al., 2017). However, metal enrichment is highly inhomogeneous, driven by complex interactions between SN blast waves and the ambient medium, accretion of primordial gas, and turbulent mixing during structure formation (e.g. Greif et al. 2010; Pan et al. 2013; Ritter et al. 2015). As a result, even if the mean metallicity is above at lower redshifts (), extremely metal-poor gas may still be available for Pop III star formation, as implied by observed quasar spectra with little metal absorption (e.g. Simcoe et al. 2012).
Globally, LW radiation can photo-dissociate molecular coolants, thus delaying and relocating Pop III star formation to occur in more massive haloes (e.g. Machacek et al. 2001; O’Shea & Norman 2006; Safranek-Shrader et al. 2012; Xu et al. 2013). Similarly, after reionization, star formation is significantly reduced in low-mass haloes (, e.g. Pawlik et al. 2015; Pawlik et al. 2017; Benitez-Llambay & Frenk 2020), where hot ionized gas cannot collapse. In general, LW and ionizing photons can suppress and even terminate Pop III star formation in low-mass haloes, but have little effect on massive haloes, where metal mixing is the key.
Taking into account all or some of these processes, Pop III star formation at lower redshifts () has been studied with semi-analytical models and cosmological simulations (e.g. Tornatore et al. 2007; Karlsson et al. 2008; Trenti & Stiavelli 2009; Muratov et al. 2013; Pallottini et al. 2014; Jaacks et al. 2019). While semi-analytical models predict the termination of Pop III star formation at (Scannapieco et al., 2003; Yoshida et al., 2004; Greif & Bromm, 2006; Hartwig et al., 2015; Mebane et al., 2018; Chatterjee et al., 2020), sharp cut-offs of Pop III star formation are not seen in simulations for , where the inhomogeneous nature of metal enrichment is better captured. High-resolution simulations, which at least marginally resolve minihaloes, generally agree that Pop III star formation continues down to at a level of a few to , without a sharp decrease towards lower redshifts (Wise et al., 2011; Johnson et al., 2013; Xu et al., 2016; Sarmento et al., 2018). Nevertheless, different sub-grid models for star formation, stellar feedback, and metal mixing are adopted with simplifying assumptions, leading to uncertainties and discrepancies in the detailed histories and environments of Pop III star formation. Besides, it is interesting to investigate Pop III star formation at even lower redshifts (), when it may finally end. However, it is still computationally prohibitive to run a cosmological hydrodynamics simulation that can well resolve minihaloes ( for dark matter) down to in a representative volume ( for peaks). In this regime, we have to rely on extrapolation of what is learned in simulations at higher redshifts, together with semi-analytical techniques.
In light of this, we construct a theoretical framework of Pop III star formation in the post-reionization epoch (), by combining simulation data and semi-analytical modelling of turbulent metal mixing and the reionization process, which may not be fully captured in simulations. Although we cannot provide a definitive answer to the question of when Pop III star formation was terminated, our work serves as a flexible platform to address this challenge. Specifically, individual elements of the framework, such as the metal mixing efficiency and ionization history, can be constrained by separate studies. Among them are high-resolution, zoom-in simulations, focusing on metal transport in the wake of SN feedback. Furthermore, our approach can be applied to different cosmological simulations. It also enables us to explore the observational signatures of possible late Pop III star formation at more recent cosmic times.
The paper is structured as follows. Section 2 briefly describes the sub-grid models and setup of our cosmological simulations, for which details are available in Liu & Bromm 2020 (LB20, henceforth). In Section 3, we demonstrate how the key feedback processes that regulate Pop III star formation arise during the evolution of the universe. Section 4 presents our framework of Pop III star formation after reionization, including its possible termination and the corresponding observational signatures. We summarize our findings and conclusions in Section 5.
2 Simulating Early Star Formation
Our cosmological simulations are conducted with the gizmo code (Hopkins, 2015), using the Lagrangian meshless finite-mass (MFM) hydro solver, with a number of neighbours , and the Tree+PM gravity solver from gadget-3 (Springel, 2005). The properties of baryons are computed with a non-equilibrium primordial chemistry and cooling network for 12 primordial species, supplemented by metal-line cooling of C ii, O i, Si ii and Fe ii (Jaacks et al., 2018). Sub-grid models for Pop III and Pop II star formation, stellar feedback, black hole formation, accretion, dynamics, feedback and reionization are employed (LB20). Specifically, Pop III and Pop II are distinguished by a threshold metallicity (). The former is characterized by a modified Larson IMF, , with and in the mass range (Jaacks et al., 2018), while the latter by a Chabrier IMF in the mass range (Jaacks et al., 2019). LW radiation is modelled with a background term derived from the simulated star formation rate density (SFRD) and a local term under the optically thin assumption, taking into account self-shielding for photo-dissociation. Ionization and SN feedback from massive stars are implemented in terms of their long-term (‘legacy’) thermal and chemical impact (Jaacks et al., 2018; Jaacks et al., 2019), as well as SN-driven winds (Springel & Hernquist 2003). Reionization is modelled with UV background (UVB) heating based on the photo-ionization rate from Faucher-Giguere et al. (2009), assuming a characteristic scale of for shielding in the intergalactic medium (IGM). Table 1 summarizes the key parameters of SN feedback. We refer the reader to LB20 for detailed descriptions and calibrations of the sub-grid models.
| Type | ||||
|---|---|---|---|---|
| Pop III | 3 Myr | |||
| Pop II | 10 Myr | |||
In this work, we focus on the most representative run FDbox_Lseed in LB20 (referred as the/our simulation, henceforth), where the simulated region is a periodic cubic box of side length . The initial positions and velocities of simulation particles are generated with the music code (Hahn & Abel, 2011) at an initial redshift for the Planck CDM cosmology (Planck Collaboration et al., 2016): , , , , and . The chemical abundances are initialized with the results in Galli & Palla (2013), following Liu et al. 2019 (see their Table 1). The (initial) mass of gas (dark matter) particles is (). The basic unit of star formation (i.e. the mass of stellar particles) is set to , for both Pop III and Pop II stars. This choice reflects the typical mass () of a Pop III star cluster, based on high-resolution simulations of Pop III star formation in individual minihaloes (e.g. Stacy & Bromm 2013; Susa et al. 2014; Machida & Nakamura 2015; Stacy et al. 2016; Hirano & Bromm 2017; Sugimura et al. 2020), and constraints from the observed global 21-cm absorption signal (Schauer et al., 2019b). We have verified that the choice of has little impact on processes involving Pop II stars. The simulation stops at , when the simulation volume is marginally representative for all peaks. The simulation data are analysed with yt111https://yt-project.org/doc/index.html (Turk et al., 2010), and dark matter haloes are identified by the rockstar222https://bitbucket.org/gfcstanford/rockstar/src halo finder (Behroozi et al., 2012).
3 Key Feedback Effects
In this section, we discuss the build-up of global LW and ionizing radiation fields as well as metal enrichment in the simulation, which are the key feedback effects for regulating Pop III star formation. We also evaluate the uncertainties in our simulation results, by comparison with other simulations and observational constraints. In the next section, we introduce semi-analytical corrections to account for potentially underestimated feedback effects.
3.1 Radiation feedback
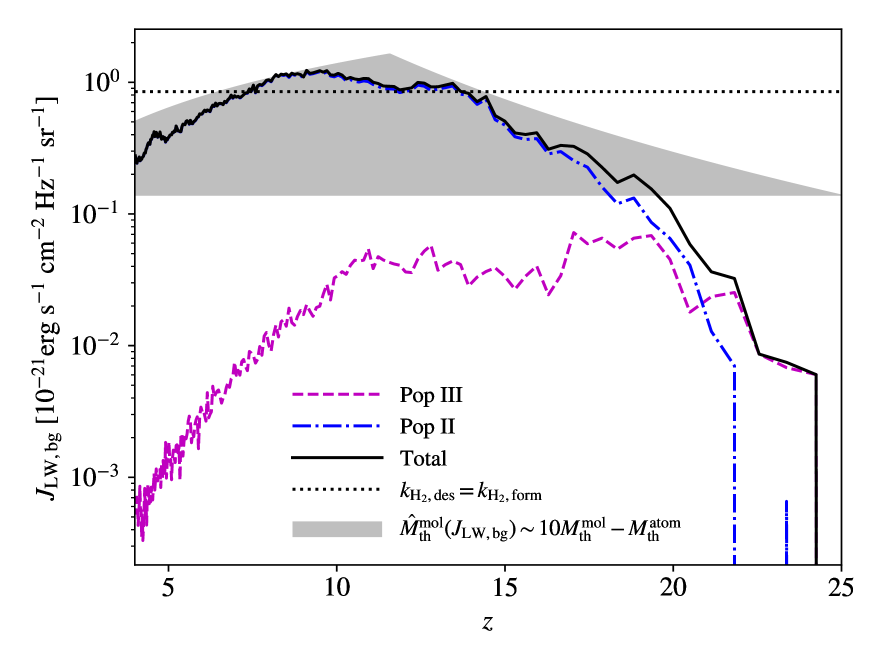
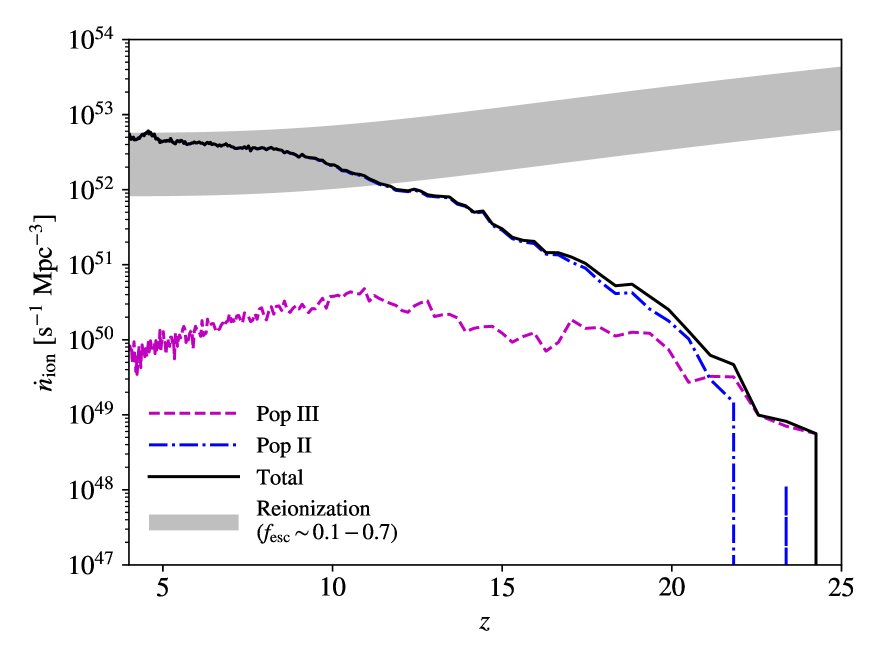
Fig. 1 shows the evolution of cosmic radiation backgrounds, in terms of LW intensity (left) and production rate density of ionizing photons (right). Individual contributions from Pop III and Pop II stars are also shown. For LW radiation (see Sec. 2.2.2 of LB20), the Pop II component exceeds that from Pop III at shortly after the onset of Pop II star formation (), and dominates the LW background for . The fractional contribution from Pop III decreases with decreasing redshift, and becomes negligible (%) in the post-reionization era ().
To evaluate the strength of the LW feedback, we also plot the ‘critical’ LW intensity for significant suppression of Pop III star formation in low-mass haloes. Two definitions are employed for this ‘critical’ intensity. The first is based on the increase of threshold halo mass for star formation caused by LW feedback, given by the fitting formula (Machacek et al., 2001; Fialkov, 2014)
| (1) |
where and are the mass thresholds with and without LW feedback, , and we regard an increase by a factor in the range of to as ‘critical’ (shaded region). Here we adopt the threshold masses and in Trenti & Stiavelli (2009), and further impose a lower limit of for , based on the simulations of Schauer et al. (2019a) for the typical case of baryon-dark-matter streaming velocity. The second is based on the formation and destruction balance333We have taken into account self-shielding against LW radiation in calculating the destruction rate, with the same method used in the simulation (see Sec. 2.2.2 of LB20), based on Wolcott-Green et al. (2011). at a typical state of collapsing primordial gas with a temperature , a density , and an electron abundance (dotted horizontal line). It turns out that at , residing in the ‘critical’ range given by the first definition, and exceeding the ‘critical’ value according to the second definition at (with ). In Sec. 4.1, we will show that Pop III star formation is indeed shifted to more massive haloes (i.e. ) at .
For ionizing radiation, we derive the total production rate density of ionizing photons as the summation of Pop III and Pop II contributions:
| (2) | ||||
| (3) |
where is the simulated SFRD, the lifetime of massive stars (3 Myr for Pop III and 10 Myr for Pop II), and the luminosity of ionizing photons per unit stellar mass. Following Visbal et al. (2015); Schauer et al. (2019b), we adopt for Pop III, based on Schaerer 2002 (see their table 4), and for Pop II, based on Samui et al. 2007 (see their table 1), given a typical metallicity (see Fig. 4). Similar to the case of LW radiation, the Pop II contribution starts to dominate at , and that of Pop III drops below 1% at . For comparison, we estimate the production rate density required for reionization, based on the ‘critical’ SFRD (Johnson et al., 2013)
| (4) |
where is the clumping factor, and is the escape fraction. We consider the typical range of escape fraction (So et al., 2014; Paardekooper et al., 2015), and clumping factor evolution from Chen et al. 2020 (for , see their equ. 13 and table. 2). The ‘critical’ production rate is reached in our simulation at , which is consistent with our implementation of the UVB heating and the resulting ionization history.
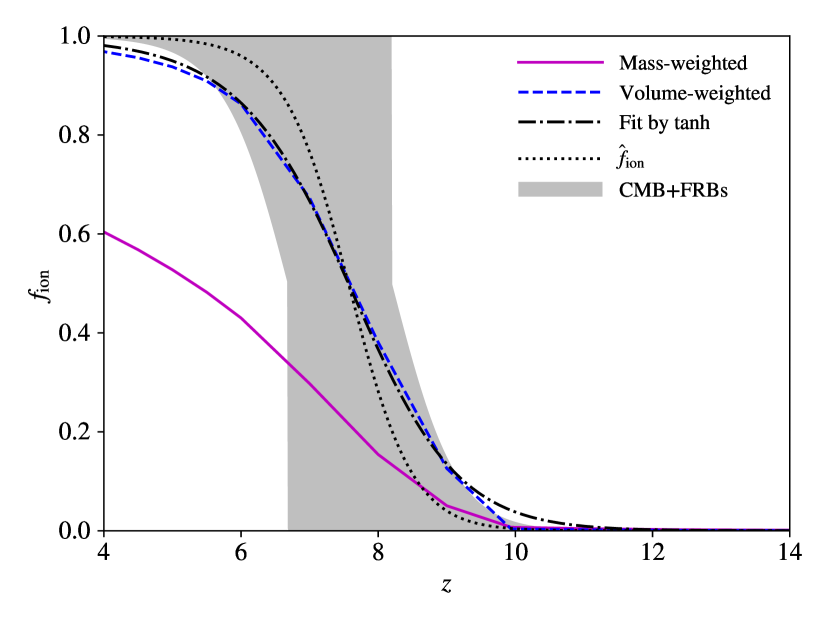
This is demonstrated in Fig. 2, which shows the mass- and volume-weighted hydrogen ionized fractions in the simulation. Both fractions start to rise at , reaching 0.6 (mass-weighted) and 0.97 (volume-weighted) at the end of the simulation (). We further fit the volume-weighted ionized fraction to the widely used tanh form (Lewis, 2008)
| (5) |
where is the ionized fraction left over from recombination, , , is the redshift at which , and describes the duration of reionization. We keep fixed, and fit for and . As shown in Fig. 2, the fit is excellent at , with best-fit parameters and .
In our simulation, reionization is delayed compared to what is inferred from Planck data, where (Planck Collaboration et al., 2016), but the difference is still within . This implies that we may underestimate the effect of reionization feedback, as is also evident in the mass-weighted ionized fraction, which is only 0.6 at . Note that the mass fraction of collapsed objects (i.e. haloes, with overdensities ) is at , indicating that self-shielding in the IGM is significant. Indeed, we will show in Sec. 4.1 that in our simulation the effect of reionization on star formation becomes important only at . This is unphysically late, likely caused by this overestimation of self-shielding against external UV radiation. Actually, the characteristic scale of assumed for IGM self-shielding leads to an optical depth for (i.e. structures that have passed turnover in the spherical collapse model) at . Therefore, we conclude that the effect of reionization is not fully captured in our simulation, and should be modelled separately (see Sec. 4.2). Meanwhile, to correct for the overestimated self-shielding, we reset for further applications of , based on the combined constraints (, ) from the cosmic microwave background (CMB) and fast radio bursts (FRBs; Dai & Xia 2020).
3.2 Metal enrichment
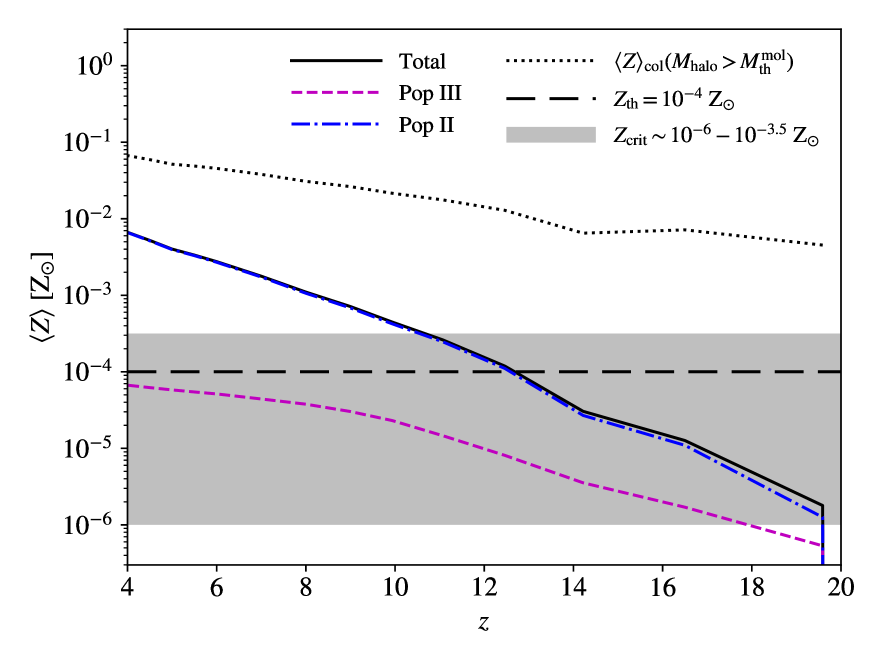
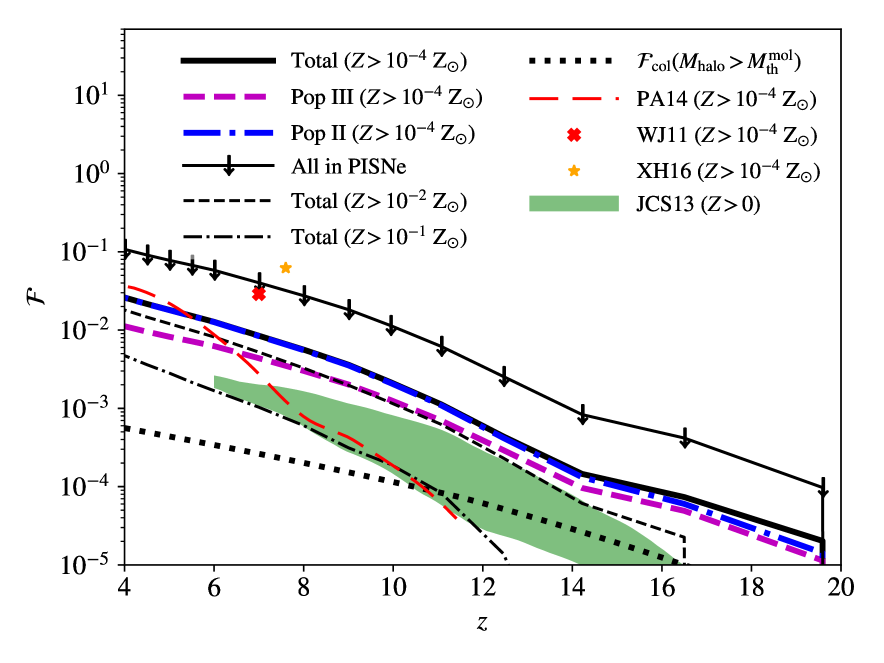
Fig. 3 shows the global metal enrichment process in terms of the (mass-weighted) mean gas metallicity (left) and volume-filling fractions of gas at different metallicity levels (right), derived from the zoom-in run FDzoom_Hseed in LB20. The mean metallicity exceeds the critical metallicity for transitioning to Pop II star formation, at . We further estimate the mean metallicity in collapsed metal-enriched structures, i.e. haloes with (dotted curve), assuming that all metals are confined, i.e. , where is the mass fraction of such structures, given the halo mass function (calculated by Murray et al. 2013), cosmic mean matter density , and molecular cooling threshold for star formation. The resulting mean metallicity is always above by at least one order of magnitude. Meanwhile, the volume-filling fraction remains below 10%. This outcome reflects the inhomogeneous nature of metal enrichment, such that regions close to star formation sites are rapidly enriched, overshooting , while others remain extremely metal-poor (Scannapieco et al., 2003). Therefore, the volume filling fraction of significantly enriched gas is a better indicator of the effect of metal-enrichment on Pop III star formation than the mean metallicity . We also compare the volume filling fraction of metal-enriched mass to that of haloes with . The latter is estimated as . We find that , even for at , which is a sign of metal enrichment of the IGM driven by galactic outflows. Similar trends are also seen in previous studies (Wise et al., 2011; Johnson et al., 2013; Pallottini et al., 2014; Xu et al., 2016).
Similar to radiation feedback, the Pop III contribution to the mean metallicity of gas also decreases towards lower redshifts, dropping to % at . However, the Pop III contribution to the volume-filling fraction of significantly metal-enriched gas is always non-negligible (40%-70%). The reason is that Pop III star formation tends to occur in low-density regions (away from previous star formation and metal enrichment activity) where SN bubbles can expand to larger volumes. Actually, in the extreme case where all Pop III stars end in pair-instability SNe (PISNe), the volume-filling fraction (estimated by rescaling the Pop III contribution based on the boost of SN energy by PISNe) will be dominated (%) by Pop III stars and reaches 10% at . This feature is also seen in the recent cosmological simulation from Kirihara et al. (2020), which finds that metals of Pop III origin dominate in low-density regions () at . Particularly, their models (b) and (c), which resemble our Pop III IMF, predict a range of mean (Pop III) metallicity across regions of different overdensities (see their fig. 5), consistent with our result (corresponding to a mean metal mass density of ) at .
We further compared our volume-filling fractions with literature results (Wise et al., 2011; Johnson et al., 2013; Pallottini et al., 2014; Xu et al., 2016). For instance, our agrees well with that in Pallottini et al. (2014) at , but is higher by up to a factor of 10 at than those in Johnson et al. (2013); Pallottini et al. (2014). Meanwhile, the simulations in Wise et al. (2011); Xu et al. (2016) with the enzo code predict % at , higher than our results by up to a factor of 10. Our extreme model, where all Pop III stars end in PISNe, places an upper limit on the volume-filling fraction of 10% at , which is also consistent with the value 15% from the corresponding model (a) in Kirihara et al. (2020). In general, the discrepancies in different simulations are significant (up to two orders of magnitude), reflecting the uncertainties in sub-grid models for SN feedback and metal transport. It remains uncertain to what extent the fine-grain metal mixing process (at a scale of pc; Spitzer 2006; Sarmento et al. 2016) is captured in such cosmological simulations with limited resolution ( pc). Therefore, the late-time () Pop III star formation in our simulation may not be adequately captured, due to the imperfect treatment of metal transport.
To be more specific, we assume that metals are instantaneously mixed into the gas particles enclosed by the final radius of SN shell expansion, while in reality, the timescale for complete mixing can be non-negligible ( Myr) at the scale of gas particles (), marking the resolution limit of the simulation444According to Pan et al. (2013); Sarmento et al. (2016), the dynamical mixing timescale is Myr, for our gas particles at a scale of pc, under the typical conditions in SN remnants with a mean matallicity , a density , a temperature K and a Mach number .. That is to say, even if the mean metallicity of a gas particle is above , there could still be a significant fraction of gas with . It is shown in Sarmento et al. (2016, 2018) that taking into account such unresolved metal-poor gas will enhance the Pop III SFRD by a factor of 2. On the other hand, we do not smooth gas metallicities with any kernels, such that the metallicity of a gas particle is only affected by nearby SNe. Our approach is valid at the scale of , as the MFM method sets the mass fluxes across mesh boundaries explicitly to zero. However, turbulent metal diffusion at unresolved scales across different gas particles is not captured, which may reduce the fraction of metal-poor gas in a halo. Besides, the mesh itself in gizmo is actually smoothed. Therefore, in Sec. 4.2, we use semi-analytical models of metal-mixing to correct for the potentially overestimated amount of metal-poor gas in the simulated Pop III SFRD. It is also possible to implement passive scalar diffusion in simulations (see Hopkins 2017). We defer such investigations to future work.
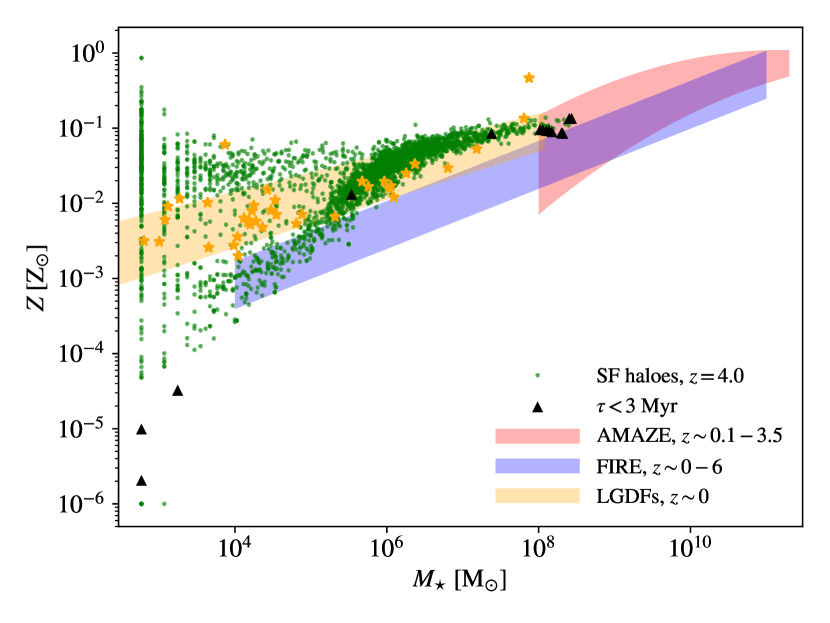
Although our treatment of metal transport is idealized, the observed stellar metallicity-mass relation (Maiolino et al., 2008; Simon, 2019) is well reproduced by our simulation in a broad mass range , especially for local group dwarfs (LGDFs), as shown in Fig. 4. We find that the scatter in stellar metallicity increases with decreasing stellar mass, in particular for , also consistent with the trend in observations. However, at a fixed stellar mass, the stellar metallicity is higher in our simulation compared with the FIRE simulations (Ma et al., 2016), again demonstrating the uncertainties in cosmological simulations regarding metal enrichment.
4 Pop III star formation after reionization
In this section, we demonstrate our framework for Pop III star formation after reionization (). We first characterize a representative sample of simulated haloes with recent Pop III star formation at , considering their mass and metallicity distributions, as well as the masses and locations of active Pop III stars within them (Sec. 4.1). Based on this sample, we then employ semi-analytical models for metal mixing and reionization to extrapolate the Pop III SFRD to (Sec. 4.2). Finally, we discuss the observational constraints and possible signatures of Pop III star formation in the post-reionization epoch (), as well as its potential termination (Sec. 4.3).
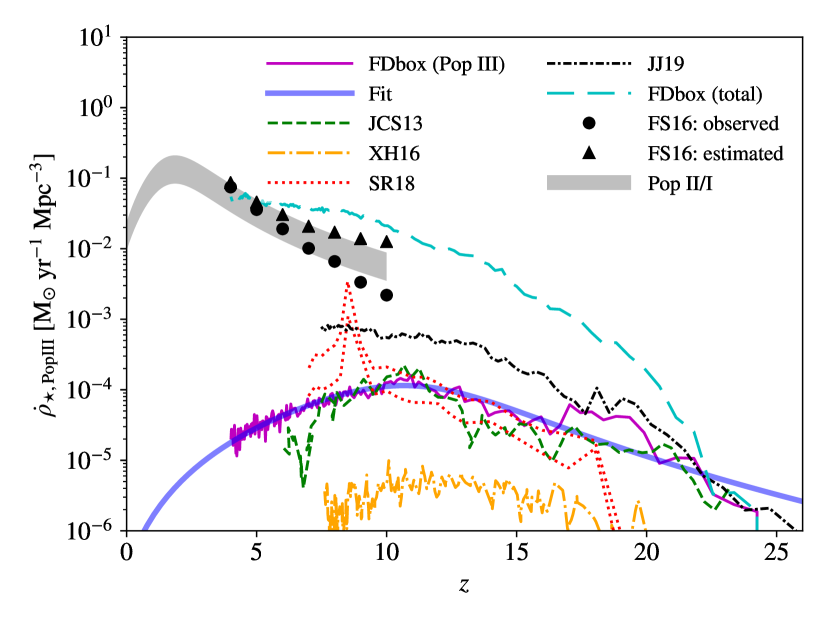
The starting point of our framework is the simulated (co-moving) Pop III SFRD, which is shown in Fig. 5, in comparison with literature results (Johnson et al., 2013; Xu et al., 2016; Sarmento et al., 2018; Jaacks et al., 2019). Our Pop III SFRD peaks at with , and drops to at . We fit the simulated Pop III SFRD to the form (Madau & Dickinson, 2014)
| (6) |
which leads to best-fit parameters , , and . For the post-reionization epoch (), this is approximately equivalent to a power-law extrapolation , as in our case. Interestingly, the power-law index here is similar to that of the Pop II/I SFRD from Madau & Dickinson (2014). Integrating across cosmic history gives the density of all Pop III stars ever formed, (in which 55% comes from ), consistent with the constraints in Visbal et al. (2015), set by Planck data.
Our Pop III SFRD agrees well with Johnson et al. (2013) at and Sarmento et al. (2018) at , but is lower (higher) compared with that in Jaacks et al. 2019 (Xu et al. 2016) at . This can be explained with the fact that Jaacks et al. (2019) did not include mechanical SN feedback, while Xu et al. (2016) targeted a low-density region ( at ), whose results should be regarded as lower limits. In general, our Pop III SFRD is approximately the median value among various simulation results (Tornatore et al., 2007; Wise et al., 2011; Johnson et al., 2013; Xu et al., 2016; Sarmento et al., 2018). In Fig. 5, we also plot the simulated total SFRD (dominated by Pop II/I at ), which is consistent with observations within a factor of 2 (Madau & Dickinson, 2014; Finkelstein, 2016). We refer the reader to Section 3 of LB20 for more detailed comparisons between our simulations and observations.
4.1 Host haloes of Pop III stars
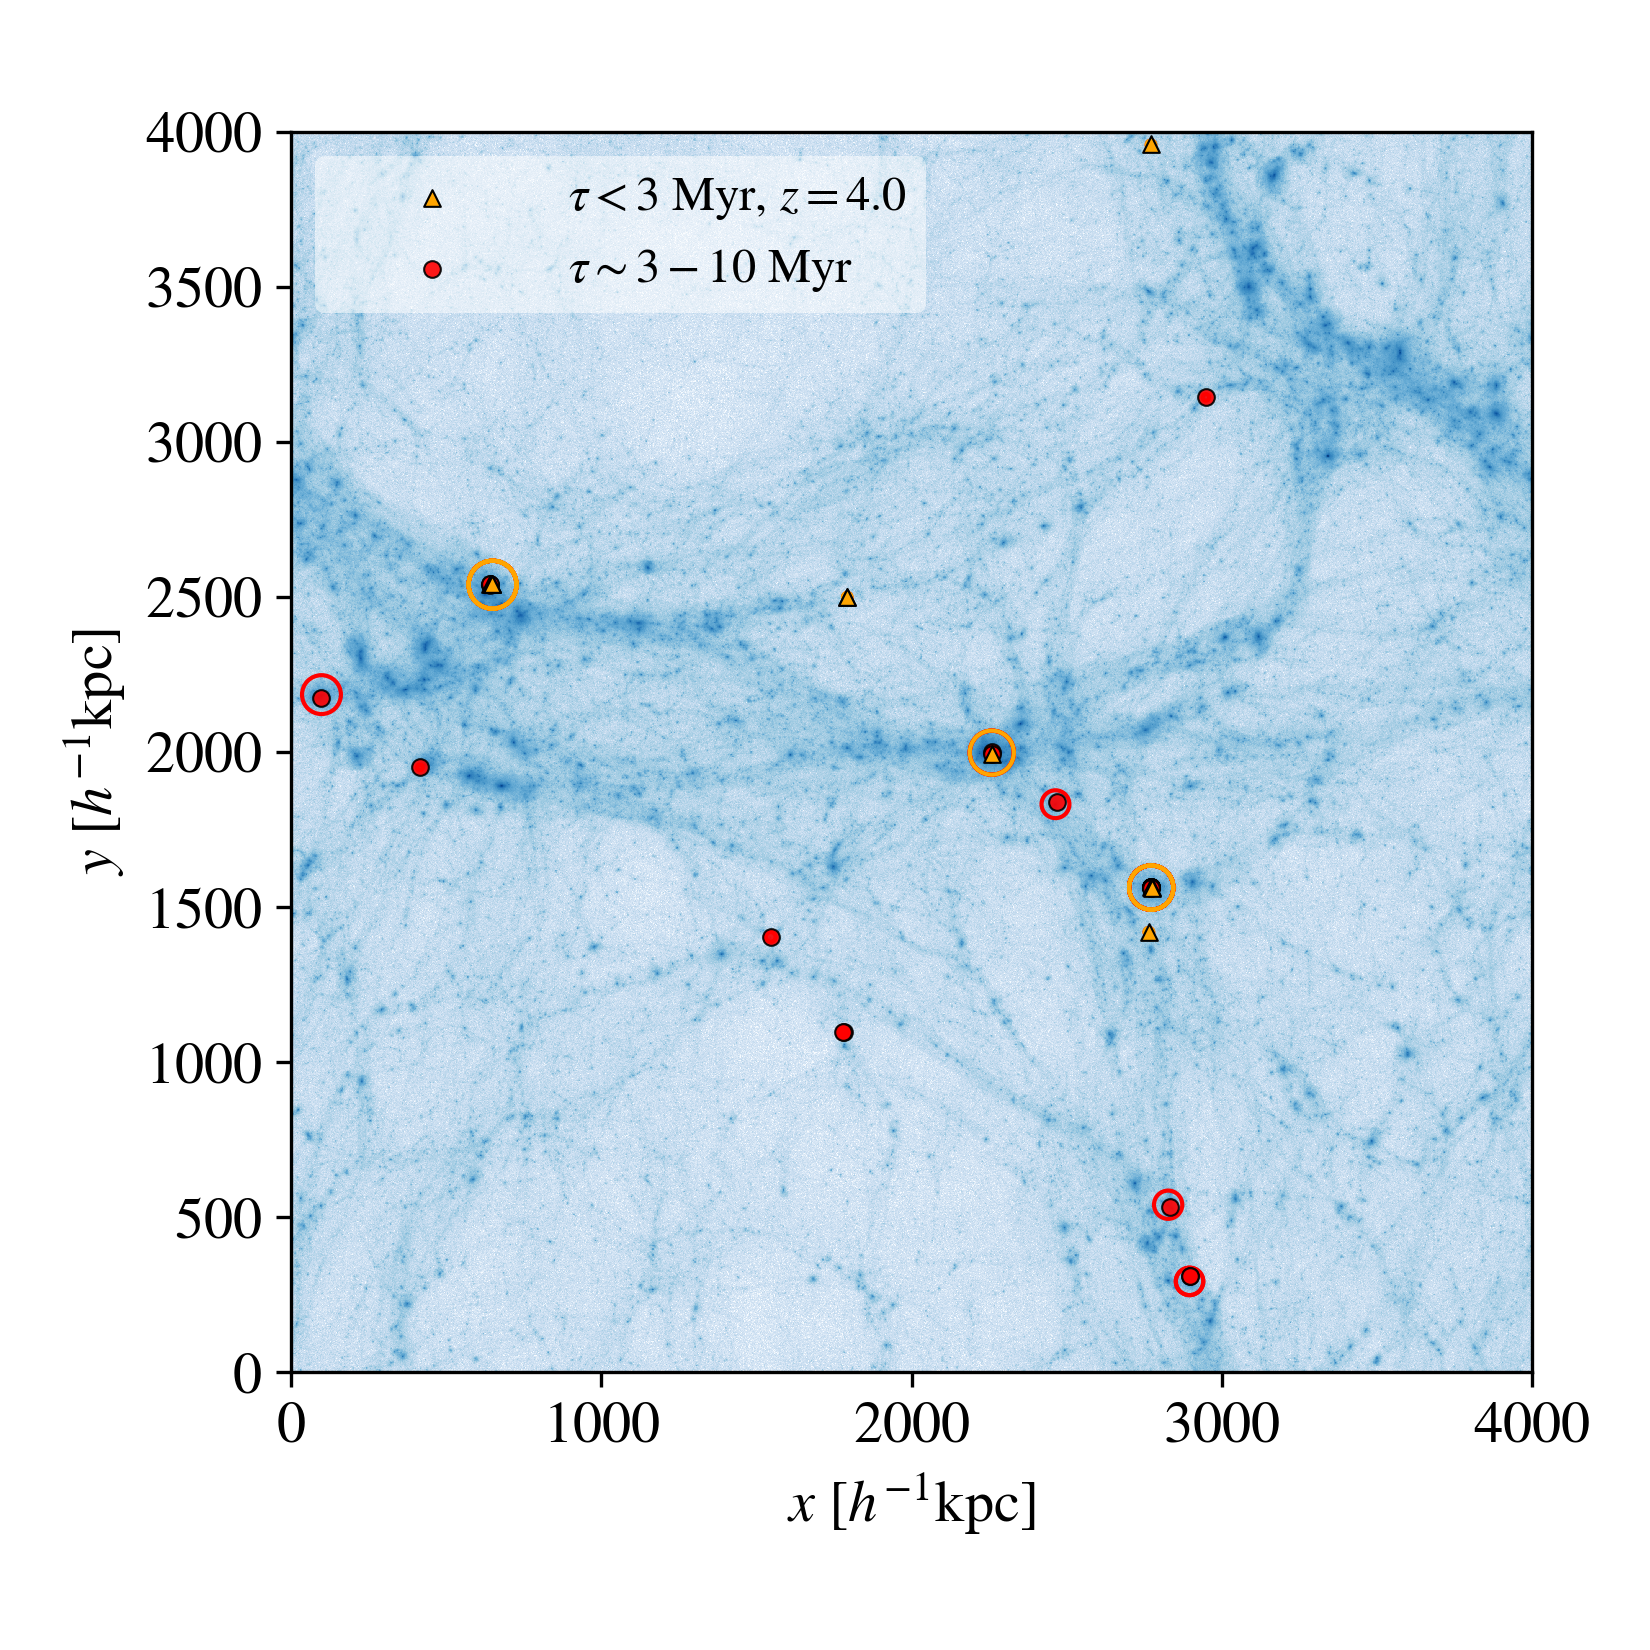
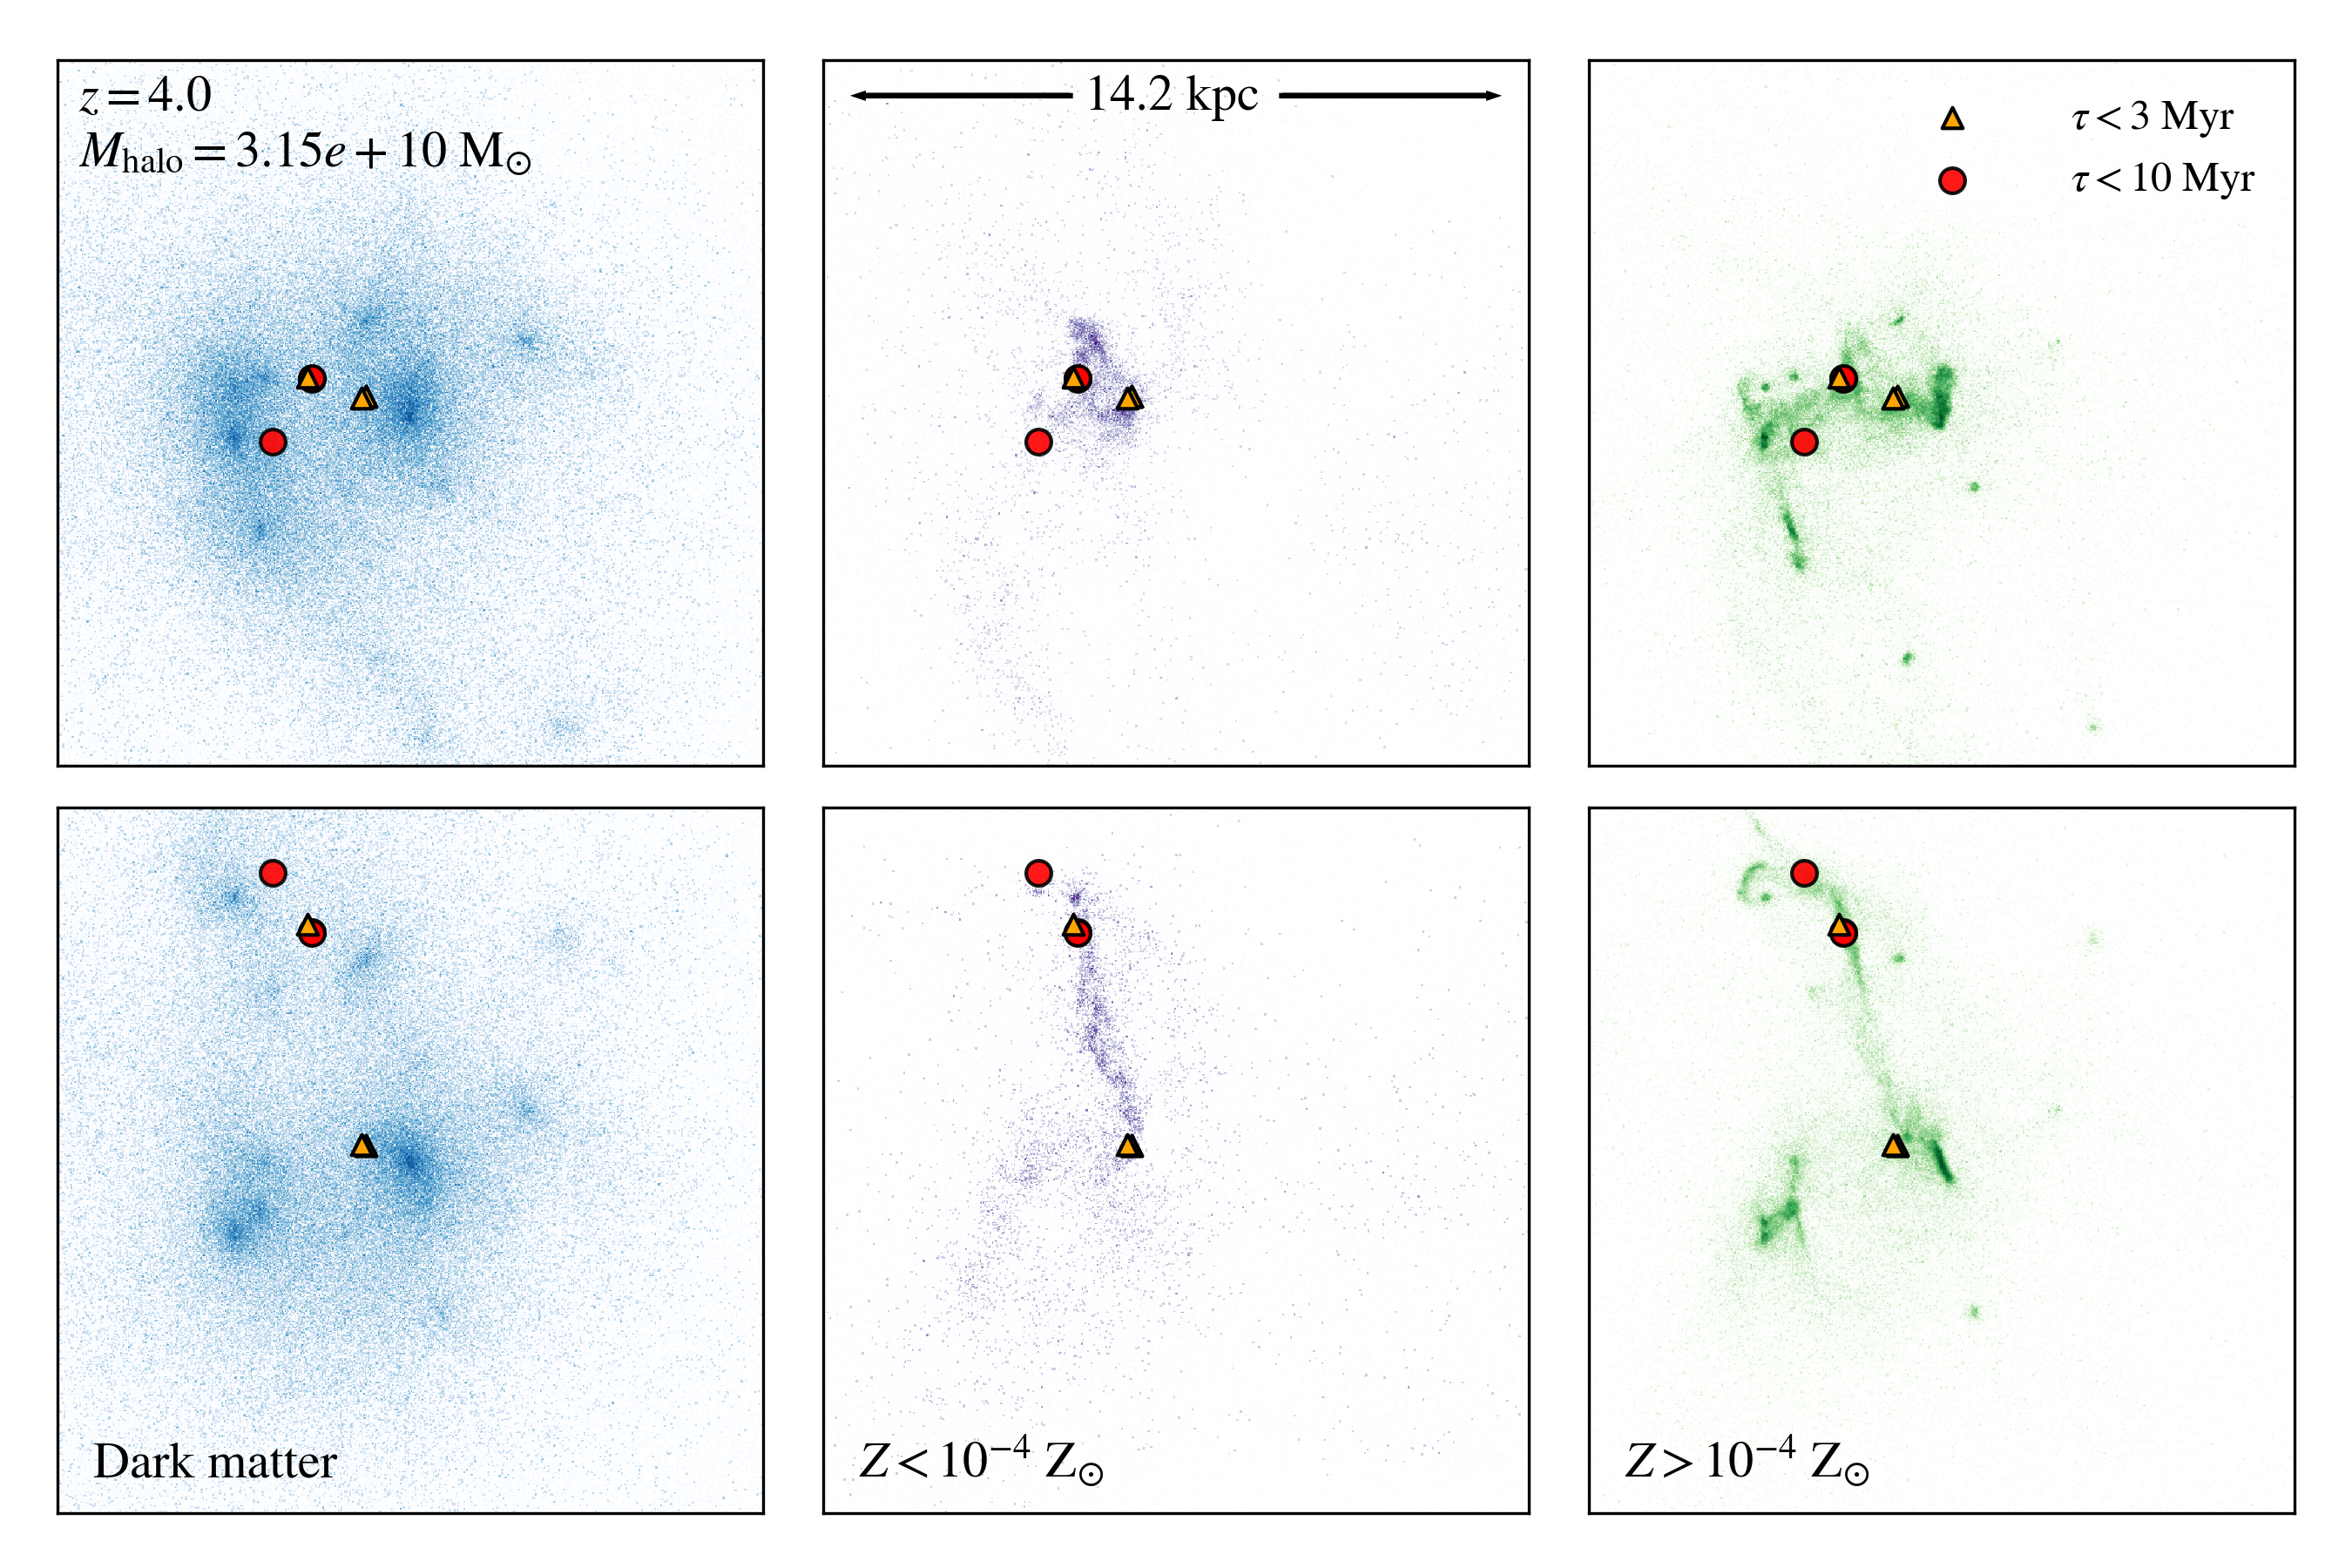
A fundamental question for Pop III star formation at late times is where Pop III stars could possibly continue to form. As an example, Fig. 6 shows the locations of (active) Pop III stellar particles with ages Myr and Myr, on top of the cosmic web in the last simulation snapshot at . We identify the host of a Pop III particle as the most massive halo that encloses the Pop III particle within its virial radius. Massive () host haloes of active Pop III star formation are also shown in Fig. 6, constituting 50% of the host halo population at , thus indicating that formation of Pop III stars in massive haloes is important. The reason is that metal mixing is inefficient in our simulation, such that metal-poor gas in dense filaments (i.e. cold accretion flows) can still form Pop III stars, even though the densest regions within the halo have been significantly enriched by previous SNe. This process is illustrated in Fig. 7, where (active) Pop III particles are plotted on top of the projected distributions of dark matter (left), metal-poor gas (, middle) and metal-enriched gas (, right), for one of the most massive haloes at that host active Pop III stars with . This halo is still under assembly with a few (groups) of sub-haloes separated by a few (physical) kpc, where Pop III stars are formed on the edges of such sub-structures. Actually, Pop III stars tend to form at the ‘connection points’ of (metal-enriched) sub-structures and dense filaments rich in metal-poor gas. This trend is consistent with the ‘Pop III wave’ scenario (Tornatore et al., 2007), which is also seen in previous simulations (e.g. Pallottini et al. 2014; Xu et al. 2016). Besides, recent work by Bennett & Sijacki (2020) found that inflows of cold dense gas are significantly enhanced with better resolution of shocks, leading to metal-poor star formation in primordial filaments, for even more massive haloes ().
To characterize the host haloes of Pop III stars after reionization (), we combine 4 snapshots at , 4.5, 5 and to construct a sample of 145 (52) haloes that have recent Pop III star formation within 10 (3) Myr (the representative sample, henceforth). As mentioned in Sec. 3.1, and to be further discussed below, reionization feedback is not well captured in our simulation, while the effect of LW feedback is treated more realistically. Therefore, the representative sample from our simulation effectively corresponds to the case under a moderate LW background, but without reionization feedback. In the next subsection, additional corrections are made to fully take into account the effect of reionization.
We divide the Pop III host haloes into three groups, based on the atomic cooling threshold and the (dark matter+baryonic) Jeans mass of fully ionized gas
| (7) |
where is the overdensity and the temperature of ionized gas. We use the Jeans mass (Equ. 7) to approximate the halo mass threshold below which star formation is significantly suppressed due to reionization (i.e. the filtering mass, Gnedin 2000). We adopt and K in accordance with more complex calculations and simulations (Pawlik et al., 2015; Pawlik et al., 2017; Benitez-Llambay & Frenk, 2020; Hutter et al., 2020). For simplicity, we evaluate , at , and apply , to the entire representative sample at .
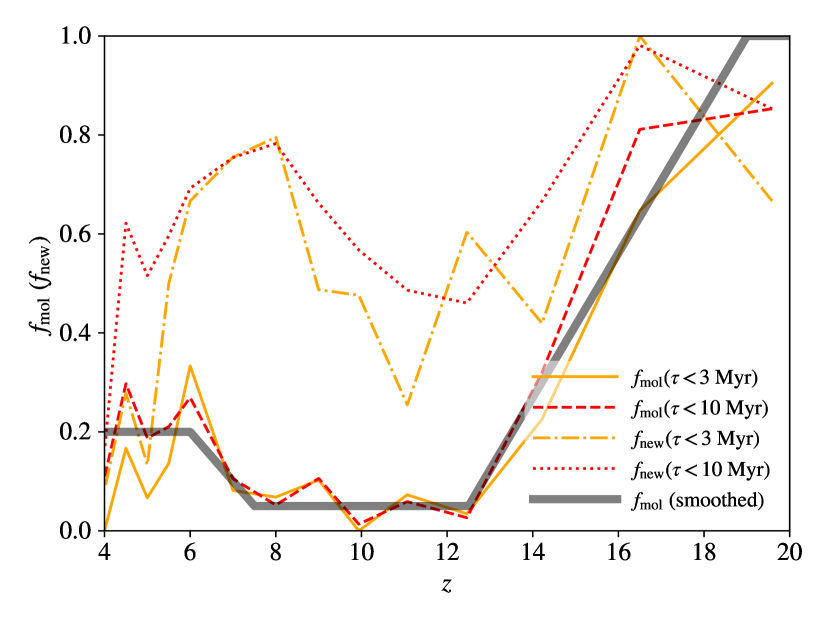
The first group refers to the ‘classical’ formation sites of Pop III stars with , the minihaloes, where molecular (hydrogen) cooling dominates, and which are particularly important at high-. This group itself is interesting, as it reflects how feedback regulates Pop III star formation. In Fig. 8, we plot the fraction of active Pop III stars in molecular cooling haloes, , in comparison with the fraction of newly star-forming haloes555A halo with active Pop III stars is called a newly star-forming halo, if it has not experienced any star formation activities prior to the recent Pop III star formation. , , for (i.e. isolated Pop III star formation). In general, , especially for , which indicates that at lower redshifts, the majority of isolated Pop III star formation occurs in atomic cooling haloes. drops from close to 1 to a few percent when decreases from to , resulting from the suppression/delay of star formation in molecular cooling haloes by LW radiation. Actually, anti-correlates with the background LW intensity , shown in the left panel of Fig. 1. For instance, remains a few percent at when is above the ‘critical’ value (). Similar trends are also seen in the recent simulation of Skinner & Wise 2020 (see their fig. 5). Both and decrease rapidly at , where reionization starts to take effect. This is later than expected, for the reason explained in Sec. 3.1. In the next subsection, for the purpose of post-processing, we use a smoothed version of , assuming that at , which again reflects the case under a moderate LW background (), but without reionization feedback.
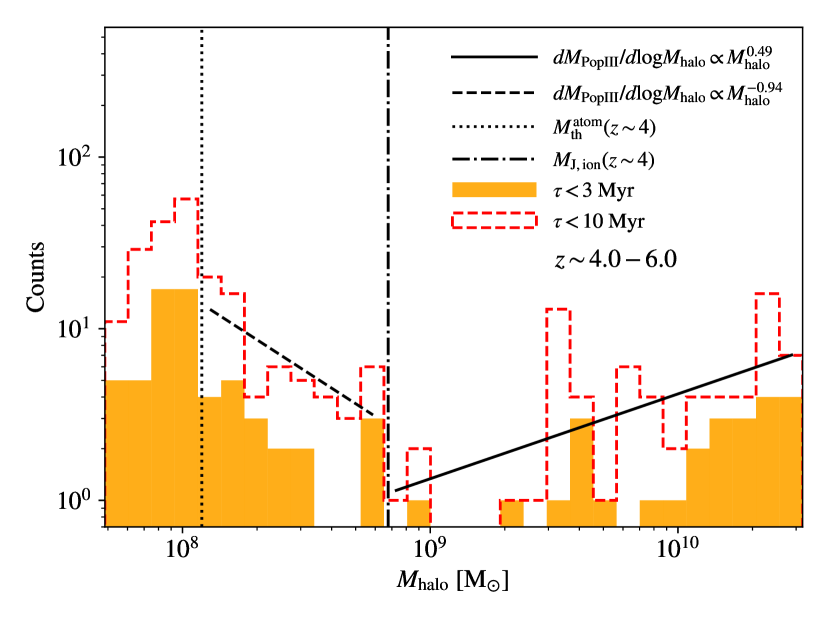
The other two groups refer to haloes with and . The former, together with molecular cooling haloes, is not expected to form stars after reionization. Therefore, their contributions to the Pop III SFRD are removed for the Pop III SFRD models in the next subsection. To evaluate the relative importance of the three groups, we plot the halo mass distribution of the representative sample in Fig. 9, where haloes are weighted by enclosed mass of active Pop III stars, , such that the distribution is proportional to . It turns out that the ratio of the contributions from the three groups to Pop III star formation is approximately 2 : 1 : 1. Besides, the distribution at can be approximated with a power-law of index (solid), while that at can be described by another power-law with .
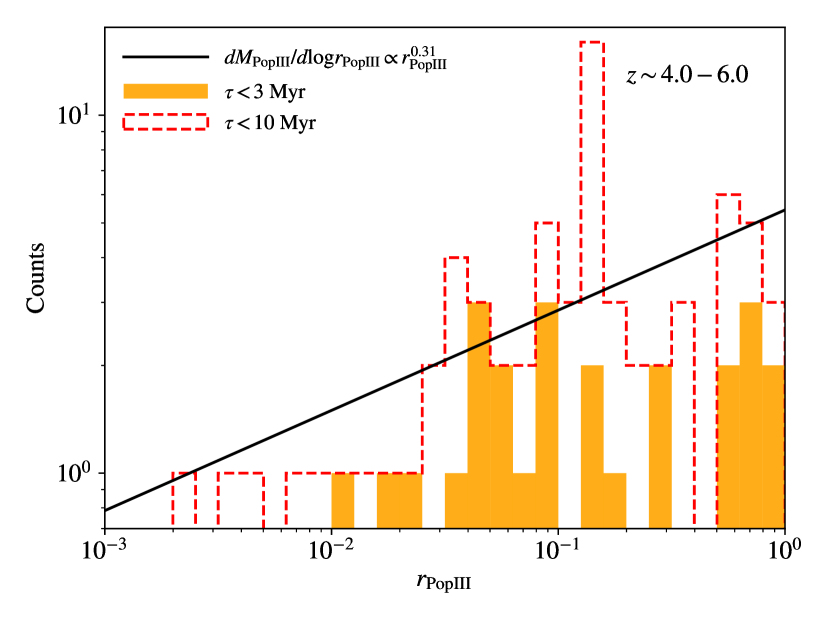
Besides the host mass, another crucial property of late-time Pop III star formation is the distribution of Pop III stars in their host haloes. We define the relative distance, , from an active Pop III particle to the halo center as the ratio of the physical distance to the virial radius , i.e. . The distribution of is shown in Fig. 10 for the active Pop III particles in haloes with from the representative sample. This distribution, i.e. , given the density profile of Pop III stars, , can be approximated with a power-law of index . The result for all atomic cooling haloes () is similar. This indicates that the (quasi-natal) distribution of Pop III stars is less concentrated than that of Pop II/I stars and dark matter (with and , i.e. , at the outskirts). About half (47-61%) of the Pop III particles occur at the outskirts of haloes (), consistent with the ‘Pop III wave’ theory (Tornatore et al., 2007). However, a few percent of Pop III particles with ages Myr are still found in halo centers (), which are expected to be polluted by metals. One explanation is that for haloes during assembly (mergers), the mass center of a halo as a whole may not be close to any sub-haloes with recent star formation activities (i.e. sources of metal enrichment), as shown in Fig. 7. Nevertheless, outflows driven by SN winds may have enriched the halo center (or even the entire halo) in reality, so that we may have overestimated Pop III star formation.
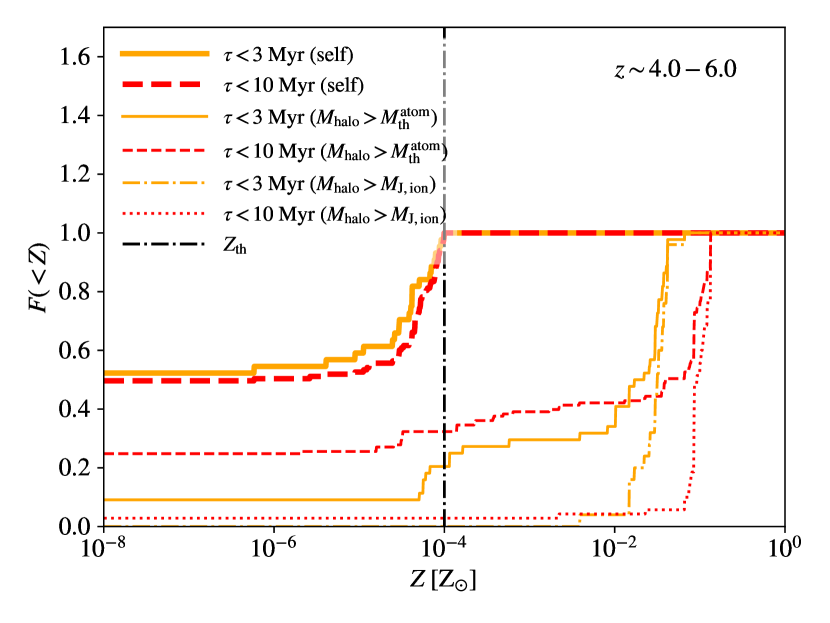
In light of this, we further look into the extreme case in which metals are fully mixed in the entire halo (i.e. within ) by measuring the mean (gas-phase and stellar) metallicities of Pop III host haloes in the representative sample. The cumulative distribution functions of the halo mean metallicities for different groups of haloes are shown in Fig. 11, together with the metallicities of active Pop III particles themselves. The latter is meant to explore the dependence of Pop III star formation on the critical metallicity () for the Pop III to Pop II/I transition. Atomic cooling haloes (, representative before reionization) and haloes above the filtering mass (, representative after reionization) are considered separately. To better capture the natal environments of Pop III stars, we focus on the gas-phase metallicity for haloes666For a Pop III particle, is the age of the underlying stellar population. For a halo with recent Pop III star formation, is the age of the youngest Pop III stellar particles within it. with Myr, but stellar metallicity for haloes with Myr. It is shown that if the Pop III mode is restricted to metal-free gas (equivalent to in our case), about 50% of Pop III star formation will be shifted to Pop II/I. If metals are fully mixed inside haloes and , % of Pop III star formation remains before reionization (for ), while only % remains after reionization (for ).
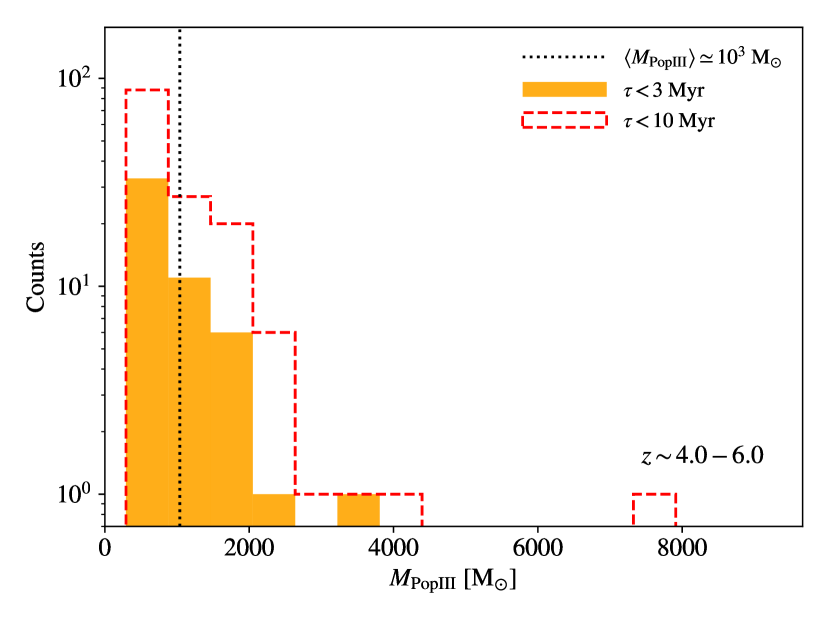
Finally, a parameter of particular importance for direct detection of Pop III stars is the total mass of active Pop III stars per halo. This parameter is the product of the ‘quantum’ of Pop III star formation, i.e. the typical Pop III stellar mass formed per local (cloud-scale) star formation event, and the number of Pop III star-forming clouds coexisting in a few Myr. Fig. 12 shows the distribution of for the entire representative sample. We find no clear correlation between and , such that the distribution remains similar when only haloes with are considered (i.e. after reionization). The average mass of active Pop III stars per halo is with large scatter. More than 50% of haloes only have one active Pop III particle (i.e. ), and less than 10% of haloes have , consistent with theoretical and observational upper limits of (Yajima & Khochfar, 2017; Bhatawdekar & Conselice, 2020)777Yajima & Khochfar (2017) derived from a semi-analytical model for the collapse of primordial gas under the effect of angular momentum loss via Lyman- (Ly) radiation drag and the gas accretion onto a galactic centre. The lack of evidence for Pop III dominated systems in the Hubble Frontier Fields at (Bhatawdekar & Conselice, 2020) implies , given a limiting rest-frame UV (absolute) AB magnitude (see Sec. 4.3 for the Pop III stellar population synthesis model adopted to derive from ).. Our results also (marginally) agree with a recently discovered strongly lensed Pop III candidate Lyman- (Ly) emitter at , which has (Vanzella et al., 2020), residing at the high mass end of our prediction. Note that the simulations of Xu et al. (2016); Skinner & Wise (2020) also find typically , while other simulations with lower resolution or different star formation routines predict higher values, e.g. (Pallottini et al., 2014; Sarmento et al., 2018). As the observational constraints are still weak/unclear, the total mass of active Pop III stars per halo/galaxy is uncertain, especially for massive haloes at late times (, ), depending on resolution and sub-grid models for star formation and stellar feedback, particularly chemical feedback from SNe.
4.2 Extrapolating Pop III star formation to the present day
Based on what is learned from the representative sample, we now extrapolate Pop III star formation to by introducing corrections to the fit of simulated Pop III SFRD (Equ. 6) for reionization and metal mixing. We decompose the Pop III SFRD into two components: one from molecular cooling haloes () and the other from atomic cooling haloes (). Both components are subject to reionization corrections, while we only consider additional metal mixing for the latter. Actually, in our simulation, most molecular cooling haloes only experience one episode of Pop III star formation before merging into more massive haloes888In the representative sample, % of molecular cooling haloes hosting active Pop III stars ( Myr) have not experienced any previous star formation (and internal enrichment)., such that internal enrichment is not important. Although external enrichment may play a role (Wise et al., 2014; Smith et al., 2015; Jeon et al., 2017), we neglect this effect for simplicity. Note that star formation in molecular cooling haloes is prohibited after reionization, and the contribution of molecular cooling haloes is only a few percent during reionization () due to strong LW feedback (see Fig. 8). We write the Pop III SFRD after such corrections as
| (8) |
where and are the terms for reionization correction, while captures the effect of additional metal mixing. The reionization terms are calculated with
| (9) |
where is derived from the simulation for , with . To be specific, we use a smoothed version of based on simulation data (see Fig. 8 and the left panel of Fig. 1), in which for with negligible LW feedback, for under a strong LW background (), for under a moderate LW background (), and these three plateaus are connected with two linear functions of . Within each component , is the fraction of Pop III star formation unaffected by reionization (i.e. in massive haloes ), and is that suppressed by reionization. Note that . We set and , based on the representative sample (see Fig. 9).
For (additional) metal mixing, is defined as the fraction of Pop III star formation remaining, when more sufficient metal mixing is considered than captured in our simulation:
| (10) | |||
| (11) |
where is the metal-poor fraction of potential Pop III forming gas as a function of halo virial radius and metal mixing radius , for a halo of mass at . In the second line (Equ. 11), we have assumed spherical symmetry and locate the halo center as the source of enrichment. We adopt and , corresponding to the mass range of haloes in our simulation, where is the critical mass for 2-sigma peaks. The weight function is written as , where and for , while and for . The power-law indices and normalization factors are derived from the simulated distribution of (active) Pop III mass in haloes, , as shown in Fig. 9. Note that the reionization effect has been absorbed into for low-mass haloes (). We use , based on the radius distribution of Pop III particles (Fig. 10). The metal mixing radius is estimated by tracking the halo growth history with the gravity-driven turbulent diffusion model based on Karlsson et al. (2008),
| (12) | ||||
| (13) | ||||
| (14) |
Here , and is an adjustable parameter that reflects the strength of metal mixing, in terms of how the turbulent diffusion coefficient depends on halo dynamics. Evidently, decreases with increasing . The onset of internal metal enrichment is derived by for . The halo growth history is obtained by solving for , which is the progenitor mass at of a halo at with mass . This is done by integrating the (average) halo growth rate formula from Fakhouri et al. (2010), which is derived from simulations for CDM cosmology:
| (15) |
In general, our model predicts that increases with increasing mass and increasing redshift .
We also consider a more simulation-based model, where the metal-poor fraction is expressed with
| (16) |
Here and are the fractions of metal-poor gas for Pop III star formation in atomic cooling haloes after and and before reionization. If metal mixing is actually efficient at the halo scale (), but not fully captured in our simulation, Pop III particles in haloes with (mass-weighted) mean metallicities above should be removed. This pessimistic case can be evaluated with the distributions of halo mean metallicities for Pop III host haloes, as shown in Fig. 11 for the representative sample. As an upper limit, we use and , given a critical metallicity , based on the halo stellar metallicity distributions of Pop III particles with ages Myr, in all atomic cooling haloes (, before reionization) and only massive haloes above the Jeans mass of ionized gas (, after reionization).
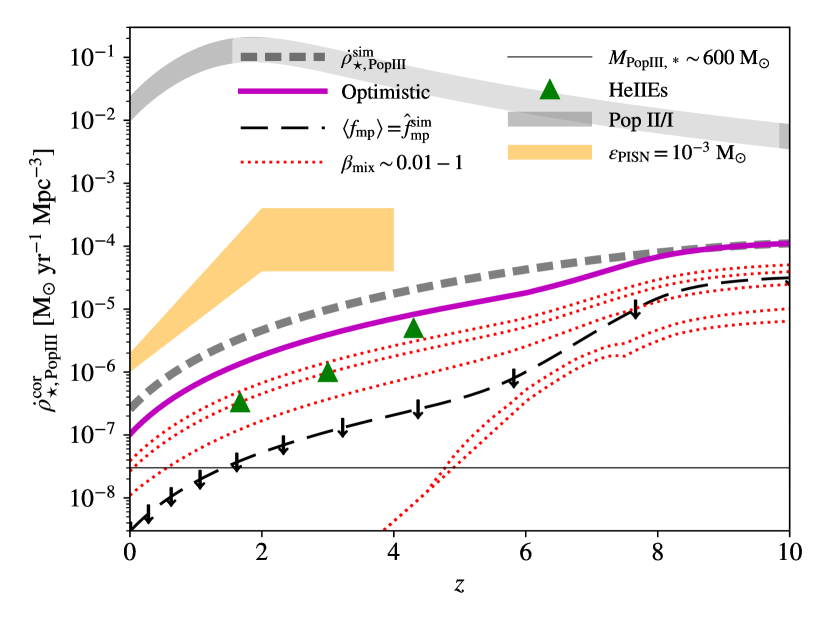
Finally, examples of the Pop III SFRD models with the above reionization and metal-mixing corrections, , are shown in Fig. 13, on top of observational constraints and the Pop II/I counterpart (Madau & Dickinson, 2014). We consider the upper bounds on Pop III SFRD ( at and at ), inferred from the observed rate densities of super-luminous SNe (as PISN candidates, see Gal-Yam 2012; Cooke et al. 2012), assuming a Pop III PISN efficiency of (for typical top-heavy IMFs). Our model SFRDs are always lower than these upper bounds (by at least a factor of 10), even for the optimistic case with . We also plot the Pop III SFRD values, inferred from observations of narrow He ii line emitters as candidates of Pop III systems (Nagao et al., 2008; Prescott et al., 2009; Cassata et al., 2013), which are generally lower (by up to a factor of 4) than the optimistic model () and approximately correspond to the metal mixing models with . Note that such observational constraints are highly sensitive to the Pop III IMF, escape fraction of ionizing photons and potential selection effects.
4.3 Termination of Pop III star formation
The precise definition of what it means to terminate Pop III star formation is non-trivial, in the absence of abrupt cut-offs in the Pop III SFRD, akin to a cosmic phase transition such as reionization. Our theoretical models here indeed do not exhibit any precipitous drop, and are instead characterized by a more gradual tapering off. We first consider a physically motivated definition based on the average Pop III star formation rate999With the SFR formula (Equ. 17), our models (see Fig. 13) can predict the average formation rate of Pop III stars in a present-day halo of a mass similar to that of the Milky Way halo (). The result for the optimistic model () is . Given , this average SFR implies that the probability of such a halo to have recent Pop III star formation (within 3 Myr) is , which serves as a rough estimation for the Milky Way. More accurate estimation for the chance of finding active Pop III stars in the real Milky Way halo needs to consider the detailed assembly history and metal mixing process. (SFR) for a halo of mass at , given a Pop III SFRD :
| (17) |
where is the halo mass function (calculated by Murray et al. 2013), , and refer to the weight function and mass range of Pop III hosts (see Equ. 10 and the description thereafter), which embodies the distribution of Pop III mass in haloes, i.e. (see Fig. 9).
We then focus on a typical halo at with a mass and define the ‘critical’ Pop III SFRD as the one required to form one typical/minimum Pop III star cluster with in one dynamical timescale . This leads to . Finally, the termination of Pop III star formation is defined via . In our case, Pop III star formation will be terminated at with complete halo-scale metal mixing (i.e. , achieved with ). For the simulation-based pessimistic model (i.e. , see Equ. 16), Pop III star formation ends at , which approximately corresponds to the case of . While for inefficient metal mixing with , there is no termination at , according to this definition.
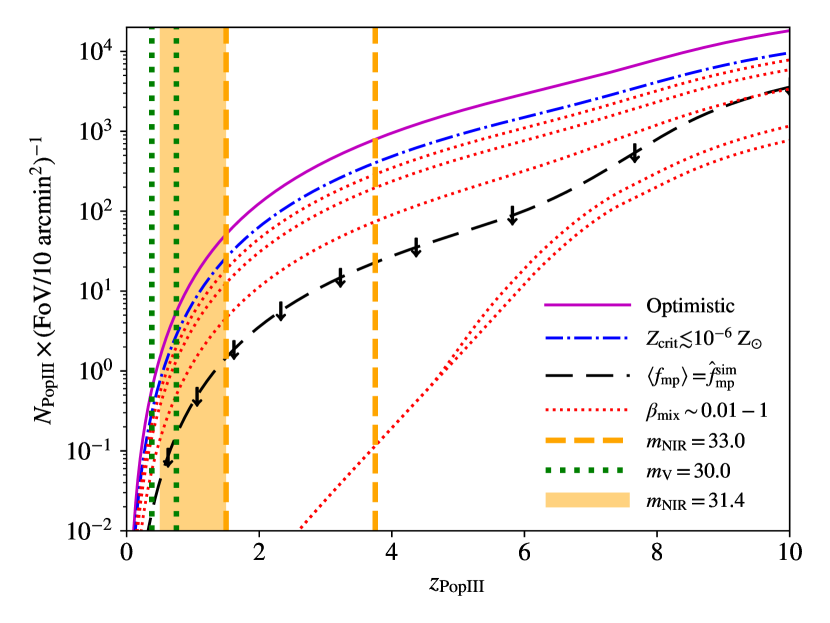
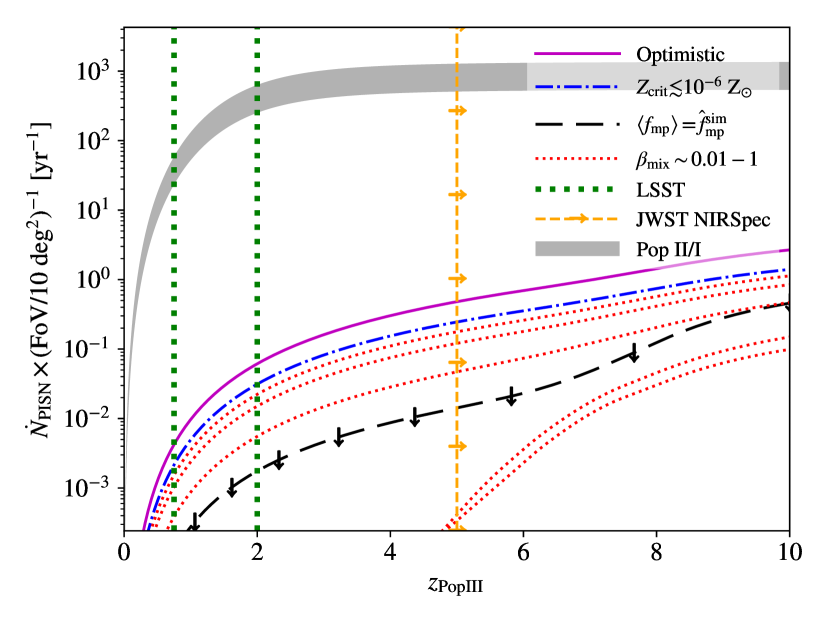
We can also consider the termination of Pop III star formation from the observational perspective. Given the host properties and Pop III SFRD models in Sec. 4.1 and 4.2, we can now predict the detection rates of Pop III stars and their PISNe as functions of the horizon redshift , as shown in Fig. 14. Here, we adopt a field of view (FoV, i.e. survey area) of for direct observation of Pop III stars, which is relevant to JWST and Hubble deep-field campaigns, and for detection of Pop III PISNe, achievable with the Vera C. Rubin Observatory, specifically its Legacy Survey of Space and Time (LSST).
In the optimistic case, where metal mixing is inefficient (, ), direct detection of Pop III systems would reach for , and up to 2000 per for , assuming that all Pop III stars are grouped into systems of . However, as the simulated Pop III systems are not massive (), we infer for the Hubble Space Telescope (HST) and JWST, leading to a detection rate per even in the optimistic case. Here, in the calculation of , we consider the HST WFC3 filter F555W with a limiting (AB) magnitude of 30 (for in a 10-hour exposure), and the JWST NIRCam filter F150W with a limiting magnitude of 31.4. Optimistic magnitudes for Pop III stellar systems are derived with the Stellar Population Synthesis (SPS) code yggdrasil101010https://www.astro.uu.se/~ez/yggdrasil/yggdrasil.html (Zackrisson et al., 2011), under their (instantaneous-burst) Pop III.1 model (with an extremely top-heavy Salpeter IMF in the range of ) based on Schaerer (2002), and optimal parameters for nebular emission and Ly transmission (i.e. , ).
Using their Pop III.2 model with a moderately top-heavy IMF from Raiter et al. (2010) will reduce the flux by a factor of 3. If lensing pushes the limiting magnitude to 33, we can reach with JWST, where up dozens of Pop III host systems will reside in one , but the fraction of lensed systems may still be too low for promising detection. For the Wide Field Infrared Survey Telescope (WFIRST), given a sensitivity similar to that of HST in the optical and a large FoV of , one exposure of 10 hours can detect Pop III systems with (for the R062 filter) at in the optimistic case. However, in the pessmimistic model with halo-scale metal mixing of simulated haloes (i.e. ), the detection rate will be reduced by a factor of 30. Furthermore, as discussed below, it is non-trivial to identify Pop III host systems at such low redshifts when Pop II/I star formation is dominating and prevalent. This is particularly challenging at low redshifts (), where no powerful instrument currently exists in the rest-frame UV to search for distinct features of Pop III (e.g. bluer spectra and He ii emission lines).
Beside direct observation of active Pop III stars themselves, detection of Pop III PISNe is another important channel to probe late-time Pop III star formation (Scannapieco et al., 2005). However, we find that the scarcity of Pop III stars remains the main obstacle to detection of their PISNe, as seen in previous studies (e.g. Hummel et al. (2012)). Even for a FoV as large as , the detection rate only reaches 1 per year at in the optimistic model. While the estimated horizon redshift is for LSST111111The range of for LSST reflects the uncertainty in how PISN blast waves interact with the circumstellar medium (Nicholl et al., 2020)., and that for JWST NIRSpec () is , based on the properties of the recently discovered PISN candidate SN2016aps (Nicholl et al., 2020). For LSST, in the optimistic case with , where all Pop III PISNe are massive interacting events similar to SN2016aps (Nicholl et al., 2020) and luminous for long ( yr), a survey area of is required to detect one Pop III PISN. For JWST, although it can reach , it cannot afford a large survey area. For instance, the FoV considered by the First Lights at REionization (FLARE) project is only , such that detection of Pop III PISNe is unlikely to be achieved in a survey time of a few years (Wang et al., 2017; Regős et al., 2020). In our calculation of the PISN rates, we assume a Pop III PISN efficiency for typical top-heavy Pop III IMFs. We adopt for Pop II/I as an optimal estimation, based on a Salpeter IMF from 0.1 to 200 , neglecting mass loss from stellar winds. Given such assumptions and the Pop II/I SFRD from Madau & Dickinson (2014), we find that the Pop III contribution to the total PISN rate remains below at . Tuning the Pop III IMF and normalization of the Pop III SFRD within observational constraints (e.g. Visbal et al. 2015; Inayoshi et al. 2016) can enhance the Pop III PISN rate by at most a factor of 30, such that the dominance of Pop II/I remains, unless the (average) PISN efficiency for Pop II/I stars is much lower in reality than our optimal estimation. Note that the PISN efficiency is highly sensitive to the upper mass limit of a stellar population, which is still uncertain, especially for Pop III and II stars with low metallicities. For metal-enriched stars (Pop II/I), strong stellar winds may drive the upper mass limit below the PISN threshold. In that case, only Pop III would contribute to the PISN rate.
In general, our results indicate that detection of Pop III stars and PISNe in the post-reionization epoch is extremely challenging, even for the optimistic model with continuous Pop III star formation at a rate down to . Actually, this prospect will be rendered even more difficult, if we further consider the fact that most Pop III stars formed at late times () would reside in massive systems, where (young massive) Pop II/I stars are also present. As long as , any galaxy with a Pop II/I SFR in the past 10 Myr or a total stellar mass will be dominated by the light from Pop II/I stars, even if it has experienced recent Pop III star formation. In other words, the active Pop III to total stellar mass ratio must be above for the Pop III to Pop II/I flux ratio to exceed one (). We regard such systems as Pop III-bright121212We also use Yggdrasil to derive the magnitudes of Pop II/I stars, with a Kroupa IMF in the range of , a metallicity and a constant SFR over 10 Myr, based on the Starburst99 Padova-AGB tracks (Leitherer et al., 1999; Vázquez & Leitherer, 2005). Again, optimal parameters for nebular emission and Ly transmission are adopted (i.e. , )..
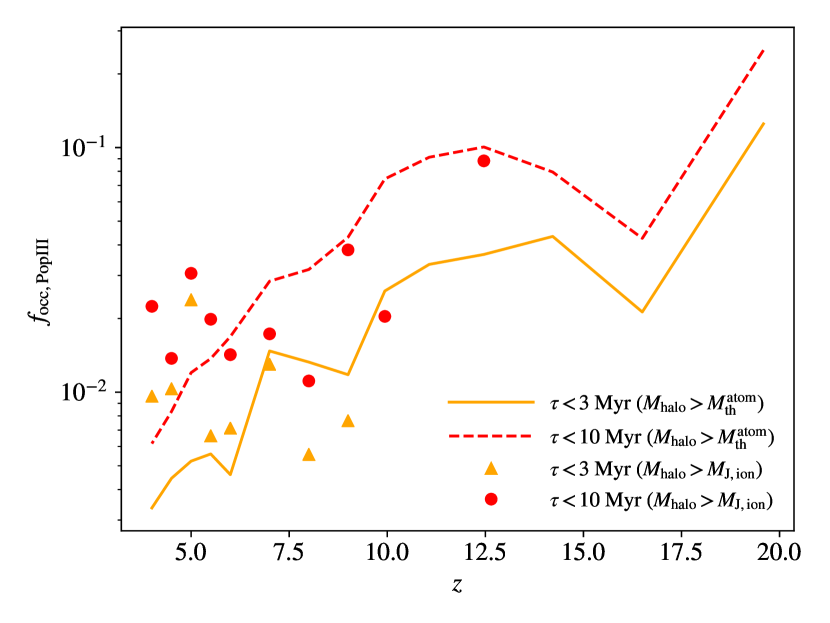
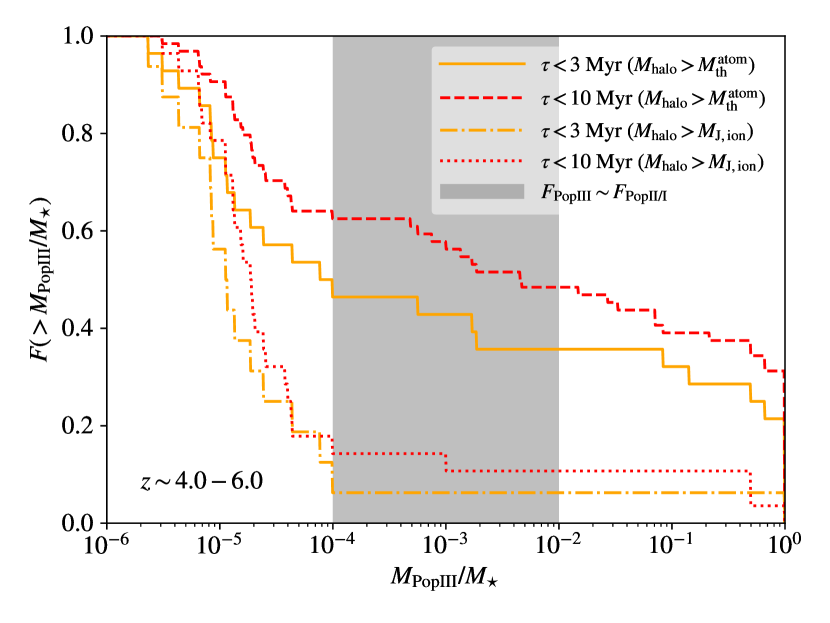
In Fig. 15, we explore the probability of identifying Pop III-bright systems in dwarf galaxies () by considering the occupation fraction of Pop III hosts in star forming galaxies (left), and the cumulative distribution function of the active Pop III to total stellar mass ratio (right), for the representative sample. Before reionization (), (10)% of all atomic cooling haloes have recent Pop III activities within 3 (10) Myr. However, after reionization (), only (2)% percent of star-forming haloes with host active Pop III stars for (10) Myr, and the occupation fraction will decrease with decreasing redshift, similar to the trend in Pop III SFRD. Moreover, given the Pop III-bright criterion , % of the atomic cooling haloes with recent Pop III star formation are Pop III-bright, while only % of Pop III host haloes with are Pop III-bright131313Note that our simulation is limited in volume such that only dwarf galaxies () at are considered in this analysis. The fraction of Pop III-bright systems is expected to be lower at lower redshifts, where more massive galaxies will be the (potential) hosts of Pop III stars. Such massive galaxies are more likely have dominant Pop II/I components, where feedback from the central massive black holes can also regulate Pop III star formation.. As a result, Pop II/I stars will dominate in most () massive haloes () after reionization (), according to the star formation main sequence and assembly histories of such haloes (Pawlik et al., 2013; Sparre et al., 2015; Yajima et al., 2017), whereas before reionization (), % of all dwarf galaxies in atomic cooling haloes will be Pop III-bright.
However, given , such galaxies must form less than Pop II/I stars within 10 Myr, such that they cannot be reached by JWST at . Nevertheless, as mentioned in Sec. 4.2, the total mass of active Pop III stars per halo/galaxy itself is still uncertain, which depends on resolution and the sub-grid models for star formation and stellar feedback, particularly chemical feedback from SNe. In the optimal case where , Pop III-bright galaxies would be detectable by JWST (HST/WFIRST) up to . We thus arrive at the conclusion that right before reionization () is the optimal epoch to search for Pop III-bright systems, consistent with Sarmento et al. (2018), which predict a Pop III-bright141414Note that Sarmento et al. (2018) adopts a more strict definition for ‘Pop III-bright’ as . Therefore, the values quoted here should be regarded as lower limits for our definition (). fraction of % at . In this way, our optimistic Pop III SFRD model predicts that JWST (HST/WFIRST) is able to find (0.1) such Pop III-bright systems per . Again, in more realistic models with enhanced metal mixing, those detection rates would be significantly suppressed.
5 Summary and Conclusions
We construct a theoretical framework to study Pop III star formation in the post-reionization epoch () by combining cosmological simulation data with semi-analytical models. To be specific, we closely look into a representative sample of haloes hosting active Pop III stars at from a cosmological simulation in LB20 (Sec. 2 and 4.1). Based on this, we extrapolate the Pop III SFRD to with additional semi-analytical modelling of turbulent metal mixing and reionization (Sec. 4.2), which may not be fully captured in the simulation. In this way, we evaluate the key physical processes that shape Pop III star formation at late times and the corresponding observational prospects (Sec. 4.3). Although many of these processes are currently not well understood, future theoretical and observational efforts will reduce the uncertainties and shed light on the fundamental question of the termination of Pop III star formation. Our main findings are summarized below.
-
•
Both radiative and chemical feedback play important roles in regulating Pop III star formation. The former, in terms of LW feedback and reionization, shifts (potential) Pop III star formation to massive haloes (i.e. atomic cooling haloes and haloes above the filtering mass, ). The latter, in terms of mixing of metals released from SNe into the interstellar/circumgalactic medium (ISM/CGM), then determines whether Pop III star formation is possible or not in such massive haloes, which is particularly important in the post-reionization epoch.
In our optimistic model (without additional metal mixing beyond that captured by the simulation), the contribution of minihaloes (i.e. the ‘classical’ site of Pop III star formation) to the overall Pop III SFRD drops to a few percent at due to LW feedback (see Fig. 8), and decreases exponentially with redshift (to at ) after reionization (). Late-time Pop III star formation is dominated by massive haloes (), where the densest regions have been significantly metal enriched, but pockets of dense metal-poor gas (e.g. in cold accretion flows) may still exist to form Pop III stars due to inefficient metal mixing (see Fig. 7), consistent with the ‘Pop III wave’ theory (Tornatore et al., 2007).
However, limited by resolution, treatments of metal mixing are imperfect in cosmological simulations, such that metal mixing can be more efficient in reality than in our optimistic model (see Sec. 3.2 for details). For instance, if we assume that metals are fully mixed within the halo virial radius, the Pop III SFRD would be reduced by more than a factor of 30 at .
-
•
Next to the global Pop III SFRD, the metal mixing process is also important for another key parameter, the total mass, , of active Pop III stars per host halo. Note that we here focus on active Pop III stars, and the relevant timescale is short (a few Myr) by nature, such that the signals of short-lived massive Pop III stars can add up in observation. Therefore, is equivalent to the (instantaneous) Pop III SFR measured at a timescale of a few Myr. In general, is the product of the ‘quantum’ of Pop III star formation, i.e. the typical Pop III stellar mass formed per local (cloud-scale) star formation event, and the number of dense () metal-poor () star-forming gas clouds in the ISM/CGM of a halo, coexisting on a timescale of a few Myr. The former is well constrained to for CDM151515The picture can be different for other dark matter models (see e.g. Gao & Theuns 2007; Hirano et al. 2017). by high-resolution simulations and constraints from the timing of the global 21-cm absorption signal (Stacy & Bromm, 2013; Susa et al., 2014; Machida & Nakamura, 2015; Stacy et al., 2016; Hirano & Bromm, 2017; Schauer et al., 2019a; Sugimura et al., 2020). While the latter is highly sensitive to the metal mixing process.
Therefore, in CDM, reflects the number of newly-formed Pop III star clusters in a halo. In our simulation, we find that only a few Pop III clusters can be formed within a few Myr per halo, i.e. and the average is (see Fig. 12). Interestingly, we also find that is independent of halo mass and total stellar mass, quite different from the case of Pop II/I stars where SFR is correlated with stellar mass (i.e. the star formation main sequence). This further indicates the importance of metal mixing for Pop III star formation.
-
•
The total mass is particularly important for direct detection of Pop III stars. For instance, if , as shown in our simulation, direct detection of Pop III stars is only possible at very low redshifts (), considering the sensitivities of space telescopes at present or in the near future (e.g. HST, JWST and WFIRST). If Pop III star formation were to extend to such low redshifts, as predicted by our optimistic model, WFIRST, with its large FoV, could detect galaxies with active Pop III stars in one exposure of 10 hours. However, as long as , only the faintest hosts of Pop III stars can be identified as Pop III-bright (where the Pop III flux exceeds that of Pop II/I), while the emission from the majority (%) of luminous hosts will be dominated by Pop II/I stars, unless we observe in the rest-frame UV. Unfortunately, no powerful UV instrument currently exists to search for distinct features of Pop III (e.g. bluer spectra and He ii emission lines) in the rest-frame UV at such low redshifts. Detection of Pop III-bright systems would still be challenging for WFIRST.
Nevertheless, as metal mixing is not well understood, is still uncertain (see Xu et al. 2016; Skinner & Wise 2020; Pallottini et al. 2014; Sarmento et al. 2018). Our value lies at the lower end, while the upper limit is , derived from theoretical calculations of collapsing primordial gas (Yajima & Khochfar, 2017) and the recent non-detection of Pop III features in the Hubble Frontier Fields at (Bhatawdekar & Conselice, 2020). If metal-mixing is overestimated in our simulation and in reality, Pop III-bright galaxies will be detectable by JWST (HST/WFIRST) up to . In this way, our optimistic Pop III SFRD model predicts that JWST (HST/WFIRST) is able to find up to (0.1) Pop III-bright systems per .
-
•
Finally, our simulations, similar to previous cosmological simulations (Wise et al., 2011; Johnson et al., 2013; Pallottini et al., 2014; Xu et al., 2016), predicts that the overall volume-filling fraction of metal-enriched gas is only a few percent when the universe has expanded to 10-20% of its current size. As it is more difficult to enrich large volumes of gas when the Universe expands further, such simulation results imply that the majority (%) of the IGM in the observable Universe is occupied by metal-free gas, likely at very low column-densities, undetectable by current instruments. Detecting and quantifying this metal-free phase of the IGM will constrain theoretical models of metal mixing and, therefore, late-time Pop III star formation. This is complemented by similar observations of metal-absorption lines at high redshifts, where bright gamma-ray burst afterglows could serve as background sources (Wang et al., 2012). Our semi-analytical modelling for gravity-driven turbulent metal mixing in virialized systems can be easily extended to describe IGM metal enrichment, governed by the same mixing strength parameter, (and additional parameters if necessary). Therefore, it is possible to directly relate late-time Pop III star formation to the volume-filling fraction of metal-free gas. We defer such exploration to future work.
When did Pop III star formation end? The current answer is uncertain. In the optimistic case, Pop III star formation would extend to at a low yet non-negligible rate of , while in the pessimistic case, Pop III star formation may already be terminated by the end of reionization (). To answer this fundamental question, we must better understand cosmic chemical evolution in terms of mixing of metals released by SNe into the ISM/CGM/IGM during structure formation. On the theory side, we need cosmological simulations with proper resolution and complete representations of the halo population (from minihaloes to galaxy clusters ) across the entire cosmic history, equipped with advanced sub-grid models for metal mixing and zoom-in simulation techniques (e.g. Pan et al. 2013; Hopkins 2017; Stopyra et al. 2020). For observations, stronger constraints will soon come from JWST and WFIRST for (potential) high- and low- sources, on both the overall Pop III SFRD and the typical total mass of active Pop III stars per halo. Gravitational wave observations of the binary black hole mergers originated from Pop III stars can also constrain the Pop III SFRD (e.g. Sesana et al. 2009; Kinugawa et al. 2014; Hartwig et al. 2016; Belczynski et al. 2017; Liu & Bromm 2020). Meanwhile, we advocate for new UV space telescopes to search for galaxies with distinct Pop III features in the rest-frame UV at low redshifts (), and programs designed to measure the volume-filling fraction of metal-free gas in the IGM.
Overall, many aspects regarding Pop III star formation are still uncertain, as discussed here via our framework. Nevertheless, with improved theoretical and observational efforts, particularly on the metal mixing process161616Metal mixing is also crucial for inferring the properties of Pop III stars from observations of extremely metal-poor stars in the local Universe, i.e. ‘stellar archaeology’ (e.g. Frebel & Norris 2015; Ji et al. 2015; Hartwig et al. 2015; Ishigaki et al. 2018; Magg et al. 2019, 2020)., we will arrive at a more complete picture of Pop III star formation, from onset to termination, thus further elucidating the most elusive population of stars.
Acknowledgements
The authors wish to thank María Emilia De Rossi for insightful discussion regarding stellar population synthesis models for Pop III stars, and acknowledge the Texas Advanced Computing Center (TACC) for providing HPC resources under XSEDE allocation TG-AST120024.
Data availability
The data underlying this article will be shared on reasonable request to the corresponding authors.
References
- Abel et al. (2002) Abel T., Bryan G. L., Norman M. L., 2002, Science, 295, 93
- Behroozi et al. (2012) Behroozi P. S., Wechsler R. H., Wu H.-Y., 2012, The Astrophysical Journal, 762, 109
- Belczynski et al. (2017) Belczynski K., Ryu T., Perna R., Berti E., Tanaka T. L., Bulik T., 2017, MNRAS, 471, 4702
- Benitez-Llambay & Frenk (2020) Benitez-Llambay A., Frenk C., 2020, arXiv preprint arXiv:2004.06124
- Bennett & Sijacki (2020) Bennett J. S., Sijacki D., 2020, arXiv e-prints, p. arXiv:2006.10058
- Bhatawdekar & Conselice (2020) Bhatawdekar R., Conselice C. J., 2020, arXiv e-prints, p. arXiv:2006.00013
- Bromm (2013) Bromm V., 2013, Rep. Prog. Phys., 76, 112901
- Bromm & Loeb (2003) Bromm V., Loeb A., 2003, Nature, 425, 812
- Bromm et al. (2002) Bromm V., Coppi P. S., Larson R. B., 2002, ApJ, 564, 23
- Cassata et al. (2013) Cassata P., et al., 2013, A&A, 556, A68
- Chatterjee et al. (2020) Chatterjee A., Dayal P., Choudhury T. R., Schneider R., 2020, MNRAS, 496, 1445
- Chen et al. (2020) Chen N., Doussot A., Trac H., Cen R., 2020, arXiv preprint arXiv:2004.07854
- Cooke et al. (2012) Cooke J., et al., 2012, Nature, 491, 228
- Dai & Xia (2020) Dai J.-P., Xia J.-Q., 2020, arXiv e-prints, p. arXiv:2004.11276
- Fakhouri et al. (2010) Fakhouri O., Ma C.-P., Boylan-Kolchin M., 2010, MNRAS, 406, 2267
- Faucher-Giguere et al. (2009) Faucher-Giguere C.-A., Lidz A., Zaldarriaga M., Hernquist L., 2009, ApJ, 703, 1416
- Fialkov (2014) Fialkov A., 2014, International Journal of Modern Physics D, 23, 1430017
- Finkelstein (2016) Finkelstein S. L., 2016, Publ. Astron. Soc. Australia, 33
- Frebel & Norris (2015) Frebel A., Norris J. E., 2015, ARA&A, 53, 631
- Gal-Yam (2012) Gal-Yam A., 2012, Science, 337, 927
- Galli & Palla (2013) Galli D., Palla F., 2013, ARA&A, 51, 163
- Gao & Theuns (2007) Gao L., Theuns T., 2007, Science, 317, 1527
- Gnedin (2000) Gnedin N. Y., 2000, ApJ, 542, 535
- Greif & Bromm (2006) Greif T. H., Bromm V., 2006, MNRAS, 373, 128
- Greif et al. (2010) Greif T. H., Glover S. C., Bromm V., Klessen R. S., 2010, ApJ, 716, 510
- Hahn & Abel (2011) Hahn O., Abel T., 2011, MNRAS, 415, 2101
- Hartwig et al. (2015) Hartwig T., Bromm V., Klessen R. S., Glover S. C. O., 2015, MNRAS, 447, 3892
- Hartwig et al. (2016) Hartwig T., Volonteri M., Bromm V., Klessen R. S., Barausse E., Magg M., Stacy A., 2016, MNRAS, 460, L74
- Hirano & Bromm (2017) Hirano S., Bromm V., 2017, MNRAS, 470, 898
- Hirano et al. (2015) Hirano S., Hosokawa T., Yoshida N., Omukai K., Yorke H. W., 2015, MNRAS, 448, 568
- Hirano et al. (2017) Hirano S., Sullivan J. M., Bromm V., 2017, MNRAS, 473, L6
- Hopkins (2015) Hopkins P. F., 2015, MNRAS, 450, 53
- Hopkins (2017) Hopkins P. F., 2017, MNRAS, 466, 3387
- Hummel et al. (2012) Hummel J. A., Pawlik A. H., Milosavljević M., Bromm V., 2012, ApJ, 755, 72
- Hutter et al. (2020) Hutter A., Dayal P., Yepes G., Gottlöber S., Legrand L., Ucci G., 2020, arXiv preprint arXiv:2004.08401
- Inayoshi et al. (2016) Inayoshi K., Kashiyama K., Visbal E., Haiman Z., 2016, MNRAS, 461, 2722
- Ishigaki et al. (2018) Ishigaki M. N., Tominaga N., Kobayashi C., Nomoto K., 2018, ApJ, 857, 46
- Jaacks et al. (2018) Jaacks J., Thompson R., Finkelstein S. L., Bromm V., 2018, MNRAS, 475, 4396
- Jaacks et al. (2019) Jaacks J., Finkelstein S. L., Bromm V., 2019, MNRAS, 488, 2202
- Jeon & Bromm (2019) Jeon M., Bromm V., 2019, MNRAS, 485, 5939
- Jeon et al. (2017) Jeon M., Besla G., Bromm V., 2017, ApJ, 848, 85
- Ji et al. (2015) Ji A. P., Frebel A., Bromm V., 2015, MNRAS, 454, 659
- Johnson & Bromm (2006) Johnson J. L., Bromm V., 2006, MNRAS, 366, 247
- Johnson et al. (2013) Johnson J. L., Dalla V. C., Khochfar S., 2013, MNRAS, 428, 1857
- Karlsson et al. (2008) Karlsson T., Johnson J. L., Bromm V., 2008, ApJ, 679, 6
- Karlsson et al. (2013) Karlsson T., Bromm V., Bland-Hawthorn J., 2013, Reviews of Modern Physics, 85, 809
- Kinugawa et al. (2014) Kinugawa T., Inayoshi K., Hotokezaka K., Nakauchi D., Nakamura T., 2014, MNRAS, 442, 2963
- Kirihara et al. (2020) Kirihara T., Hasegawa K., Umemura M., Mori M., Ishiyama T., 2020, MNRAS, 491, 4387
- Leitherer et al. (1999) Leitherer C., et al., 1999, ApJS, 123, 3
- Lewis (2008) Lewis A., 2008, Phys. Rev. D, 78, 023002
- Liu & Bromm (2018) Liu B., Bromm V., 2018, MNRAS, 476, 1826
- Liu & Bromm (2020) Liu B., Bromm V., 2020, MNRAS, 495, 2475
- Liu et al. (2019) Liu B., Jaacks J., Finkelstein S. L., Bromm V., 2019, MNRAS, 486, 3617
- Ma et al. (2016) Ma X., Hopkins P. F., Faucher-Giguère C.-A., Zolman N., Muratov A. L., Kereš D., Quataert E., 2016, MNRAS, 456, 2140
- Machacek et al. (2001) Machacek M. E., Bryan G. L., Abel T., 2001, ApJ, 548, 509
- Machida & Nakamura (2015) Machida M. N., Nakamura T., 2015, MNRAS, 448, 1405
- Madau & Dickinson (2014) Madau P., Dickinson M., 2014, ARA&A, 52, 415
- Magg et al. (2019) Magg M., Klessen R. S., Glover S. C., Li H., 2019, MNRAS, 487, 486
- Magg et al. (2020) Magg M., et al., 2020, arXiv e-prints, p. arXiv:2006.12517
- Maiolino et al. (2008) Maiolino R., et al., 2008, A&A, 488, 463
- Mebane et al. (2018) Mebane R. H., Mirocha J., Furlanetto S. R., 2018, MNRAS, 479, 4544
- Muratov et al. (2013) Muratov A. L., Gnedin O. Y., Gnedin N. Y., Zemp M., 2013, ApJ, 773, 19
- Murray et al. (2013) Murray S., Power C., Robotham A., 2013, Astronomy and Computing, 3, 23
- Nagao et al. (2008) Nagao T., et al., 2008, ApJ, 680, 100
- Nicholl et al. (2020) Nicholl M., et al., 2020, Nature,
- Nomoto et al. (2013) Nomoto K., Kobayashi C., Tominaga N., 2013, ARA&A, 51, 457
- O’Shea & Norman (2006) O’Shea B. W., Norman M. L., 2006, ApJ, 648, 31
- Omukai et al. (2005) Omukai K., Tsuribe T., Schneider R., Ferrara A., 2005, ApJ, 626, 627
- Paardekooper et al. (2015) Paardekooper J.-P., Khochfar S., Dalla Vecchia C., 2015, MNRAS, 451, 2544
- Pallottini et al. (2014) Pallottini A., Ferrara A., Gallerani S., Salvadori S., D’Odorico V., 2014, MNRAS, 440, 2498
- Pan et al. (2013) Pan L., Scannapieco E., Scalo J., 2013, ApJ, 775, 111
- Pawlik et al. (2013) Pawlik A. H., Milosavljević M., Bromm V., 2013, ApJ, 767, 59
- Pawlik et al. (2015) Pawlik A. H., Schaye J., Vecchia C. D., 2015, MNRAS, 451, 1586
- Pawlik et al. (2017) Pawlik A. H., Rahmati A., Schaye J., Jeon M., Dalla Vecchia C., 2017, MNRAS, 466, 960
- Planck Collaboration et al. (2016) Planck Collaboration et al., 2016, A&A, 594, A13
- Prescott et al. (2009) Prescott M. K., Dey A., Jannuzi B. T., 2009, ApJ, 702, 554
- Raiter et al. (2010) Raiter A., Schaerer D., Fosbury R. A., 2010, A&A, 523, A64
- Regős et al. (2020) Regős E., Vinkó J., Ziegler B. L., 2020, ApJ, 894, 94
- Ritter et al. (2015) Ritter J. S., Sluder A., Safranek-Shrader C., Milosavljević M., Bromm V., 2015, MNRAS, 451, 1190
- Safranek-Shrader et al. (2012) Safranek-Shrader C., Agarwal M., Federrath C., Dubey A., Milosavljević M., Bromm V., 2012, MNRAS, 426, 1159
- Samui et al. (2007) Samui S., Srianand R., Subramanian K., 2007, Monthly Notices of the Royal Astronomical Society, 377, 285
- Sarmento et al. (2016) Sarmento R., Scannapieco E., Pan L., 2016, ApJ, 834, 23
- Sarmento et al. (2018) Sarmento R., Scannapieco E., Cohen S., 2018, ApJ, 854, 75
- Scannapieco et al. (2003) Scannapieco E., Schneider R., Ferrara A., 2003, ApJ, 589, 35
- Scannapieco et al. (2005) Scannapieco E., Madau P., Woosley S., Heger A., Ferrara A., 2005, The Astrophysical Journal, 633, 1031
- Schaerer (2002) Schaerer D., 2002, A&A, 382, 28
- Schauer et al. (2019a) Schauer A. T., Glover S. C., Klessen R. S., Ceverino D., 2019a, MNRAS, 484, 3510
- Schauer et al. (2019b) Schauer A. T., Liu B., Bromm V., 2019b, ApJ, 877, L5
- Sesana et al. (2009) Sesana A., Gair J., Mandel I., Vecchio A., 2009, The Astrophysical Journal Letters, 698, L129
- Simcoe et al. (2012) Simcoe R. A., Sullivan P. W., Cooksey K. L., Kao M. M., Matejek M. S., Burgasser A. J., 2012, Nature, 492, 79
- Simon (2019) Simon J. D., 2019, ARA&A, 57, 375
- Skinner & Wise (2020) Skinner D., Wise J. H., 2020, MNRAS, 492, 4386
- Smith et al. (2009) Smith B. D., Turk M. J., Sigurdsson S., O’Shea B. W., Norman M. L., 2009, ApJ, 691, 441
- Smith et al. (2015) Smith B. D., Wise J. H., O’Shea B. W., Norman M. L., Khochfar S., 2015, MNRAS, 452, 2822
- So et al. (2014) So G. C., Norman M. L., Reynolds D. R., Wise J. H., 2014, ApJ, 789, 149
- Sobral et al. (2015) Sobral D., Matthee J., Darvish B., Schaerer D., Mobasher B., Röttgering H. J., Santos S., Hemmati S., 2015, ApJ, 808, 139
- Sparre et al. (2015) Sparre M., et al., 2015, MNRAS, 447, 3548
- Spitzer (2006) Spitzer L., 2006, Physics of fully ionized gases. Courier Corporation
- Springel (2005) Springel V., 2005, MNRAS, 364, 1105
- Springel & Hernquist (2003) Springel V., Hernquist L., 2003, MNRAS, 339, 289
- Stacy & Bromm (2013) Stacy A., Bromm V., 2013, MNRAS, 433, 1094
- Stacy et al. (2016) Stacy A., Bromm V., Lee A. T., 2016, MNRAS, 462, 1307
- Stopyra et al. (2020) Stopyra S., Pontzen A., Peiris H., Roth N., Rey M., 2020, arXiv e-prints, p. arXiv:2006.01841
- Sugimura et al. (2020) Sugimura K., Matsumoto T., Hosokawa T., Hirano S., Omukai K., 2020, ApJ, 892, L14
- Susa et al. (2014) Susa H., Hasegawa K., Tominaga N., 2014, ApJ, 792, 32
- Tarumi et al. (2020) Tarumi Y., Hartwig T., Magg M., 2020, arXiv e-prints, p. arXiv:2005.10401
- Tornatore et al. (2007) Tornatore L., Ferrara A., Schneider R., 2007, MNRAS, 382, 945
- Trenti & Stiavelli (2009) Trenti M., Stiavelli M., 2009, ApJ, 694, 879
- Turk et al. (2010) Turk M. J., Smith B. D., Oishi J. S., Skory S., Skillman S. W., Abel T., Norman M. L., 2010, ApJS, 192, 9
- Vanzella et al. (2020) Vanzella E., et al., 2020, MNRAS, 494, L81
- Vázquez & Leitherer (2005) Vázquez G. A., Leitherer C., 2005, ApJ, 621, 695
- Visbal et al. (2015) Visbal E., Haiman Z., Bryan G. L., 2015, MNRAS, 453, 4456
- Wang et al. (2012) Wang F. Y., Bromm V., Greif T. H., Stacy A., Dai Z. G., Loeb A., Cheng K. S., 2012, ApJ, 760, 27
- Wang et al. (2017) Wang L., et al., 2017, arXiv preprint arXiv:1710.07005
- Whalen et al. (2013) Whalen D. J., Joggerst C. C., Fryer C. L., Stiavelli M., Heger A., Holz D. E., 2013, ApJ, 768, 95
- Wise et al. (2011) Wise J. H., Turk M. J., Norman M. L., Abel T., 2011, ApJ, 745, 50
- Wise et al. (2014) Wise J. H., Demchenko V. G., Halicek M. T., Norman M. L., Turk M. J., Abel T., Smith B. D., 2014, MNRAS, 442, 2560
- Wolcott-Green et al. (2011) Wolcott-Green J., Haiman Z., Bryan G. L., 2011, MNRAS, 418, 838
- Xu et al. (2013) Xu H., Wise J. H., Norman M. L., 2013, ApJ, 773, 83
- Xu et al. (2016) Xu H., Norman M. L., O’Shea B. W., Wise J. H., 2016, ApJ, 823, 140
- Yajima & Khochfar (2017) Yajima H., Khochfar S., 2017, MNRAS, 467, L51
- Yajima et al. (2017) Yajima H., Nagamine K., Zhu Q., Khochfar S., Dalla Vecchia C., 2017, The Astrophysical Journal, 846, 30
- Yoshida et al. (2004) Yoshida N., Bromm V., Hernquist L., 2004, ApJ, 605, 579
- Zackrisson et al. (2011) Zackrisson E., Rydberg C.-E., Schaerer D., Östlin G., Tuli M., 2011, ApJ, 740, 13