Ionized and hot molecular outflows in the inner 500 pc of NGC 1275
Abstract
The role of feedback from Active Galactic Nuclei (AGN) in the evolution of galaxies is still not not fully understood, mostly due to the lack of observational constraints in the multi-phase gas kinematics on the ten to hundred parsec scales. We have used the Gemini Near-infrared Integral Field Spectrograph (NIFS) to map the molecular and ionized gas kinematics in the inner 900900 pc2 of the Seyfert galaxy NGC 1275 at a spatial resolution of 70 pc. From the fitting of the CO absorption bandheads in the K-band, we derive a stellar velocity dispersion of km s-1, which implies a black hole mass of M⊙. We find hot ( K) molecular and ionized outflows with velocities of up to 2 000 km s-1 and mass outflow rates of yr-1 and yr-1, respectively, in each of these gas phases. The kinetic power of the ionized outflows corresponds to only 0.05 per cent of the luminosity of the AGN of NGC 1275, indicating that they are not powerful enough to provide significant AGN feedback, but may be effective in redistributing the gas in the central region of the galaxy. The AGN driven outflows seem to be responsible for the shocks necessary to produce the observed H2 and [Fe ii] line emission.
keywords:
galaxies: active – galaxies: kinematics and dynamics – galaxies: individual (NGC 1275)1 Introduction
Perseus is the X-ray brightest known galaxy cluster (Forman et al., 1972) and a cool core cluster prototype (Crawford et al., 1999). It shows a rich emission structure, presenting multiple X-ray cavities, ripples, shocks and filaments (e.g. Fabian et al., 2000; Fabian et al., 2003, 2006; Sanders et al., 2016). The brightest member of the cluster is the giant elliptical galaxy NGC 1275 (Perseus A, 3C84, Sandage & Tammann, 1981), located at its center, at a distance of 62.5 Mpc (Tully et al., 2013). NGC 1275 hosts a Seyfert 1.5 nucleus (Véron-Cetty & Véron, 2006) and has strong infrared emission with a luminosity of , consistent with a Luminous Infra-Red Galaxy (Sanders et al., 2003). It presents collimated radio emission along the Position Angle PA=160/340∘ extending to up to 30′′ from its nucleus (Pedlar et al., 1990), a sub-pc scale intermittent radio jet (e.g. Nagai et al., 2010a, b) and variable high-energy -ray emission (Abdo et al., 2009).
The most intriguing feature of NGC 1275 is the kpc scale filamentary structure seen both in molecular (Salomé et al., 2006; Hatch et al., 2005; Lim et al., 2008; Ho et al., 2009b) and ionized gas (Kent & Sargent, 1979; Conselice et al., 2001; Fabian et al., 2008). Recently, Gendron-Marsolais et al. (2018) presented integral-field spectra obtained with the instrument SITELLE at the Canada France Hawaii Telescope, that provide a detailed mapping of the ionization and kinematics of the large scale filamentary nebulae surrounding NGC 1275, covering an area of 8040 kpc2 (3.82.6 arcmin2) with a spatial resolution of 03. These observations reveal that the kinematics of the filaments do not show any signature of ordered motions, interpreted by the authors as an evidence that the filaments are not consistent with uniform inflows or outflows. Their analysis exclude the inner 6′′, where the line emission originates from the gas ionized by the central Active Galactic Nucleus (AGN).
Besides strong optical emission lines from the ionized gas, the nucleus of NGC 1275 also presents strong molecular hydrogen emission, seen in the mid (e.g. Armus et al., 2007; Lambrides et al., 2019) and near-infrared (e.g. Krabbe et al., 2000; Wilman et al., 2005; Riffel et al., 2006b) spectra. NGC 1275 presents H2 emission excess in the mid infrared in comparison with other nearby galaxies, with [H2 S(3)9.665 m/PAH11.3 m] (Lambrides et al., 2019) and high [O i] Å velocity dispersion (360 km s-1) and [O i] Å/H (1.75) (Gavazzi et al., 2013). The simultaneous enhancement in H2 emission and in [O i] velocity dispersion make this object a likely host of molecular outflows (Riffel et al., 2019a) and therefore a unique nearby laboratory to probe AGN feedback. The near-IR spectral region is less affected by dust extinction than the optical bands and presents emission lines from distinct gas phases, allowing the mapping of the multi-phase gas kinematics and distribution. Here, we present new Gemini Near-Infrared Integral Field Spectrograph (NIFS) J- and K-band data used to used to unravel the gas kinematics of the central of NGC 1275.
Gemini NIFS observations in the H and K band have already been used to study the gas excitation and kinematics of central region of NGC 1275 (Scharwächter et al., 2013). These data reveal a circum-nuclear disk in the inner 100 pc of the galaxy oriented along the position angle PA=68∘, which is modeled by a Keplerian rotation arround a central mass of 8, taken as the mass of the supermassive black hole. Recent Atacama Large Millimeter Array (ALMA) CO(2–10) observations show the cold counterpart of the disk, as well as fast outflows (300–600 km s-1) detected as absorption features in the HCN (3–2) and HCO+ (3–2) spectra (Nagai et al., 2019). Based on single Gaussian fit of the H2 and [Fe ii] emission-line profiles, Scharwächter et al. (2013) find a redshifted H2 structure to the south-west of the nucleus, possibly falling into the center. Another redshifted blob is seen in both H2 and [Fe ii] at 12 north-west of the nucleus, coincident with the orientation of the radio jet and tentatively interpreted as an evidence of jet-cloud interaction. Based on line ratios obtained from integrated spectra, Scharwächter et al. (2013) also conclude that most likely the H2 emission in the inner region of NGC 1275 is produced by shocks and the [Fe ii] emission is consistent with being originated by X-ray heating, but they could not rule out a possible contribution by shocks.
As noticed by Scharwächter et al. (2013), the near-IR emission-line profiles of the central region are complex. In this work, we analyse the gas kinematics and distribution based on non-parametric measurements and multi-Gaussian components fits, which allows us to better disentangle the distinct kinematic components. In addition, the J-band spectra allow us to better map the AGN ionization structure than the previous available data, fundamental to understand the origin of the gas emission and the role of the AGN.
This paper is organized as follows. Section 2 presents a description of the data, its reduction and analysis procedures. In Sec. 3, we present two-dimensional maps of emission-line fluxes, line ratio and kinematics, which are discussed in Sec. 4. Finally, Sec. 5 presents our conclusions.
2 Observations and data reduction
The Gemini NIFS (McGregor et al., 2003) is an integral field spectrograph optimized to operate with the ALTtitude conjugate Adaptive optics for the InfraRed (ALTAIR). It has a square field of view of , divided into 29 slices with an angular sampling of 01030042. The observations of NGC 1275 were done in October 22, 2019 in the queue mode under the project GN-2019A-Q-106. For the J-band, we use the J-G5603 grating and the ZJ-G0601 filter with a resolving power of , while for the K-band we use the K-G5605 grating and HK-G0603 filter, resulting in .
The observations followed the standard Object-Sky-Object dither sequence, with off-source sky positions at 1′ from the galaxy, and individual exposure times of 470 s. The J-band spectra are centred at 1.25 m, covering the spectral range from 1.14 to 1.36 m. The K-band data are centred at 2.20 m and cover the 2.00–2.40 m spectral region. The total exposure time at each band was 47 min.
The data reduction was accomplished using tasks contained in the nifs package which is part of gemini iraf package, as well as generic iraf tasks. The data reduction followed the standard procedure, which includes the trimming of the images, flat-fielding, cosmic ray rejection, sky subtraction, wavelength and s-distortion calibrations. In order to remove telluric absorptions from the galaxy spectra we observed the telluric standard star HIP 15925 just after the J-band observations of the galaxy and HIP 10559 just before the K-band observations. The galaxy spectra was divided by the normalized spectrum of the tellurc standard star using the nftelluric task of the nifs.gemini.iraf package. The galaxy spectra were flux calibrated by interpolating a blackbody function to the spectrum of the telluric standard and the J and K-bands data cubes were constructed with an angular sampling of 005005 for each individual exposure. The individual data cubes were combined using a sigma clipping algorithm in order to eliminate bad pixels and remaining cosmic rays by mosaicing the dithered spatial positions. Then, we apply the method described in Davies (2007) to remove residual OH airglow emission from near-infrared spectra and finally, we use a Butterworth spatial band-pass filter to remove high-frequency noise, by adopting a cutoff frequency of 0.25 Ny.
The angular resolution of the K-band data cube is 022003 (679 pc at the galaxy), as measured from the full width at half maximum (FWHM) of the flux distribution of the Br broad component emission. For the J-band emission, the final data cube has an angular resolution of 025002 (766 pc at the galaxy), estimated from the flux distribution of the broad component of Pa. The resulting velocity resolution is 435 km s-1 in the J-band and 475 km s-1 in the K-band, measured from the FWHM of typical emission lines of the Ar and ArXe lamps spectra used to wavelength calibrate the J and K band spectra, respectively.
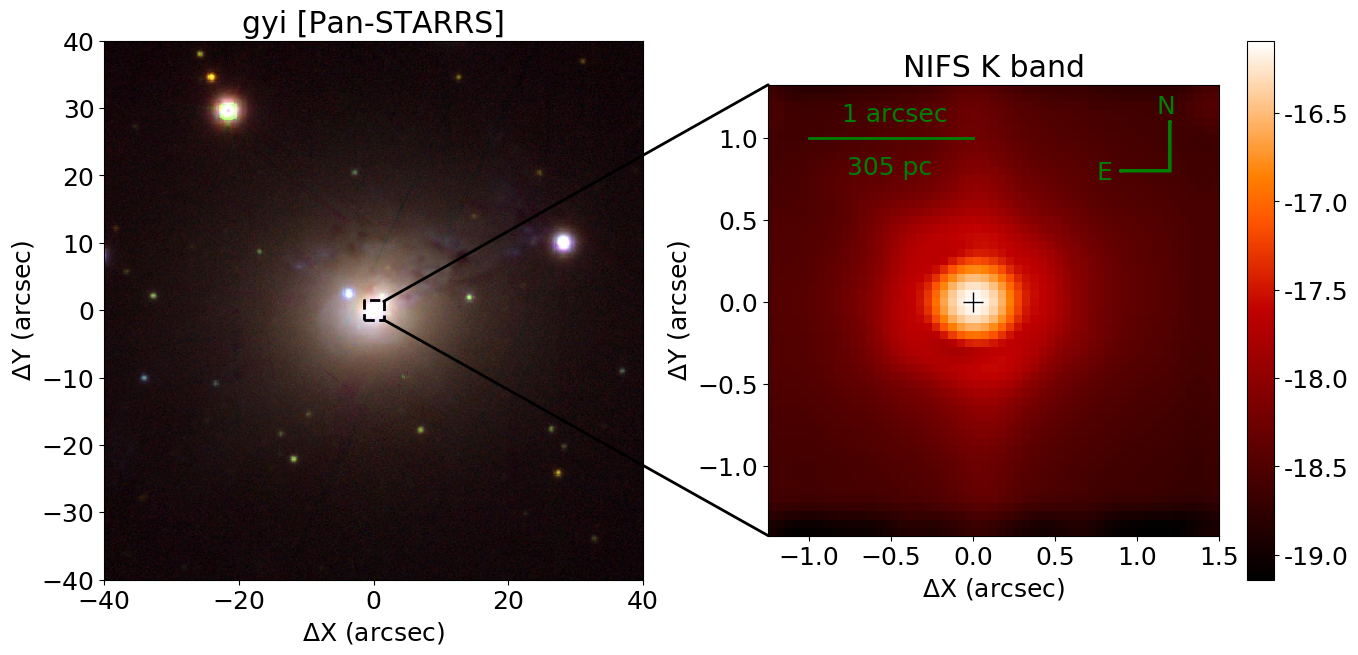
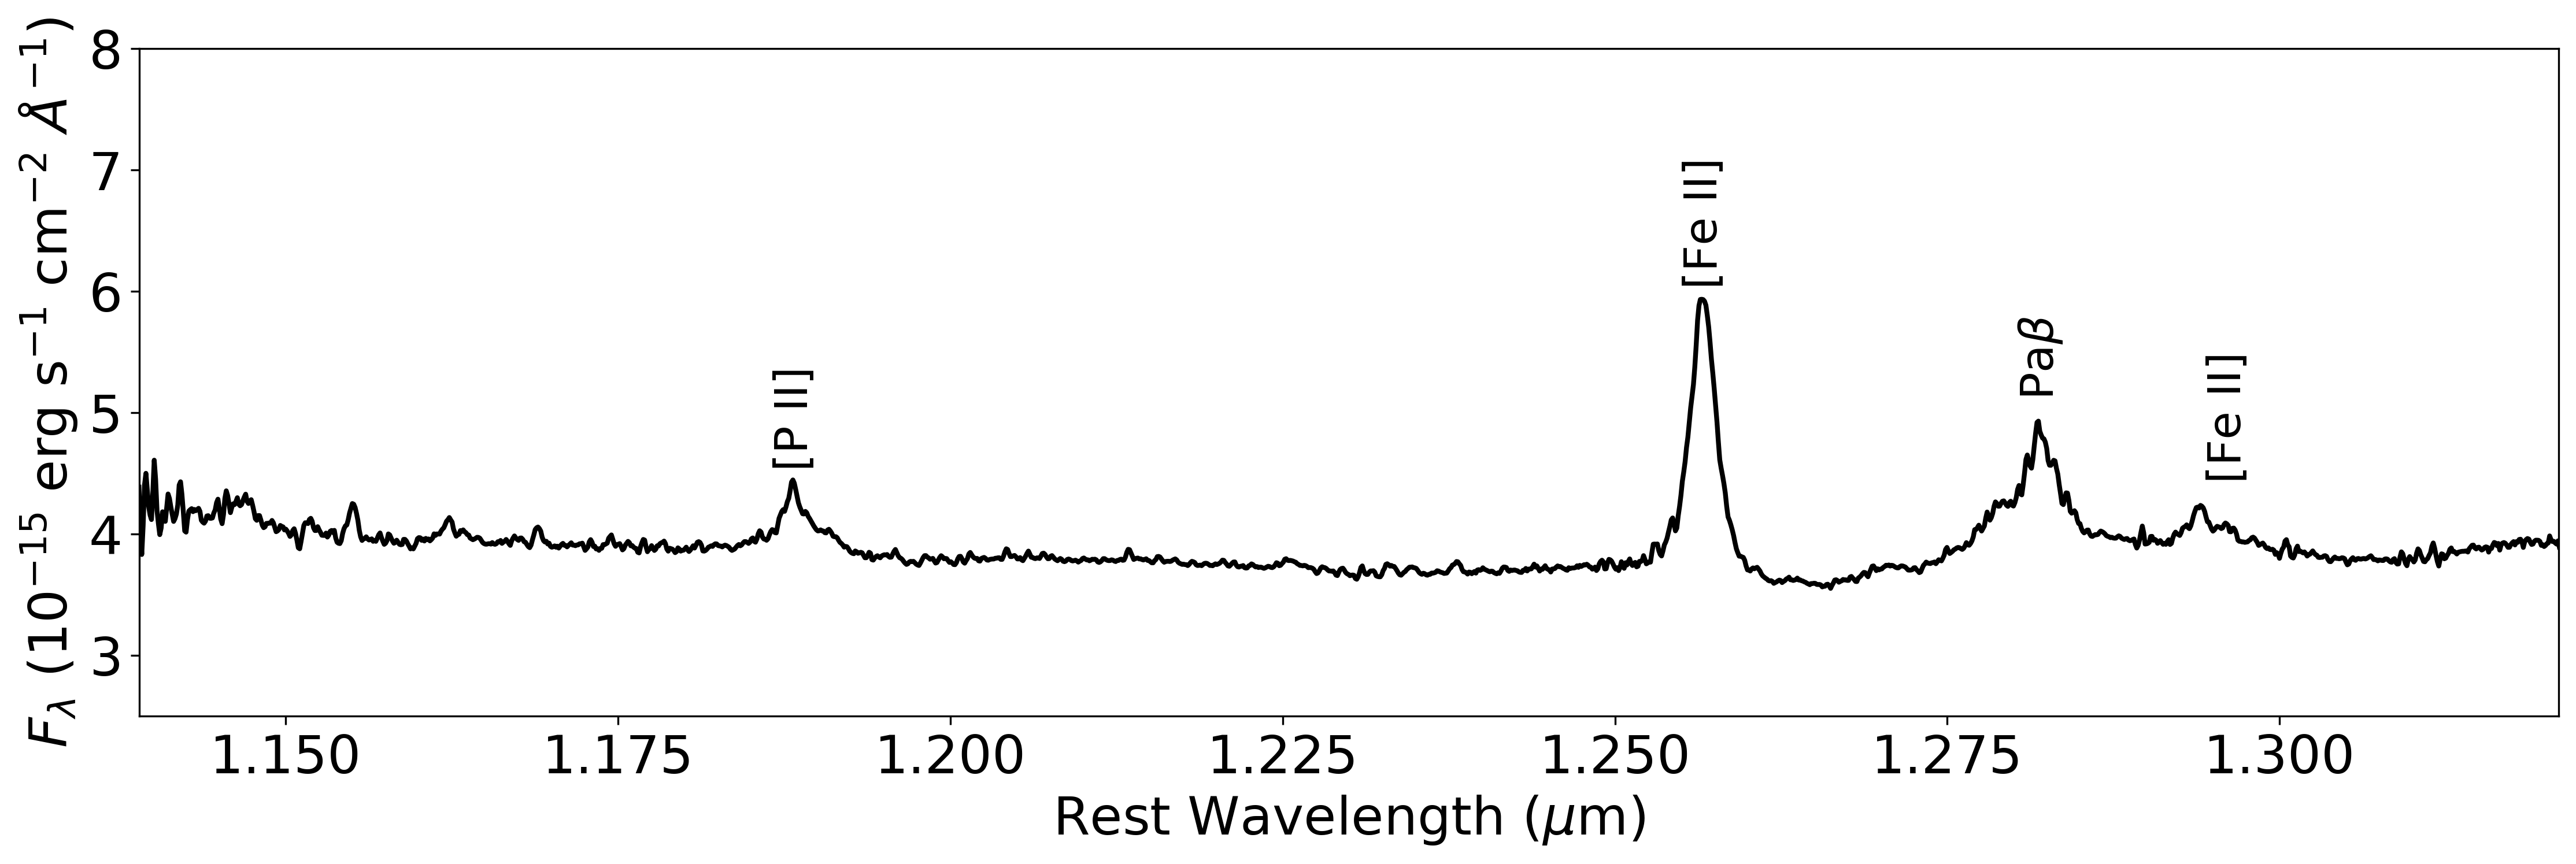
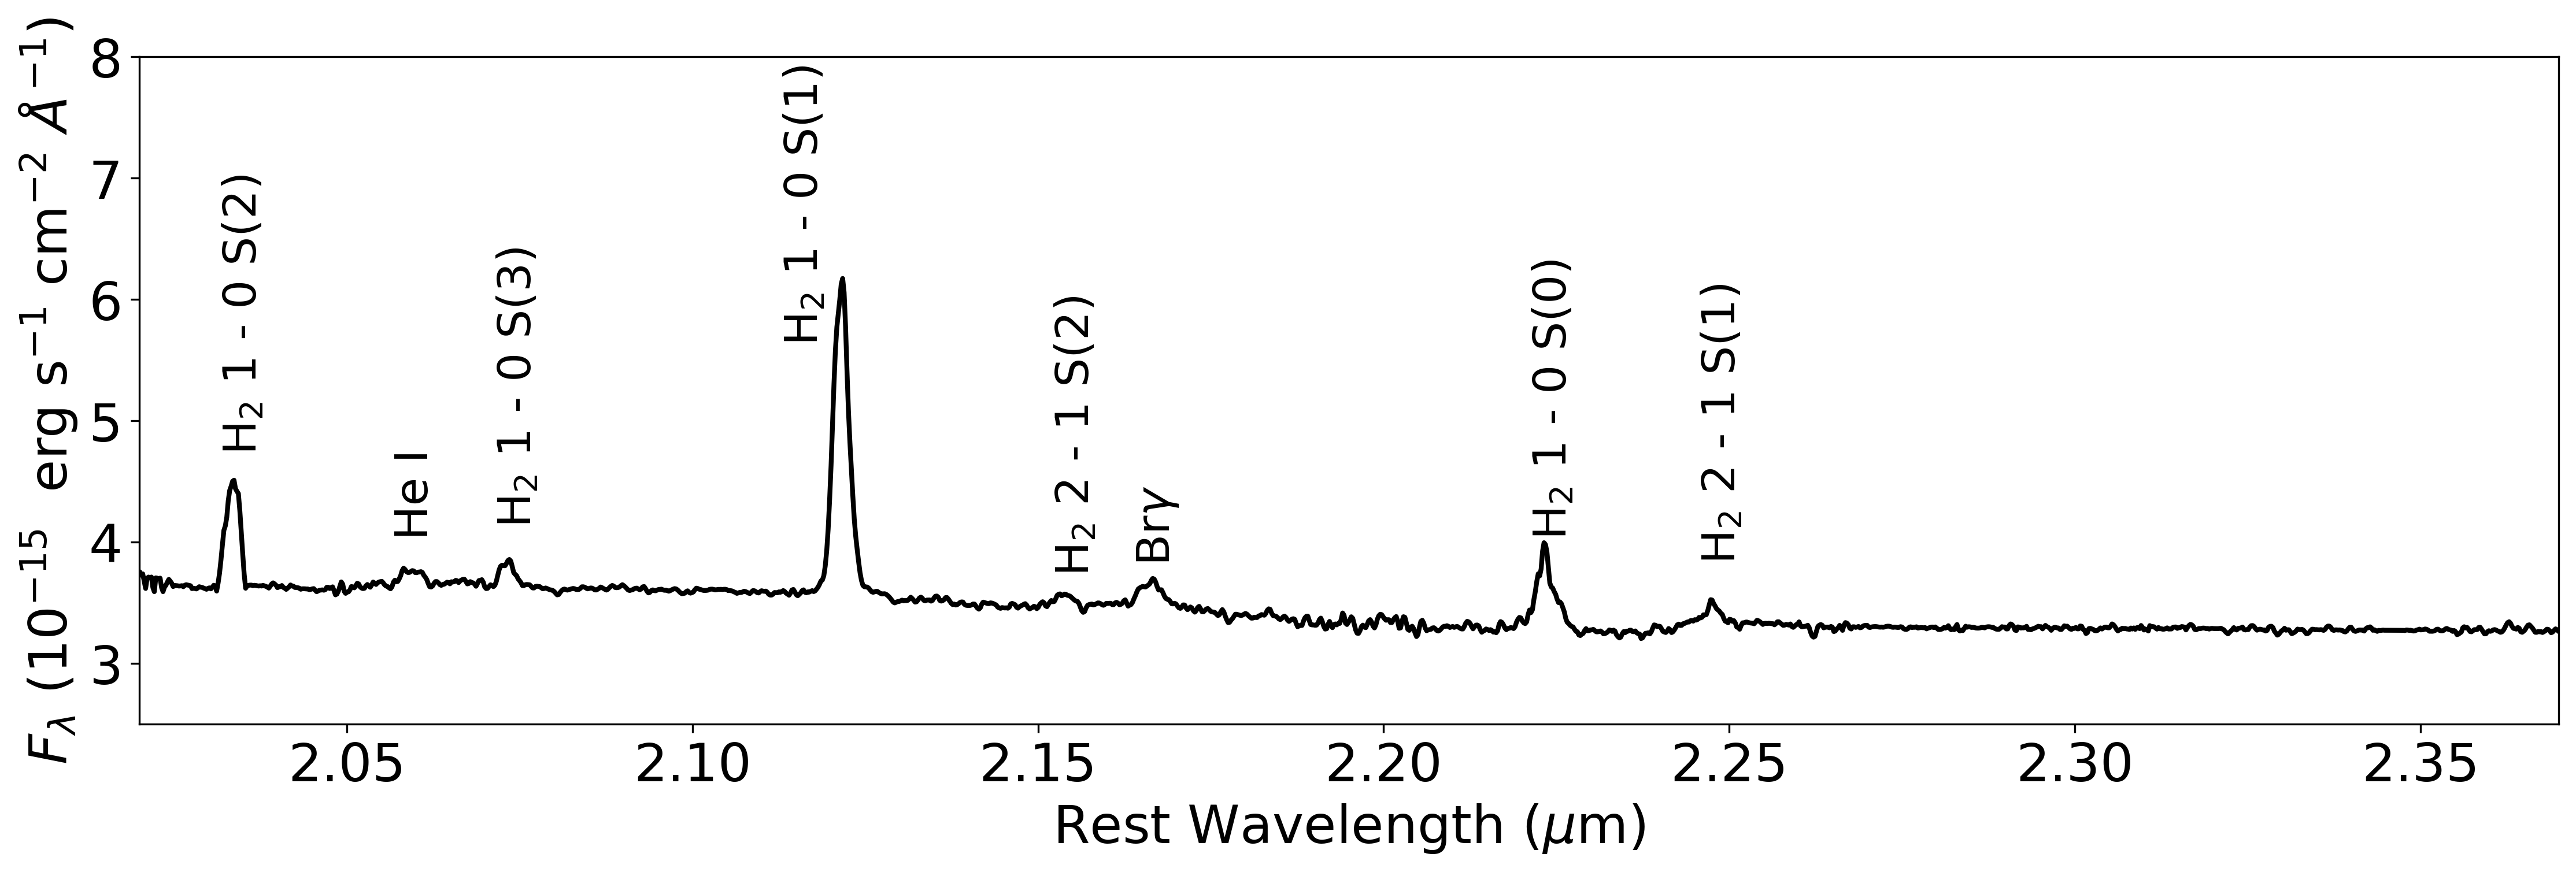
The top-left panel of Figure 1 presents a large scale composed image of NGC 1275 obtained from the Pan-STARRS data archive (Chambers et al., 2016; Flewelling et al., 2016) and the K-band continuum image, obtained by computing the average flux of the NIFS data cube at each spaxel, is presented in the top-right panel. The bottom panels show the J and K-band spectra integrated within an aperture of 10 radius centred at the location of the peak of the continuum emission. The main emission lines are identified: [P ii]1.1886 m, [Fe ii]1.1886 m 1.2570, Pa1.2822 m, [Fe ii]1.2964 m, H2 2.0338 m, He i2.0587 m, H2 2.0735 m, H2 2.1218 m, H2 2.1542 m, Br 2.16612 m, H2 2.2233 m, H2 2.2477 m.
3 Measurements
3.1 Non-parametric properties
We construct two-dimensional maps for the emission-line flux distributions, flux ratios and for the width in velocity space which encompasses 80 per cent of the flux of the emission lines (). For asymmetric, non-Gaussian emission-line profiles, the is a better estimate of the width of the line profiles in galaxies than the FWHM and it is widely used to identify outflows in nearby and distant galaxies (Zakamska & Greene, 2014; Wylezalek et al., 2017; Wylezalek et al., 2020). We measure the emission-line fluxes and W80 using the IFSCube python package111https://ifscube.readthedocs.io. The Pa profile clearly presents a very broad component ( km s-1, from the Broad Line Region – BLR) and thus, first we fit the line profile by two-Gaussian components and subtract the flux of the broad component. A weak emission from the BLR is also seen in Br and we follow the same procedure. The fluxes are integrated in the spectral window that encompasses 5 to each side of the peak of the line, as measured from the narrow line component.

3.2 Emission-line fitting
By fitting a single Gaussian to each emission-line profile, we recover the maps presented by Scharwächter et al. (2013) for the K-band emission lines and we find that the [Fe ii]1.2570 m shows similar maps to those of the H-band presented by these authors. We do not show maps based on single Gaussian fits, as they do not add to the discussion already presented in Scharwächter et al. (2013). However, the emission-line profiles in the inner 3 (900900 pc2) of NGC 1275 are complex and in most locations they are not well modeled neither by a single Gaussian, nor by Gauss-Hermite series (van der Marel & Franx, 1993; Riffel, 2010). Thus, we fit the emission-line profiles by multiple-Gaussian components using the IFSCube python package.
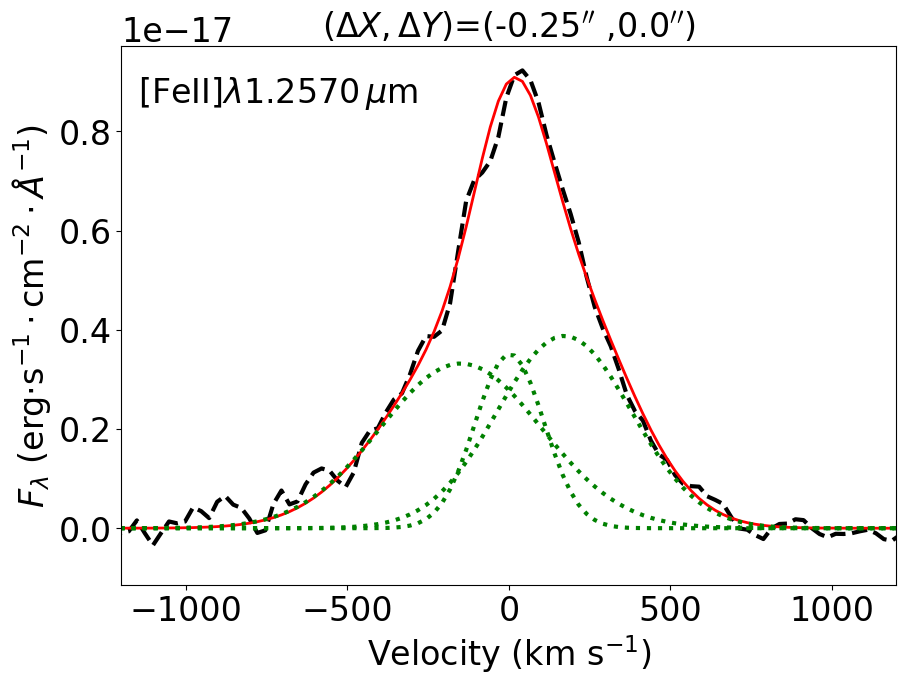
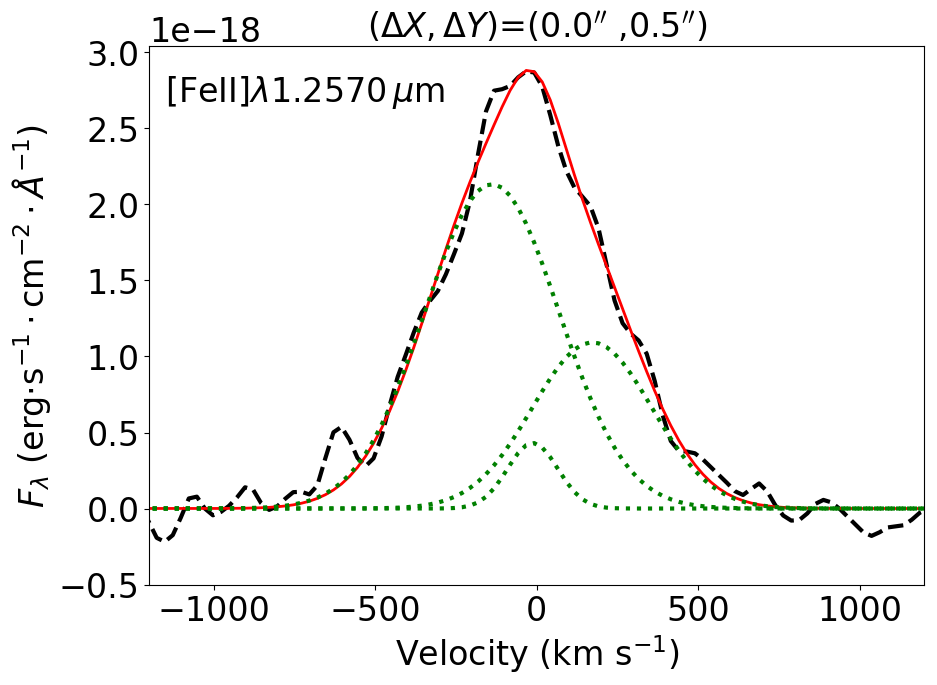
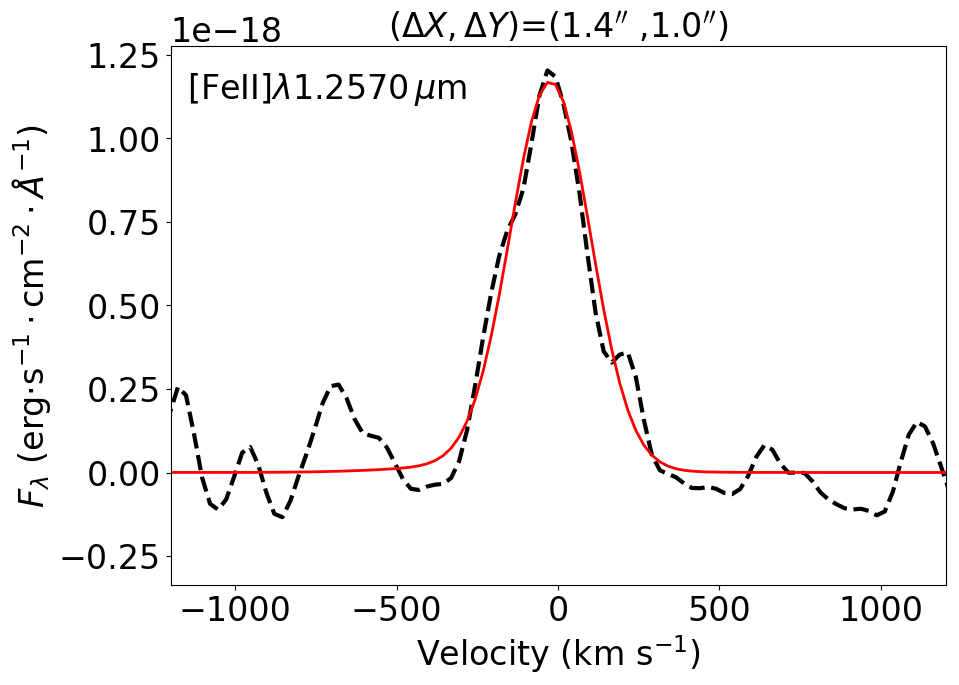
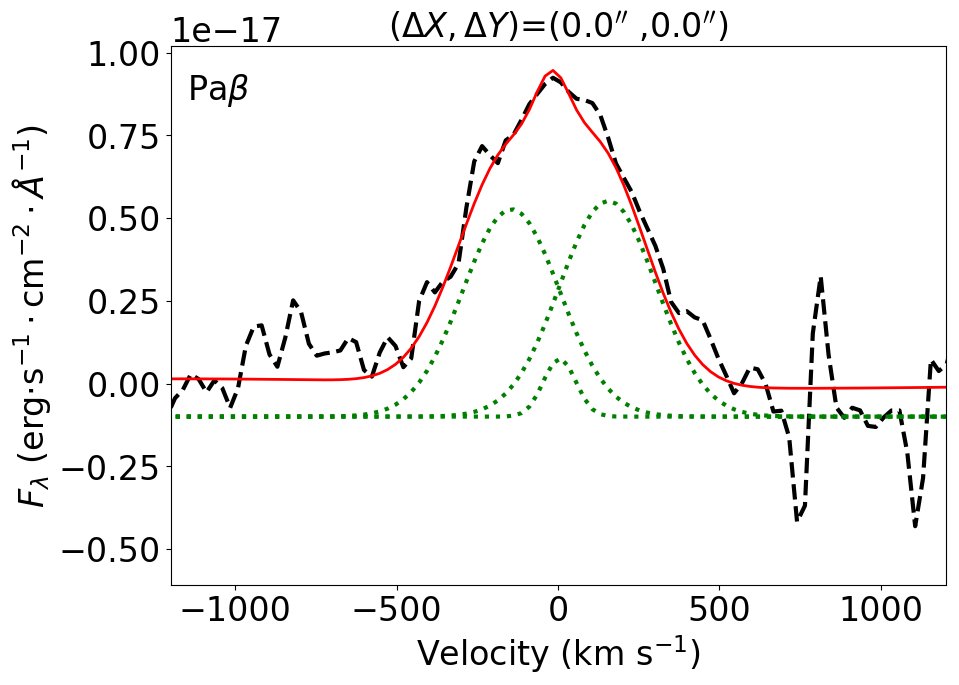
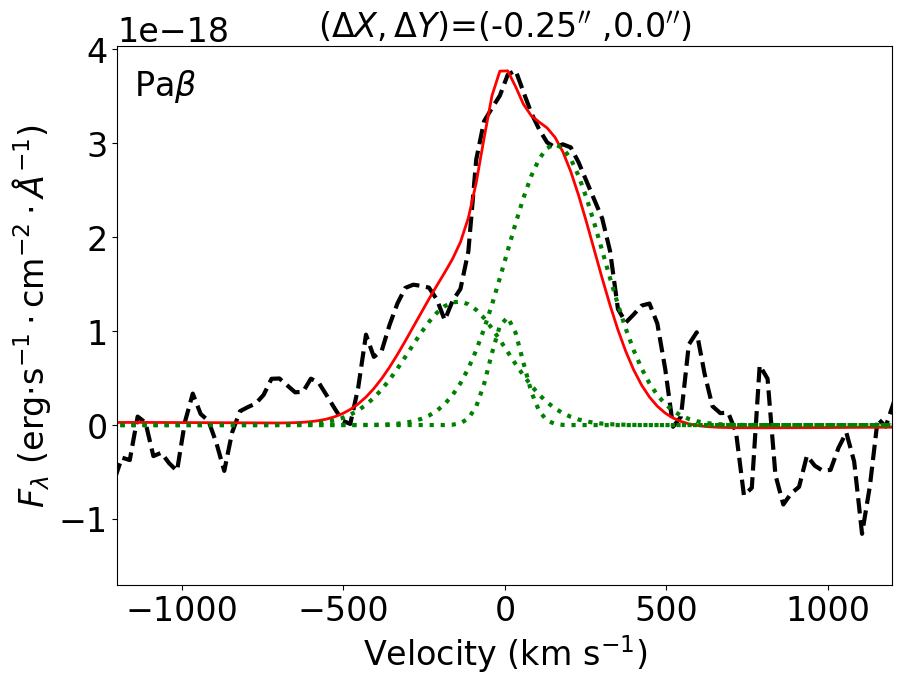
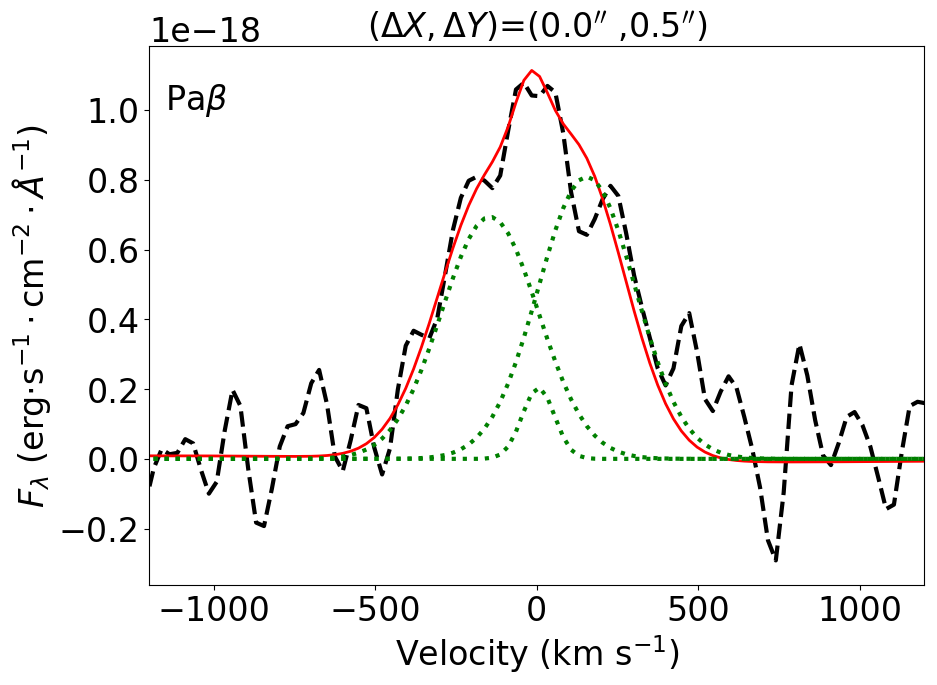
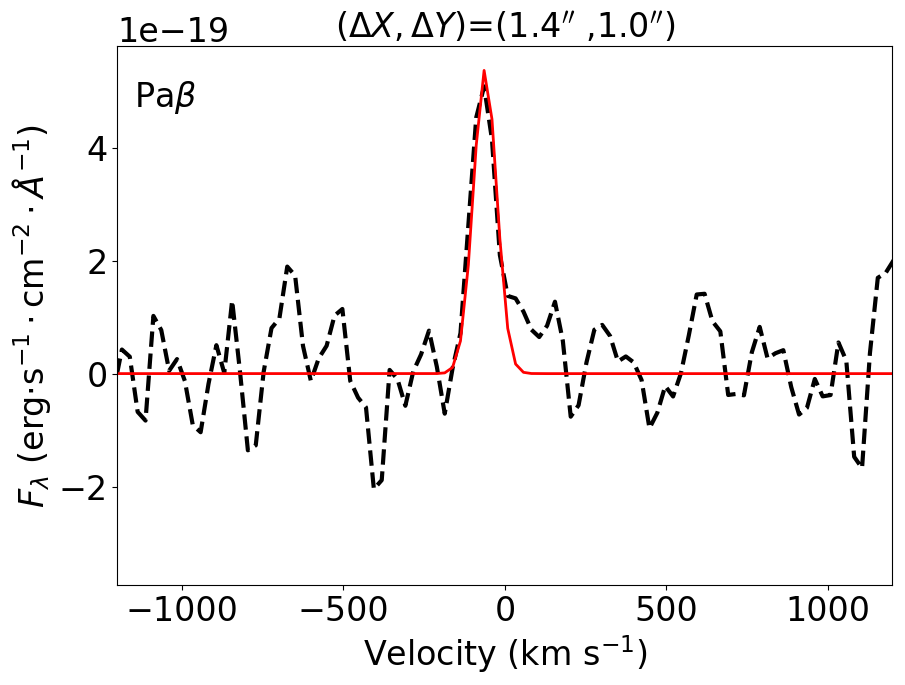
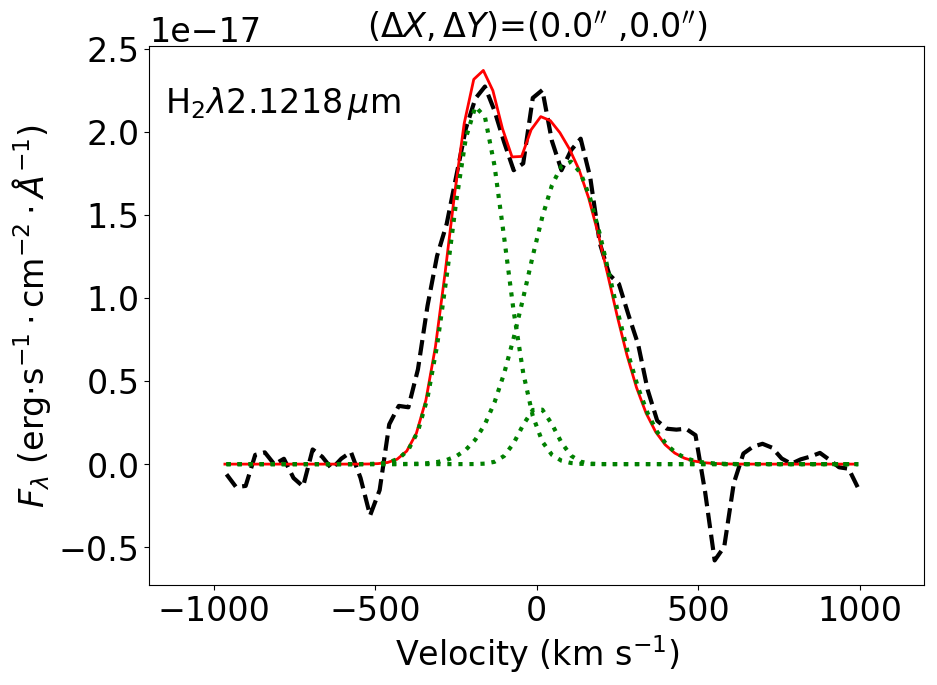
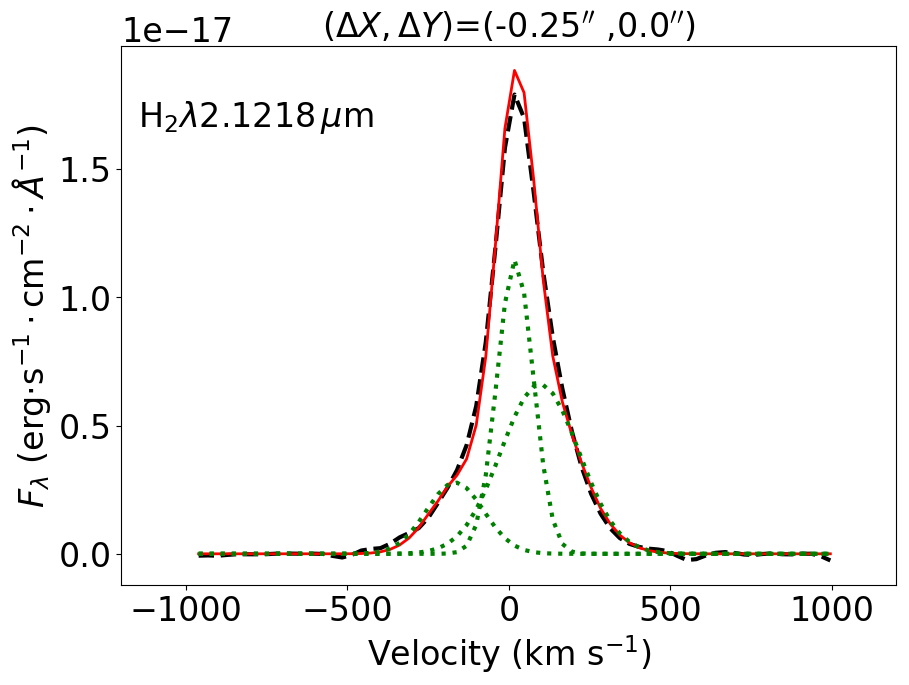
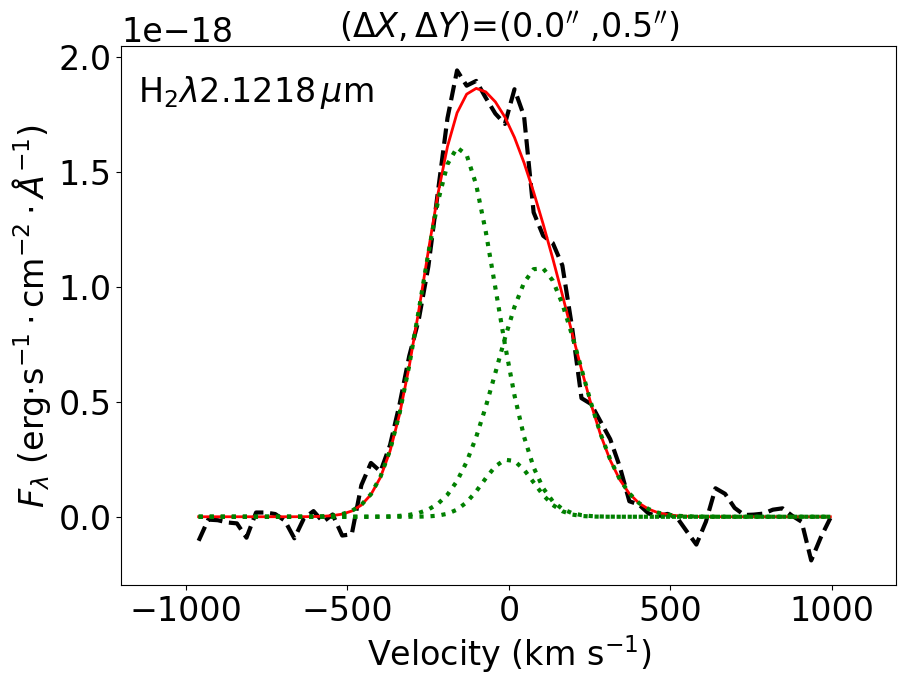
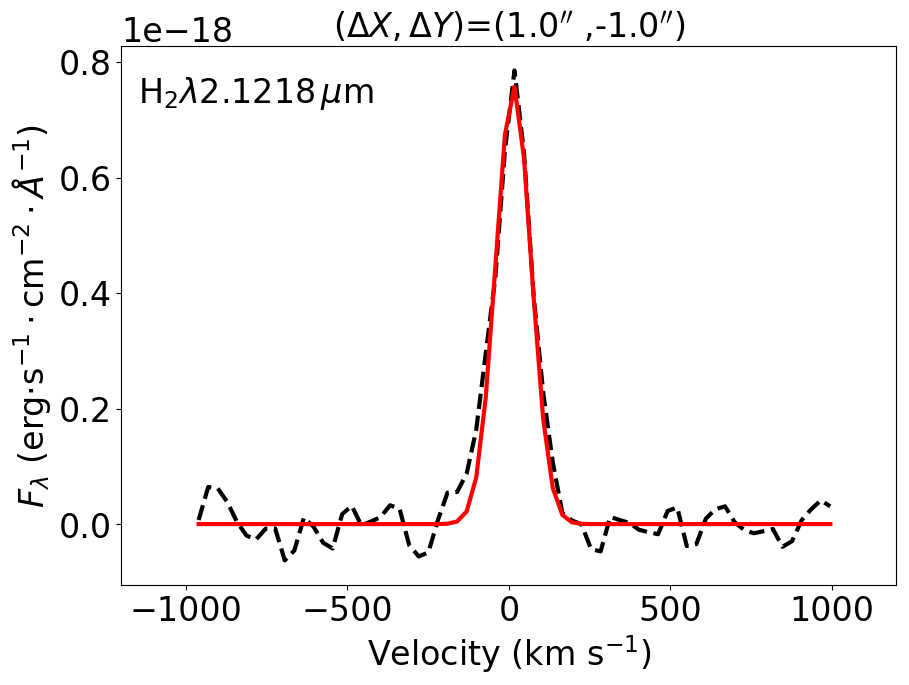
We allow the fit of up to three Gaussian components to each emission-line profile at all positions. The J and K-band spectra are fitted separately and all parameters are kept free, as the line profiles of distinct species clearly show distinct kinematic components (Fig. 2). We set the refit parameter of the ifscube code to use the best-fit parameters from spaxels located at distances smaller than 015 as the initial guess for the next fit. Thus, the fitting routine automatically chooses the best number of components and the initial guesses for the fit of a determined line profile at a specific spaxel. For example, if the amplitude of one of the Gaussians is zero in the neighboring spaxels, the code will return the parameters of the two remaining Gaussian curves and so on. As initial guesses for the first fit of each emission line we use the parameters of a three Gaussian fit for the nuclear spaxel using the iraf splot task. For Pa and Br, we include an additional very broad component ( km s-1) to take into account the emission from the BLR.
In Figure 2 we show examples of the fits of the [Fe ii]m (top row), Pa (middle row) and Hm (bottom row) for four different positions. As can be seen, usually the line profiles are well reproduced by the adopted model. The panels show the fit of the line profiles at the same locations, except for the bottom-right panels which are from distinct positions for each line, selected to represent regions where the line profiles are narrow.
3.3 Stellar kinematics
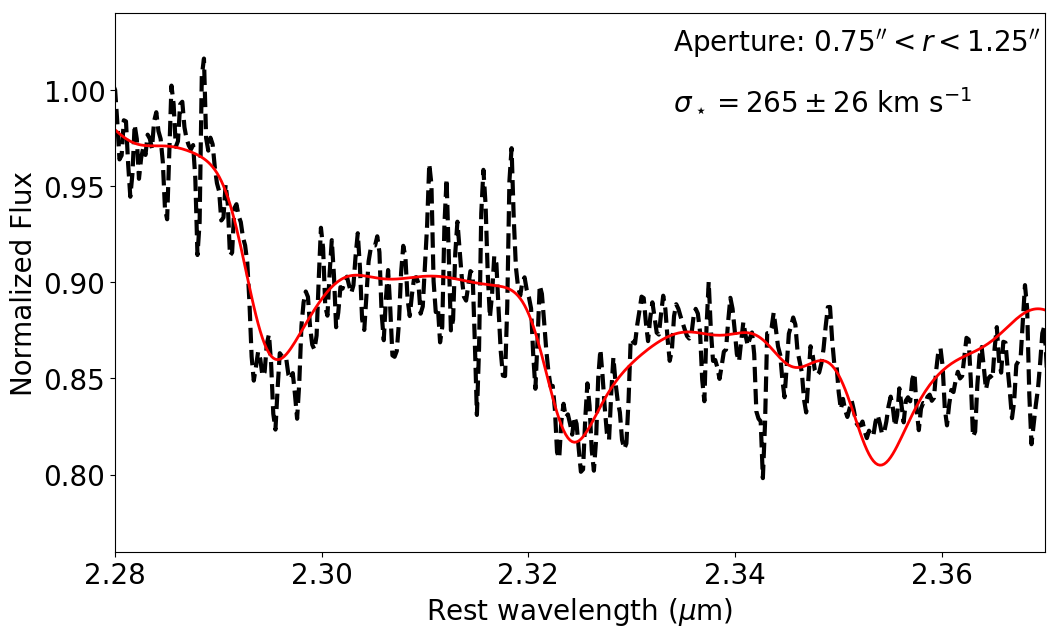
The CO absorption bandheads in the spectral range 2.29–2.40 m are usually prominent features in the spectra of nearby galaxies (e.g. Riffel et al., 2006b; Mason et al., 2015; Riffel et al., 2019b) and have been extensively used to measure the stellar kinematics (e.g. Riffel et al., 2015a, 2017). However, in strong AGN the CO features can be diluted by the AGN continuum (Riffel et al., 2009; Burtscher et al., 2015; Müller-Sánchez et al., 2018). This seems to be the case of NGC 1275, where integrated spectra of the inner pc do not show the CO features (Riffel et al., 2006b; Scharwächter et al., 2013). From our NIFS data, we are able to detect the CO absorption features in extranuclear regions, where we can therefore measure the stellar velocity and velocity dispersion. The signal-to-noise ratio (SNR) in the CO bands is not high enough to obtain reliable measurements spaxel by spaxel and thus, we use an integrated spectrum within a ring with inner radius of 075 and outer radius of 125. For distances smaller than 075, the CO absorptions are strongly diluted by the AGN continuum.
We measure the stellar line-of-sight velocity distribution by fitting the integrated spectrum within the spectral range 2.28–2.37 m (rest wavelengths). We use the penalized Pixel-Fitting (ppxf) method (Cappellari & Emsellem, 2004; Cappellari, 2017), that finds the best fit to a galaxy spectrum by convolving stellar spectra templates with a given velocity distribution, assumed to be Gaussian, as we fit only the two first moments. As spectral templates, we use the spectra of the Gemini library of late spectral type stars observed with the Gemini Near-Infrared Spectrograph (GNIRS) IFU and NIFS (Winge et al., 2009), which includes stars with spectral types from F7 to M5.
Figure 3 shows the integrated spectrum as a black dashed line and the model as a continuous red line. The CO bandheads are clearly detected and the model reproduces well the observed spectrum. The best fit corresponds to a velocity of , corrected to the heliocentric frame, and a velocity dispersion of . The derived velocity is in agreement with measurements using optical emission lines (526411 km s-1; Strauss et al., 1992). The value of derived here represents the first measurement based on the fitting of the CO bandheads. It is in agreement with those derived from Mg b lines at 5174 Å (24618 km s-1; Smith et al., 1990), Ca II8498,8542,8662 (27261 km s-1; Nelson & Whittle, 1995) and using scaling relations between the stellar and gas velocity dispersion (258.913.4 km s-1; Ho et al., 2009a).
4 Results
In this section we present the two-dimensional maps produced by the methodology described in the previous section. In all maps, the gray regions correspond to masked locations where the amplitude of the corresponding emission-line is smaller than 3 times the standard deviation of the continuum next to the line. The north is to the top and east is to the left in all maps. The systemic velocity of the galaxy is subtracted in all velocity maps, assumed to be the value derived from the fitting of the CO absorption bandheads.
4.1 Emission-line flux distributions and ratios
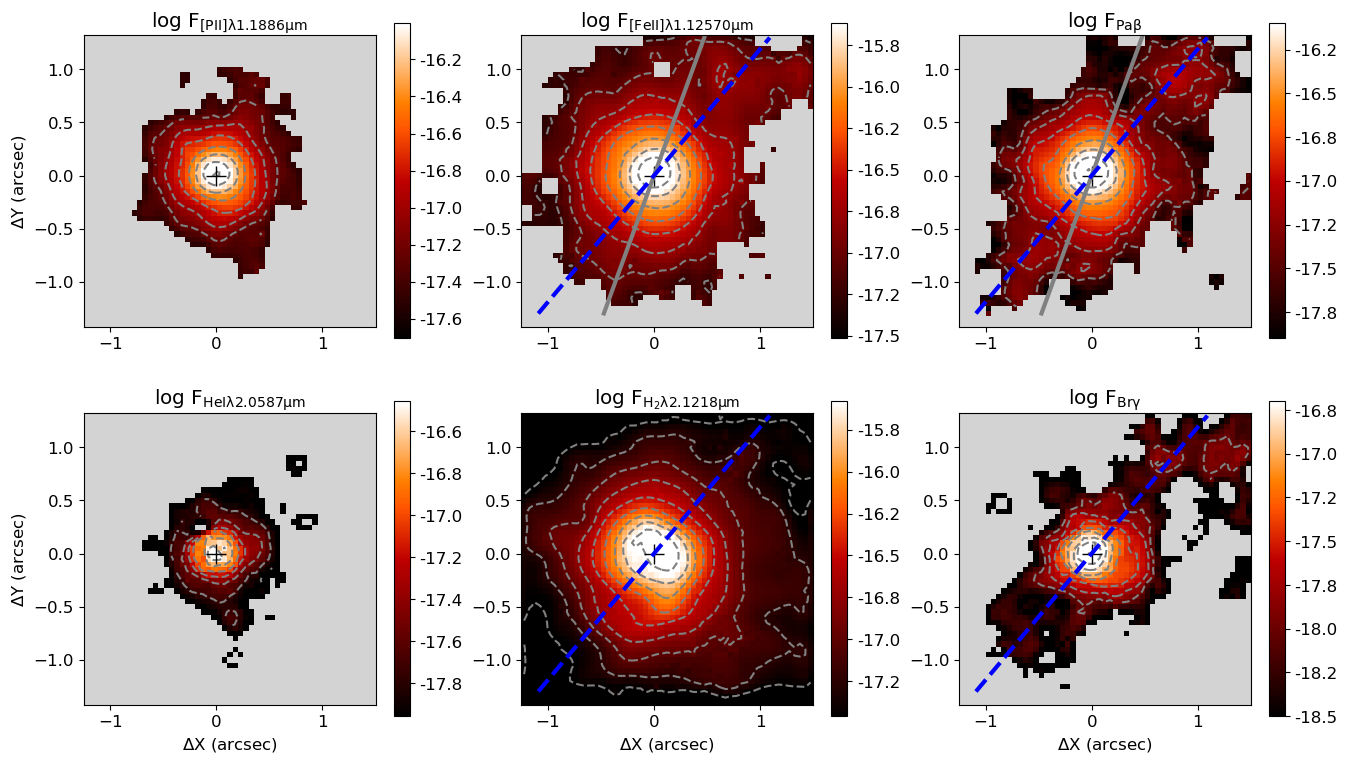
Figure 4 shows the flux distributions of the [P ii]m, [Fe ii]m, Pa, He im, Hm and Br emission lines, as obtained by direct integration of the observed line profiles. All emission lines present the peak emission at the nucleus of the galaxy and show spatially resolved emission. The H2 emission is the most extended, observed over the whole NIFS field of view, with the highest intensity levels slightly more elongated to the south-west of the nucleus, in good agreement with the maps shown by Scharwächter et al. (2013). The [Fe ii]m emission shows a similar morphology as that of the [Fe ii]m presented by Scharwächter et al. (2013), showing the most extended features to up to 17 north-west of the nucleus. The [P ii] emission is extended to up to 1′′ with a round morphology. The He i shows the most compact flux distribution, with emission seen mostly at distances smaller than 05 from the nucleus.
We detect extended emission in both H recombination lines, in contrast with the map presented by Scharwächter et al. (2013), where the Br emission is restricted to the inner 03 radius. Both Br and Pa flux maps show a well defined linear structure along PA=140/320∘. These lines are consistent with being photo-ionized by the central AGN. Therefore, in this object the photo-ionization cone and the jet are aligned within 20∘. This is interesting because the jet and cone orientation are formed by processes on different scales (Drouart et al., 2012; Bianchi et al., 2012; Marin & Antonucci, 2016).
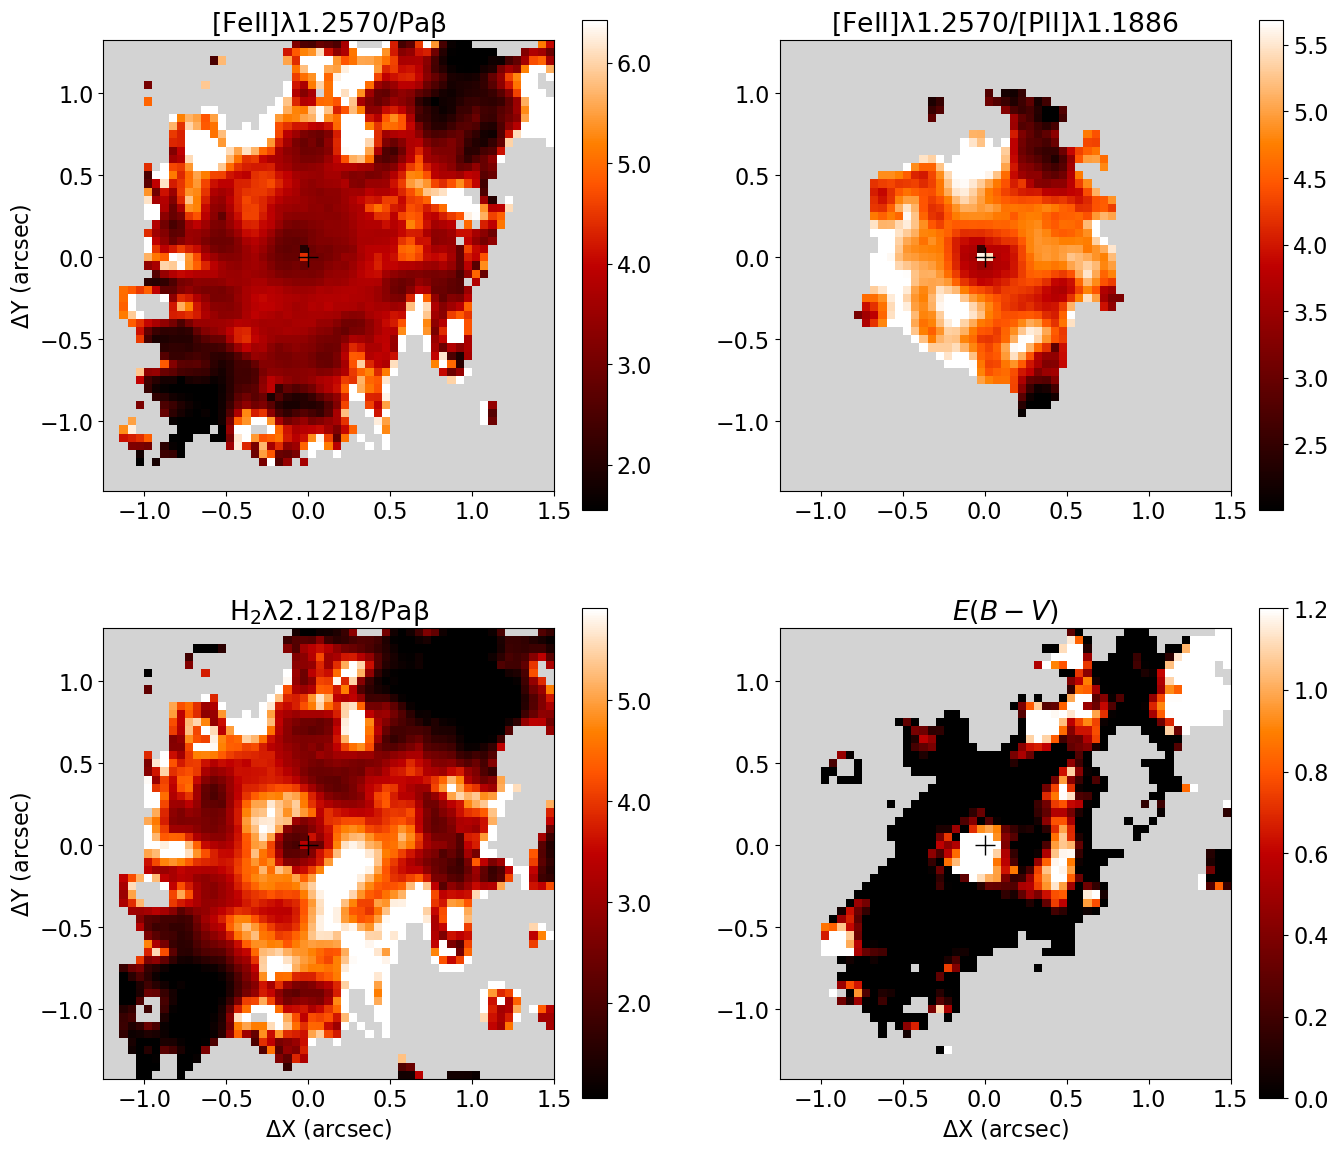
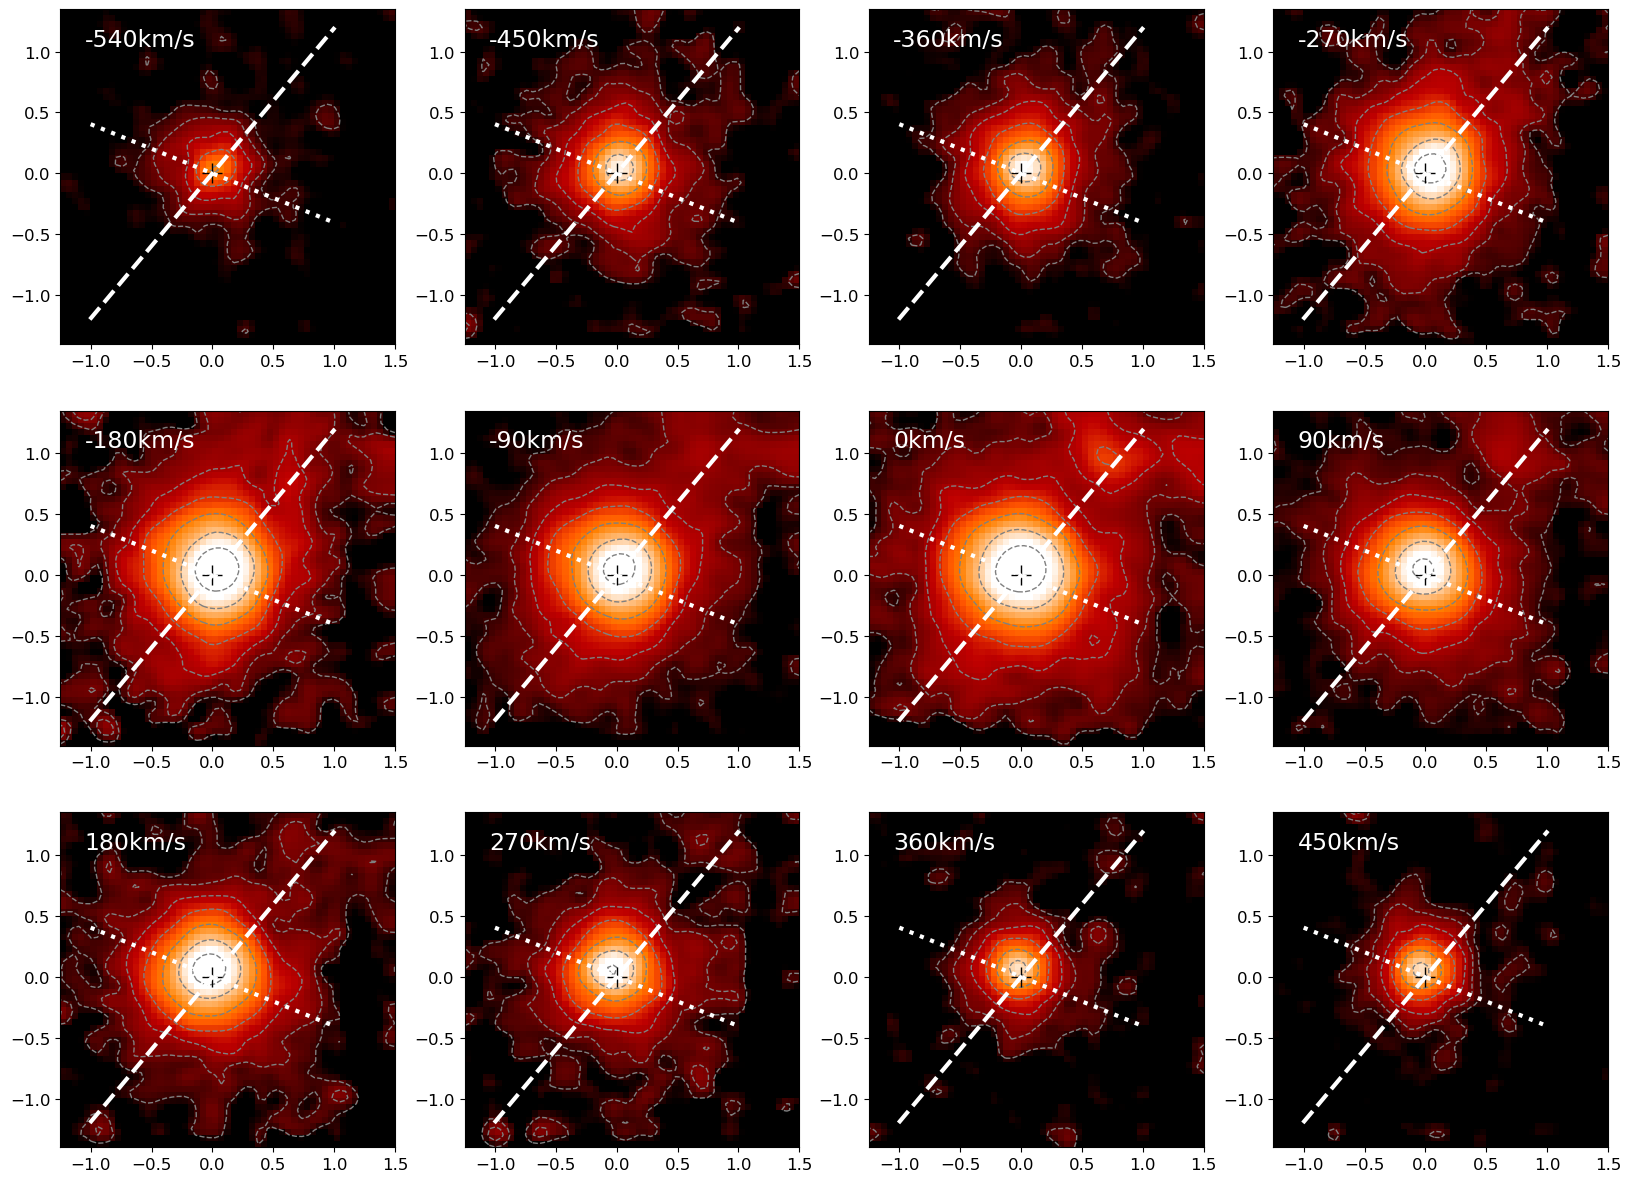
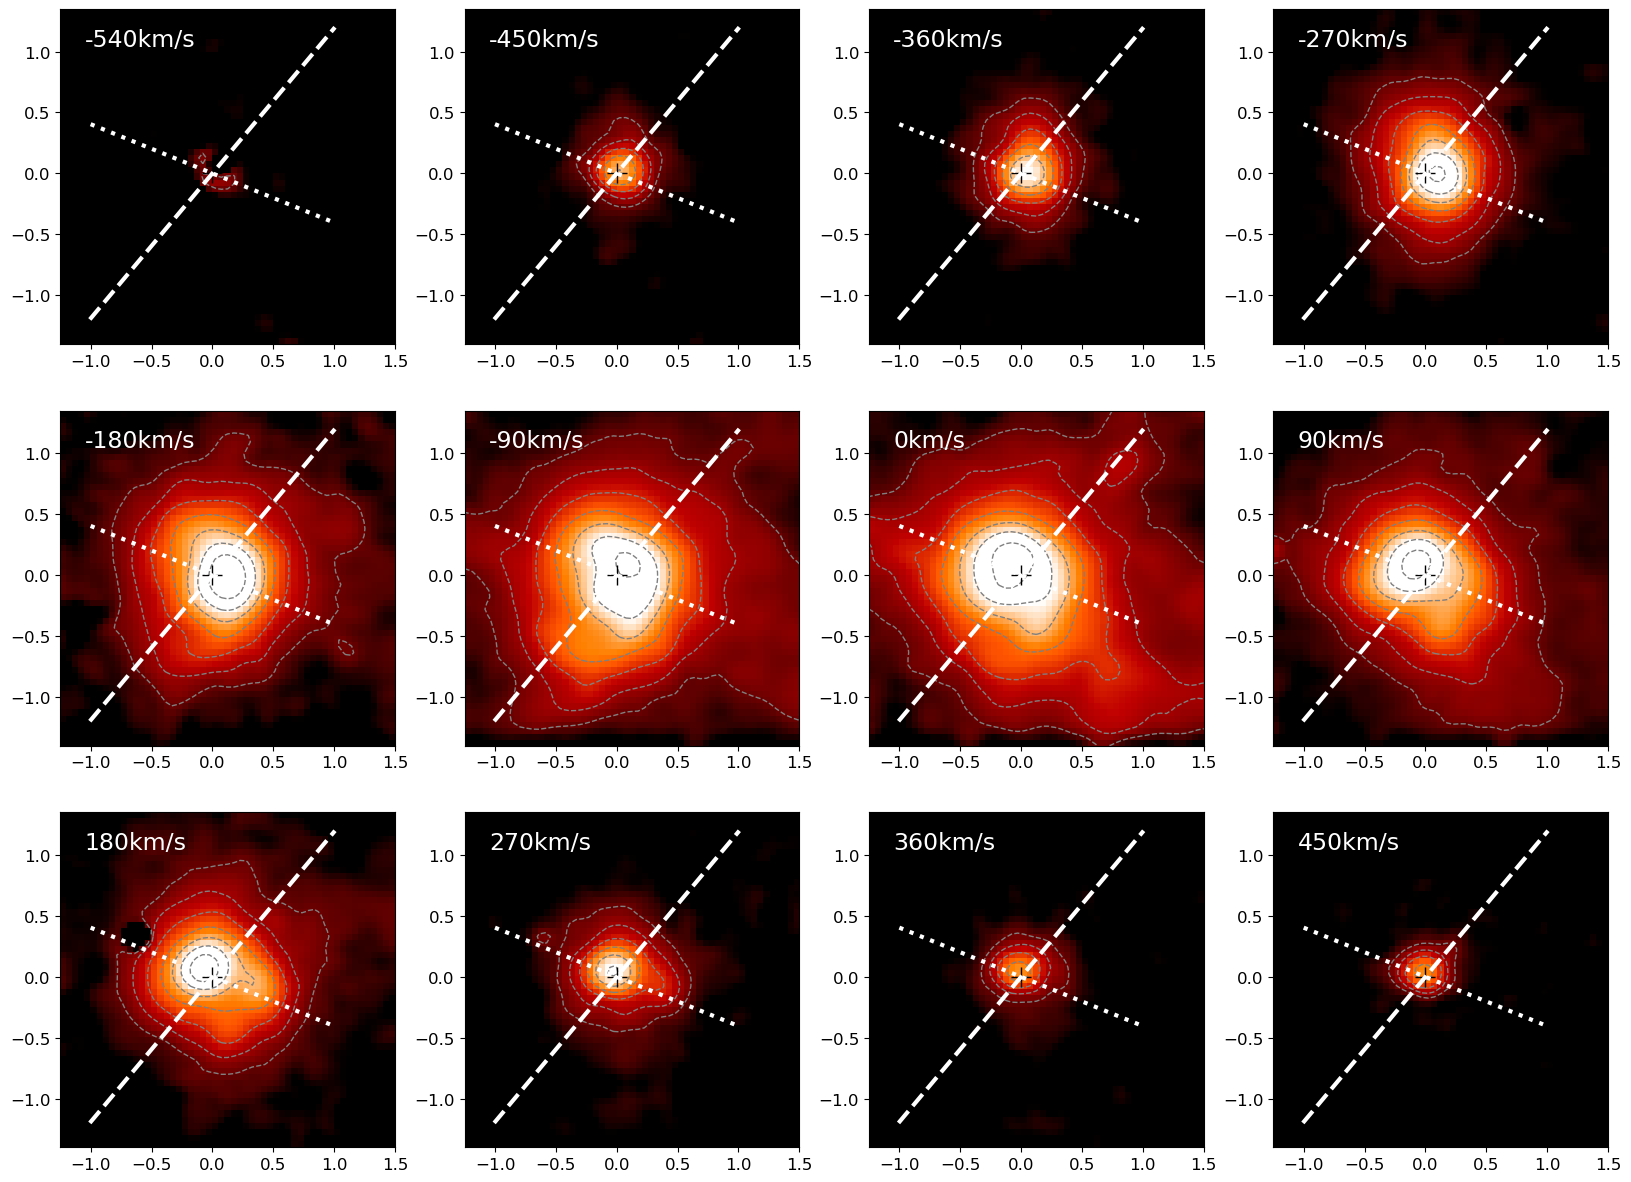
Figure 5 presents the [Fe ii]m/Pa, [Fe ii]m/[P ii]m, Hm/Pa line ratio and color excess maps. We estimate the color excess by:
| (1) |
where and are the fluxes of Pa and Br emission lines, respectively. We adopt the theoretical ratio between Pa and Br of , corresponding to case B at the low-density limit (Osterbrock & Ferland, 2006) for an electron temperature of K and we use the reddening law of Cardelli et al. (1989).
The [Fe ii]m/Pa and Hm/Pa can be used to investigate the origin of the [Fe ii] and H2 emission. Starburst galaxies and H ii regions present [Fe ii]m/Pa and Hm/Pa. For emission photo-ionized by an AGN typical values are: [Fe ii]m/Pa Hm/Pa, while higher ratios may indicate the contribution by shocks to the H2 and [Fe ii] emission (Reunanen et al., 2002; Rodríguez-Ardila et al., 2004; Rodríguez-Ardila et al., 2005; Riffel et al., 2010; Riffel et al., 2013a; Colina et al., 2015; Lamperti et al., 2017; Riffel, 2020). As seen in Fig. 5, both line ratios show a wide range of values. The smallest values of [Fe ii]m/Pa = 1–2 and Hm/Pa=0.5–1.0 are seen only in two small regions (05 diameter each) along PA=140/320∘ – at 13 northwest and 11 southeast of the nucleus, coincident with the orientation of the linear emission seen in Br and Pa. This indicates that the AGN photo-ionization plays some role in observed line emission from these locations and that the linear structure seen in the H recombination lines is tracing the AGN ionization axis. However, in most locations both line ratios show values much higher than commonly observed in AGN, in particular from locations away from the ionization axis.
The [Fe ii]m/Pa map shows values of up to 6, while Hm/Pa presents values higher than 5. Considering that most of the gray regions in these maps are due to the non-detection of Pa – as the H2 and [Fe ii] emission is clearly more extended in the maps of Fig. 4 – the highest ratios can be considered lower limits for the gray regions. This indicates that shocks play an important role not only in the production of the H2 emission, as pointed out in Scharwächter et al. (2013), but also in the [Fe ii] emission at least in locations away from the ionization cone.
Another line ratio that can be used as a tracer of shocks is [Fe ii]m/[P ii]m, as the P+ and Fe+ have similar ionization potential, radiative recombination coefficients, and ionization temperatures (Oliva et al., 2001; Storchi-Bergmann et al., 2009; Diniz et al., 2019). For H ii regions this line ratio is 2, while if shocks are present the [Fe ii] is enhanced as the shocks release the Fe from the dust grains (e.g. Oliva et al., 2001). Values of [Fe ii]m/[P ii]m cannot be reproduced by photo-ionization models (e.g., Riffel et al., 2019b) and indicate that shocks contribute to the origin of the [Fe ii] emission. For NGC 1275, this line ratio shows values larger than 2 in most locations and reaching [Fe ii]m/[P ii]m at distances of 05 from the nucleus. As [Fe ii] shows more extended emission than the [P ii], the value of 6 can be considered a lower limit for the [Fe ii]m/[P ii]m ratio in locations masked out due to the non-detection of [P ii] emission. This result further supports the importance of shocks for the [Fe ii] emission in NGC 1275.
The map (Fig. 5) shows values close to zero at most locations, in agreement with previous results that show that the extinction in the central region of NGC 1275 is low (e.g., Kent & Sargent, 1979; Fabian et al., 1984; Johnstone & Fabian, 1995). The highest values of up are seen at the nucleus and to the northwest of it, the same location where the H filaments are more concentrated and seen closer to the nucleus (e.g. Fabian et al., 2008).
4.2 Gas kinematics
A way to map the gas kinematics is by constructing velocity channel maps along the emission line profiles, which allows a better mapping of the emission at the wings (higher velocities). We show such maps for the [Fe ii] and H2 emission lines in Figures 6 and 7. We do not show channel maps for other emission lines, as the emission is weaker and the channel maps noisier. But it is possible to see that the Pa channel maps are similar to those of [Fe ii]. Each panel shows the fluxes integrated within a velocity bin of 90 km s-1, centred at the velocity shown in the top-left corner, relative to the systemic velocity of the galaxy. Both lines show emission in velocities up to 500 km s-1, seen both in blueshifts (negative velocities) and redshifts (positive velocities).
For velocities in the range from 180 to 180 km s-1, the peak of emission in the inner 03 moves from southwest in blueshifted channels to northeast in redshifted channels (clearly seen in the H2 channel maps). This structure is tracing the emission of the compact disk seen in both ionized and molecular gas with major axis oriented along (Scharwächter et al., 2013; Nagai et al., 2019). Besides this structure, in low velocity channels it can be seen that the H2 and [Fe ii] present distinct flux distributions. While the [Fe ii] presents most of the emission approximately along the orientation of the ionization axis (PA=140/320∘), the H2 emission is seen mainly in the perpendicular direction. At the highest velocities, both lines show the peak of emission at the nucleus and extended emission is seen to at least 05. We do not take into account the effect of the beam smearing in the determination of the extensions, but given that sizes of most structures are much larger than the angular resolution of our data (02) this effect is negligible.
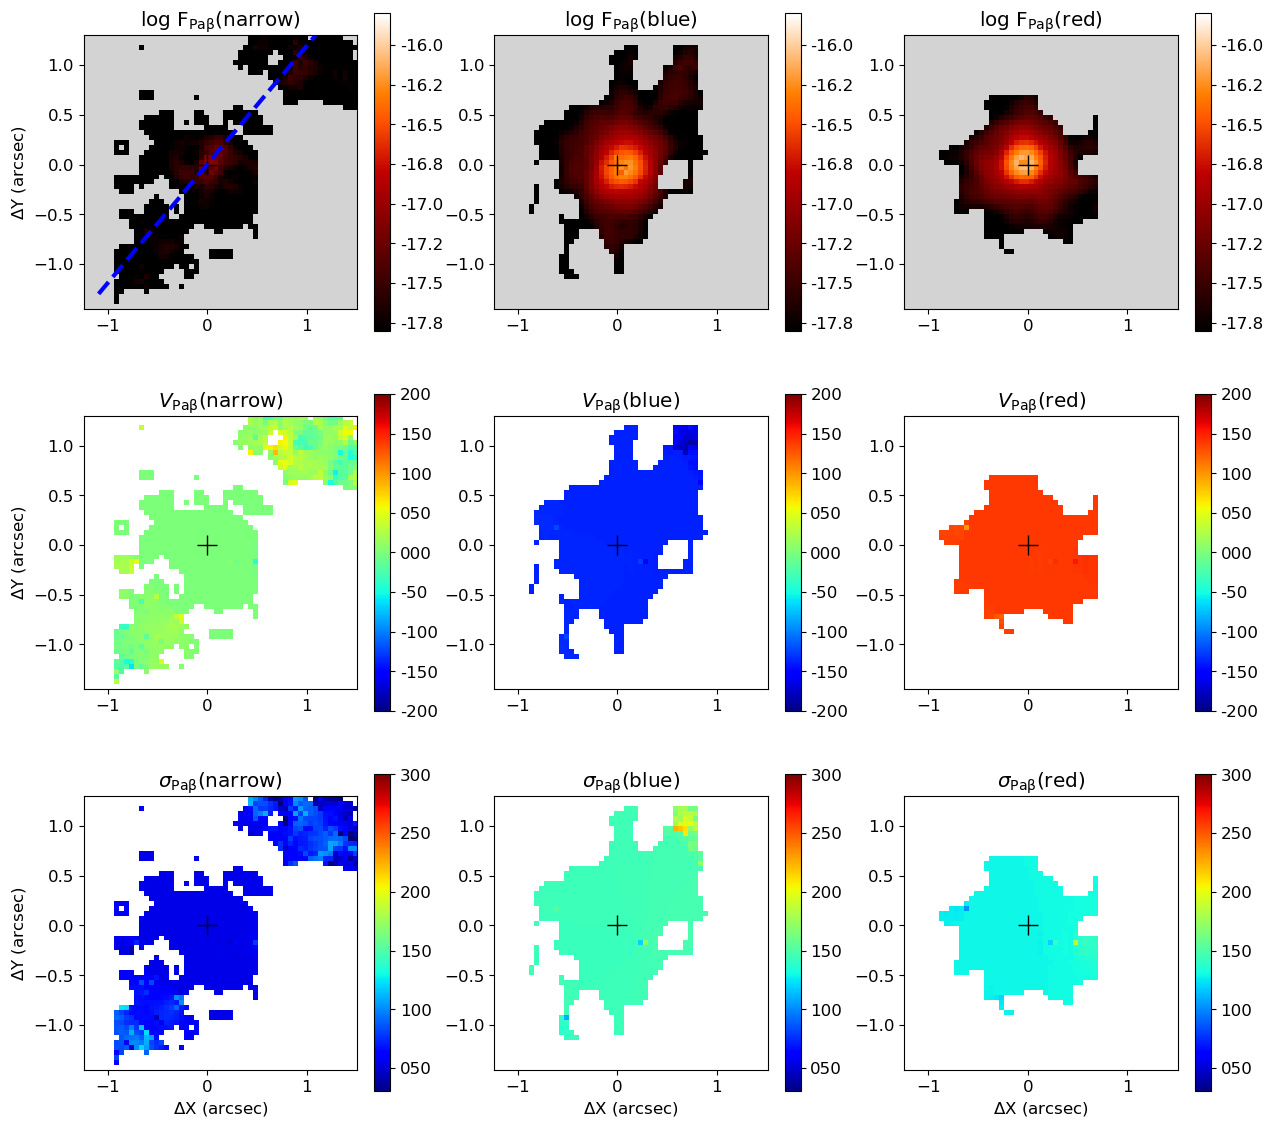
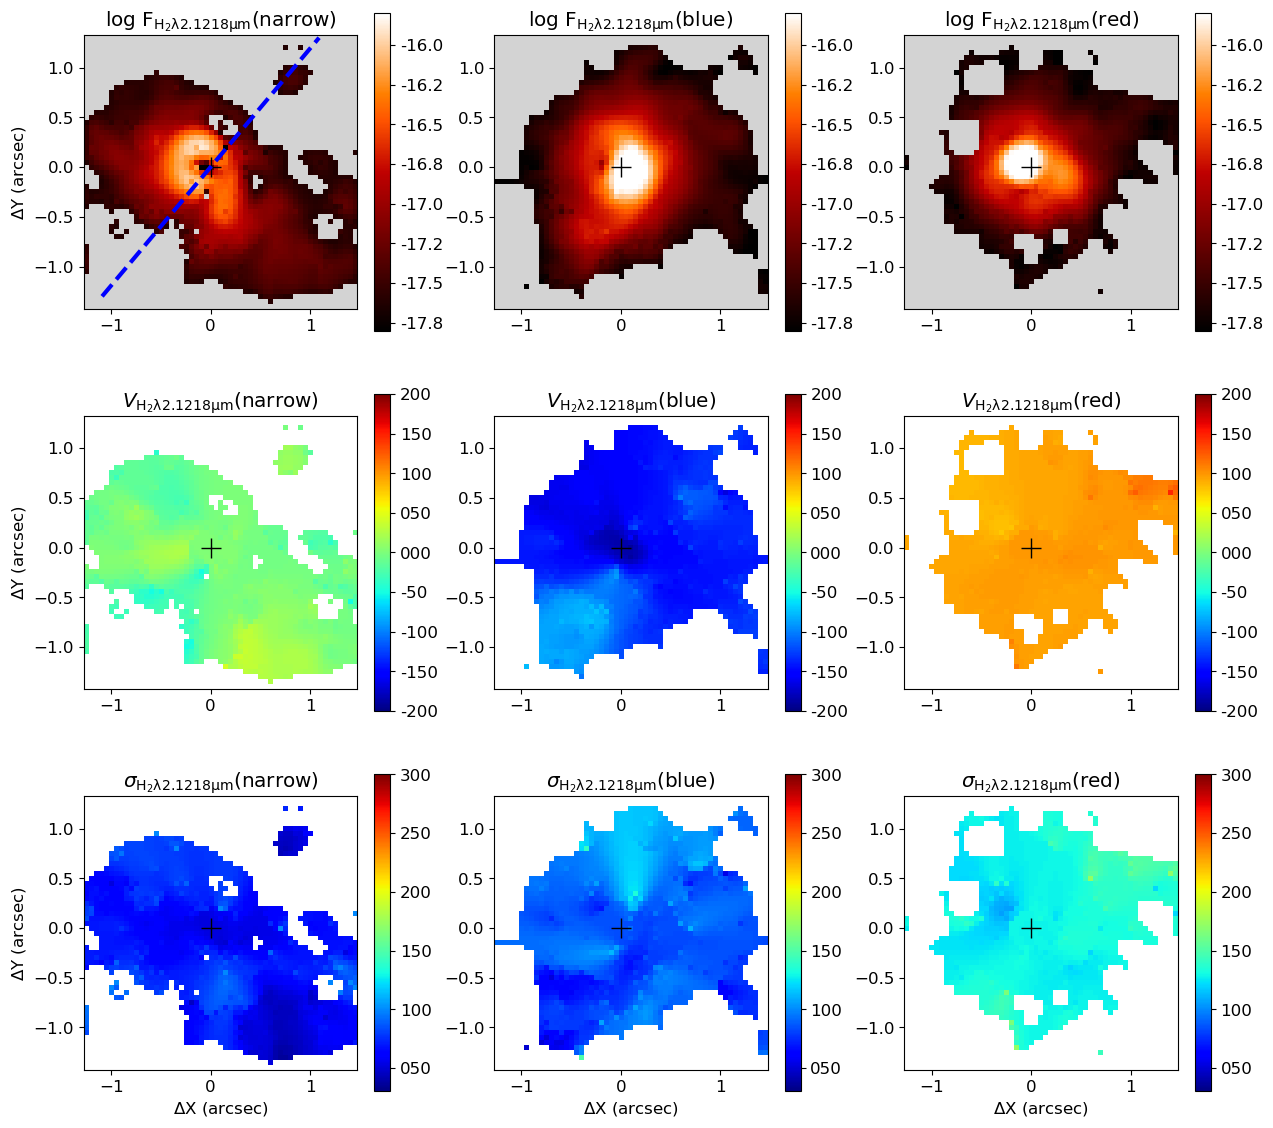
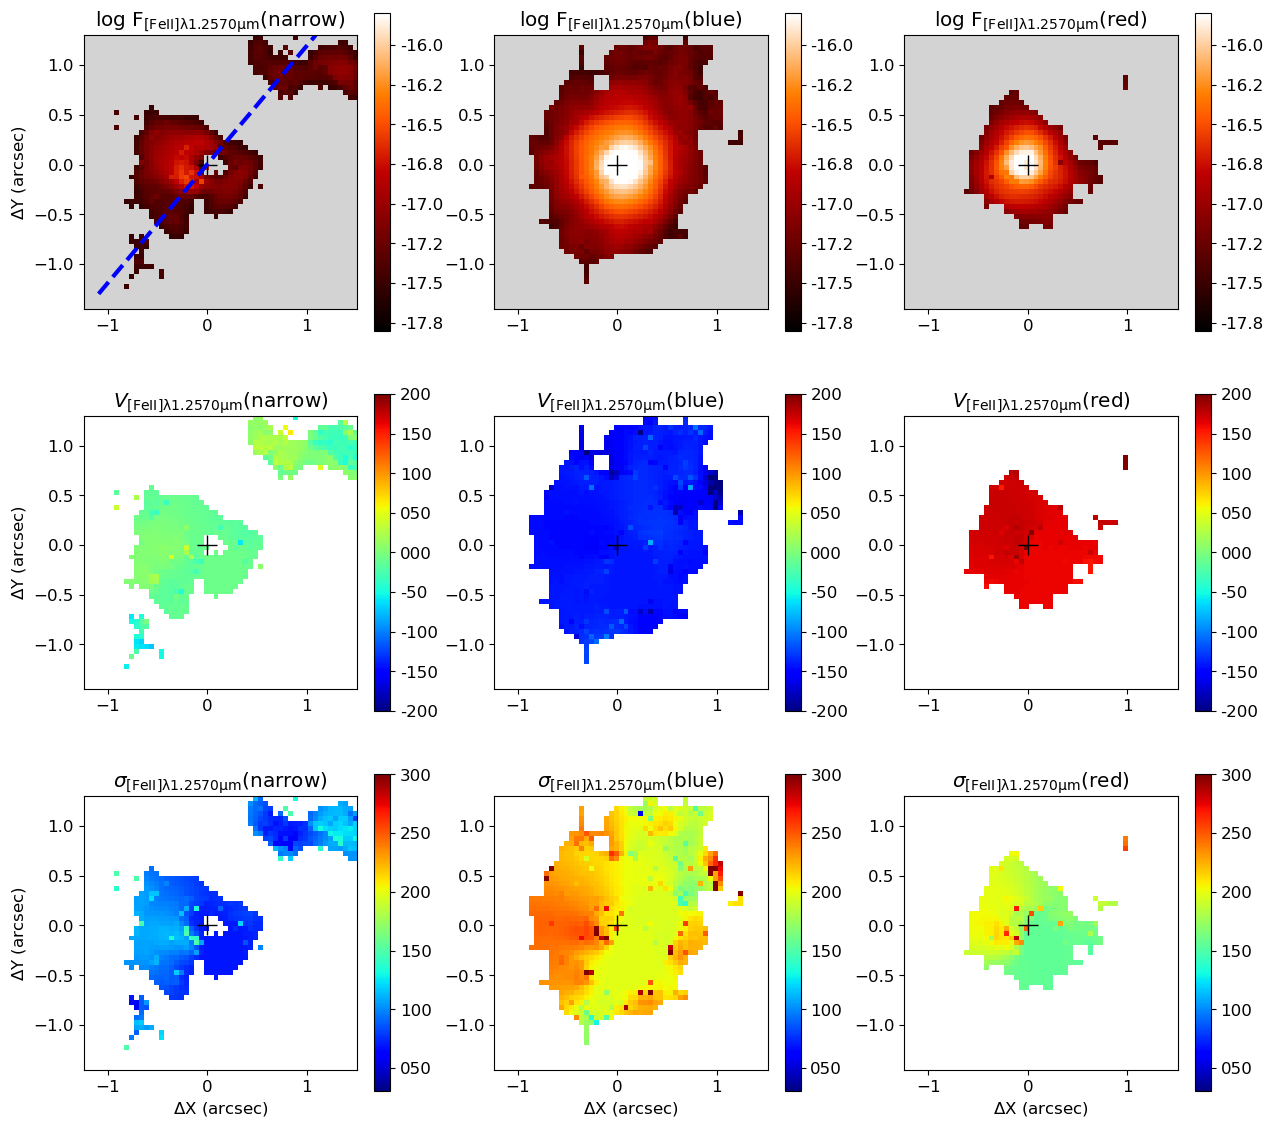
We also fit the emission-line profiles of [Fe ii]m, Pa and Hm by multi-Gaussian components, as described in Sec. 3.2. The resulting maps for flux, velocity and velocity dispersion are shown in Figs.8, 11 and 12. All lines present three kinematic components: a narrow (km s-1) and two broad components (km s-1) – see also Fig. 2. In addition, Pa presents a very broad component with spatially unresolved flux distribution produced by the emission of the BLR. The narrow component is observed at velocities close to the systemic velocity of the galaxy, while the broad components are observed blueshifted and redshifted by km s-1. The peak of the blueshifted component is slightly shifted to the southwest relative the nucleus and the redshifted components peaks slightly northeast of it, consistent with the compact rotating disk seen in the inner region of the galaxy.
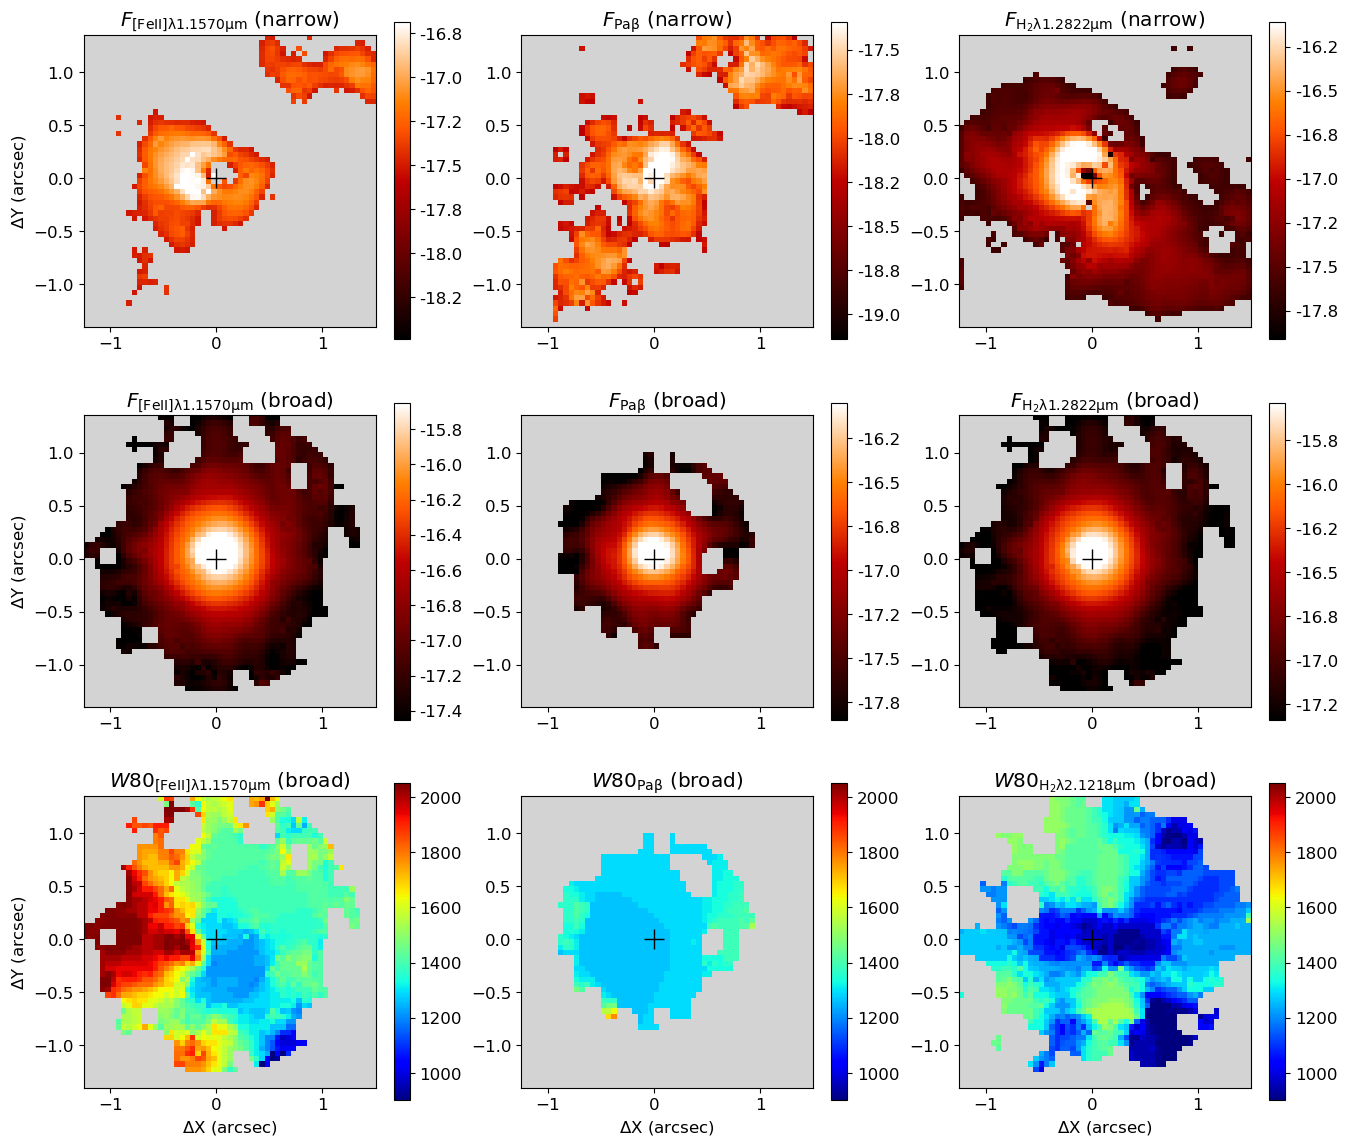
In Figure 9 we present the flux maps for the narrow and broad components of [Fe ii]m, Pa and Hm emission lines. The maps for the broad component are constructed by summing the fluxes of the blueshifted and redshifted broad components. The flux distributions of the narrow components of [Fe ii]m and Pa show a linear structure along PA=140/320∘, while the Hm presents narrow emission mostly perpendicular to the extended emission seen in ionized gas. As the narrow component presents low velocity dispersion and low velocities, its origin may be emission from the galaxy disk. The [Fe ii]m and Pa seem to be tracing emission of gas of the disk ionized by the AGN radiation, while most of the H2 emission originates away from the ionization axis, as seen in other nearby Seyfert galaxies (Storchi-Bergmann et al., 2009; Riffel et al., 2014a; May & Steiner, 2017). The broad component of all emission lines show similar behaviours with round flux distributions and centrally peaked emission. The [Fe ii] and H2 emission are observed over the inner 15, while the Pa shows emission only in the inner 10.
The bottom panels of Fig. 9 show the maps for the broad emission of [Fe ii]1.2570 m, Pa and H2.1218 m. We compute the values from the modeled spectra, after the subtraction of the contribution of the narrow component from the galaxy disk. All maps show values larger than 1 000 km s-1 in all regions. The smallest values are seen for H2, followed by Pa and the highest values of up to 2 000 km s-1 are seen for the [Fe ii], mostly to the east of the nucleus.
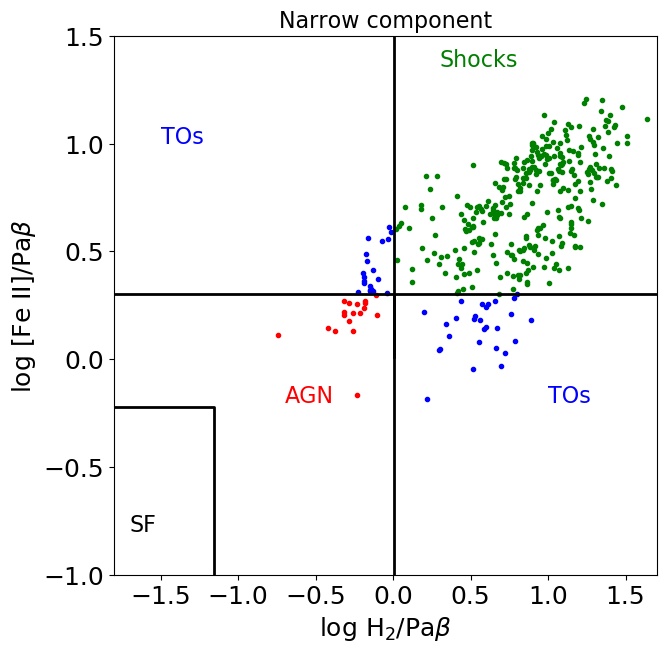
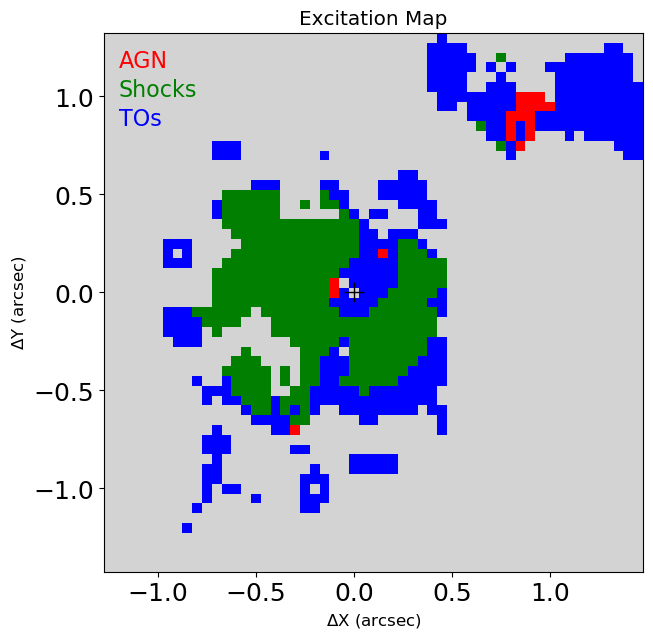
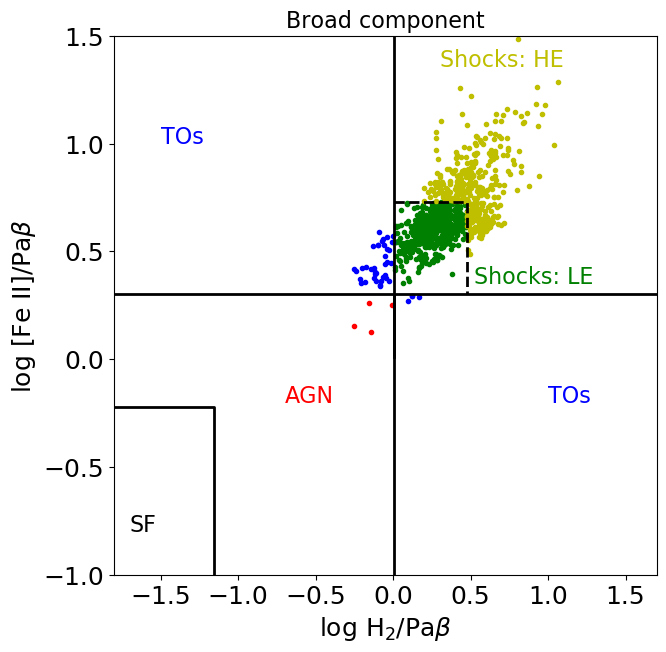
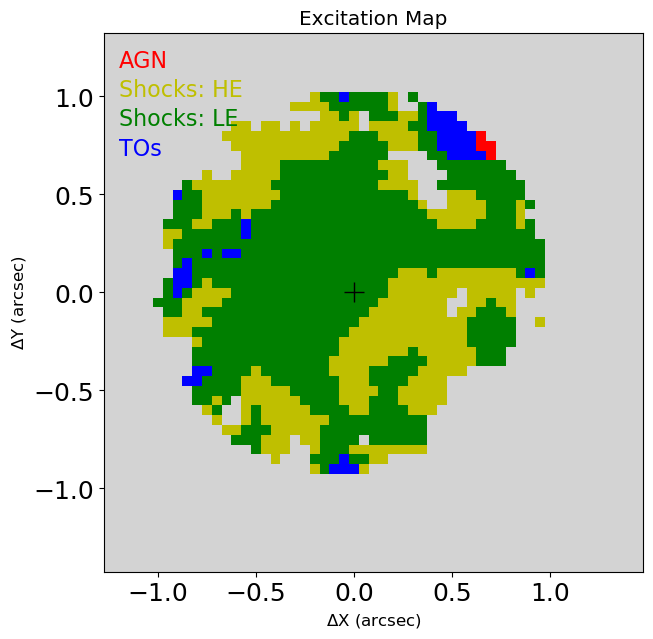
In Figure 10 we present the H2.1218m/Pa vs. [Fe ii]m/Pa line-ratio diagnostic diagrams for the narrow and broad components obtained using the fluxes shown in Fig. 9. The right panels of Fig. 10 show the color coded excitation maps, identifying the spatial location of each region of the diagram. We adopt the separation lines from Riffel et al. (2013a), based on long-slit spectroscopy of 67 emission-line galaxies. For the narrow component one or both line ratios are consistent with an AGN origin along the AGN ionization axis, while shocks seem to dominate the gas excitation in regions perpendicular to the ionization cone.
The line ratios for the broad component are consistent with emission produced by shocks in all locations. To separate between regions of high and low gas excitation, we compute the 75th percentile () of the H2.1218m/Pa and [Fe ii]m/Pa line ratios of points in the shock region of the diagram, and obtain log (H2.1218m/Pa)=0.47 and ([Fe ii]m/Pa)=0.73. The limits delineated by these values are shown as a dashed line the in diagnostic diagram for the broad component.
5 Discussion
5.1 The supermassive black hole mass
The mass of the black hole of NGC 1275 is M⊙, as obtained by modeling the H2 (Scharwächter et al., 2013) and CO(2–1) kinematics (Nagai et al., 2019) and adopting a disk inclination of . This dynamical mass is about two orders of magnitude larger than that obtained from measurements of the very broad components (from the BLR) of near-infrared recombination lines and X-ray luminosity ( M⊙ Onori et al., 2017).
Onori et al. (2017) measure the near-infrared line widths using the spectrum from Riffel et al. (2006b) and obtain FWHM km s-1 for Pa and FWHM km s-1 for He i1.083 m. Using a spectrum obtained by integrating the NIFS J-band datacube within an aperture of 025 radius centred at the nucleus, we measure FWHM km s-1 for the very broad component of Pa, which is about two times the value of Onori et al. (2017). The low values measured by Onori et al. (2017) can be due to the fact that the very broad components of He i1.083 m and Pa are weak and strongly blended with the narrow line emission in the spectrum of Riffel et al. (2006b). The very broad component of the Pa emission line is strong in their spectrum and we measure FWHM km s-1, which is consistent with the value measured for Pa using our NIFS data. Our value of FWHM is also in good agreement with recent results for the broad component of H i recombination lines (Punsly et al., 2018). Using our measurement of FWHM, together with the X-ray luminosity of the point source and equation 1 of Onori et al. (2017), we obtain M⊙. The mass of the supermassive black hole can also be estimated using the width of the Pa line and near-infrared luminosity (Landt et al., 2013). We measure at 1.15 m integrated within 025 radius from the nucleus. Using this value, together with FWHM km s-1, estimated above, and equation 2 from Landt et al. (2013) we estimate M⊙, which is consistent with the value obtained using the X-ray luminosity, but about one order of magnitude smaller than the dynamical determinations.
Using our measurement of the stellar velocity dispersion – – and the calibration of Kormendy & Ho (2013), we obtain M⊙, which is in good agreement with the dynamical determinations (Scharwächter et al., 2013; Nagai et al., 2019). The origin of discrepancy between the values of measured using scaling relations with line widths and luminosities and those obtained from the relation and gas dynamics is unclear and beyond the scope of this work, but could be related to the uncertainties in calibration of the distinct methods.
5.2 The compact disk
NGC 1275 is one the most studied Seyfert galaxies. These studies include results from near-IR integral field spectroscopy that can be directly compared with our new maps for the inner 500 pc of the galaxy. The most prominent kinematic feature, revealed by these studies is a compact rotating disk in the inner 100 pc of the galaxy, seen both in ionized and hot molecular gas (Wilman et al., 2005; Scharwächter et al., 2013). The cold counterpart of this disk is detected by recent observations of CO(2–1) line using the ALMA (Nagai et al., 2019). The major axis of the disk is oriented along PA=68∘ and the line-of-sight velocity amplitude is 150 km s-1 and a mass of gas of M⊙ (Scharwächter et al., 2013; Nagai et al., 2019).
As in previous works, the kinematic component attributed to a compact disk is observed in our data (e.g. Fig. 7), which shows that the peak of emission in the inner 03 moves from southwest to northeast for velocities in the range from 180 to 180 km s-1). By fitting the emission-line profiles by a single Gaussian components, we obtain velocity fields very similar to those presented by Scharwächter et al. (2013), and thus we do not present them in this paper. Alternatively, the kinematic component previously identified as a compact disk could be a misinterpretation of the results due to a simplified approach in the modeling of the shape of the observed line, i.e. a single Gaussian, which is clearly not the best model for the observed near-IR line profiles. In this case, the interpretation of the multi-Gaussian components would be straightforward, with the narrow component due to an almost face on disk partially illuminated by the AGN radiation and the two broad components due to a centrally driven outflow.
5.3 AGN ionization structure
Besides confirming previous results, our new data set and analysis reveal new kinematic and morphological structures in the inner region of NGC 1275, leading to a breakthrough in our understanding of the nature of its central AGN. Here, we focus our discussion on these new findings, rather than on the previous known results. We find extended narrow line ( km s-1) emission from the ionized gas along PA=140/320∘, which seems to be tracing the AGN ionization axis and its surroundings (Fig. 9). Indeed, the Hm/Pa vs. [Fe ii]m/Pa diagnostic diagram (Fig. 10) for the narrow component suggest some contribution of the AGN radiation in the production of the observed line emission. Along the major axis of the disk (NW–SE), higher values are observed for both ratios with [Fe ii]m/Pa > 2 and Hm/Pa>1, indicating some contribution of shocks in the disk. However, as the overlap region between locations of H2, [Fe ii] and Pa emission is small, we have to be cautious with conclusions based on these line ratios for the narrow component. The structure of this extended emission resemble an ionization cone with an opening angle of 50∘, with an axis tilted by 20∘ relative to the orientation of the radio jet (Pedlar et al., 1990) and is approximately orthogonal to the orientation of the compact disk, suggesting that the inner parts of the disk are responsible for obscuration of the AGN radiation.
We find that the radio jet and ionization axes are almost perpendicular to the compact disk. Whether or not there is an actual physical connection between the disk (and the dusty torus) and the jet is still an open question. In a steady growth of a black hole via accretion along a preferred plane, the orientation of the radio jet is expected to be perpendicular to that of the disk (Drouart et al., 2012; Bianchi et al., 2012; Marin & Antonucci, 2016). Although we find that the jet and the ionization structure present similar projected orientation and are perpendicular to the disk, we do not find any clear evidence of jet-cloud interaction in the ionized and molecular gas distribution and kinematics. Indeed, the orientations of the AGN ionization axis and radio jet are very difficult to measure and uncertain.
The H2 presents narrow-line emission (top-right panel of Fig. 9), mostly perpendicularly to the ionization axis and along the same orientation of the major axis of the compact disk (PA=68∘). The narrow component of all emission lines is observed at velocities close to the systemic velocity of the galaxy. A possible interpretation for this kinematic structure is that it is due to the outer regions of the compact disk. To account for the small velocities, the disk at larger distances must be slightly warped relative to the orientation of the compact disk. Fujita & Nagai (2017) find that the sub-pc scale radio jet is inclined by 65∘ relative to the line-of-sight and if the compact disk is perpendicular to this structure (, relative to the plane of the sky), a small warping in the outer regions could account for the low line-of-sight velocities. In addition, precession of the radio jet in NGC 1275 has been suggested as the origin of its large scale X-ray cavities (e.g., Falceta-Gonçalves et al., 2010), and thus a misalignment between the inner and outer discs seems to be very likely. The fact that the H2 and ionized gas emission are seen mostly perpendicular to each other may be due to dissociation of the H2 molecule within the ionization cone by the AGN radiation field, as seen in other well studied nearby Seyfert galaxies (e.g., Storchi-Bergmann et al., 2009; Riffel et al., 2014a; Shimizu et al., 2019).
5.4 Shocks and outflows
Previous studies of NGC 1275 indicate that the hot H2 emission originates from thermal excitation caused by shocks (Krabbe et al., 2000; Rodríguez-Ardila et al., 2005; Wilman et al., 2005; Scharwächter et al., 2013), which is consistent with our data. Scharwächter et al. (2013) find that the origin of the [Fe ii] line emission is consistent with X-ray heating of the gas with an electron density of 4 000 cm-3, but based only on H and K-band emission lines, they could not rule out the contribution of fast shocks. The J band data allowed us to map the [Fe ii]m/[P ii]m and [Fe ii]m/Pa line ratios, and their high values indicate that shocks indeed play an important role in the production of the [Fe ii] emission in NGC 1275 (e.g., Oliva et al., 2001; Reunanen et al., 2002; Rodríguez-Ardila et al., 2004; Colina et al., 2015). In particular, the [Fe ii]m/[P ii]m ratio is very sensitive to shocks as the ions have similar ionization potentials and recombination coefficients, and both lines have similar excitation temperatures. In objects were the lines are produced by photo-ionization, the Fe is locked into dust grains and the [Fe ii]m/[P ii]m, while if shocks are present they release the Fe from the grains, enhancing its abundance and line intensity (Oliva et al., 2001; Storchi-Bergmann et al., 2009; Riffel et al., 2014a). In supernova remnants, where shocks dominates the [Fe ii] excitation, this line ratio can be as high as 20 (Oliva et al., 2001). In NGC 1275, the [Fe ii]m/[P ii]m map (Fig. 5) presents values larger than 2 in all locations, indicating that shocks contribute to the observed [Fe ii] emission, but the ratios are never as high as 20, suggesting that shocks are not the only excitation mechanism. Considering only the fluxes of the broad component, we find that Hm/Pa and [Fe ii]m/Pa line ratios are consistent with emission produced by shocks in all regions. As shown in the excitation map of Fig. 10, the gas of higher excitation is observed mainly perpendicular to the ionization cone. This can be explained if the gas is affected both by shocks and by photo-ionization, than photo-ionization dominates line excitation as shocks are not efficient line emitters. So, the shocks signatures are easily observed where the gas is not photo-ionized, producing the observed morphology. Alternatively, the higher gas excitation perpendicularly the ionization cone can be interpreted as an being produced by shocks due to equatorial AGN winds, as suggested by theoretical recent outflowing torus models (e.g. Elitzur, 2012).
For H2, we find that the emission lines are narrower than the [Fe ii] lines (e.g., Figs. 2 and 9), indicating that they do not originate in the same regions, in spite of the strong correlation between the H2 and [Fe ii] line luminosities observed in samples of ultra-luminous infrared galaxies (Hill & Zakamska, 2014) and nearby AGN (Riffel et al., 2006b) using single aperture spectra. One possibility to explain both the correlation between the line luminosities in previous works and the differences between the H2 and [Fe ii] line line widths is that H2 is dissociated by shocks (or AGN radiation) in the region where the [Fe ii] emission is produced, but it is excited in a region very close to the [Fe ii] emission zone. Assuming that the [Fe ii] emission arises from a lower density gas, close to the cloud edges, and the H2 from a region with higher density and more distant from the cloud edges, one would expect lower line widths for the H2 and a correlation between the H2 and [Fe ii] fluxes, if the lines are excited in the same way.
Another striking kinematic component revealed by our analysis is the broad component (km s-1) observed in all emission lines and fitted by two Gaussian functions, one blueshifetd by km s-1 and the other redshifted by similar velocities. Unlike what is observed for the narrow component, the flux distributions for the broad component do not show any preferred orientation: all lines present a round, centrally peaked flux distributions (see Fig.9).
The maps for the broad component (Fig.9) can be used to investigate its origin. Values larger than 1 000 km s-1 are observed at all locations, with the highest values of up to 2 000 km s-1 seen for the [Fe ii]1.2570 m to the northeast of the nucleus. For a pure Gaussian line profile, (Zakamska & Greene, 2014). For NGC 1275, we derive a stellar velocity dispersion of km s-1 (see Fig.3), which corresponds to km s-1. As the gas shows values much larger than the stellar , the kinematics of the broad component cannot be explained by gas motions due to the gravitational potential of the galaxy. High values of observed in ionized gas emission lines are commonly interpreted as being due to AGN driven winds (e.g. Wylezalek et al., 2020), which is the most likely scenario for NGC 1275 as it hosts a strong AGN – (Woo & Urry, 2002). These outflows may be responsible for providing the shocks necessary to produce the observed line emission of H2 and [Fe ii], as mentioned above.
5.5 Geometry of the outflows
The broad-line component presents a round, centrally peaked flux distribution and the velocities of the blueshifted and redshifted components are almost constant over the NIFS field of view (see middle panels of Figs. 8, 11 and 12). The round emission-line flux distributions suggest that the outflows present a spherical geometry. Our maps show the highest values surrounding the nucleus at 05–10 and the maps do not show a smooth variation as seen in the emission-line flux distributions. However, in the inner 5 radius there is a contribution of the compact rotating disk, which may decrease the in these region and the outflow may interact with the gas of the disk producing knots of enhanced values. From the multi-Gaussian fit, we find that in the inner 5 radius the redshifted component to the northeast and the blueshifted component to the southwest may be due to the emission of the compact disk. These components seem to be outshining the outflow component from these locations. The most prominent structure in the map for the [Fe ii] (Fig. 9) is the region of larger values to the northeast of the nucleus. This structure is approximately along the orientation of the disk and a possible interpretation is that it is produced by the interaction of the outflows with the gas of the disk. Thus, the spherical geometry seems to be consistent with both the emission-line flux distribution and kinematics observed in the inner region of NGC 1275. In addition, this geometry is consistent with theoretical studies and numerical simulations of the AGN driven winds that produce sub-relativistic, wide-angle winds (e.g., Silk & Rees, 1998; Ramos Almeida & Ricci, 2017; Giustini & Proga, 2019).
In addition, the H2 presents overall lower values than the [Fe ii]. A possible explanation for this behaviour is that the [Fe ii] emission is produced in a region closer to the shock front, while the H2 emission would be produced in a shell of denser gas outwards. This is consistent with shock models used to describe the H2 molecule formation from H2 luminous galaxies, in which the post-shock medium is observed to be multiphase, with H2 gas coexisting with a hot X-ray emitting plasma, (e.g., Guillard et al., 2009) as observed in NGC 1275 (e.g Sanders et al., 2016).
5.6 Power of the outflows and implications
From the observed gas kinematics we can derive the mass-outflow rate and kinetic power of the outflows. The mass-outflow rate can be determined by
| (2) |
where is the proton mass, is the electron density, is the velocity of the outflow, is the filling factor, is the area of the outflow cross section and the factor 1.4 is to account for elements heavier than H. The filling factor can be estimated by
| (3) |
where is the Pa luminosity emitted by a volume and is the Pa emission coefficient. For the low-density limit and a temperature of 10 000 K, erg cm-3 s-1 (Osterbrock & Ferland, 2006). Replacing in the equation for , we obtain
| (4) |
To estimate we assume that the outflows are spherical with a radius of 09 ( pc), defined as the radius that enclose 90 % of the flux of the Pa emission line. A similar definition was used by Fischer et al. (2018) and it is worth mention that it is similar to the value (200 pc) derived by Baron & Netzer (2019) for the peak of the distribution of the location of outflows in 1700 type 2 AGN based on modeling of their spectral energy distribution. We adopt cm-3, a typical value of the electron density measured for AGN based on the [S ii] emission lines (e.g., Dors et al., 2014) and erg s-1, by integrating the fluxes of the broad Pa components. Following previous spatially resolved studies of outflows (Riffel et al., 2013b; Diniz et al., 2019; Shimizu et al., 2019; Muñoz-Vergara et al., 2019; Soto-Pinto et al., 2019; Fischer et al., 2019; Gnilka et al., 2020), we use the measured centroid velocity of the broad components as the velocity of the outflow: km s-1 (see middle panels of Figs. 8, 11 and 12). This velocity traces the bulk of the outflowing gas. Under these assumptions we obtain M⊙ yr-1 in ionized gas. The bolometric luminosity of the AGN in NGC 1275 is erg s-1 (Woo & Urry, 2002) and with the derived , NGC 1275 falls very close to the wind scaling relations for ionized gas in AGN (Fiore et al., 2017; Shimizu et al., 2019).
As we observe similar “bulk" velocities for the molecular and ionized gas outflows (although the ionized gas traces more turbulent clouds, as indicated by the higher values), we can estimate the outflow in hot molecular gas by multiplying by the ratio of the masses of hot molecular and ionized gas. The total mass of ionized gas in the outflow can be estimated by
| (5) |
where is the luminosity of the region that is in outflow As in Eq. (4), we assume the low-density limit and a temperature of 10 000 K and include a factor 1.4 to account for heavier elements (Scoville et al., 1982; Osterbrock & Ferland, 2006; Storchi-Bergmann et al., 2009). Using the parameters above, we estimate . The mass of hot molecular gas is given by
| (6) |
where is the luminosity of the Hm emission line and this equation is derived under the assumption that the H2 emitting gas is in thermal equilibrium (Scoville et al., 1982; Riffel et al., 2008; Schönell et al., 2019). Integrating the flux of the broad H2 emission over the NIFS field of view, we estimate erg s-1 and thus .
The mass outflow rate in hot molecular gas is . In nearby AGN (), the hot molecular gas emission is usually dominated by gas rotating in the galaxy disk (Davies et al., 2014; Riffel et al., 2018; Storchi-Bergmann & Schnorr-Müller, 2019), while molecular outflows are still scarce (Riffel et al., 2006a, 2014b, 2015b; Diniz et al., 2015; May & Steiner, 2017; Shimizu et al., 2019) and the derived for NGC 1275 is in the range of values in these previous studies.
However, the hot molecular gas represents only a small fraction of the total amount of molecular gas – the amount of cold molecular gas is usually times larger than that of hot molecular gas (Dale et al., 2005; Müller Sánchez et al., 2006; Mazzalay et al., 2013). For the disk component, we estimate a mass of hot molecular gas of 3500 M⊙ using the integrated flux of H2 2.1218 m for the narrow component (Fig. 9) and Eq. 6, while mass of cold molecular gas in the disk is M⊙ (Nagai et al., 2019). Thus, the ratio between the masses of cold and hot molecular gas in the compact disk of NGC 1275 is in agreement with the measurements for other galaxies. On kpc scales, NGC 1275 is known to present large amount (1010 M⊙) of molecular gas (Salomé et al., 2006; Lim et al., 2008). If the outflow component presents a similar relation between the amount of hot and cold molecular gas than that for the disk component, the total outflow rate in molecular gas in NGC 1275 may be much larger than the value estimated above and compatible with those derived for powerful AGN and ultra luminous infra-red galaxies of up to 103 M⊙ yr-1 (e.g., Veilleux et al., 2013; Lutz et al., 2019). Such outflows are massive and powerful enough to provide significant AGN feedback as requested by numerical simulations (Di Matteo et al., 2005; Harrison, 2017) to describe the evolution of galaxies. Indeed, ALMA observations of NGC 1275 reveal fast molecular outflows as absorption features in the dense gas tracers HCN(3–2) and HCO+(3–2), while the CO(2–1) emission is dominated by the compact molecular disk (Nagai et al., 2019), which could be outshining the outflowing material. Alternatively, it is possible that the outflowing molecular gas is shock-heated to temperatures much higher than the typical ISM values, in which case the hot-to-cold ratio for the outflow could be atypically large and therefore the cold molecular gas outflow rate could be small.
From the mass-outflow rate and the observed kinematics, we can derive the kinetic power of the outflows by , where is the velocity dispersion of the outflow, which can be estimated by . Adopting km s-1, a median value for the [Fe ii]m (Fig. 9), we obtain erg s-1. This value is only 0.05 per cent of the AGN bolometric luminosity and thus, the ionized outflows are not powerful enough to affect the evolution of the galaxy, as outflows with kinetic powers of at least 0.5 % of the AGN luminosity are effective in suppressing star formation in the host galaxy (Hopkins & Elvis, 2010). On the other hand, if we extrapolate our result for the hot molecular outflow to the cold molecular gas, the kinetic power of the cold molecular outflows would be a few per cent of the AGN bolometric luminosity and thus being powerful enough to affect the evolution of the galaxy. In addition, numerical simulations show that the kinetic energy corresponds to less than 20 per cent of the total energy of the outflow (Richings & Faucher-Giguère, 2018), and thus the total power of the outflow in NGC 1275 is at least 5 times larger than the values derived above.
NGC 1275 is a massive, cD galaxy, with a stellar mass of M⊙ and an effective radius of 6.41 kpc (Mathews et al., 2006). Assuming that the stellar mass is 15 per cent of the total mass of the galaxy, we estimate the escape velocity to be km s-1. Thus, the velocities of the outflows in NGC 1275 are smaller than its escape velocity, implying in a “maintenance mode" feedback, where the outflows re-distribute the gas within the galaxy, but it still remains available for further star formation. In addition, our data reveal that shocks due to the AGN winds in NGC 1275 play an important role in the excitation of the observed H2 and [Fe ii] emission.
6 Conclusions
We use Gemini NIFS adaptive optics observations to map the near-IR emission-line flux distribution and kinematics of the inner 500 pc radius of NCG 1275 at a spatial resolution of 70 pc. Our main conclusions are:
-
•
From the fitting of the K-band CO absorption features, we derive a stellar velocity dispersion of km s-1 (within a ring with inner radius of 075 and outer radius of 125), which represents the first measurement of based on near-IR spectra. Using the relation we estimate a mass for the SMBH of M⊙, in good agreement with previous dynamical measurements.
-
•
The emission-line profiles of the molecular and ionized gas present multi-kinematical components: one narrow km s-1), attributed to gas orbiting in the galaxy disk and two broad km s-1), one blueshifted and another redshifted, attributed to an spherical outflow.
-
•
The flux distributions of the narrow-line component ( km s-1) of the ionized and molecular gas are distinct. While the ionized gas emission is observed surrounding the nucleus and extending along the AGN ionization axis (PA=140/320∘), the molecular emission is observed perpendicularly to it, following the orientation of the compact disk previously observed in the inner 100 pc.
-
•
The narrow-line component presents velocities close to the systemic velocity of the galaxy in all locations. Combined with the corresponding flux distributions, lead to the interpretation that this component is tracing the emission of an almost face on disk, perpendicular to the AGN axis. The AGN radiation seems to be responsible for the dissociation of the H2 molecule in locations close to the ionization axis.
-
•
The outflow is seen as broad line components with velocities of up to 2 000 km s-1. The emission-line flux distribution of outflowing gas is round and centrally peaked and is well reproduced by two Gaussian-functions, one blueshifted by 150–200 km s-1 and the other redshifted by similar velocities, relative to the systemic velocity of the galaxy.
-
•
From the emission line-ratios we find that shocks originated in AGN winds plays are the dominant production mechanism of the observed line emission in the inner 500 pc, while a small contribution of AGN radiation is seen along the ionization axis.
-
•
We derive a mass outflow-rate in ionized gas of 1.6 M⊙ yr-1 and a kinetic power of erg s-1. In hot molecular gas, we find outflows at yr-1, which could represent only a small fraction of the total molecular outflows, possibly dominated by colder gas phases.
-
•
The velocities and kinetic powers of the hot molecular () and ionized () outflows are not high enough to provide significant AGN feedback. The outflows are only able to redistribute the gas in the galaxy.
Acknowledgements
We thank an anonymous referee for useful suggestions which helped to improve the paper. RAR, TSB and RR thank CNPq, FAPERGS and CAPES for finacial supporting. This study was financed in part by Conselho Nacional de Desenvolvimento Científico e Tecnológico (202582/2018-3, 304927/2017-1 and 400352/2016-8) and Fundação de Amparo à pesquisa do Estado do Rio Grande do Sul (17/2551-0001144-9 and 16/2551-0000251-7). Based on observations obtained at the Gemini Observatory, which is operated by the Association of Universities for Research in Astronomy, Inc., under a cooperative agreement with the NSF on behalf of the Gemini partnership: the National Science Foundation (United States), National Research Council (Canada), CONICYT (Chile), Ministerio de Ciencia, Tecnología e Innovación Productiva (Argentina), Ministério da Ciência, Tecnologia e Inovação (Brazil), and Korea Astronomy and Space Science Institute (Republic of Korea). This research has made use of NASA’s Astrophysics Data System Bibliographic Services. This research has made use of the NASA/IPAC Extragalactic Database (NED), which is operated by the Jet Propulsion Laboratory, California Institute of Technology, under contract with the National Aeronautics and Space Administration. The Pan-STARRS1 Surveys (PS1) and the PS1 public science archive have been made possible through contributions by the Institute for Astronomy, the University of Hawaii, the Pan-STARRS Project Office, the Max-Planck Society and its participating institutes, the Max Planck Institute for Astronomy, Heidelberg and the Max Planck Institute for Extraterrestrial Physics, Garching, The Johns Hopkins University, Durham University, the University of Edinburgh, the Queen’s University Belfast, the Harvard-Smithsonian Center for Astrophysics, the Las Cumbres Observatory Global Telescope Network Incorporated, the National Central University of Taiwan, the Space Telescope Science Institute, the National Aeronautics and Space Administration under Grant No. NNX08AR22G issued through the Planetary Science Division of the NASA Science Mission Directorate, the National Science Foundation Grant No. AST-1238877, the University of Maryland, Eotvos Lorand University (ELTE), the Los Alamos National Laboratory, and the Gordon and Betty Moore Foundation.
References
- Abdo et al. (2009) Abdo A. A., et al., 2009, ApJ, 699, 31
- Armus et al. (2007) Armus L., et al., 2007, ApJ, 656, 148
- Baron & Netzer (2019) Baron D., Netzer H., 2019, MNRAS, 482, 3915
- Bianchi et al. (2012) Bianchi S., Maiolino R., Risaliti G., 2012, Advances in Astronomy, 2012, 782030
- Burtscher et al. (2015) Burtscher L., et al., 2015, A&A, 578, A47
- Cappellari (2017) Cappellari M., 2017, MNRAS, 466, 798
- Cappellari & Emsellem (2004) Cappellari M., Emsellem E., 2004, PASP, 116, 138
- Cardelli et al. (1989) Cardelli J. A., Clayton G. C., Mathis J. S., 1989, ApJ, 345, 245
- Chambers et al. (2016) Chambers K. C., et al., 2016, arXiv e-prints, p. arXiv:1612.05560
- Colina et al. (2015) Colina L., et al., 2015, A&A, 578, A48
- Conselice et al. (2001) Conselice C. J., Gallagher John S. I., Wyse R. F. G., 2001, AJ, 122, 2281
- Crawford et al. (1999) Crawford C. S., Allen S. W., Ebeling H., Edge A. C., Fabian A. C., 1999, MNRAS, 306, 857
- Dale et al. (2005) Dale D. A., Sheth K., Helou G., Regan M. W., Hüttemeister S., 2005, AJ, 129, 2197
- Davies (2007) Davies R. I., 2007, MNRAS, 375, 1099
- Davies et al. (2014) Davies R. I., et al., 2014, ApJ, 792, 101
- Di Matteo et al. (2005) Di Matteo T., Springel V., Hernquist L., 2005, Nature, 433, 604
- Diniz et al. (2015) Diniz M. R., Riffel R. A., Storchi-Bergmann T., Winge C., 2015, MNRAS, 453, 1727
- Diniz et al. (2019) Diniz M. R., Riffel R. A., Storchi-Bergmann T., Riffel R., 2019, MNRAS, 487, 3958
- Dors et al. (2014) Dors O. L., Cardaci M. V., Hägele G. F., Krabbe Â. C., 2014, MNRAS, 443, 1291
- Drouart et al. (2012) Drouart G., et al., 2012, A&A, 548, A45
- Elitzur (2012) Elitzur M., 2012, ApJ, 747, L33
- Fabian et al. (1984) Fabian A. C., Nulsen P. E. J., Arnaud K. A., 1984, MNRAS, 208, 179
- Fabian et al. (2000) Fabian A. C., et al., 2000, MNRAS, 318, L65
- Fabian et al. (2003) Fabian A. C., Sanders J. S., Crawford C. S., Conselice C. J., Gallagher J. S., Wyse R. F. G., 2003, MNRAS, 344, L48
- Fabian et al. (2006) Fabian A. C., Sanders J. S., Taylor G. B., Allen S. W., Crawford C. S., Johnstone R. M., Iwasawa K., 2006, MNRAS, 366, 417
- Fabian et al. (2008) Fabian A. C., Johnstone R. M., Sanders J. S., Conselice C. J., Crawford C. S., Gallagher J. S. I., Zweibel E., 2008, Nature, 454, 968
- Falceta-Gonçalves et al. (2010) Falceta-Gonçalves D., Caproni A., Abraham Z., Teixeira D. M., de Gouveia Dal Pino E. M., 2010, ApJ, 713, L74
- Fiore et al. (2017) Fiore F., et al., 2017, Astronomy and Astrophysics, 601, A143
- Fischer et al. (2018) Fischer T. C., et al., 2018, ApJ, 856, 102
- Fischer et al. (2019) Fischer T. C., et al., 2019, ApJ, 875, 102
- Flewelling et al. (2016) Flewelling H. A., et al., 2016, arXiv e-prints, p. arXiv:1612.05243
- Forman et al. (1972) Forman W., Kellogg E., Gursky H., Tananbaum H., Giacconi R., 1972, ApJ, 178, 309
- Fujita & Nagai (2017) Fujita Y., Nagai H., 2017, MNRAS, 465, L94
- Gavazzi et al. (2013) Gavazzi G., Consolandi G., Dotti M., Fossati M., Savorgnan G., Gualandi R., Bruni I., 2013, A&A, 558, A68
- Gendron-Marsolais et al. (2018) Gendron-Marsolais M., et al., 2018, MNRAS, 479, L28
- Giustini & Proga (2019) Giustini M., Proga D., 2019, A&A, 630, A94
- Gnilka et al. (2020) Gnilka C. L., et al., 2020, ApJ, 893, 80
- Guillard et al. (2009) Guillard P., Boulanger F., Pineau Des Forêts G., Appleton P. N., 2009, A&A, 502, 515
- Harrison (2017) Harrison C. M., 2017, Nature Astronomy, 1, 0165
- Hatch et al. (2005) Hatch N. A., Crawford C. S., Fabian A. C., Johnstone R. M., 2005, MNRAS, 358, 765
- Hill & Zakamska (2014) Hill M. J., Zakamska N. L., 2014, MNRAS, 439, 2701
- Ho et al. (2009a) Ho L. C., Greene J. E., Filippenko A. V., Sargent W. L. W., 2009a, ApJS, 183, 1
- Ho et al. (2009b) Ho I. T., Lim J., Dinh-V-Trung 2009b, ApJ, 698, 1191
- Hopkins & Elvis (2010) Hopkins P. F., Elvis M., 2010, MNRAS, 401, 7
- Johnstone & Fabian (1995) Johnstone R. M., Fabian A. C., 1995, MNRAS, 273, 625
- Kent & Sargent (1979) Kent S. M., Sargent W. L. W., 1979, ApJ, 230, 667
- Kormendy & Ho (2013) Kormendy J., Ho L. C., 2013, ARA&A, 51, 511
- Krabbe et al. (2000) Krabbe A., Sams B. J. I., Genzel R., Thatte N., Prada F., 2000, A&A, 354, 439
- Lambrides et al. (2019) Lambrides E. L., Petric A. O., Tchernyshyov K., Zakamska N. L., Watts D. J., 2019, MNRAS, 487, 1823
- Lamperti et al. (2017) Lamperti I., et al., 2017, MNRAS, 467, 540
- Landt et al. (2013) Landt H., Ward M. J., Peterson B. M., Bentz M. C., Elvis M., Korista K. T., Karovska M., 2013, MNRAS, 432, 113
- Lim et al. (2008) Lim J., Ao Y., Dinh-V-Trung 2008, ApJ, 672, 252
- Lutz et al. (2019) Lutz D., et al., 2019, arXiv e-prints, p. arXiv:1911.05608
- Marin & Antonucci (2016) Marin F., Antonucci R., 2016, ApJ, 830, 82
- Mason et al. (2015) Mason R. E., et al., 2015, ApJS, 217, 13
- Mathews et al. (2006) Mathews W. G., Faltenbacher A., Brighenti F., 2006, ApJ, 638, 659
- May & Steiner (2017) May D., Steiner J. E., 2017, MNRAS, 469, 994
- Mazzalay et al. (2013) Mazzalay X., et al., 2013, MNRAS, 428, 2389
- McGregor et al. (2003) McGregor P. J., et al., 2003, Gemini near-infrared integral field spectrograph (NIFS). Proceedings of the SPIE, pp 1581–1591, doi:10.1117/12.459448
- Muñoz-Vergara et al. (2019) Muñoz-Vergara D., et al., 2019, MNRAS, 487, 3679
- Müller Sánchez et al. (2006) Müller Sánchez F., Davies R. I., Eisenhauer F., Tacconi L. J., Genzel R., Sternberg A., 2006, A&A, 454, 481
- Müller-Sánchez et al. (2018) Müller-Sánchez F., Hicks E. K. S., Malkan M., Davies R., Yu P. C., Shaver S., Davis B., 2018, ApJ, 858, 48
- Nagai et al. (2010a) Nagai H., et al., 2010a, PASJ, 62, L11
- Nagai et al. (2010b) Nagai H., et al., 2010b, PASJ, 62, L11
- Nagai et al. (2019) Nagai H., et al., 2019, ApJ, 883, 193
- Nelson & Whittle (1995) Nelson C. H., Whittle M., 1995, ApJS, 99, 67
- Oliva et al. (2001) Oliva E., et al., 2001, A&A, 369, L5
- Onori et al. (2017) Onori F., et al., 2017, MNRAS, 468, L97
- Osterbrock & Ferland (2006) Osterbrock D. E., Ferland G. J., 2006, Astrophysics of gaseous nebulae and active galactic nuclei. University Science Books
- Pedlar et al. (1990) Pedlar A., Ghataure H. S., Davies R. D., Harrison B. A., Perley R., Crane P. C., Unger S. W., 1990, MNRAS, 246, 477
- Punsly et al. (2018) Punsly B., Marziani P., Bennert V. N., Nagai H., Gurwell M. A., 2018, ApJ, 869, 143
- Ramos Almeida & Ricci (2017) Ramos Almeida C., Ricci C., 2017, Nature Astronomy, 1, 679
- Reunanen et al. (2002) Reunanen J., Kotilainen J. K., Prieto M. A., 2002, MNRAS, 331, 154
- Richings & Faucher-Giguère (2018) Richings A. J., Faucher-Giguère C.-A., 2018, MNRAS, 478, 3100
- Riffel (2010) Riffel R. A., 2010, Ap&SS, 327, 239
- Riffel (2020) Riffel R. A., 2020, MNRAS, 494, 2004
- Riffel et al. (2006a) Riffel R. A., Storchi-Bergmann T., Winge C., Barbosa F. K. B., 2006a, MNRAS, 373, 2
- Riffel et al. (2006b) Riffel R., Rodríguez-Ardila A., Pastoriza M. G., 2006b, A&A, 457, 61
- Riffel et al. (2008) Riffel R. A., Storchi-Bergmann T., Winge C., McGregor P. J., Beck T., Schmitt H., 2008, MNRAS, 385, 1129
- Riffel et al. (2009) Riffel R., Pastoriza M. G., Rodríguez-Ardila A., Bonatto C., 2009, MNRAS, 400, 273
- Riffel et al. (2010) Riffel R. A., Storchi-Bergmann T., Nagar N. M., 2010, MNRAS, 404, 166
- Riffel et al. (2013a) Riffel R., Rodríguez-Ardila A., Aleman I., Brotherton M. S., Pastoriza M. G., Bonatto C., Dors O. L., 2013a, MNRAS, 430, 2002
- Riffel et al. (2013b) Riffel R. A., Storchi-Bergmann T., Winge C., 2013b, MNRAS, 430, 2249
- Riffel et al. (2014a) Riffel R. A., Vale T. B., Storchi-Bergmann T., McGregor P. J., 2014a, MNRAS, 442, 656
- Riffel et al. (2014b) Riffel R. A., Storchi-Bergmann T., Riffel R., 2014b, ApJ, 780, L24
- Riffel et al. (2015a) Riffel R. A., et al., 2015a, MNRAS, 446, 2823
- Riffel et al. (2015b) Riffel R. A., Storchi-Bergmann T., Riffel R., 2015b, MNRAS, 451, 3587
- Riffel et al. (2017) Riffel R. A., Storchi-Bergmann T., Riffel R., Dahmer-Hahn L. G., Diniz M. R., Schönell A. J., Dametto N. Z., 2017, MNRAS, 470, 992
- Riffel et al. (2018) Riffel R. A., et al., 2018, MNRAS, 474, 1373
- Riffel et al. (2019a) Riffel R. A., Zakamska N. L., Riffel R., 2019a, MNRAS, p. 2738
- Riffel et al. (2019b) Riffel R., et al., 2019b, MNRAS, 486, 3228
- Rodríguez-Ardila et al. (2004) Rodríguez-Ardila A., Pastoriza M. G., Viegas S., Sigut T. A. A., Pradhan A. K., 2004, A&A, 425, 457
- Rodríguez-Ardila et al. (2005) Rodríguez-Ardila A., Riffel R., Pastoriza M. G., 2005, MNRAS, 364, 1041
- Salomé et al. (2006) Salomé P., et al., 2006, A&A, 454, 437
- Sandage & Tammann (1981) Sandage A., Tammann G. A., 1981, Carnegie Inst. of Washington, p. 0
- Sanders et al. (2003) Sanders D. B., Mazzarella J. M., Kim D. C., Surace J. A., Soifer B. T., 2003, AJ, 126, 1607
- Sanders et al. (2016) Sanders J. S., Fabian A. C., Russell H. R., Walker S. A., Blundell K. M., 2016, MNRAS, 460, 1898
- Scharwächter et al. (2013) Scharwächter J., McGregor P. J., Dopita M. A., Beck T. L., 2013, MNRAS, 429, 2315
- Schönell et al. (2019) Schönell A. J., Storchi-Bergmann T., Riffel R. A., Riffel R., Bianchin M., Dahmer-Hahn L. G., Diniz M. R., Dametto N. Z., 2019, MNRAS, 485, 2054
- Scoville et al. (1982) Scoville N. Z., Hall D. N. B., Ridgway S. T., Kleinmann S. G., 1982, ApJ, 253, 136
- Shimizu et al. (2019) Shimizu T. T., et al., 2019, MNRAS, 490, 5860
- Silk & Rees (1998) Silk J., Rees M. J., 1998, A&A, 331, L1
- Smith et al. (1990) Smith E. P., Heckman T. M., Illingworth G. D., 1990, ApJ, 356, 399
- Soto-Pinto et al. (2019) Soto-Pinto P., et al., 2019, MNRAS, 489, 4111
- Storchi-Bergmann & Schnorr-Müller (2019) Storchi-Bergmann T., Schnorr-Müller A., 2019, Nature Astronomy, 3, 48
- Storchi-Bergmann et al. (2009) Storchi-Bergmann T., McGregor P. J., Riffel R. A., Simões Lopes R., Beck T., Dopita M., 2009, MNRAS, 394, 1148
- Strauss et al. (1992) Strauss M. A., Huchra J. P., Davis M., Yahil A., Fisher K. B., Tonry J., 1992, ApJS, 83, 29
- Tully et al. (2013) Tully R. B., et al., 2013, AJ, 146, 86
- Veilleux et al. (2013) Veilleux S., et al., 2013, ApJ, 776, 27
- Véron-Cetty & Véron (2006) Véron-Cetty M. P., Véron P., 2006, A&A, 455, 773
- Wilman et al. (2005) Wilman R. J., Edge A. C., Johnstone R. M., 2005, MNRAS, 359, 755
- Winge et al. (2009) Winge C., Riffel R. A., Storchi-Bergmann T., 2009, ApJS, 185, 186
- Woo & Urry (2002) Woo J.-H., Urry C. M., 2002, ApJ, 579, 530
- Wylezalek et al. (2017) Wylezalek D., et al., 2017, MNRAS, 467, 2612
- Wylezalek et al. (2020) Wylezalek D., Flores A. M., Zakamska N. L., Greene J. E., Riffel R. A., 2020, MNRAS, 492, 4680
- Zakamska & Greene (2014) Zakamska N. L., Greene J. E., 2014, MNRAS, 442, 784
- van der Marel & Franx (1993) van der Marel R. P., Franx M., 1993, ApJ, 407, 525
Appendix A Multi-Gaussian Fits of the Emission-Line Profiles