A search for fast radio burst-like emission from Fermi gamma-ray bursts
Abstract
We report the results of the rapid follow-up observations of gamma-ray bursts (GRBs) detected by the Fermi satellite to search for associated fast radio bursts. The observations were conducted with the Australian Square Kilometre Array Pathfinder at frequencies from 1.2–1.4 GHz. A set of 20 bursts, of which four were short GRBs, were followed up with a typical latency of about one minute, for a duration of up to 11 hours after the burst. The data was searched using 4096 dispersion measure trials up to a maximum dispersion measure of 3763 pc cm-3, and for pulse widths over a range of duration from 1.256 to 40.48 ms. No associated pulsed radio emission was observed above for any of the 20 GRBs.
keywords:
radio continuum: transients – surveys1 Introduction
The origin and source of fast radio bursts (FRBs; Lorimer et al., 2007) are still unknown. There are a number of theoretical models that attempt to connect short gamma-ray bursts (GRBs), or more specifically binary neutron star mergers, with fast radio burst-like phenomena (e.g., Usov & Katz, 2000; Pshirkov & Postnov, 2010; Totani, 2013; Falcke & Rezzolla, 2014; Ravi & Lasky, 2014; Zhang, 2014; Wang et al., 2016, 2018; Lyutikov, 2018). The overall fast radio burst (FRB) detection rate precludes short GRBs as the only channel for FRB emission, as discussed in Ravi (2019). Nonetheless, since short GRBs are generally believed to originate from neutron star–neutron star mergers (Gehrels et al., 2005; Berger, 2014; Fong et al., 2015) the follow-up of gamma-ray burst (GRB) detections coincident with impulsive radio emission provides a means to test whether such mergers can generate some fraction of the total FRB population.
While the majority of theoretical work has concentrated on short GRBs, the Usov & Katz (2000) model could also be applied to long GRBs, but in that case it is difficult to understand how the radio emission could propagate through the extended stellar envelope (Macquart, 2007).
Many of the models predict FRB-like radio emission just prior to, or coincident with the merger, when the gamma rays are released. Unambiguous identification of this ‘prompt’ FRB emission requires simultaneous observations in gamma rays and radio, which is difficult to achieve in practice.
The fact that radio emission is delayed due to cold plasma dispersion does not help when observing at 1 GHz (where most FRBs have been found to date). For a typical GRB redshift of (Gruber et al., 2014) the expected dispersion measure from intergalacic cold plasma is pc cm-3 (Ioka, 2003; Inoue, 2004), leading to a dispersion delay of only 2 s, which is insufficient time to slew mechanically steered telescopes.
Nevertheless, the Ravi & Lasky (2014) model does predict ‘delayed’ FRB-like emission, – s after the merger, well within the reaction time of current facilities. In this picture, the merger of two neutron stars creates a ‘supramassive’ millisecond neutron star, which subsequently collapses into a black hole. This collapse may be observable if it releases FRB-like emission.
Here we present the results of a search for delayed, FRB-like radio emission associated with known short GRB events, specifically aiming to test the Ravi & Lasky (2014) proposal.
A limiting factor in observing the prompt emission of short GRBs in particular is their relatively poor localization. Hence an instrument with a large field of view is required. In addition, a short slewing time is required to probe the case where the collapse follows the merger very quickly. The follow-up observations were performed with the Australian Square Kilometre Array Pathfinder (ASKAP; McConnell et al., 2016; Hotan et al., 2014) as part of the Commensal Real-time ASKAP Fast Transients (CRAFT) survey (Macquart et al., 2010), because of its large field of view and rapid follow-up capabilities.
Previous searches for FRB emission at 1 GHz (Bannister et al., 2012; Palaniswamy et al., 2014), where most FRBs have been detected so far, required good localisation and hence used GRBs that were detected by the Swift satellite (Gehrels et al., 2004), which are generally long GRBs. Kaplan et al. (2015) on the other hand followed up a short Swift GRB at 132 MHz, but no FRBs have been observed at this frequency (Sokolowski et al., 2018). The key feature of the study presented here comes from the fact that we observe short GRBs detected by the Fermi satellite (Meegan et al., 2009) at a frequency where FRBs are known to occur and we can cover the Fermi localisation uncertainty because of the large field of view of ASKAP.
2 Data acquisition and processing
A significant challenge in the search for prompt radio emission from GRBs is that their initial detection positions are not localised to regions smaller than tens of square degrees. This mandates an approach which is able to instantaneously cover as much of the initial localisation region as possible. To this end we configured the antennas of ASKAP into a fly’s-eye configuration, similar to the arrangement described in Bannister et al. (2017). We observed at a central frequency of 1296 MHz. Each antenna has 36 beams covering 30 square degrees field of view in a hexagonally close-packed arrangement, with a pitch equal to the beam full-width-half-maximum at the center of the band of 0.9 degrees. The observations were taken during commissioning mode, in which typically only 6-8 antennas were available, yielding an instantaneous field of view between 180 and 240 square degrees.
For details of the recording and search pipelines, we refer the reader to Bannister et al. (2017), but we briefly describe the main points below. Data were recorded using the the real-time CRAFT data pipeline as described in Clarke et al. (2014), which records 3361 MHz channel Stokes-I autocorrelations with a time resolution of 1.265 ms. The offline FRB search was done with the GPU-based FRB detection pipeline called Fast Real-time Engine for Dedispersing Amplitudes (FREDDA). The main purpose of FREDDA is to take into account the effect of dispersion. Any impulsive radio signal propagating across cosmological distances is strongly affected by dispersion caused by plasma in our Galaxy, the intergalactic medium and the burst host galaxy. The retardation in the pulse arrival time varies quadratically with wavelength and scales linearly with the total electron column density, the dispersion measure (DM). The DM of any putative radio burst is unknown, so the signal must be dedispersed and searched over a grid of plausible DM values. The FREDDA algorithm searched for pulses using 4096 DM trials up to a maximum DM of 3763 pc cm-3, with a resolution of 0.92 pc cm-3, and for pulse widths where the integration time was ms. The FRB candidates that were found and saved to disk by the FRB search algorithm FREDDA were visually inspected by looking at the shape of the pulse as a function of time and frequency, and the signal-to-noise ratio.
2.1 GRB follow-up observations
In the search for FRBs associated with short GRBs we focused on the GRBs detected by the GBM instrument on the Fermi satellite (Goldstein et al., 2012). The GBM instrument has the highest detection rate of short GRBs of about 40–45 per year. A Fermi GRB detection is followed by the distribution of different types of alerts to allow for follow-up observations. The only type of follow-up alert messages responded to by ASKAP were those distributed with a relatively short delay after detection, and with a sufficiently accurate position to permit radio follow-up. These message types include the so-called GBM Ground position notices and GBM Final position notices. The former contain the position of the source with an uncertainty of about 1–10 degrees radius and are distributed within a few tens of seconds. The latter are distributed with a much larger delay, of up to a few hours, but contain an updated source position with a smaller uncertainty of about 5 degrees radius.
The 4PiSky (Staley & Fender, 2016) package was used to handle the GRB alerts. As we were interested in low latency GRB follow-up, ASKAP observations were only triggered in response to a GRB detection if the reported source position was above the horizon at the time. The footprints of the antennas on the sky were then tiled in a fly’s-eye configuration, with each telescope pointing in a different direction, to cover the uncertainty on the source location, as shown in Figure 1. For the follow-up observation all antennas that were available for the CRAFT survey were used.
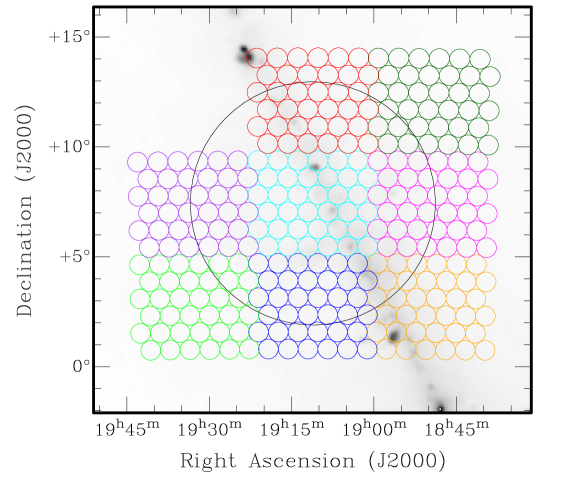
In the tiling of the localisation region (as shown in Figure 1), the centre of one antenna is pointed at the position that is given in the GRB alert message. The remaining antennas are pointed as close as possible to the direction of this central antenna without the footprints overlapping each other. For each new alert message corresponding to the same burst detection the pointing of all antennas is adjusted to the updated source location given in the alert message. The follow-up observation interrupts the ongoing CRAFT observation and it lasts in principle until the source sets.
2.2 GRB follow-up details
The GRBs that were followed up were detected between 2018 March 11 and 2018 July 3. A total of 29 GCN alerts (Barthelmy et al., 1994) were handled in this period of which 20 are classified as GRBs, listed in Table 1. All GRBs were detected by the Fermi satellite except for one. GRB 180331A was detected by the Swift satellite on which ASKAP triggered during a period where Fermi was not operational.
| GRB name | Trigger ID | GRB time | GRB duration | Fluence | Error circle | On-source | Total observa- |
|---|---|---|---|---|---|---|---|
| [UT] | [s] | [erg cm-2] | coverage | delay [s] | tion time [h] | ||
| GRB 180313A* | bn180313978 | 23:28:17.53 | 0.080 | 1.8732 x 10⁻⁷ | 0.86 | 147 | 5.3 |
| GRB 180331A | 820347 | 04:14:55.70 | 48.0 | 6.1 x 10⁻⁷ | 1.00 | 104 | 7.1 |
| GRB 180404B | bn180404091 | 02:11:38.64 | 80.897 | 2.8009 x 10⁻⁵ | 1.00 | 148 | 9.7 |
| GRB 180412A | bn180412425 | 10:12:06.01 | 20.992 | 2.9571 x 10⁻⁶ | 1.00 | 67 | 3.3 |
| GRB 180416A | bn180416340 | 08:09:26.47 | 103.426 | 3.8795 x 10⁻⁵ | 1.00 | 111 | 6.7 |
| GRB 180420B | bn180420107 | 02:33:54.63 | 62.977 | 3.0334 x 10⁻⁶ | 0.99 | 134 | 11.2 |
| GRB 180423B | bn180423266 | 06:23:40.76 | 3.328 | 5.7854 x 10⁻⁷ | 0.35 | 133 | 7.8 |
| GRB 180511B* | bn180511437 | 10:29:52.61 | 1.984 | 7.6532 x 10⁻⁷ | 0.64 | 128 | 2.3 |
| GRB 180511C | bn180511606 | 14:32:18.99 | 9.216 | 1.3554 x 10⁻⁶ | 0.88 | 84 | 6.0 |
| GRB 180513A | bn180513815 | 19:34:02.14 | 20.480 | 1.6211 x 10⁻⁶ | 0.93 | 118 | 1.0 |
| GRB 180516A | bn180516229 | 05:29:47.14 | 13.824 | 1.7834 x 10⁻⁶ | 0.95 | 143 | 0.2 |
| GRB 180521A | bn180521935 | 22:26:57.24 | 31.232 | 6.6444 x 10⁻⁷ | 0.84 | 101 | 4.0 |
| GRB 180525A* | bn180525151 | 03:37:59.08 | 0.544 | 1.4069 x 10⁻⁷ | 0.26 | 135 | 7.3 |
| GRB 180528B | bn180528465 | 11:09:49.03 | 8.192 | 5.4004 x 10⁻⁷ | 0.28 | 135 | 6.2 |
| GRB 180602B* | bn180602938 | 22:31:05.34 | 0.008 | 2.0878 x 10⁻⁷ | 1.00 | 145 | 7.4 |
| GRB 180606A | bn180606730 | 17:31:38.62 | 6.080 | 1.2997 x 10⁻⁶ | 0.12 | 124 | 5.3 |
| GRB 180610A | bn180610377 | 09:03:13.18 | 163.331 | 8.5794 x 10⁻⁶ | 0.94 | 65 | 4.6 |
| GRB 180610B | bn180610568 | 13:38:27.51 | 8.448 | 1.1805 x 10⁻⁶ | 0.96 | 123 | 5.3 |
| GRB 180610C | bn180610791 | 18:58:48.67 | 27.648 | 4.0315 x 10⁻⁶ | 1.00 | 89 | 3.2 |
| GRB 180618B | bn180618724 | 17:22:06.25 | 130.050 | 1.8649 x 10⁻⁵ | 0.94 | 100 | 1.0 |
No redshift information is available in any of the corresponding GCN circulars111https://gcn.gsfc.nasa.gov/gcn3_circulars.html for the GRBs listed. None of the GRBs listed was localized by the IPN222https://heasarc.gsfc.nasa.gov/W3Browse/all/ipngrb.html, and no associated sources were found in the TNS333https://wis-tns.weizmann.ac.il/ archive.
Apart from the GRB specifications, Table 1 also lists the relevant ASKAP observation parameters: the error circle coverage, the on-source delay, and the total observation time. The error circle coverage indicates the fraction of the error on the GRB position that is covered by the ASKAP dishes for the corresponding observation. The error circle coverage was calculated using the uncertainty in the GRB location given in the last alert message for a certain GRB detection that the system triggered on. For most Fermi GRBs this was the position uncertainty given in the GBM Final position notice, except for GRB 180313A, GRB 180513A, and GRB 180521A, for which the position uncertainty in the GBM Ground position notice was used. Our radio follow-up observations covered, on average, 80% of the 68% confidence containment region. The on-source delay, defined as the delay between the GRB time and the start of the observation by ASKAP, was on average about 120 s. The total observation time, which is the duration of the follow-up observation by ASKAP, was on average about 5.3 hours.
3 Results
We have demonstrated the prompt follow-up of 20 GRBs with the ASKAP radio telescope. Four of these GRBs are classified as short GRBs. The observations started 65–148 s after the burst, and lasted for a few hours, up to 11.2 hours after the detection of the burst.
A total of 433 single FRB candidates were output by the search pipeline above a signal-to-noise ratio of 10 during the course of the follow-up observations, with the number of events found per observation ranging from 0 to 88. All candidates were visually inspected, and were readily attributable to radio frequency interference or known instrumental artifacts. In addition, for the follow-up of GRB 180416A the bright pulsar PSR B083345 was in the field of view and generated many candidates. This pulsar detection demonstrates that the acquisition and search pipelines were operating correctly and at the correct sensitivity. No viable FRB candidates were found during the observations reported here.
Based on the sensitivity of the CRAFT survey to FRBs (James et al., 2019), the upper limit of burst-like radio emission from GRBs after about 120 s, and within a few hours, after the detection of the burst is , where the integration time ranges from 1.265–40.48 ms. The median efficiency of CRAFT fly’s-eye observations has been estimated at 90% (James et al., 2019), i.e. there is a 10% chance of an FRB being missed in the search pipeline, e.g. due to radio frequency interference or data losses. This number reflects data taken during commissioning, and thus represents an upper bound to the probability of missing an FRB. The sensitivity varies slightly between telescope and the beam pattern, and with increasing DM. The quoted number is the sensitivity in the middle of the central beams only.
4 Discussion
Possible explanations for this null result include a mismatch between any prompt emission and the follow-up timescales, the finite sensitivity of the follow-up, and the physical absence of FRB-like radio emission. We discuss each of these below.
Although the arrival of any radio emission would be retarded relative to the gamma-ray emission due to plasma dispersion along the burst sight line (likely chiefly due to the intergalactic medium), we note that this effect is too small to enable us to observe radio emission that would have coincided with the GRB itself. The total dispersive delay for any event with redshift is typically less than 6 s, at an observing frequency of 1300 MHz, far less than the average ASKAP response time of about 120 s. Moreover, at a typical GRB redshift of (Gruber et al., 2014), the DM is expected to be pc cm-3 (Ioka, 2003; Inoue, 2004), which corresponds to a dispersive time delay of only s. Due to the instrumental capabilities we are thus unable to test models that predict ‘precursor’ or ‘prompt’ FRB-like emission from GRBs.
Our observations do, however, direct address the proposal of Ravi & Lasky (2014), wherein a pair of merged neutron stars may persist as an unstable supramassive neutron star for up to a few hours after merger, and thus for which post-merger emission may be expected. The optimal detection window for radio emission in this model is between 10 s and s after the initial burst. We observed 4 short GRBs within about – s after the GRB time. It is possible that the collapse occurred outside our observing window. To investigate the likelihood, we integrated under the curves shown in Figure 3 of Ravi & Lasky (2014). We find that our average observation, which covered a collapse time of roughly s, covers 39%, 56% and 40% of the predicted collapse time distributions for the AB-N, GM1 and APR models respectively. Therefore, there is a reasonable chance of all 4 GRBs collapsing outside the observing window.
A second explanation is insufficient sensitivity. Our fluence sensitivity is . Assuming a fiducial redshift for short GRBs of (Gruber et al., 2014), this corresponds to an energy spectral density of J Hz-1 (assuming isotropic emission and a flat radio spectrum), a value which is intermediate amongst the population of FRBs currently observed (see figure 2 of Shannon et al., 2018).
Thirdly, it is possible that the progenitor of these short GRBs did not produce any FRBs at all. Ravi & Lasky (2014) state in Section 4 of their paper that the probability of binary neutron star mergers to result in supramassive stars ranges between 5%–95%, depending on the model. This would mean that for the four short GRBs in our data sample, this could have lead to the detection of zero to four FRB events. The dynamic range of the models is such that with the null observation the binary star merger resulting in a supramassive star can not be concluded. On the other hand, Ravi & Lasky (2014) also state that, based on the short GRB X-ray lightcurve sample of Rowlinson et al. (2013), it is likely that between 15% and 25% of short GRBs will result in supramassive stars. This means that zero or one of the short GRBs in our data sample could have lead to an FRB. Again, the current statistics are not conclusive.
On average we covered about 70% of the uncertainty region for these GRBs. We estimate the probability of all 4 GRBs falling outside our coverage as 0.05%. We observed at a frequency of 1296 MHz (where FRBs are known to occur) and with sufficient time and frequency resolution to detect short bursts. Overall we find that our observations were sufficient to detect any FRBs emitted by the 4 short GRBs observed, had they been sufficiently bright and had the collapse occurred while the observations were taking place.
5 Conclusion
We have searched for pulsed radio emission from GRBs at a central frequency of 1296 MHz. Similar follow-up observations to detect FRBs in coincidence with the prompt emission of GRBs in general have been performed before (Bannister et al., 2012; Palaniswamy et al., 2014; Kaplan et al., 2015), however this search focused on short GRBs, which are currently primarily detected by the Fermi satellite, at a frequency where FRBs are known to occur. ASKAP with its large field of view and fast slewing time is currently the most capable radio telescope to perform these observations. We observed 20 GRBs by quickly responding to the GCN notices and pointing the ASKAP dishes in the direction of the source within 65–148 seconds. We have found no FRB events collected during these observations. The s delay between the detection of the GRB and the start of the radio observations limits the conclusions we are able to draw on most of the proposed models, except notably that of Ravi & Lasky (2014).
Data availability
Data are archived at the Pawsey Supercomputing Centre. The authors will attempt to provide reasonable requests for data.
Acknowledgements
The Australian SKA Pathfinder is part of the Australia Telescope National Facility which is managed by CSIRO. Operation of ASKAP is funded by the Australian Government with support from the National Collaborative Research Infrastructure Strategy. ASKAP uses the resources of the Pawsey Supercomputing Centre. Establishment of ASKAP, the Murchison Radio-astronomy Observatory and the Pawsey Supercomputing Centre are initiatives of the Australian Government, with support from the Government of Western Australia and the Science and Industry Endowment Fund. We acknowledge the Wajarri Yamatji people as the traditional owners of the Observatory site. DK was supported by NSF grant AST-1816492.
References
- Bannister et al. (2012) Bannister K. W., Murphy T., Gaensler B. M., Reynolds J. E., 2012, ApJ, 757, 38
- Bannister et al. (2017) Bannister K. W., et al., 2017, ApJ, 841, L12
- Barthelmy et al. (1994) Barthelmy S. D., et al., 1994, in Fishman G. J., ed., American Institute of Physics Conference Series Vol. 307, Gamma-Ray Bursts. p. 643, doi:10.1063/1.45819
- Berger (2014) Berger E., 2014, ARA&A, 52, 43
- Calabretta et al. (2014) Calabretta M. R., Staveley-Smith L., Barnes D. G., 2014, Publications of the Astronomical Society of Australia, 31, e007
- Clarke et al. (2014) Clarke N., D’Addario L., Navarro R., Trinh J., 2014, Journal of Astronomical Instrumentation, 3, 1450004
- Falcke & Rezzolla (2014) Falcke H., Rezzolla L., 2014, A&A, 562, A137
- Fong et al. (2015) Fong W., Berger E., Margutti R., Zauderer B. A., 2015, ApJ, 815, 102
- Gehrels et al. (2004) Gehrels N., et al., 2004, ApJ, 611, 1005
- Gehrels et al. (2005) Gehrels N., et al., 2005, Nature, 437, 851
- Goldstein et al. (2012) Goldstein A., et al., 2012, ApJS, 199, 19
- Gruber et al. (2014) Gruber D., et al., 2014, ApJS, 211, 12
- Hotan et al. (2014) Hotan A. W., et al., 2014, Publ. Astron. Soc. Australia, 31, e041
- Inoue (2004) Inoue S., 2004, MNRAS, 348, 999
- Ioka (2003) Ioka K., 2003, ApJ, 598, L79
- James et al. (2019) James C. W., et al., 2019, Publ. Astron. Soc. Australia, 36, e009
- Kaplan et al. (2015) Kaplan D. L., et al., 2015, ApJ, 814, L25
- Lorimer et al. (2007) Lorimer D. R., Bailes M., McLaughlin M. A., Narkevic D. J., Crawford F., 2007, Science, 318, 777
- Lyutikov (2018) Lyutikov M., 2018, arXiv e-prints,
- Macquart (2007) Macquart J.-P., 2007, ApJ, 658, L1
- Macquart et al. (2010) Macquart J.-P., et al., 2010, Publ. Astron. Soc. Australia, 27, 272
- McConnell et al. (2016) McConnell D., et al., 2016, Publ. Astron. Soc. Australia, 33, e042
- Meegan et al. (2009) Meegan C., et al., 2009, ApJ, 702, 791
- Narayana Bhat et al. (2016) Narayana Bhat P., et al., 2016, ApJS, 223, 28
- Palaniswamy et al. (2014) Palaniswamy D., Wayth R. B., Trott C. M., McCallum J. N., Tingay S. J., Reynolds C., 2014, ApJ, 790, 63
- Pshirkov & Postnov (2010) Pshirkov M. S., Postnov K. A., 2010, Ap&SS, 330, 13
- Ravi (2019) Ravi V., 2019, Nature Astronomy, p. 405
- Ravi & Lasky (2014) Ravi V., Lasky P. D., 2014, MNRAS, 441, 2433
- Rowlinson et al. (2013) Rowlinson A., O’Brien P. T., Metzger B. D., Tanvir N. R., Levan A. J., 2013, MNRAS, 430, 1061
- Shannon et al. (2018) Shannon R. M., et al., 2018, Nature, 562, 386
- Sokolowski et al. (2018) Sokolowski M., et al., 2018, ApJ, 867, L12
- Staley & Fender (2016) Staley T. D., Fender R., 2016, preprint, (arXiv:1606.03735)
- Totani (2013) Totani T., 2013, PASJ, 65, L12
- Usov & Katz (2000) Usov V. V., Katz J. I., 2000, A&A, 364, 655
- Wang et al. (2016) Wang J.-S., Yang Y.-P., Wu X.-F., Dai Z.-G., Wang F.-Y., 2016, ApJ, 822, L7
- Wang et al. (2018) Wang J.-S., Peng F.-K., Wu K., Dai Z.-G., 2018, ApJ, 868, 19
- Zhang (2014) Zhang B., 2014, ApJ, 780, L21