Fast and Anomalous Exciton Diffusion in Two-dimensional Hybrid Perovskites
Abstract
Two-dimensional hybrid perovskites are currently in the spotlight of condensed matter and nanotechnology research due to their intriguing optoelectronic and vibrational properties with emerging potential for light-harvesting and -emitting applications.
While it is known that these natural quantum wells host tightly bound excitons, the mobilities of these fundamental optical excitations at the heart of the optoelectronic applications are still largely unexplored.
Here, we directly monitor the diffusion of excitons through ultrafast emission microscopy from liquid helium to room temperature in hBN-encapsulated two-dimensional hybrid perovskites.
We find very fast diffusion with characteristic hallmarks of free exciton propagation for all temperatures above 50 K.
In the cryogenic regime we observe nonlinear, anomalous behavior with an exceptionally rapid expansion of the exciton cloud followed by a very slow and even negative effective diffusion.
We discuss our findings in view of efficient exciton-phonon coupling, highlighting two-dimensional hybrids as promising platforms for many-body physics research and optoelectronic applications on the nanoscale.
Keywords: 2D perovskites, excitons, diffusion, exciton-phonon interaction
Nanostructured, two-dimensional (2D) organic-inorganic perovskites, studied as early as in the 1980’s and 90’s 1, 2, 3, 4, have recently emerged as promising candidates for high-efficiency photovoltaic and light-emitting applications 5, 6, 7, 8, 9, 10. The renewed attention is strongly motivated by the structural and chemical design flexibility of these natural multi-quantum-well systems 11, promising to accelerate the ongoing search for improved device performance and stability 12, 13. Of key interest to this challenge are intriguing phenomena that revolve around coupling between electronic and vibronic excitations 1, 14, 15, 16, 17, 18, 19, 20, 21, 22, 23, 24. The 2D confinement of the electronic states in the inorganic layers together with reduced dielectric screening from the organic barriers give rise to an exceptionally strong Coulomb interaction and tightly bound exciton states with binding energies on the order of many 100’s of meV 1, 14, 16, 21. In addition, similar to their three-dimensional (3D) analogues 25, the vibronic characteristics of the 2D perovskites are peculiar in contrast to conventional inorganic semiconductors, since they are unusually soft. As a consequence, the coupling of the excitonic quasiparticles to lattice vibrations is very efficient, resulting in fast exciton-phonon scattering 26, 18 and the proposed emergence of polaron effects 15, 17, 24. This combination renders 2D perovskites a highly interesting material platform to study fundamental many-particle phenomena in hybrid systems motivated by both basic science and emerging technologies.
A key process directly influenced by these properties is the diffusion of optical excitations that is intimately tied to the fundamental understanding of the exciton structure, spatial energy landscape, and exciton-phonon interactions. As a consequence, it is also one of the most crucial parameters ultimately determining efficiency limits of optoelectronic devices, including both light-harvesting and -emitting applications. Interestingly, in contrast to 3D perovskites 27, 28, the exciton propagation remains barely explored for 2D variants, with the initial reports of room-temperature diffusion 29, 30 revealing the role of the organic compounds 30 and exciton-exciton interactions 29. The nature of the exciton transport, however, remains only little understood with major open questions regarding conditions for localization and free propagation as well as fundamental limits for the exciton diffusivity.
Here, we directly monitor exciton propagation in thin sheets of 2D perovskites via time- and spatially-resolved emission microscopy across the temperature range from 5 to 290 K. Already at room temperature we consistently observe very efficient exciton transport with the diffusivity of 1 cm2/s, corresponding to an effective exciton mobility of 40 cm2/Vs. Lowering of temperature leads to a strong increase of the propagation efficiency for all temperatures down to 50 K, characteristic for free exciton transport, with the diffusivity and effective mobility reaching values as high as 3 cm2/s and 1000 cm2/Vs, respectively. Approaching 5 K, the measurements reveal an intriguing non-linear regime of anomalous diffusion showing a rapidly expanding exciton cloud and diffusivities up to 30 cm2/s. It is followed by an effective shrinking of the spatial distribution corresponding to negative diffusion. The subsequent suppression of the exciton propagation for the remaining, long-lived exciton fraction exhibits hallmarks of localization and thermal activation. Combining optical transport data with scattering rate analysis from spectral broadening and exciton mass from first-principles calculations we estimate the diffusivity limits for the free exciton propagation in a semi-classical model, rationalizing experimental findings. It allows us to propose a broader framework for the fundamental understanding of the optical transport in 2D perovskites.
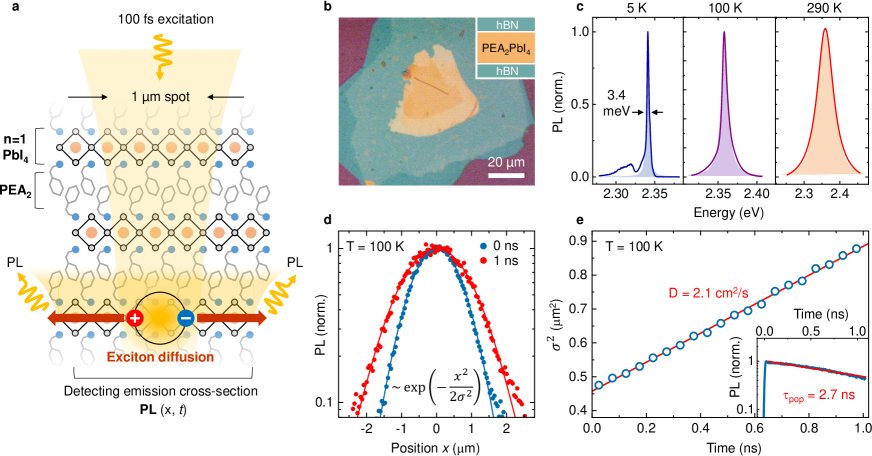
Ultrafast Exciton Microscopy. To study exciton propagation we employ the technique of time- and spatially-resolved emission microscopy 31, 32, schematically illustrated in Fig. 1a. The excitons are optically injected by 100 fs short laser pulses at 3.1 eV photon energy and 80 MHz repetition rate, focused on an area of about 1 m diameter. Time-resolved expansion of the exciton cloud is then recorded by imaging the luminescence cross-section onto a streak camera detector. The layered perovskites under study are monocrystalline 2D phenylethylammonium-lead-iodide (PEA2PbI4) thin sheets that are considered for their lack of a temperature-induced phase transition 33. The flakes are chemically synthesized and mechanically exfoliated to thin layers with an average thickness in the range of 50 - 100 nm, as estimated from the optical contrast and confirmed by atomic-force microscopy (see SI). Using the polymer stamping technique initially developed for inorganic van der Waals materials 34 we fully encapsulate the 2D perovskites between thin sheets of hBN for environmental protection and improved stability under excitation 35. An optical micrograph of one of the studied samples is presented in Fig. 1b. All experiments are performed in a microscopy cryostat under high vacuum conditions. Further details are found in the Supplementary Information and Ref. 36.
Representative emission spectra of hBN-encapsulated PEA2PbI4 are presented in Fig. 1c at low (5 K), intermediate (100 K) and high (290 K) temperatures. The emission is always dominated by a single exciton resonance at about 2.35 eV, close to the main peak in absorption-type reflectance contrast measurements (see Supplementary Information (SI)), typical for the studied systems 1. Only at lowest temperatures we detect weak sideband emission at lower energies indicating additional contributions from localized states or phonon-assisted processes 26. Here we note that the encapsulation in hBN should not affect the material response too strongly due to the relatively large thickness of the studied samples resulting in the majority of the excitations being far from the interface. We emphasize, however, that we consistently observe very narrow resonances both in emission and reflectance spectra at cryogenic temperatures with linewidths that are typically under 10 meV and can be as low as 3 meV, as shown in Fig. 1c. This improvement of optical quality may indeed be related to a beneficial effect of the encapsulation due to suppression of degradation and, potentially, even static disorder in analogy to inorganic monolayers 37.
Typical spatial profiles of the exciton emission at K are presented in Fig. 1d, as obtained from the streak camera images at 0 and 1 ns time delay after the excitation. The data are normalized for direct comparison and shows a pronounced, time-dependent broadening of the exciton in-plane distribution. For each time step we fit the measured PL intensity profile with a Gauss function, . Here, is the spatial, one-dimensional coordinate along the direction of the detected emission cross-section. The extracted variance is presented in Fig. 1e and increases linearly with time, characteristic for conventional diffusion 32.
The diffusion coefficient cm2/s is extracted from the slope of the variance measured along the one-dimensional coordinate according to 32. The quantity is commonly known as mean squared displacement (MSD) that accounts for the time-dependent component of the spatial broadening. While the excitons are neutral quasiparticles it is still useful to express the diffusivity also in terms of effective mobility for direct comparison with the electron transport. From the Einstein relation 38 , where is the Boltzmann constant and the elementary charge we obtain the effective exciton mobility at K of 250 cm2/Vs. The corresponding diffusion length is 1.06 m, defined as 32. Here we use the population lifetime ns extracted from the PL transient taking into account an additional decay channel due to exciton diffusion out of the imaging area (see SI). In the following the technique of the spatially- and time-resolved microscopy is employed for the investigation of exciton propagation across linear and nonlinear regimes.
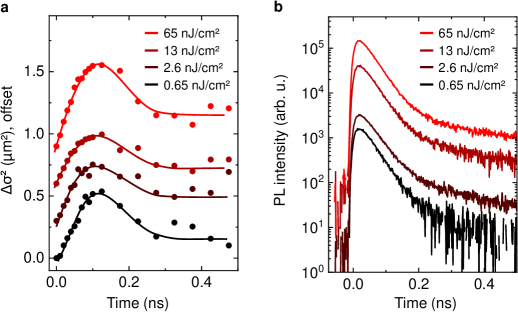
Room Temperature Exciton Diffusion. First, we study room temperature diffusion and investigate density-dependent dynamics of the exciton population, since exciton-exciton interactions are known to strongly affect measured effective diffusivity 39, 36, 29. Characteristic PL decay times are presented in Fig. 2a as a function of energy density per pulse between 0.3 and 130 nJ/cm2 from individual measurements together with the arithmetic average. The emission lifetime of about 250 ps remains almost constant across more than two orders of injection densities. Given the weak excitation conditions used in our pulsed experiments this observation is in agreement with the exciton-exciton annihilation coefficients recently reported for a similar material system, butylammonium lead-iodide 29.
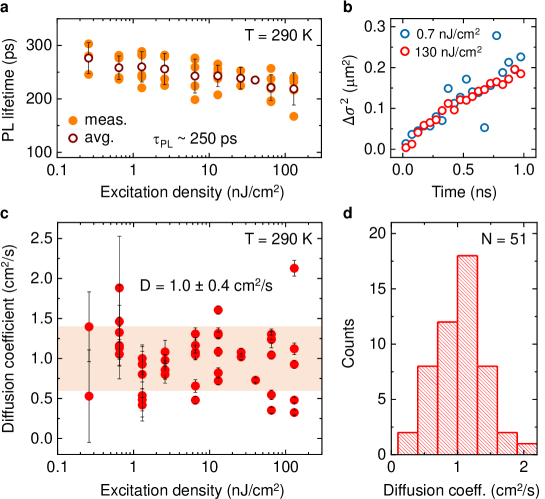
Similarly, the exciton diffusion remains virtually unaffected when changing the excitation density as illustrated in Fig. 2b by two representative MSD traces recorded at different injection densities. The complete data set of the measured diffusion constants, collected on different flakes and sample positions is presented in Fig. 2c and summarized in a histogram in Fig. 2d. The extracted mean diffusivity is cm2/s (from the total number of counts ); the deviation is largely associated with variations between different sample positions. It corresponds to an effective exciton mobility of cm2/Vs and a mean diffusion length on the order of 200 nm.
For a hybrid, excitonic material at room temperature the exciton propagation is very fast with the diffusivity being several orders of magnitude larger compared to molecular crystals 31, 27. It is closer to the exciton diffusion found in inorganic van der Waals monolayer semiconductors 40, 41, 42 and is very similar to that of the free carriers in 3D perovskites 25, 27. Interestingly, the determined value for is above the effective charge-carrier mobility in the same system determined at higher pump densities 43. We also note that while the absolute diffusivity in the measured samples is about an order of magnitude higher than recently observed for 2D perovskites 30, 29 it is generally consistent with the trends presented in these reports. In particular, as shown in Ref. 30, 2D PEA2PbI4 crystals studied here exhibit higher exciton mobility due to increased stiffness of the lattice reducing the exciton-phonon coupling compared to other organic spacers. In addition, the encapsulation in hBN may in principle further contribute to mechanical stiffness and, more importantly, influence and suppress static disorder in agreement with very narrow spectral linewidths observed in our samples at low temperatures. Finally, as we discuss in the analysis section further below, it appears reasonable that the fast room temperature diffusion on the order of 1 cm2/s is already largely determined by the exciton-phonon interaction. It is thus likely to represent a fundamental upper limit for the room temperature diffusivity in the studied 2D perovskite.
Conventional and Anomalous Diffusion Regimes. Distinct regimes of exciton transport are revealed by lowering the sample temperature. Characteristic, qualitative differences are illustrated by representative streak camera images showing spatially- (x-axis) and time-resolved (y-axis) emission presented in Fig. 3a for the temperatures of 5 and 100 K in false-color plots. As-measured luminescence counts (left panels) and data normalized at each time-step (right panels) emphasize population decay and spatial dynamics, respectively. MSD traces for selected temperatures are shown in Fig. 3b, corresponding to the time-dependent changes of the spatial broadening of the PL.
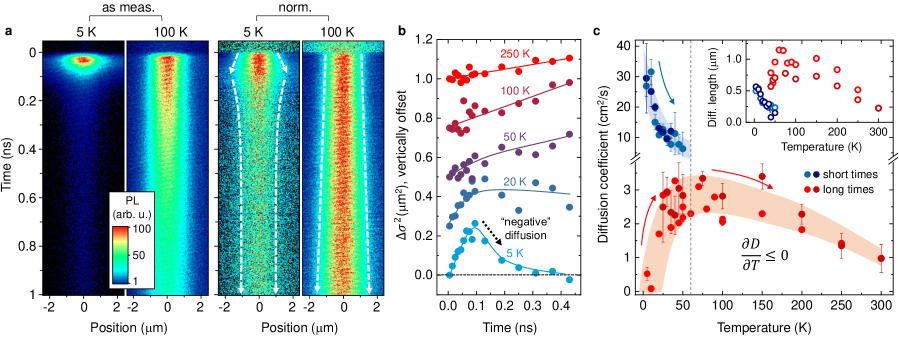
At elevated temperatures, the excitons exhibit conventional diffusion with a linear increase of the MSD over time, accompanied by comparatively long, nearly single-exponential decay of the PL on the order of several 100’s of ps up to a few ns (see SI). Corresponding values for the effective diffusion coefficients are summarized in Fig. 3c. Importantly, above roughly 50 K, the diffusivity remains either constant or decreases with increasing temperature, i.e., , which is a characteristic hallmark of free propagation 44. It also implies that defect-related scattering is negligible in this range, as it would lead to the increase of diffusivity with temperature otherwise. In addition, the slope on the order -0.01 cm2/sK at higher temperatures is further consistent with the observations around room temperature reported in Ref. 30 The obtained diffusion lengths, presented in the inset of Fig. 3c, increase up to 1 m with the corresponding effective mobilities reaching up to 1000 cm2/Vs (also see Fig. 4d).
In stark contrast to that, exciton propagation at lower temperatures is anomalous, exhibiting subdiffusive dynamics below 50 K and even regions of negative effective diffusion coefficient between 5 and 20 K, independent from injection density (see SI). The exciton cloud spreads rapidly during the first 100 ps with extracted diffusion coefficients up to 30 cm2/s, as shown in Fig. 3c by blue dots, and decays within about 40 ps. Interestingly, the diffusivity of this fast component also decreases with temperature, indicating free propagation. In addition, the combination of fast diffusion and short lifetime still results in sizable diffusion lengths on the order of many 100’s of nm. After the initial recombination, the remaining exciton population decays very slowly with the diffusion coefficients approaching zero at long time scales at 5 K. However, the diffusivity of this long-lived component rapidly increases with temperature (see red dots in Fig. 3c for K), characteristic for a progressive thermal activation of a fraction of excitons being either localized 45, 46 or scattered by imperfections 47. In the following section we discuss our findings and outline pathways to rationalize and interpret the observed behavior.
Discussion of Exciton Diffusion Mechanisms. Based on the observation of free exciton propagation across a broad range of temperatures it is reasonable to consider a basic semi-classical drift-diffusion model that is commonly used to describe band-like transport in inorganic semiconductors 38, 47. In this model, an exciton with a total mass moves with an average thermal energy and randomly changes the direction due to momentum scattering on a characteristic time scale , yielding the diffusivity
| (1) |
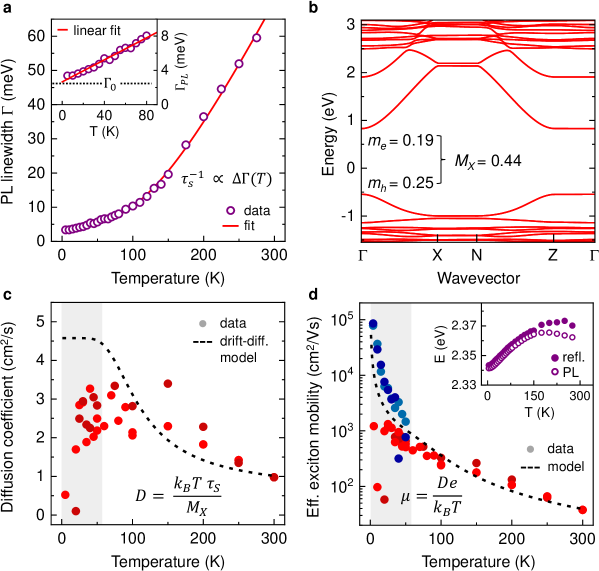
Experimentally, is estimated from the temperature-dependent spectral broadening of the exciton resonance according to . Total linewidth is obtained from spectrally-resolved continuous-wave PL measurements and presented in Fig. 4a as full-width-at-half-maximum values from Lorentz peak fits. The constant offset meV is attributed to radiative and residual inhomogeneous broadening that should not contribute to the momentum scattering. The linewidth increases strongly with temperature, characteristic for efficient thermally activated exciton-phonon scattering in 2D perovskites 17, 18. It is well described in the Debye-Einstein approximation 18 , phenomenologically accounting for thermal populations of acoustic and optical modes. Here, the parameters are eV/K, meV, and meV. We emphasize that they do not necessarily correspond to actual phonon modes of a complex vibrational structure and are used to provide effective values to describe temperature-dependent linewidth broadening. For the estimation of the exciton effective mass, we perform first-principles calculations of the electronic bandstructure (see Fig. 4b, and SI for full details), using the VASP code 48, PBE functional 49 including spin-orbit coupling, and TS dispersive corrections 50. The effective masses of the electrons and holes, close to the fundamental band gap of the material at the -point are 0.19 and 0.24 with denoting free electron mass. The total mass of the exciton is thus .
The resulting temperature-dependent diffusivity obtained from Eq (1) using the above values for and is presented in Fig. 4c together with the experimental data from the long-lived component. In addition, Fig. 4d shows the corresponding effective exciton mobilities from the Einstein relation, also including values from the short-lived population at low temperatures. It is interesting to see that the simple model reasonably captures both the overall temperature dependence and the absolute values, in particular for the free-propagation regime at elevated temperatures. It strongly implies that the observed behavior is likely to originate in efficient exciton-phonon scattering determining the diffusion. Good quantitative agreement at room temperature further suggests that the experimentally obtained values are likely to be very close to the intrinsic limit of diffusivity, consistent with the high optical quality of the studied flakes with very small inhomogeneous broadening.
We note, however, that there are several important considerations for the interpretation of our findings beyond the scope of the basic Drude-like model presented above. First, there are observations of nonlinear, anomalous diffusion dynamics at low temperatures (Figs. 3a and b) that suggest an interplay of multiple components. Here, the emission from the rapidly diffusing and decaying excitons and a long-lived, barely mobile fraction can indeed lead to an overall shrinking of the spatial distribution of the detected signal and effectively result in apparent negative diffusivity. Moreover, the assumption of the exciton temperature being equal to that of the lattice may not hold in this regime. Non-resonantly injected excitons could relax on comparable or slower timescales as those for recombination, leading to an overestimation of the experimentally extracted mobility after the excitation. A possible scenario would involve rapid diffusion of hot excitons that subsequently cool down and localize at low temperatures. Elevating the temperature then increasingly impedes hot exciton propagation due to faster scattering with phonons but also effectively lifts localization for the long-lived exciton fraction.
Secondly, Eq. (1) was used under the assumption of a constant effective mass. In case of strong exciton-phonon coupling the excitons may be better described in the polaron picture 15, 17, 24 with a renormalized and, most importantly, temperature-dependent mass. Precedent for the impact of such effects can be found in a recent theoretical work on 3D perovskites demonstrating strong fluctuations in the electronic coupling that are driven by temperature-induced lattice dynamics 51. Phenomenologically, the decrease of diffusivity with temperature in Eq. (1) would then stem from the temperature dependence of both momentum scattering time and effective mass renormalization of the polarons. The observation of finite Stokes shifts between reflectance and emission peak energies that seem to increase with temperature, as illustrated in the inset of Fig. 4d, provides additional support for the potential relevance of these effects 52.
Finally, we note that the applicability of a semi-classical model is formally limited to the mean free path being comparable or larger than the de Broglie wavelength of the propagating exciton wavepackets. In our case, this condition does not hold at elevated temperatures where the scattering rate strongly increases even as the predictions of the model match experimental data very well in this regime. For a more adequate microscopic description it may thus require additional quantum interference corrections 53 or full quantum-mechanical treatment. We thus emphasize that the basic description presented above is intended as one of possible pathways to rationalize key experimental findings and highlight the role of the exciton-phonon coupling. Consequently, it strongly motivates further theoretical inquiries into the physics involved.
Conclusions. In summary, we have experimentally demonstrated fast exciton diffusion in 2D hybrid perovskites from room temperature down to liquid helium conditions, across conventional and anomalous diffusion regimes. We found characteristic hallmarks of free particle propagation of long-lived exciton populations for all temperatures above 50 K with the effective mobilities up to 1000 cm2/Vs. At lower temperatures we observed rapid initial diffusion followed by a non-monotonous evolution of the exciton distribution and subsequent localization at longer time scales. A drift-diffusion analysis using experimentally determined scattering rates and a theoretically computed exciton mass allowed for a reasonable description of the linear diffusivity across the studied temperature range. It strongly suggests that the measured exciton mobilities are likely to be close to intrinsic limits determined by efficient exciton-phonon coupling. Altogether, the reported findings render the hybrid low-dimensional perovskites as exceptionally suitable systems both for fundamental studies of strongly-interacting many-body states and optoelectronic applications involving mobile optical excitations.
Acknowledgements
We thank our colleagues Mikhail Glazov, Paulina Plochocka, Sivan Refaely-Abramson, Claudia Draxl, and Henry Snaith for helpful discussions, Robin P. Puchert for the support with AFM measurements and John M. Lupton for sharing the AFM. Financial support by the DFG via SPP2196 Priority Program (CH 1672/3-1) and Emmy Noether Initiative (CH 1672/1-1) is gratefully acknowledged. D.A.E. acknowledges funding from: the Alexander von Humboldt Foundation within the framework of the Sofja Kovalevskaja Award, endowed by the German Federal Ministry of Education and Research; the Technical University of Munich - Institute for Advanced Study, funded by the German Excellence Initiative and the European Union Seventh Framework Programme under Grant Agreement No. 291763; the DFG under Germany’s Excellence Strategy - EXC 2089/1–390776260. O. Y. acknowledges funding from ISF (1861/17) and ERC (850041 - ANHARMONIC). K.W. and T.T. acknowledge support from the Elemental Strategy Initiative conducted by the MEXT, Japan, Grant Number JPMXP0112101001, JSPS KAKENHI Grant Numbers JP20H00354 and the CREST(JPMJCR15F3), JST.
1 Supplementary Information
2 Methods
2.1 Crystal synthesis
For the material synthesis we used PbO (99%), phosphinic acid (50%w in H2O), 2-phenylethyl-amin (99%) and n-butylamine (99.5%), purchased from Merck, hydriodic acid (stabilizer free, 57%w in H2O), purchased from Holland Moran, and diethylether (BHT stabilized) purchased from Bio-Lab Chemicals. These reagents were used without any additional treatment. Single crystals of phenylethylammonium-lead-iodide, (C6H5-CH2CH2NH3)2PbI4, were synthesized according to procedure reported in Refs. 16, 54 and adapted according to Refs. 55, 9. In brief, PbO (0.3 g, 1.34 mmol) was dissolved in a mixture of hydriodic acid (1.3 mL, 10.2 mmol) and phosphinic acid (228 L, 2 mmol) at 110oC under magnetic stirring to a clear yellow solution. In a separated beaker held in an ice-bath, 2-phenethylamine solution (171 L, 1.34 mmol) was neutralized with hydriodic acid (11 mL, 83.5 mmol) and added to the PbI2 solution, immediately leading to some precipitation. The magnetic stirring was continued until the solution was again of clear yellow color. Hydriodic acid was added drop wise (about 1 mL) to speed up the dissolution. The stirring was stopped and the beaker was capped and cooled to room temperature at a rate of 2 K/hour. The orange plate-like crystals were further quenched in an ice bath, vacuum filtered, washed with diethylether, and dried at 90oC in a vacuum oven for 24 hours prior to use. The material composition and crystal structure were confirmed by x-ray diffraction and Raman spectroscopy.
2.2 Preparation of encapsulated samples
To obtain hBN-encapsulated samples we used the technique outlined in Ref. 34 for inorganic van der Waals materials and applied in Ref. 35 for 2D perovskites. Thin hBN flakes were first mechanically exfoliated on polydimethylsiloxane (PDMS) from bulk crystals (provided by T. Taniguchi and K. Watanabe, NIMS) and subsequently stamped on a 90 ∘C preheated SiO2/Si substrate at ambient conditions. Thin 2D perovskite flakes, also exfoliated on PDMS, were then stamped on top of the hBN layers followed by the stamping of a second thin hBN layer on top. Particular care was taken to provide full contact of the bottom and top hBN layers outside the perovskite sample to ensure complete encapsulation. We also note that the thickness of the perovskites sheets was kept roughly below 100 nm for optimal heterostructure fabrication. Layer thicknesses were estimated from optical contrast and confirmed by atomic-force microscopy.
2.3 Optical spectroscopy
For time-resolved measurements we used a Ti:sapphire laser source (Chameleon Ultra II, Coherent Inc.) for excitation, providing 100 fs-short pulses with a repetition rate of 80 MHz and photon energies of 3.1 eV obtained through second-harmonic generation of the fundamental beam. The laser was focused on the sample held in an optical microscopy cryostat (ST500, Janis) by a 60 glass-corrected microscope objective (Nikon) on a spot size of about 1 m in diameter. Excitation densities were varied between 0.3 and 130 nJ/cm2. Assuming roughly absorption per layer 16 at the excitation photon energy, these values would correspond to the maximum injected electron-hole densities between and 3 1/cm2 per layer. For continuous-wave PL and reflectance measurements we used a 473 nm laser source (excitation power density of 0.25 W/cm2) and a tungsten-halogen lamp, respectively. The sample emission was imaged onto a spectrometer slit and subsequently onto a streak camera detector (C10910-05, Hamamatsu), using either a grating (300 gr/cm or 1200 gr/cm) or a silver mirror for spectrally- and spatially-resolved measurements, respectively. The streak camera was operated in single-photon counting mode and provided time-resolution of the luminescence signal on the order of several ps to a few 10’s of ps depending on the chosen temporal range. Further details on the spatially- and time-resolved microscopy technique, measurement procedure, and data analysis are found in Ref. 36. For time-integrated detection a peltier-cooled CCD (Pixis256, Roper Scientific) was employed.
2.4 Bandstructure calculations
Density functional theory calculations were performed using the “Vienna Ab initio Simulation Package” code 48, projector augmented wave potentials 56 and accounting for spin-orbit coupling (SOC). Exchange-correlation was treated using the Perdew-Burke-Ernzerhof (PBE) functional 49 augmented by dispersive corrections that were computed using the Tkatchenko-Scheffler method 50. The plane-wave kinetic energy cutoff was set to 500 eV and a 441 -centered k-point grid was used for self-consistently calculating the charge density. The experimentally-determined crystal structure of () PEA2PbI4 was taken as a starting point to optimize the lattice parameters and atomic positions, in calculations without accounting for SOC, until the force on each atom was smaller than 0.01 eVÅ-1. In this way, we obtained a unit cell with lattice constants of Å, Å, and Å, which agreed well with the experimental result of Å, Å, and Å from x-ray diffraction. The differences in the in-plane lattice constants was found to be due to the orientation of the PEA molecules, which can be improved using a supercell that allows for a more realistic representation of their geometry. However, we verified this to have no effect on the effective mass results. The electronic bandstructure calculations were performed non-self-consistently, using an equally-spaced k-grid of 50 points on each path between two high symmetry points ( Å-1); the numerical convergence with respect to was verified. Electron and hole masses, and were calculated around towards the X-point (0.5, 0, 0) in the Brillouin zone, since the fundamental gap occurs at the -point. The effective masses were obtained using a finite difference method following the equation . The exciton total effective mass was then obtained according to . To test the reliability of our PBE + SOC results, we have also performed calculations using the HSE functional 57, 58, from which we obtained an identical result for the reduced exciton mass compared to the PBE data.
3 Height profiles from atomic-force microscopy
To determine the layer thickness and confirm the values obtained from the analysis of reflectance spectra, we performed atomic-force microscopy (AFM) measurements on one of the studied hBN-encapsulated 2D perovskite (PEA2PbI4) flakes. For this purpose, we chose a sample with a particularly thin top layer hBN (as estimated from optical contrast) that is expected to closely follow the underlying, much thicker perovskite layer. The scanned region, indicated in the optical micrograph in Fig. S5(a), was selected to include both the edge of the hBN capping layer on top of the bottom hBN as well as a part of the encapsulated structure with the perovskite layer sandwiched in-between. AFM images were taken with silicon probes (Nanosensors PPP-NCHR and SSS-NCHR) using a Park Systems XE-100 operating in ‘non-contact’ amplitude modulation mode under ambient conditions in a vibration-isolated acoustic enclosure.
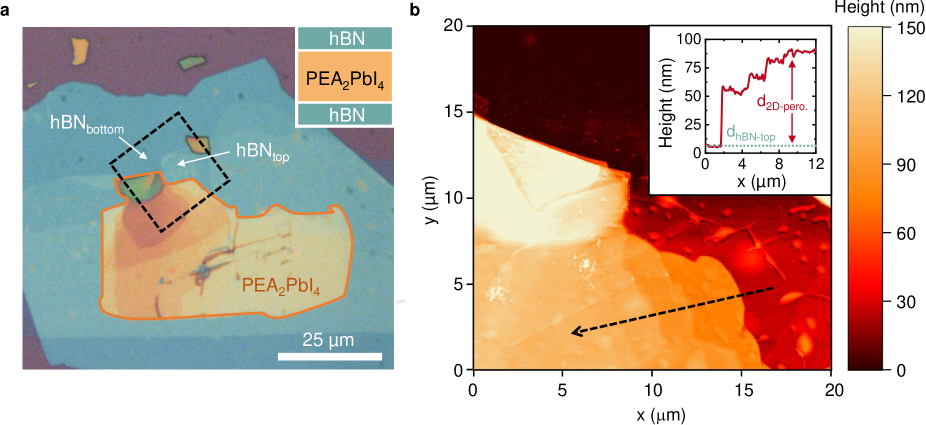
The AFM topography image is presented in Fig. S5(b) and a selected trace across the perovskite layer is shown in the inset. The vertical offset of about 8 nm at m corresponds to the top hBN layer thickness obtained by measuring an edge where both encapsulating hBN layers are in direct contact. This parameter is also used for subsequent analysis of the optical response in the presence of multilayer interference effects, as described in more detail further below. In addition, since hBN usually exhibits atomically flat surfaces and the top hBN layer is already very thin, the measured surface profile should largely follow the height of the perovskite flake underneath. The obtained thickness varies between 50 to 80 nm in step-like changes that are typical for exfoliated, layered van der Waals materials. Importantly, due to the high optical contrast of the perovskite layers these steps are also visible in the optical micrograph. In spatially- and time-resolved emission experiments, the measurement spots with a diameter of about 1 m were chosen to be well within the plateau-like region of 80 nm thickness.
4 Stability under pulsed excitation
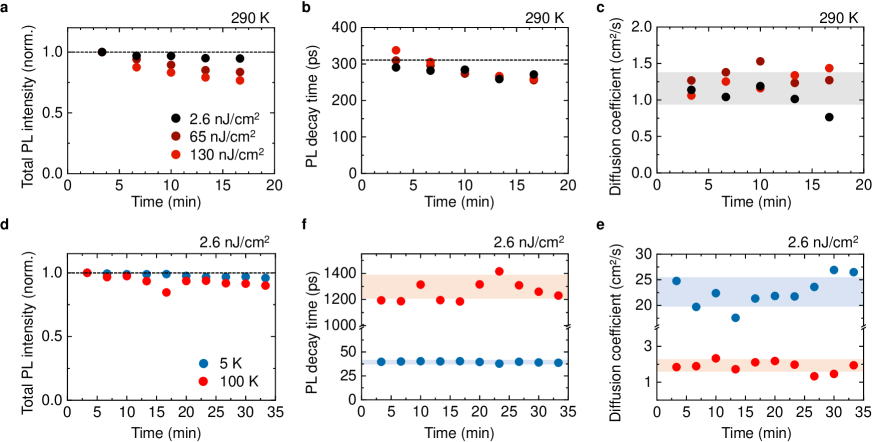
Exciton diffusion measurements in our study were performed on perovskite layers encapsulated in hBN and studied under high vacuum conditions to reduce degradation effects by effectively protecting the material from the environment 596061. Fig. S6(a) shows total PL intensity as function of measurement time for several excitation densities up to 130 nJ/cm2 per pulse, where the laser induced degradation is expected to be most pronounced. Even for the highest density applied we observe only a small decrease of the total PL during a measurement cycle of more than 15 minutes. It is accompanied by a similarly small decrease in the PL lifetime, as illustrated in Fig. S6(b). For a comparatively low excitation density of 2.6 nJ/cm2, however, the decrease in both emission intensity and decay time is nearly absent, being as small as about 5%. More importantly, the diffusion coefficient presented in Fig. S6(c), extracted from single frames recorded by the streak camera, does not show any systematic dependence on the measurement time. That implies that even a weak decrease of the PL intensity and lifetime at the highest density, attributed to faster non-radiative recombination from degradation, does not influence the obtained diffusivity. Nevertheless, due to essentially absent degradation effects and still reasonable signal-to-noise ratios, a very low excitation density of 2.6 nJ/cm2 was chosen for subsequent temperature-dependent measurements. At these conditions, also at 5 and 100 K, we observe only minor changes in the PL intensity after more than 30 minutes of continuous irradiation with a pulsed laser, as illustrated in Fig. S6(d). No consistent changes are detected in the decay time (Fig. S6(e)) and diffusivity (Fig. S6(f)).
5 Influence of diffusion on measured emission lifetime
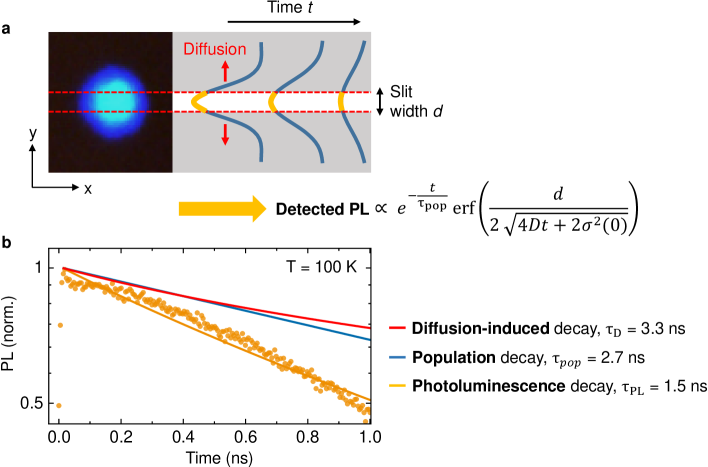
Here, we discuss the influence of the exciton diffusion on the measured PL lifetime, as schematically illustrated in Fig. S7(a). While the excitons emit and diffuse in two dimensions, the detected signal is collected from an effectively one-dimensional cross-section using a fixed slit width in the imaging plane. In addition to the population decay of the excitons associated with actual recombination, the excitons thus also diffuse out of the detection area (along the vertical coordinate in the illustration in Fig. S7(a)). This diffusion gives rise to an additional decay channel in the measured PL intensity that we need to take into account to extract the actual dynamics of the exciton population. The fraction of excitons in the detection cross-section is obtained from the area of a Gaussian profile from to with the time-dependent standard deviation of , that increases with time due to diffusion. The resulting PL transient is then described by a product of time-dependent population (e.g., exponentially decaying with a constant ) and an error function that depends on the diffusivity and the spatial variance of the spot profile immediately after the excitation.
A representative case is shown in Fig. S7(b) using the measured data at 100 K, where the influence of diffusion on the emission dynamics is particularly strong. The PL decays with a characteristic time-constant of 1.5 ns. The extracted lifetime of the exciton population, however, is much longer with ns. It is comparable to the decay constant of the diffusion-induced component, estimated by = 3.3 ns. The above procedure is then consistently applied to extract exciton lifetimes in the presence of diffusion. We note, however, that the influence of the latter is less pronounced both at higher and lower temperatures than 100 K due to lower diffusion coefficients and shorter population lifetimes, respectively.
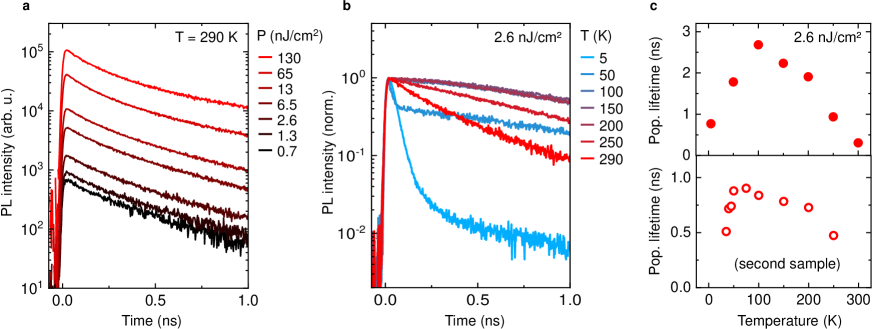
6 Density- and temperature-dependent decay dynamics
Fig. S8(a) shows PL transients at K spatially-integrated over the measured cross-section for several excitation densities from 0.7 to 130 nJ/cm2. All traces are very similar and decay nearly exponentially on a time scale of about 0.3 ns. Normalized PL transients for varying temperatures from 290 K down to 5 K are presented in Fig. S8(b). For all temperatures down to 50 K they exhibit a mono-exponential decay with the extracted population lifetime increasing from 0.3 ns at room temperature to almost 3 ns at 100 K, as illustrated in the upper panel of Fig. S8(c). We note, however, that we observed variations in the absolute values of the exciton lifetime for different studied flakes at lower temperatures, as shown in the lower panel of Fig. S8(c). Importantly, despite these differences in the exciton lifetime, the diffusivity values and their temperature dependence are very similar for the two samples, as presented in the main manuscript.
7 Exciton diffusion and decay at low temperatures
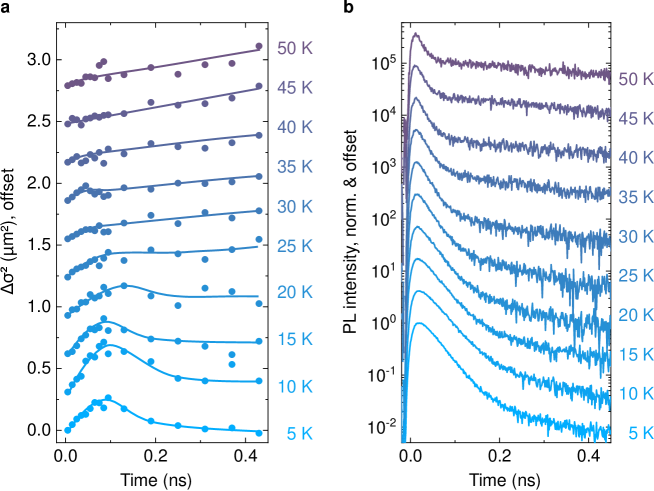
Fig. S9(a) presents the time-resolved mean squared displacement (MSD) (t) - (0) for low temperatures between 5 and 50 K. The MSD exhibits a linear increase with time at 50 K and an anomalous behavior at 5 K, with an initially rapid diffusion followed by an apparent shrinking of the spatial profile. The latter is accompanied by an increasing decay component with a very short lifetime of the exciton population, as illustrated in Fig. S9(b) by the PL transients. The two regimes merge smoothly in the presented temperature range. In particular, negative diffusivity is observed from 5 up to 20 K and the non-linear behavior with an initially fast diffusion persists up to 30-35 K. In addition, both diffusion and decay dynamics do not exhibit any pronounced excitation density dependence in the studied range at 5 K, as illustrated in Fig. S10(a) and (b), respectively. The underlying processes thus seem to be driven by thermal phenomena such as, e.g., changes in the phonon population, decreasing kinetic energy or relaxation rate of the excitons, rather than exciton-exciton interactions.
8 Spatial dynamics of spectrally filtered emission at 5 K
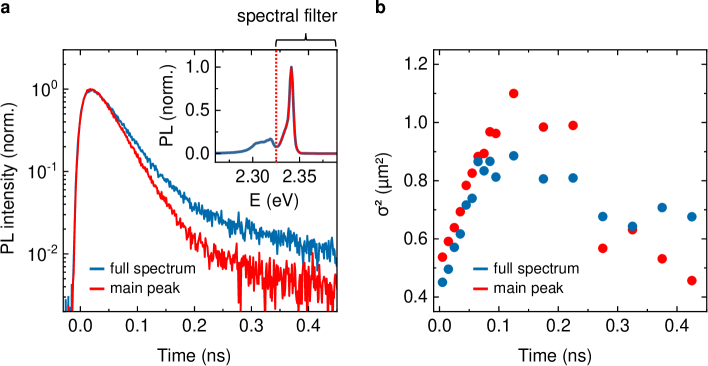
Spatially-resolved emission reported in the main manuscript was obtained by detecting the full spectral range of the luminescence that is dominated by a single exciton peak at all temperatures (also see the following section). Only at very low temperatures we observed weak additional features on the low-energy side of the spectra. To monitor their influence on the measured time- and spatially-resolved response, we used a spectrally tunable bandpass filter to compare the signal obtained from a full spectral range to that from the main exciton resonance, excluding additional emission at lower energies. Corresponding PL transients and time-dependent variance of the spatial profile are presented in Figs. 11(a) and (b), respectively. The data in the inset of Fig. S11(a) illustrates the spectral cut-off of the bandpass filter and the resulting detection range.
Altogether, we find very similar decay and propagation dynamics in both cases. They are thus dominated by the main exciton resonance, consistent with comparatively weak signals from low-lying features. The latter mainly contributes to the long-lived component of the PL that exhibits very slow diffusivity at low temperatures, approaching zero at 5 K. This observation also appears to be consistent with the obtained spatial variance traces in Fig. S11(b), especially if the effective shrinking of the spatial emission profile is indeed a consequence of an essentially immobile population that remains after the fast initial decay of a rapidly diffusing fraction. Combined with the disappearance of the low-energy emission features at higher temperatures (Fig. S12), these findings indicate that these PL peaks are thus likely to stem from localized states.
9 Temperature-dependent linear reflectance and emission spectra
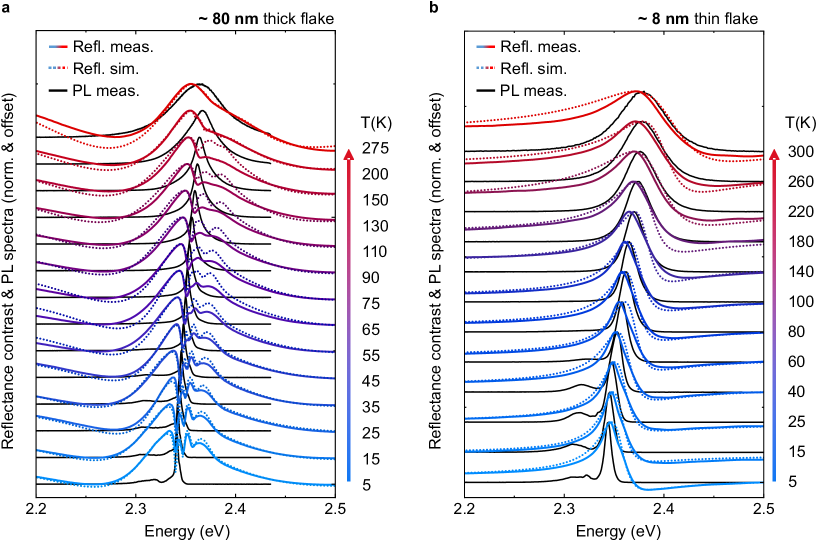
Spectrally-resolved linear reflectance and PL measured on two different hBN-encapsulated 2D perovskite (PEA2PbI4) samples from 5 K to room temperature is presented in Figs. 12(a) and (b), respectively. The thicker sample (Fig. S12(a)) was also used for diffusion measurements. In addition, a much thinner flake of about 8 nm height (Fig. S12(b)) was exfoliated and placed on fused silica substrate in order to reduce multi-layer interference effects in the reflectance. An additional advantage of the thinner flake is that the emission should stem from the entire sample volume within the excitation spot area, while in the thicker sample we expect only the top layers to be excited due to a finite penetration depth of the pump light.
The reflectance measurements were performed both on the areas with and without the perovskite flakes, denoted as sample () and reference () signals, respectively. For the thicker sample only the underlying substrate (SiO2/Si) was used as reference and for the thinner sample the reference was obtained on an area with both hBN layers on top of the substrate (fused silica). The data is presented and analyzed as reflectance contrast that corresponds to the relative change of the reflectance in the presence of the sample. It is defined according to , including the background counts collected without illumination.
Reflectance contrast spectra are then analyzed by fitting the measured response with a simulated one that is obtained using a transfer-matrix approach to account for the multi-layer interference effects 62. For this purpose, dielectric constants of the hBN and substrate layers are taken from literature and individual layer thicknesses are estimated from the AFM measurements. Frequency-dependent dielectric function of the perovskite layer in the relevant range of the main optical transition is parametrized by Lorentzian peak functions to account for exciton resonances according to:
| (2) |
Here, is the oscillator strength, is the resonance energy, is the non-radiative broadening, and is a constant offset in the real part of the dielectric function accounting for higher-lying resonances (it is generally not the same as the static dielectric constant). The index then runs through exciton resonances that we include to match the resulting spectra. The response can either be reasonably approximated with only one transition (as it is the case in Fig. S12(b)) or include several peaks (as in Fig. S12(a)). These parameters (as well as the individual layer thicknesses to a small degree) are varied in an iterative process to yield a simulated spectrum that reasonably matches the experimentally measured response. We further assume normal incidence conditions both for simplicity and due to a comparatively low numerical aperture of the imaging spectrometer in our experiments. Finally, we note that while the dielectric function is defined as a three-dimensional quantity, we are effectively sensitive to the in-plane value due to the measurement geometry, where the polarization of incident and reflected light is predominantly aligned along the planes of the studied 2D perovskites.
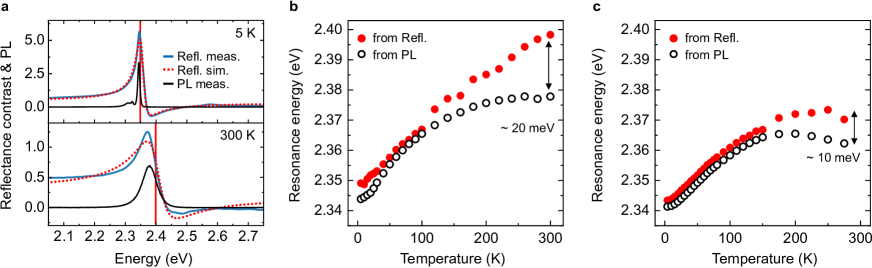
The resulting simulated spectra are included in Fig. S12 as dotted lines. For comparison, measured and simulated reflectance contrast spectra from a thin sample are also presented in Fig. S13(a) together with the PL data at 5 and 300 K. Dashed lines indicate central energies of the exciton resonance corresponding to that of the Lorentzian peak in the dielectric function that yields simulated reflectance spectra. Notably, these resonance energies are offset from the respective reflectance peak maxima to higher energies. The PL spectra are fitted using symmetrical peak profiles, either Lorentzian or Voigt, that both provide very similar results. The extracted resonance energies from reflectance, i.e., the one used in the underlying dielectric function, and PL are presented in Fig. S13(b) and Fig. S13(c) as function of temperature for the thinner and thicker samples, respectively. From reflectance analysis of the thicker sample (Fig. S12(a) and Fig. S13(c)), we consider the energy of the lowest energy resonance in the dielectric function. Overall, both samples exhibit a very similar temperature dependence. In particular, the resonance energy from the absorption-type reflectance data increases with increasing temperature that is typical for the studied materials. At higher temperatures, however, the PL increasingly develops a finite Stokes shift with its energy being lower than that extracted from reflectance. In three-dimensional (3D) perovskites, a Stokes shift that increases with temperature was recently attributed to polaron-type effects 52, albeit its magnitude was much larger, about factor of three, in contrast to our observations in 2D perovskites.
References
- Ishihara et al. 1989 Ishihara, T.; Takahashi, J.; Goto, T. Exciton state in two-dimensional perovskite semiconductor (C10H21NH3)2PbI4. Solid State Communications 1989, 69, 933–936
- Mitzi et al. 1994 Mitzi, D. B.; Feild, C. A.; Harrison, W. T. A.; Guloy, A. M. Conducting tin halides with a layered organic-based perovskite structure. Nature 1994, 369, 467–469
- Muljarov et al. 1995 Muljarov, E.; Tikhodeev, S.; Gippius, N.; Ishihara, T. Excitons in self-organized semiconductor/insulator superlattices: PbI-based perovskite compounds. Physical Review B 1995, 51, 14370–14378
- Kagan et al. 1999 Kagan, C. R.; Mitzi, D. B.; Dimitrakopoulos, C. Organic-Inorganic Hybrid Materials as Semiconducting Channels in Thin-Film Field-Effect Transistors. Science 1999, 286, 945–947
- Kumar et al. 2016 Kumar, S.; Jagielski, J.; Yakunin, S.; Rice, P.; Chiu, Y.-C.; Wang, M.; Nedelcu, G.; Kim, Y.; Lin, S.; Santos, E. J. G.; Kovalenko, M. V.; Shih, C.-J. Efficient Blue Electroluminescence Using Quantum-Confined Two-Dimensional Perovskites. ACS Nano 2016, 10, 9720–9729
- Tsai et al. 2016 Tsai, H. et al. High-efficiency two-dimensional Ruddlesden–Popper perovskite solar cells. Nature 2016, 536, 312–316
- Wang et al. 2016 Wang, N. et al. Perovskite light-emitting diodes based on solution-processed self-organized multiple quantum wells. Nature Photonics 2016, 10, 699–704
- Tsai et al. 2018 Tsai, H. et al. Stable Light-Emitting Diodes Using Phase-Pure Ruddlesden-Popper Layered Perovskites. Advanced Materials 2018, 30, 1704217
- Chen et al. 2018 Chen, Y.; Sun, Y.; Peng, J.; Tang, J.; Zheng, K.; Liang, Z. 2D Ruddlesden-Popper Perovskites for Optoelectronics. Advanced Materials 2018, 30, 1703487
- Xing et al. 2018 Xing, J. et al. Color-stable highly luminescent sky-blue perovskite light-emitting diodes. Nature Communications 2018, 9, 3541
- Mitzi 1999 Mitzi, D. B. Synthesis , Structure , and Properties of Organic-Inorganic Perovskites and Related Materials; 1999
- Zhang et al. 2019 Zhang, L.; Liu, Y.; Yang, Z.; Liu, S. F. Two dimensional metal halide perovskites: Promising candidates for light-emitting diodes. Journal of Energy Chemistry 2019, 37, 97–110
- Ortiz-Cervantes et al. 2019 Ortiz-Cervantes, C.; Carmona-Monroy, P.; Solis-Ibarra, D. Two-Dimensional Halide Perovskites in Solar Cells: 2D or not 2D? ChemSusChem 2019, 12, 1560–1575
- Tanaka et al. 2005 Tanaka, K.; Takahashi, T.; Kondo, T.; Umebayashi, T.; Asai, K.; Ema, K. Image charge effect on two-dimensional excitons in an inorganic-organic quantum-well crystal. Physical Review B 2005, 71, 045312
- Gauthron et al. 2010 Gauthron, K.; Lauret, J.-S.; Doyennette, L.; Lanty, G.; Al Choueiry, A.; Zhang, S. J.; Brehier, A.; Largeau, L.; Mauguin, O.; Bloch, J.; Deleporte, E. Optical spectroscopy of two-dimensional layered (C_6H_5C_2H_4-NH_3)_2-PbI_4 perovskite. Optics Express 2010, 18, 5912
- Yaffe et al. 2015 Yaffe, O.; Chernikov, A.; Norman, Z. M.; Zhong, Y.; Velauthapillai, A.; van der Zande, A.; Owen, J. S.; Heinz, T. F. Excitons in ultrathin organic-inorganic perovskite crystals. Physical Review B 2015, 92, 045414
- Guo et al. 2016 Guo, Z.; Wu, X.; Zhu, T.; Zhu, X.; Huang, L. Electron–Phonon Scattering in Atomically Thin 2D Perovskites. ACS Nano 2016, 10, 9992–9998
- Wright et al. 2016 Wright, A. D.; Verdi, C.; Milot, R. L.; Eperon, G. E.; Pérez-Osorio, M. A.; Snaith, H. J.; Giustino, F.; Johnston, M. B.; Herz, L. M. Electron–phonon coupling in hybrid lead halide perovskites. Nature Communications 2016, 7, 11755
- Ni et al. 2017 Ni, L.; Huynh, U.; Cheminal, A.; Thomas, T. H.; Shivanna, R.; Hinrichsen, T. F.; Ahmad, S.; Sadhanala, A.; Rao, A. Real-Time Observation of Exciton–Phonon Coupling Dynamics in Self-Assembled Hybrid Perovskite Quantum Wells. ACS Nano 2017, 11, 10834–10843
- Straus and Kagan 2018 Straus, D. B.; Kagan, C. R. Electrons, Excitons, and Phonons in Two-Dimensional Hybrid Perovskites: Connecting Structural, Optical, and Electronic Properties. The Journal of Physical Chemistry Letters 2018, 9, 1434–1447
- Blancon et al. 2018 Blancon, J.-C. et al. Scaling law for excitons in 2D perovskite quantum wells. Nature Communications 2018, 9, 2254
- Baranowski et al. 2019 Baranowski, M.; Zelewski, S. J.; Kepenekian, M.; Traoré, B.; Urban, J. M.; Surrente, A.; Galkowski, K.; Maude, D. K.; Kuc, A.; Booker, E. P.; Kudrawiec, R.; Stranks, S. D.; Plochocka, P. Phase-Transition-Induced Carrier Mass Enhancement in 2D Ruddlesden–Popper Perovskites. ACS Energy Letters 2019, 4, 2386–2392
- Cho and Berkelbach 2019 Cho, Y.; Berkelbach, T. C. Optical Properties of Layered Hybrid Organic–Inorganic Halide Perovskites: A Tight-Binding GW-BSE Study. The Journal of Physical Chemistry Letters 2019, 10, 6189–6196
- Srimath Kandada and Silva 2020 Srimath Kandada, A. R.; Silva, C. Exciton Polarons in Two-Dimensional Hybrid Metal-Halide Perovskites. The Journal of Physical Chemistry Letters 2020, 3173–3184
- Egger et al. 2018 Egger, D. A.; Bera, A.; Cahen, D.; Hodes, G.; Kirchartz, T.; Kronik, L.; Lovrincic, R.; Rappe, A. M.; Reichman, D. R.; Yaffe, O. What Remains Unexplained about the Properties of Halide Perovskites? Advanced Materials 2018, 30, 1800691
- Straus et al. 2016 Straus, D. B.; Hurtado Parra, S.; Iotov, N.; Gebhardt, J.; Rappe, A. M.; Subotnik, J. E.; Kikkawa, J. M.; Kagan, C. R. Direct Observation of Electron–Phonon Coupling and Slow Vibrational Relaxation in Organic–Inorganic Hybrid Perovskites. Journal of the American Chemical Society 2016, 138, 13798–13801
- Delor et al. 2020 Delor, M.; Weaver, H. L.; Yu, Q.; Ginsberg, N. S. Imaging material functionality through three-dimensional nanoscale tracking of energy flow. Nature Materials 2020, 19, 56–62
- Baranowski and Plochocka 2020 Baranowski, M.; Plochocka, P. Excitons in Metal-Halide Perovskites. Advanced Energy Materials 2020, 1903659
- Deng et al. 2020 Deng, S.; Shi, E.; Yuan, L.; Jin, L.; Dou, L.; Huang, L. Long-range exciton transport and slow annihilation in two-dimensional hybrid perovskites. Nature Communications 2020, 11, 664
- Seitz et al. 2020 Seitz, M.; Magdaleno, A. J.; Alcázar-Cano, N.; Meléndez, M.; Lubbers, T. J.; Walraven, S. W.; Pakdel, S.; Prada, E.; Delgado-Buscalioni, R.; Prins, F. Exciton diffusion in two-dimensional metal-halide perovskites. Nature Communications 2020, 11, 2035
- Akselrod et al. 2014 Akselrod, G. M.; Deotare, P. B.; Thompson, N. J.; Lee, J.; Tisdale, W. A.; Baldo, M. A.; Menon, V. M.; Bulović, V. Visualization of exciton transport in ordered and disordered molecular solids. Nature Communications 2014, 5, 3646
- Ginsberg and Tisdale 2020 Ginsberg, N. S.; Tisdale, W. A. Spatially Resolved Exciton and Charge Transport in Emerging Semiconductors. Annual Review of Physical Chemistry 2020, 71, annurev–physchem–052516–050703
- Lekina and Shen 2019 Lekina, Y.; Shen, Z. X. Excitonic states and structural stability in two-dimensional hybrid organic-inorganic perovskites. Journal of Science: Advanced Materials and Devices 2019, 4, 189–200
- Castellanos-Gomez et al. 2014 Castellanos-Gomez, A.; Vicarelli, L.; Prada, E.; Island, J. O.; Narasimha-Acharya, K. L.; Blanter, S. I.; Groenendijk, D. J.; Buscema, M.; Steele, G. a.; Alvarez, J. V.; Zandbergen, H. W.; Palacios, J. J.; van der Zant, H. S. J. Isolation and characterization of few-layer black phosphorus. 2D Materials 2014, 1, 025001
- Seitz et al. 2019 Seitz, M.; Gant, P.; Castellanos-Gomez, A.; Prins, F. Long-Term Stabilization of Two-Dimensional Perovskites by Encapsulation with Hexagonal Boron Nitride. Nanomaterials 2019, 9, 1120
- Kulig et al. 2018 Kulig, M.; Zipfel, J.; Nagler, P.; Blanter, S.; Schüller, C.; Korn, T.; Paradiso, N.; Glazov, M. M.; Chernikov, A. Exciton Diffusion and Halo Effects in Monolayer Semiconductors. Physical Review Letters 2018, 120, 207401
- Raja et al. 2019 Raja, A.; Waldecker, L.; Zipfel, J.; Cho, Y.; Brem, S.; Ziegler, J. D.; Kulig, M.; Taniguchi, T.; Watanabe, K.; Malic, E.; Heinz, T. F.; Berkelbach, T. C.; Chernikov, A. Dielectric disorder in two-dimensional materials. Nature Nanotechnology 2019, 14, 832–837
- Ashcroft and Mermin 1976 Ashcroft, N.; Mermin, N. Solid State Physics; Brooks Cole, 1976
- Warren et al. 2000 Warren, J. T.; O’Hara, K. E.; Wolfe, J. P. Two-body decay of thermalized excitons in CuO2. Physical Review B 2000, 61, 8215–8223
- Kumar et al. 2014 Kumar, N.; Cui, Q.; Ceballos, F.; He, D.; Wang, Y.; Zhao, H. Exciton-exciton annihilation in MoSe$_2$ monolayers. Physical Review B 2014, 89, 125427
- Yuan et al. 2017 Yuan, L.; Wang, T.; Zhu, T.; Zhou, M.; Huang, L. Exciton Dynamics, Transport, and Annihilation in Atomically Thin Two-Dimensional Semiconductors. The Journal of Physical Chemistry Letters 2017, 8, 3371–3379
- Zipfel et al. 2020 Zipfel, J.; Kulig, M.; Perea-Causín, R.; Brem, S.; Ziegler, J. D.; Rosati, R.; Taniguchi, T.; Watanabe, K.; Glazov, M. M.; Malic, E.; Chernikov, A. Exciton diffusion in monolayer semiconductors with suppressed disorder. Physical Review B 2020, 101, 115430
- Milot et al. 2016 Milot, R. L.; Sutton, R. J.; Eperon, G. E.; Haghighirad, A. A.; Martinez Hardigree, J.; Miranda, L.; Snaith, H. J.; Johnston, M. B.; Herz, L. M. Charge-Carrier Dynamics in 2D Hybrid Metal–Halide Perovskites. Nano Letters 2016, 16, 7001–7007
- Gantmakher and Levinson 1987 Gantmakher, V. F.; Levinson, Y. B. Carrier scattering in metals and semiconductors; North-Holland Physics Publishing, Amsterdam, 1987
- Mott 1969 Mott, N. F. Festkörper Probleme IX; Elsevier, 1969; pp 22–45
- Shklovskii and Efros 1984 Shklovskii, B. I.; Efros, A. L. Electronic Properties of Doped Semiconductors; Springer Series in Solid-State Sciences; Springer Berlin Heidelberg: Berlin, Heidelberg, 1984; Vol. 45
- Oberhauser et al. 1993 Oberhauser, D.; Pantke, K.-H.; Hvam, J. M.; Weimann, G.; Klingshirn, C. Exciton scattering in quantum wells at low temperatures. Physical Review B 1993, 47, 6827–6830
- Kresse and Furthmüller 1996 Kresse, G.; Furthmüller, J. Efficient iterative schemes for ab initio total-energy calculations using a plane-wave basis set. Physical Review B 1996, 54, 11169–11186
- Perdew et al. 1996 Perdew, J. P.; Burke, K.; Ernzerhof, M. Generalized Gradient Approximation Made Simple. Physical Review Letters 1996, 77, 3865–3868
- Tkatchenko and Scheffler 2009 Tkatchenko, A.; Scheffler, M. Accurate Molecular Van Der Waals Interactions from Ground-State Electron Density and Free-Atom Reference Data. Physical Review Letters 2009, 102, 073005
- Mayers et al. 2018 Mayers, M. Z.; Tan, L. Z.; Egger, D. A.; Rappe, A. M.; Reichman, D. R. How Lattice and Charge Fluctuations Control Carrier Dynamics in Halide Perovskites. Nano Letters 2018, 18, 8041–8046
- Guo et al. 2019 Guo, Y.; Yaffe, O.; Hull, T. D.; Owen, J. S.; Reichman, D. R.; Brus, L. E. Dynamic emission Stokes shift and liquid-like dielectric solvation of band edge carriers in lead-halide perovskites. Nature Communications 2019, 10, 1175
- Glazov 2020 Glazov, M. M. Quantum Interference Effect on Exciton Transport in Monolayer Semiconductors. Physical Review Letters 2020, 124, 166802
- Stoumpos et al. 2016 Stoumpos, C. C.; Cao, D. H.; Clark, D. J.; Young, J.; Rondinelli, J. M.; Jang, J. I.; Hupp, J. T.; Kanatzidis, M. G. Ruddlesden–Popper Hybrid Lead Iodide Perovskite 2D Homologous Semiconductors. Chemistry of Materials 2016, 28, 2852–2867
- Peng et al. 2017 Peng, W. et al. Ultralow Self-Doping in Two-dimensional Hybrid Perovskite Single Crystals. Nano Letters 2017, 17, 4759–4767
- Kresse and Joubert 1999 Kresse, G.; Joubert, D. From ultrasoft pseudopotentials to the projector augmented-wave method. Physical Review B 1999, 59, 1758–1775
- Heyd et al. 2003 Heyd, J.; Scuseria, G. E.; Ernzerhof, M. Hybrid functionals based on a screened Coulomb potential. The Journal of Chemical Physics 2003, 118, 8207–8215
- Heyd et al. 2006 Heyd, J.; Scuseria, G. E.; Ernzerhof, M. Erratum: “Hybrid functionals based on a screened Coulomb potential” [J. Chem. Phys. 118, 8207 (2003)]. The Journal of Chemical Physics 2006, 124, 219906
- Boyd et al. 2019 Boyd, C. C.; Cheacharoen, R.; Leijtens, T.; McGehee, M. D. Understanding Degradation Mechanisms and Improving Stability of Perovskite Photovoltaics. Chemical Reviews 2019, 119, 3418–3451
- Seitz et al. 2019 Seitz, M.; Gant, P.; Castellanos-Gomez, A.; Prins, F. Long-Term Stabilization of Two-Dimensional Perovskites by Encapsulation with Hexagonal Boron Nitride. Nanomaterials (Basel, Switzerland) 2019, 9
- Holler et al. 2019 Holler, J.; Bauriedl, L.; Korn, T.; Seitz, S.; Özyigit, F.; Eichinger, M.; Schüller, C.; Watanabe, K.; Taniguchi, T.; Strunk, C.; Paradiso, N. Air tightness of hBN encapsulation and its impact on Raman spectroscopy of van der Waals materials. 2D Materials 2019, 7, 015012
- 62 Byrnes, S. J. Multilayer optical calculations. http://arxiv.org/pdf/1603.02720v3