Testing the cosmic opacity at higher redshifts: implication from quasars with available UV and X-ray observations
Abstract
In this paper, we present a cosmological model-independent test for the cosmic opacity at high redshifts (). We achieve this with the opacity-dependent luminosity distances derived from nonlinear relation between X-ray and UV emissions of quasars, combined with two types of opacity-independent luminosity distances derived from the Hubble parameter measurements and simulated gravitational wave (GW) events achievable with the Einstein Telescope (ET). In the framework of two phenomenological parameterizations adopted to describe cosmic opacity at high redshifts, our main results show that a transparent universe is supported by the current observational data at 2 confidence level. However, the derived value of the cosmic opacity is slightly sensitive to the parametrization of , which highlights the importance of choosing a reliable parametrization to describe the optical depth in the early universe. Compared with the previous works, the combination of the quasar data and the /GW observations in similar redshift ranges provides a novel way to confirm a transparent universe ( at higher redshifts ), with an accuracy of . More importantly, our findings indicate that a strong degeneracy between the cosmic opacity parameter and the parameters characterizing the relation of quasars, which reinforces the necessity of proper calibration for such new type of high-redshift standard candle (in a cosmological model-independent way).
Subject headings:
galaxies: quasars: emission lines-cosmology: observations1. Introduction
It is well recognized in modern cosmology that our universe is undergoing an accelerated expansion at the current stage, and this conclusion is supported by the most direct evidence that type Ia supernovae (SNe Ia) are unexpected observed to be fainter than expected in a decelerating universe (Riess et al., 1998; Perlmutter et al., 1999; Scolnic et al., 2018). Besides a new cosmological component exerting negative pressure (cosmological constant being the simplest candidate) (Ratra & Peebles, 1988; Caldwell et al., 1998; Cao et al., 2011; Cao & Liang, 2013; Cao & Zhu, 2014; Ma et al., 2017; Qi et al., 2018), some other different theories or mechanisms have also been proposed to explain the observed SNe Ia dimming (Qi et al., 2017; Xu et al., 2018). Indeed, soon after the discovery of cosmic acceleration, it was suggested that SNe Ia observations could be affected by the non-conservation of photon number in the beam of emitted light. From theoretical point of view such so-called cosmic opacity may be due to many possible mechanisms. The standard mechanism focuses on the photon absorbtion or scattering by dust particles in the Milky Way, intervening galaxies and the host galaxy (Tolman, 1930). Some other exotic mechanisms for cosmic opacity discuss the conversion of photons into gravitons (Chen, 1995), light axions in the presence of extragalactic magnetic fields (Csaki et al., 2002; Avgoustidis et al., 2010; Jaeckel & Ringwald, 2010), or Kaluza-Klein modes associated with extra-dimensions (Deffayet & Uzan, 2000). Up to now, more than 1000 SNe Ia have been detected (Scolnic et al., 2018), hence the constraints on cosmological parameters inferred from SNe Ia are currently more suffering from the systematic errors (Qi et al., 2019b). Cosmic opacity might be an important source of systematic errors in this respect and it becomes increasingly important to quantify the transparency of the Universe.
In the previous works, two general methods have been widely applied to obtain model-independent constraints on the cosmic opacity, through the combination of opacity-dependent luminosity distances (LD) derived from SNe Ia observations and other sources of opacity-independent cosmological distance observations. The first method generally focus on angular diameter distances (ADD) inferred from galaxy clusters or baryon acoustic oscillations (BAO) (More et al., 2009; Chen, 2012; Li et al., 2013), while the second approach is based on the opacity-independent luminosity distances reconstructed by the Hubble parameter () measurements of differential ages of passively evolving galaxies — the so called cosmic chronometers (Holanda et al., 2013; Liao et al., 2013, 2015; Jesus & Dantas, 2017; Wang et al., 2017). It is worth noting that the first method relies on a fundamental relation known as “distance duality relation” (DDR) (Etherington, 1933, 2007; Cao & Liang, 2011), which states that LD and ADD are quantitatively related as , where and are respectively the LD and ADD at the same redshift . This relation is valid in any metric theory of gravity, provided the number of photons is conserved within the beam (Ellis, 2007). As was pointed out by (Avgoustidis et al., 2010), an opacity parameter can be introduced to describe the optical depth associated with cosmic absorption. In the case of standard candles, the flux received by the observer will be reduced by a factor of and the observed LD () should be rewritten as
| (1) |
where represents the true luminosity distance. The photon number in the beam from a source at to an observer at will be reduced when .
Since the nature of cosmic opacity is unknown, it is still an open question whether it can be partly responsible for the dimming of standard candles at higher redshifts. In this work, in order to test the transparency of the universe spanning a wide redshift range, we will use the quasar data compiled by Risaliti & Lusso (2019) as the source of LDs potentially affected by the opacity (). These luminosity distances were proposed to be assessed from the nonlinear relation between the ultraviolet (UV) and X-ray luminosity (Risaliti & Lusso, 2015; Zheng et al., 2020; Liu et al., 2020). On the other hand, it is also rewarding to have objects with measurable luminosity distances spanning a wide redshift range. Therefore, two types of opacity-free distance probes will also be included in our analysis, i.e., 31 Hubble parameter measurements from differential ages of passively evolving galaxies (Jimenez &Stern, 2003; Simon et al., 2005; Stern & Stanford, 2005; Moresco & Cimatti, 2012; Zhang et al., 2014; Moresco, 2015; Moresco et al., 2016) and simulated gravitational waves (GWs) based on the future generation of GW detector – the Einstein Telescope (ET) (Qi et al., 2019b; Wei, 2019; Dalal et al., 2006; Taylor, et al., 2012; Zhao et al., 2011; Cai et al., 2016). Specially, the waveform signals of GWs from inspiralling and merging compact binaries have the advantage of being insensitive to the non-conservation of photon number (Abbott et al., 2016, 2017). Therefore, GW standard sirens provide a new way to determine the opacity-independent luminosity distances of quasars at the same redshifts (Schutz, 1986), because GWs propagate freely through a perfect fluid without any absorption and dissipation, unaffected by the opacity of the universe. Note that in the framework of the third-generation ground based GW detectors, the observational constraints on the cosmic opacity can be extended to the distant universe (), with a large amount of high-redshift inspiral events registered per year at its design sensitivity (ET Project, 2008). Hence, the so-called “redshift desert” problem could be alleviated to some extent with respect to the exploration of the cosmic opacity.
The paper is organized as follows. In Section 2, we present the observational data used in our work, including the quasars sample, Hubble parameter measurements and the simulated GW sample. In Section 3, we introduce the phenomenological parameterizations of the cosmic opacity , and furthermore present the unbiased cosmic-opacity constraints. Finally, the main conclusions are summarized and discussed in Section 4.
2. observational and simulated data
In this section, we will briefly introduce the methodology of deriving two different types of cosmological distances, i.e., opacity-dependent luminosity distances from quasar measurements in X-ray and UV bands (standard candles), as well as opacity-independent luminosity distance inferred from the current data (cosmic chronometers) and future GW observations (standard sirens).
2.1. Opacity-dependent luminosity distances from quasars
In order to measure the luminosity distance at cosmological scales, one always turns to the most luminous sources of known (or standardizable) intrinsic luminosity. Quasars have always been considered as very promising candidates for this role, since they can be observed up to very high redshifts and are one of the brightest sources in the Universe. Considering the extreme variability and a wide luminosity range in quasars, many previous studies have used different relations to indirectly derive their luminosity distances, i.e., the Baldwin effect (Baldwin, 1977), the Broad Line Region radius - luminosity relation (Watson et al., 2011), and the properties of highly accreting quasars (Wang et al., 2013). In this paper, we make use of the recent progress made in the nonlinear relation between the UV and X-ray luminosities of quasars (Avni & Tananbaum, 1986), which provides an effective approach to construct the Hubble diagram beyond the redshift limit of SNe Ia (Risaliti & Lusso, 2015).
In the framework of a scenario generally recognized in the studies of quasars, the UV photons are emitted by an accretion disk and the X-rays are generated by Compton upscattered photons from an overlying hot corona. Therefore, the non-linear relation between luminosities in the X-rays () and UV band () can be expressed as
| (2) |
where and represent the rest-frame monochromatic luminosity at 2keV and 2500 (), while and denote the intercept and the slope parameter, respectively. Such relation can be rewritten in terms of the fluxes , the slope and the normalization constant :
| (3) |
where is a constant that quantifies the slope and the intercept, .
Unfortunately, it should be pointed that quasars always display a very high intrinsic scatter in the observed relation, which remains one of the major disadvantages in measuring quasar distances with high precision in this approach. Based on the parent sample of 1138 quasars from the COSMOS survey (Lusso et al., 2010) and the Sloan Digital Sky Survey (SDSS) and XMM spectra (Young et al., 2010), Risaliti & Lusso (2015) built the “best sample” of 808 quasars suitable for cosmological applications, focusing on the difference between the intrinsic and observational dispersion in the relation. More specifically, it was found that when quality filters are applied to the parent quasar sample (discarding the broad absorption line and radio-loud quasars), the dispersion previously estimated at the level of will be significantly reduced, with the derived value of the slope parameter and the dispersion . The subsequent studies indicated that the observed dispersion could quantify two distinct contributions: a scatter due to various observational effects and an intrinsic scatter related to unknown physics (Lusso & Risaliti, 2016; Risaliti & Lusso, 2017; Bisogni et al., 2017; Risaliti & Lusso, 2019). Following this direction, a sub-sample of quasars was identified without the major contributions from uncertainties in the measurement of the (2keV) X-ray flux, absorption in the spectrum in the UV and in the X-ray wavelength ranges, variability of the source and non-simultaneity of the observation in the UV and X-ray bands, inclination effects affecting the intrinsic emission of the accretion disc, and the selection effects due to the Eddington bias (Risaliti & Lusso, 2017). Great efforts have also been made to quantify the observational effects, with the intrinsic dispersion attested to be smaller than 0.15 dex (Risaliti & Lusso, 2019).
Besides the dispersion in the relation, the reliability and effectiveness of the method also strongly depend on its possible evolution with redshifts, which should be checked on quasar sub-samples in different redshift intervals (Bisogni et al., 2017). Taking the above effects into full consideration, Risaliti & Lusso (2019) collected a sample of 1598 high-quality quasars with available X-ray and UV measurements, based on the cross-correlation of the XMM-Newton Serendipitous Source Catalogue Data Release 7 (Rosen et al., 2016) and the Sloan Digital Sky Survey (SDSS) quasar catalogues from Data Release 7 (Shen et al., 2011) and Data Release 12 (Paris et al., 2017). With the gradually refined selection technique and flux measurements, as well as the elimination of systematic errors caused by various aspects, the final results showed that such quasar sample could produce a Hubble diagram in excellent agreement with the concordance CDM model and the SNe Ia sample in the redshift range of , with accurate determination of the slope parameter and smaller dispersion . Therefore, new measurements of the expansion rate of the universe could be performed in the range , which has never been explored before by any other cosmological probe. The intercept parameter still needs to be calibrated by using an external calibrator like SNe Ia. Such analysis has already been implemented in Risaliti & Lusso (2015), which seek constraints on the intercept and cosmological parameters in the non-flat CDM model, using a smaller sample of quasars data available. It is worth noting that even is considered as a free parameter in the cosmological fit, the cross-calibration is still necessary since both SNe and quasars are used as “standardized candles” and the cosmological parameters are obtained from the same physical quantity, i.e., the distance modulus. Following the approach analogous to what is done with Type Ia SNe, Melia (2019) used the recently assembled quasar sample (Risaliti & Lusso, 2019) to compare the predictions of two distinct cosmological models ( and CDM cosmologies). Along with the free parameters of the cosmology () itself, parameters characterizing the nonlinear relation between X-ray and UV emissions of quasars (, , and ) are simultaneously constrained in a global fitting on the quasar data alone. Such methodology, which generated the best-fit parameters of , , and in the CDM model, still requires the use of model-dependent luminosity distances to provide the inferred luminosities and thus the constants quantifying the relation of quasars.
Finally, it should be emphasized that the cosmic opacity could affect the LD measurements of quasars, as displayed in Eq. (1). From this point of view, one might gain hints whether the dispersion of the flux measurements are affected by the X-ray/UV absorption unaccounted for in the data reduction process (even though dust extinction has been carefully considered in the sample selection).
2.2. Opacity-independent luminosity distances from cosmic chronometers
For the current observations of Hubble parameter, we turn to the newest compilation covering the redshift range of (Jimenez &Stern, 2003; Simon et al., 2005; Stern & Stanford, 2005; Moresco & Cimatti, 2012; Zhang et al., 2014; Moresco, 2015; Moresco et al., 2016), which consists of 31 cosmic chronometer data and 10 BAO data (see Zheng et al. (2016); Wu et al. (2020) for more details). However, one should be aware that the BAO method is cosmological-model-dependent, i.e., the measurements based on the identification of BAO and the Alcock-Paczyński distortion from galaxy clustering depend on how “standard rulers” evolve with redshift (Blake et al., 2012). On the other hand, the cosmic chronometers approach resulting in measurements is cosmological-model-independent, since the observations of cosmic chronometers via differential ages of passively evolving galaxies are independent of any specific cosmological model. Therefore, in our work we consider only the cosmic chronometer data to reconstruct the function and then derive opacity-independent luminosity distances () within the redshift range of . Specially, in the framework of the FLRW metric in a flat universe, the luminosity distance can be written as
| (4) |
where is the speed of light and is the Hubble parameter at redshift . Here, we use a simple trapezoidal rule to calculate function, the uncertainty associated to the redshift bin is given by
| (5) |
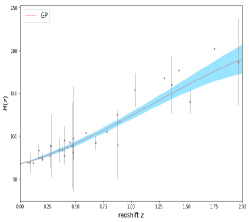
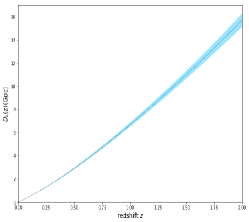
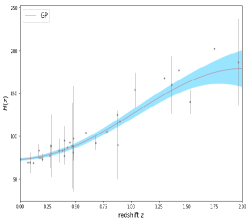
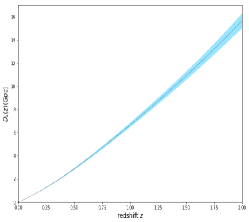
where is the uncertainty of the data. Following the recent works of Cao et al. (2017a, b, 2018, 2019); Qi et al. (2019a); Liu et al. (2019); Zheng et al. (2019), a nonparametric smoothing method of Gaussian Processes (GP) (Seikel et al., 2012a) will be applied to achieve the above reconstructions with the opacity-free expansion rate measurements. Our analysis is based on the publicly available code called the GaPP (Gaussian Processes in Python) 111http://www.acgc.uct.ac.za/ seikel/GAPP/index.html. We refer the reader to Holsclaw et al. (2010); Qi et al. (2018); Wu et al. (2020) for more details about GP reconstructed distances with data.
Moreover, two recent measurements of the Hubble constant: km/s/Mpc with 0.7% uncertainty (Planck Collaboration, 2018) and km/s/Mpc with 2.4% uncertainty (local measurement) (Riess et al., 2016) will be adopted in the distance reconstruction with the GP method. The reconstructed and functions and the corresponding 1 uncertainty strips are shown in Fig. 1.
2.3. Opacity-independent luminosity distances derived from simulated GWs
Another opacity-independent luminosity distance can be derived from the standard sirens, i.e., the gravitational wave signals from inspiraling binary systems consisting of neutron stars (NSs) or mixed neutron stars - black holes (NS-BHs) (Schutz, 1986). Moreover, if the source redshifts can be independently determined from EM counterparts associated with the GW events, these standard sirens will provide a model-independent way to obtain over a wide redshift range, well overlapped with that covered by the quasars. Since the GWs travel in the universe without any absorption or scattering by dust, their luminosity distance will not be affected by cosmic opacity. We simulate GW signals based on the foreseen performance of the third-generation gravitational wave detector – the Einstein Telescope (ET Project, 2008). Such ground-based detector, which is designed to have a fantastic sensitivity in the frequency range of Hz, will detect tens or hundreds of thousand NS-NS inspiral events per year up to the redshift and NS-BH mergers up to . Compared with the advanced detectors such as AdLIGO and AdVirgo, such proposed third-generation detector aims for a broadband factor of 10 sensitivity improvement, especially for the characteristic distance sensitivity (Taylor & Gair, 2012). See Abernathy et al. (2011) for the details of the ET conceptual design study.
Inspired by this, we perform a Monte Carlo simulation of LDs obtainable from the GW signals from NS-NS and NS-BH systems, with sufficiently high signal to noise ratio (SNR) based on the third generation technology (the advanced “xylophone” configuration) 222For the characteristics of ET considered in our analysis, the detector’s noise curve is approximated by the so called “xylophone” configuration, with the corresponding characteristic distance parameter Mpc (Taylor & Gair, 2012).. In our simulation, we take the transparent universe as the baseline model, in the framework of the fiducial cosmological model (flat CDM). Now the GW luminosity distance can be written as
| (6) |
with the matter density parameter and the Hubble constant fixed at and km/s/Mpc from the latest Planck CMB observations (Planck Collaboration, 2018).
Two sources of uncertainties are included in our simulation of the luminosity distances from GW observations. Following the strategy proposed in Cai et al. (2016); Cai & Yang (2017), the distance precision per GW event is
| (7) |
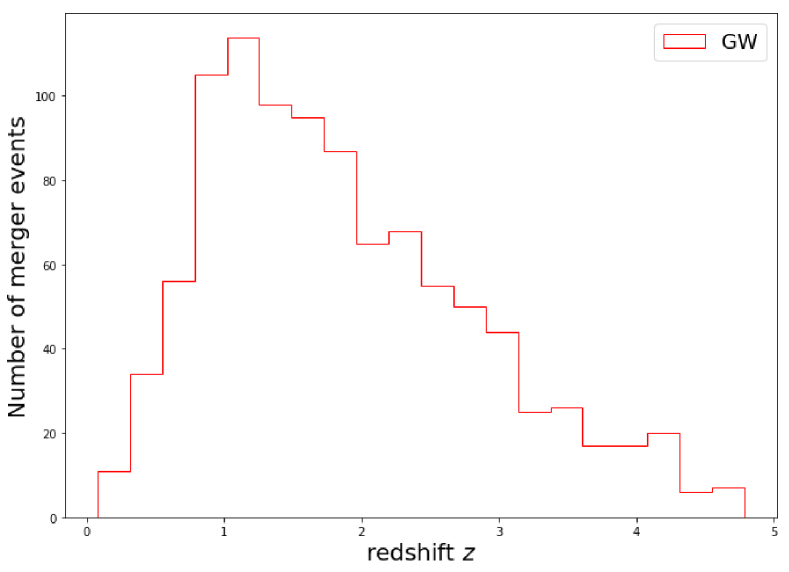
where the instrumental uncertainty is estimated as and denotes the combined signal-noise ratio(SNR) for the three independent detectors (a GW event is usually claimed when the signal-to-noise ratio (SNR) of the detector network reaches above 8) (Zhao et al., 2011). Moreover, the lensing uncertainty due to the line-of-sight (LOS) mass distribution is modeled as (Li, 2015). Following the redshift distribution of GW sources taken after Sathyaprakash et al. (2010) and sampling the the mass of neutron star and black hole within [1,2] and [3,10] , we simulate 1000 GW events observable in the ET and their redshift distribution is shown in Fig. 2. The specific method of simulating the mock data of standard siren events is similar with Qi et al. (2019a, b).
3. Observational constraints on the cosmic opacity
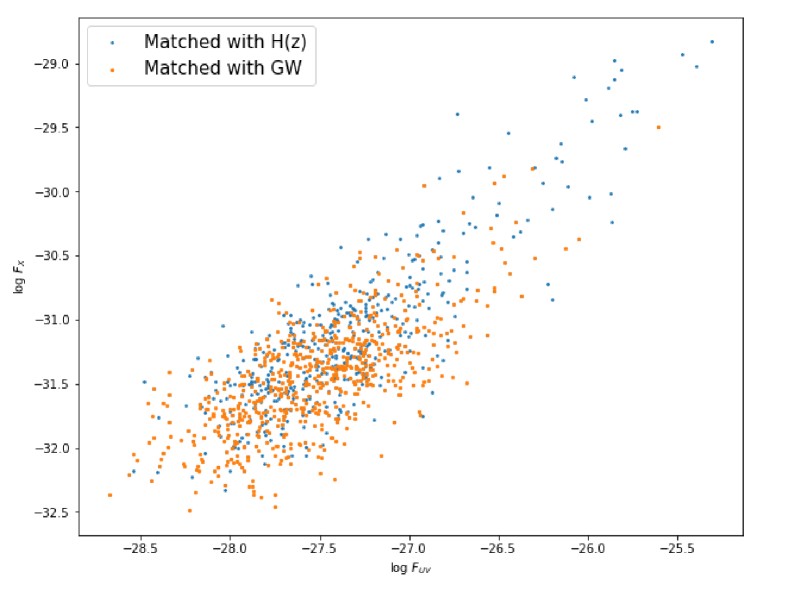
It should be recalled that, using X-ray and UV emission of quasars to derive the luminosity distance (according to the relation in Eq. (3)) requires the knowledge of and parameters. In this paper, we follow a common procedure extensively applied in the SNe Ia cosmology, i.e., the light curves of these standard candles are characterized by several “nuisance” parameters are optimized along with the unknown parameters of the cosmological model (Wei, 2019; Liao et al., 2015; Qi et al., 2019b). Similarly, in our analysis the and parameters will be fitted jointly with the parameters associated with the cosmic opacity. In addition, in order to avoid the corresponding bias of redshift differences between the opacity-independent and opacity-dependent LDs, a selection criterion () for a given pair of data is used. The scatter plot of the quasar sub-sample are shown in Fig. 3, which shares the same redshifts of the opacity-independent luminosity distances from cosmic chronometers and simulated GW events.
In order to constrain the cosmic-opacity parameter (), we perform Markov Chain Monte Carlo (MCMC) simulation to minimize the objective function defined as
| (8) |
where is the uncertainty of the -th X-ray flux measurement 333Since the uncertainty of the UV flux measurement is much lower than and , we ignore it in the uncertainty budget (Risaliti & Lusso, 2019)., and denotes the global intrinsic dispersion (and we treat it as a nuisance parameter as well). The function that quantifies the theoretical prediction of the X-ray flux from the UV flux is defined as
| (9) | |||||
where is the LD calculated from the reconstructed Hubble parameter or the simulated GW data. The uncertainty can be calculated through the error propagation formula
| (10) |
where and are respectively given by Eq. (5) and (7). The summarization is performed over the total data pairs ( for the data and for the simulated GW data). Note that the sample size of the data pairs is smaller than the original quasar sample, suffering from the limited redshift range of the measurements and the limited sample size of the simulated GW events. However, such procedure allows avoiding possible systematic errors brought by redshift difference. Regarding the parametrization of the cosmic opacity, two particular parameterizations of phenomenological have been extensively discussed in the above quoted papers (Li et al., 2013; Liao et al., 2013)
| (11) |
where is a constant to be constrained by observational data. One should expect to be the best-fit parameters in the confidence contours, if it is consistent with photon conservation and there is no visible violation of the transparency of the universe.
| Parametrization [Data] ( prior) | ||||
| P1 [QSO+H(z)] (Planck ) | ||||
| P2 [QSO+H(z)] (Planck ) | ||||
| P1 [QSO+H(z)] (Local ) | ||||
| P2 [QSO+H(z)] (Local ) | ||||
| P1 [QSO+GW] (Planck ) | ||||
| P2 [QSO+GW] (Planck ) |
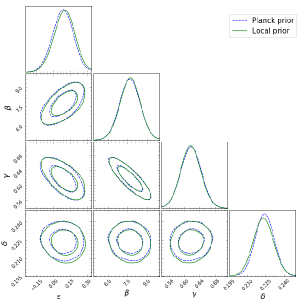
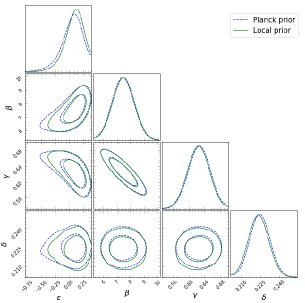
Let’s start with the GP reconstructed from the Hubble parameter measurements. For the first parametrization P1, we obtain the best-fitted value for the cosmic-opacity parameter: and (at 68.3% confidence level) with two different priors on from the latest Planck CMB observations and local Hubble constant measurements, respectively. Working on the second parametrization P2, the best fit takes place at and (at 68.3% confidence level). In general, even though our analysis supports a slight preference for the non-zero cosmic opacity at , the results are still consistent with zero cosmic opacity within confidence level. Graphic representations and numerical results of the constraints on the opacity parameter and quasar nuisance parameters (, , ) for P1 and P2 parameterizations are shown in Fig. 4-5 and Table 1. The significant effect of the nonlinear relation between X-ray and UV emissions of quasars should be pointed out: our results reveal a strong degeneracy between the cosmic opacity parameter () and the quasar parameters ( and ), i.e., a larger slope parameter and a lower intercept parameter will lead to a transparent unverse (). Such tendency has been extensively discussed in the framework of the SNe Ia data, which confirmed the correlation between the cosmic opacity parameter and the absolute B-band magnitude of SNe Ia (Qi et al., 2019b).
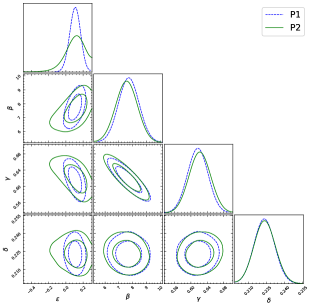
Currently, the Hubble parameter measurements are available only up to the redshift of , therefore we perform similar tests of cosmic opacity by combining the quasar sample and the simulated GW data achievable with future detectors. The advantage of such data combination lies in the fact that more quasars can be used to investigate the opacity of the early universe (), in the framework of the cosmological-model-independent method proposed in this paper. Focusing on the cosmic opacity parameter and quasar parameters (, , ), we give the 1 and 2 contours for the joint distributions of any two parameters in Fig. 6, with the corresponding numerical results displayed in Table 1. For the first parametrization, we get the marginalized 1 constraints of the parameters: , , , and . In the case of second parametrization, the final derived model parameters are: , , , . Compared with the previous results obtained in a low redshift range (), our analysis results are still consistent with an almost transparent universe at much higher redshifts (). Therefore, there is no significant deviation from zero cosmic opacity at the current observational data level, which is supported by the simulated future GW data set and quasars flux measurements within 2 confidence level. Benefit from the increase of the number of QSO/GW pairs satisfying the redshift selection criteria, a considerable amount of high-redshift quasars are included into the final sample. Actually, such a combination of quasars and GWs will enable us to get more precise measurements at the level of and for P1 and P2 parameterizations. Meanwhile, one should also note that the derived value of the cosmic opacity is noticeably sensitive to the parametrization of . Such conclusion, which is different from the findings of some previous works (Li et al., 2013; Liao et al., 2013; Qi et al., 2019b; Ma et al., 2019), highlights the importance of choosing a reliable parametrization to describe the optical depth in the early universe.
One observation should be made is that, while the central values of and may slightly shift with the parametrization of , the 68% confidence ranges are well overlapped for the QSO+ and QSO+GW data combinations. As was mentioned above, such new type of high-redshift standard candle requires proper calibration (in a cosmological model-independent way), considering the strong degeneracy between the opacity parameter and the quasar parameters. One of the most recent studies (Risaliti & Lusso, 2019) tried to derive the slope with quasar sub-samples in different redshift bins and cross-calibrate the intercept with the Union2.1 SNe Ia sample. However, it should be emphasized that the cosmic absorption not only affects the luminosity distances derived from nonlinear relation between X-ray and UV emissions of quasars, but also generates influences on the measured flux of SNe Ia (Li et al., 2013). Specially, considering the fact that the flux received by the observer will be reduced by a factor of , the cosmic opacity enters through the revised relation in terms of the fluxes and two constants (, ) [Eq. (3)]. Therefore, the relation between the UV and X-ray luminosities of quasars could be more accurately calibrated by external low-redshift standard candles like SNe Ia (with redshifts overlapping with quasars), if the cosmic opacity is precisely measured in some other way (i.e., based on the time-delay measurements of galactic-scale strong gravitational lensing systems (Ma et al., 2019)).
Finally, it is interesting to compare our results with the previous opacity constraints involving distances from different observations. On the one hand, many cosmological model-independent methods (such as nearby SNe Ia method, interpolation method and smoothing method) have been applied to reconstruct the opacity-free luminosity distances and match the SNe Ia and data at the same redshift, with the final results that an almost transparent universe is favored at (Liao et al., 2013, 2015). Their results implied for the P1 parametrization and for the P2 parametrization, respectively (Liao et al., 2013). On the other hand, the analysis performed by Li et al. (2013) furthermore examined the cosmic opacity in a particularly low redshift range (), which revealed more stringent constraints ( for P1 parametrization and for P2 parametrization) with the combination of ADDs measured in two galaxy cluster samples and LDs from the Union2.1 SNe Ia sample. One positive conclusion one may draw from this comparison is, the combination of quasars and other EM/GW data could effectively extend the cosmic-opacity measurements to much higher redshifts ().
4. Conclusions and discussion
In this paper, we have discussed a new model-independent cosmological test for the cosmic opacity, the presence of which could potentially lead to a significant deviation from photon number conservation at higher redshifts. Such phenomena is not only related to the foundations of observational cosmology (a transparent universe), but also dependent on some exotic mechanisms which turn photons into unobserved particles through extragalactic magnetic fields (Bassett & Kunz, 2004a, b; Corasaniti, 2006).
We consider the opacity-dependent LDs from the non-linear relation between X-ray and UV flux measurements in the currently largest quasar sample (Risaliti & Lusso, 2019), together with two types of opacity-free LDs respectively derived from the cosmic chronometer data () and simulated GW events based on the future GW observations of the ET (). Focusing on the cosmic opacity parameterized in two different forms, our results show that the cosmic-opacity parameter can be constrained with an accuracy of . Interestingly, the combination of the quasar data and the /GW observations in similar redshift ranges provides a novel way to confirm a transparent universe ( within confidence level) at higher redshifts (). Meanwhile, the derived value of the cosmic-opacity parameter is noticeably sensitive to the parametrization of . Such conclusion, which is different from the findings of some previous works (Li et al., 2013; Liao et al., 2013; Qi et al., 2019b; Ma et al., 2019), highlights the importance of choosing a reliable parametrization to describe the optical depth in the early universe. Finally, our findings strongly imply a degeneracy between the cosmic-opacity parameter () and the parameters characterizing the - relation of quasars (the slope , the intercept ). Therefore, more vigorous and convincing constraints on the nonlinear relation between X-ray and UV emissions of quasars may be expected, with a combined Hubble diagram of SNe Ia (Scolnic et al., 2018) and gamma-ray bursts (GRBs) (Demianski et al., 2017). Such compilation of high-redshift distance indicators, which provides the measurement of opacity-dependent luminosity distance covering the redshift range of , can also be used to check the possible tension between the flat CDM model and high-redshift Hubble diagram of supernovae, quasars, and GRBs (Lusso et al., 2019).
In addition, it is necessary to analyze several sources of systematics that may potentially bias our quantitative analysis of the cosmic opacity. One general concern is given by the fact that corrections of the observed UV fluxes for dust extinction is very necessary and meaningful for the analysis of non-linear relations between the UV and X-ray emission of quasars. Although this problem has been recognized long time ago, the most straightforward solution to this issue is proposed in Risaliti & Lusso (2015, 2019), which indicated that the extinction or reddening on UV flux will underestimate the UV to X-ray ratio and generate a large luminosity distance. One should stress that the nonconservation of the photon number due to cosmic opacity is frequency independent in the observed frequency range. Focusing on the effect of cosmic-opacity parameter in this paper, it mimics three physical effects along the light path: (1) scattering from dust or free electron; (2) astrophysical mechanisms such as gravitational lensing; (3) exotic physics such as photon decay and photon mixing with dilaton or axion (Bassett & Kunz, 2004a, b; Corasaniti, 2006). Our results demonstrate that the cosmic opacity plays a very similar role in the observations of both UV and X-ray fluxes, i.e., the absorption in various wavelength bands will lead to a large value of the normalization constant () and luminosity distance (). The positive correlation between cosmic-opacity parameter, normalization constant, and luminosity distance can be clearly seen from Eq. (3) and Fig. 4-6.
As a final remark, although the constraint on cosmic opacity by using quasars X-ray and UV flux measurements does not significantly improve constraints obtained by using SNe Ia, yet it helps us to gain deeper understanding of cosmic opacity in the early universe. With a bigger, well calibrated quasar sample acting as a new type of standard candle in the future, it is reasonable to expect that the observational quasar data will play an increasingly important role in the cosmic-opacity measurements at higher redshifts.
Acknowledgments
This paper is dedicated to the 60th anniversary of the Department of Astronomy, Beijing Normal University. This work was supported by National Key R&D Program of China No. 2017YFA0402600; the National Natural Science Foundation of China under Grants Nos. 11690023, and 11633001; Beijing Talents Fund of Organization Department of Beijing Municipal Committee of the CPC; the Strategic Priority Research Program of the Chinese Academy of Sciences, Grant No. XDB23000000; the Interdiscipline Research Funds of Beijing Normal University; and the Opening Project of Key Laboratory of Computational Astrophysics, National Astronomical Observatories, Chinese Academy of Sciences. This work was performed in part at Aspen Center for Physics, which is supported by National Science Foundation grant PHY-1607611. This work was partially supported by a grant from the Simons Foundation. M.B. is grateful for this support. He is also grateful for support from Polish Ministry of Science and Higher Education through the grant DIR/WK/2018/12. M.B. obtained approval of foreign talent introducing project in China and gained special fund support of foreign knowledge introducing project. He also gratefully acknowledges hospitality of Beijing Normal University.
References
- Abbott et al. (2016) Abbott, B. P., et al. [LIGO Scientific and Virgo Collaborations], 2016, PRL, 116, 061102
- Abbott et al. (2017) Abbott, B. P., et al. [LIGO Scientific Collaboration, the Virgo Collaboration], 2017, PRL, 119, 161101
- Abernathy et al. (2011) Abernathy, M., et al., “Einstein gravitational wave Telescope: Conceptual Design Study”, 2011 [available from European Gravitational Observatory, document number ET-0106A-10].
- Avgoustidis et al. (2010) Avgoustidis, A., Burrage, C., Redondo, J., Verde L.,& Jimenez, R. 2010, JCAP, 10, 024
- Avni & Tananbaum (1986) Avni, Y., & Tananbaum, H. 1986, ApJ, 305, 83
- Baldwin (1977) Baldwin, J. A. 1977, ApJ, 214, 679
- Bassett & Kunz (2004a) Bassett, B. A., & Kunz, M. 2004a, ApJ, 607, 661
- Bassett & Kunz (2004b) Bassett, B. A., & Kunz, M. 2004b, PRD, 69, 101305
- Bisogni et al. (2017) Bisogni, S., et al. 2017, Front Astron Space. Sci, 4, 68
- Blake et al. (2012) Blake, C. et al. 2012, MNRAS, 425, 405
- Caldwell et al. (1998) Caldwell, R., et al. 1998, PRL, 80, 1582
- Cao & Liang (2011) Cao, S., & Liang, N. 2011, RAA, 11, 1199
- Cao et al. (2011) Cao, S., Liang, N., & Zhu, Z.-H. 2011, MNRAS, 416, 1099
- Cao & Liang (2013) Cao, S., & Liang, N. 2013, IJMPD, 22, 1350082
- Cao & Zhu (2014) Cao, S., & Zhu, Z.-H. 2014, PRD, 90, 083006
- Cao et al. (2017b) Cao, S., Zheng X., Biesiada M., Qi J., Chen Y. & Zhu Z.-H. 2017b, A&A, 606, A15
- Cao et al. (2017a) Cao, S., Biesiada, M., Jackson, J., Zheng, X. & Zhu Z.-H. 2017a, JCAP, 02, 012
- Cao et al. (2018) Cao, S., et al. 2018, ApJ, 867, 50
- Cao et al. (2019) Cao, S., et al. 2019, NatSR, 9, 11608
- Cai et al. (2016) Cai, R.-G., et al. 2016, PRD, 93, 043517
- Cai & Yang (2017) Cai, R.-G. & Yang, T. 2017, PRD, 95, 044024
- Chen (1995) Chen, P. 1995, PRL, 74, 634
- Chen (2012) Chen, J., Wu, P., Yu, H., & Li, Z. 2012, JCAP, 10, 029
- Corasaniti (2006) Corasaniti, P. S. 2006, MNRAS, 372, 191
- Csaki et al. (2002) Csaki, C., et al. 2002, PRL, 88, 161302
- Dalal et al. (2006) Dalal, N., Holz, D. E., Hughes, S.A., Jain, B. 2006, PRD, 74, 063006
- Deffayet & Uzan (2000) Deffayet, C., & Uzan, J.-P. 2000, PRD, 62, 063507
- Demianski et al. (2017) Demianski, M., Piedipalumbo, E., Sawant, D., & Amati, L. 2017, A&A, 598, A112
- Ellis (2007) Ellis, G. F. R. 2007, Gen. Rel. Grav. 39, 1047
- ET Project (2008) The Einstein Telescope Project, https://www.et-gw.eu/et/ Created: 10 October 2008
- Etherington (1933) Etherington, I. M. H. 1933, Phil. Mag., 15, 761
- Etherington (2007) Etherington, I. M. H. 2007, Gen. Rel. Grav., 39, 1055
- Holanda et al. (2013) Holanda, R. F. L., et al. 2013, JCAP, 1304, 027
- Holsclaw et al. (2010) Holsclaw, T., et al. 2010, PRL, 105, 241302
- Jaeckel & Ringwald (2010) Jaeckel, J., & Ringwald, A. 2010, Ann. Rev. Nucl. Part. Sci. 60, 405
- Jesus & Dantas (2017) Jesus, J. F., Holanda, R. F. L., & Dantas, M. A. 2017, General Relativity and Gravitation, 49, 150
- Jimenez &Stern (2003) Jimenez, R., Verde, L., Treu, T., & Stern, D. 2003, ApJ, 593, 622
- Li et al. (2013) Li, Z., et al. 2013, PRD, 87, 103013
- Li (2015) Li, T. G., Extracting Physics from Gravitational Waves: Testing the Strong-field Dynamics of General Relativity and Inferring the Large-scale Structure of the Universe, 2015, Springer
- Liao et al. (2013) Liao, K., et al. 2013, PLB, 718, 1166
- Liao et al. (2015) Liao, K., et al. 2015, PRD, 92, 123539
- Liu et al. (2019) Liu, T. H., et al. 2019, ApJ, 886, 94
- Liu et al. (2020) Liu, T. H., et al. 2020, MNRAS, in press [arXiv:2005.13990]
- Lusso et al. (2010) Lusso, E., et al. 2010, A&A, 512, 34
- Lusso & Risaliti (2016) Lusso, E., & Risaliti, G. 2016, ApJ, 819, 154
- Lusso et al. (2019) Lusso, E., et al. 2019, A&A, 628, L4
- Ma et al. (2017) Ma, Y.-B., et al. 2017, EPJC, 77, 891
- Ma et al. (2019) Ma, Y.-B., et al. 2019, ApJ, 887, 163
- Melia (2019) Melia. 2019, MNRAS, 489, 517
- More et al. (2009) More, S., et al. 2009, ApJ, 696, 1727
- Moresco & Cimatti (2012) Moresco, M., Verde, L., Pozzetti, L., Jimenez, R., & Cimatti, A. 2012, JCAP, 7, 053
- Moresco (2015) Moresco, M. 2015, MNRAS, 450, L16
- Moresco et al. (2016) Moresco, M., Pozzetti, L., Cimatti, A., et al. 2016, JCAP, 5, 014
- Paris et al. (2017) Paris, I. et al., 2017, A&A, 597, 79
- Perlmutter et al. (1999) Perlmutter, S., et al. 1999, ApJ, 517, 565
- Planck Collaboration (2018) Planck Collaboration: Aghanim, N., Akrami, Y., Ashdown, M., et al. 2018, arXiv:1807.06209
- Qi et al. (2017) Qi, J. Z., et al. 2017, EPJC, 77, 02
- Qi et al. (2018) Qi, J.-Z., et al. 2018, RAA, 18, 66
- Qi et al. (2019a) Qi, J. Z., et al. 2019a, PRD, 100, 023530
- Qi et al. (2019b) Qi, J. Z., et al. 2019b, PDU, 26, 100338
- Ratra & Peebles (1988) Ratra, B., & Peebles, P.E.J. 1988, PRD, 37, 3406
- Riess et al. (1998) Riess, A. G., et al. 1998, AJ, 116, 1009
- Riess et al. (2016) Riess, A. G., Macri, L. M., Hoffmann, S. L., et al. 2016, ApJ, 826, 56
- Risaliti & Lusso (2015) Risaliti, G., and Lusso, E. 2015, ApJ, 815, 33
- Risaliti & Lusso (2017) Risaliti, G., and Lusso, E. 2017, AN, 338, 329
- Risaliti & Lusso (2019) Risaliti, G., & Lusso, E. 2019, Nature Astronomy, 3, 272
- Rosen et al. (2016) Rosen, S. R. et al., 2016, A&A, 590, 1
- Sathyaprakash et al. (2010) Sathyaprakash, B., et al. 2010, CQG, 27, 215006
- Seikel et al. (2012a) Seikel, M., Clarkson, C., & Smith, M., 2012, JCAP, 6, 036
- Schutz (1986) Schutz, B. F. 1986, Nature, 323, 310
- Scolnic et al. (2018) Scolnic, D., et al. 2018, ApJ, 859, 101
- Shen et al. (2011) Shen, Y. et al., 2011, ApJ Supp, 194, 45
- Simon et al. (2005) Simon, J., Verde, L., & Jimenez, R. 2005, Phys. Rev. D, 71, 123001
- Stern & Stanford (2005) Stern, D., Jimenez, R., Verde, L., Kamionkowski, M., & Stanford, S. A. 2010, JCAP, 2, 008
- Taylor, et al. (2012) Taylor, S. R., et al. 2012, PRD, 85, 023535
- Taylor & Gair (2012) Taylor, S. R. & Gair, J. R. 2012, PRD, 86, 023502 [arXiv:1204.6739
- Tolman (1930) Tolman, R. C. 1930, Proc. Natl. Acad. Sci., 16, 511
- Wang et al. (2017) Wang, G.-J., Wei, J.-J., Li, Z.-X., Xia, J.-Q., & Zhu, Z.-H. 2017, ApJ, 847, 45
- Watson et al. (2011) Watson, D., et al. 2011, ApJL, 740, L49
- Wang et al. (2013) Wang, J.-M., et al. 2013, PRL, 110, 081301
- Wei (2019) Wei, J.-J. 2019, ApJ, 876, 1
- Wu et al. (2020) Wu, Y., et al. 2020, ApJ, 888, 113
- Xu et al. (2018) Xu, T. P., et al. 2018, JCAP, 06, 042
- Young et al. (2010) Young, M., Risaliti, G. & Elvis, M. 2010, ApJ, 708, 1388
- Zhang et al. (2014) Zhang, C., Zhang, H., Yuan, S., et al. 2014, RAA, 14, 1221
- Zhao et al. (2011) Zhao, W., Van Den Broeck, C., Baskaran, D., & Li, T. 2011, PRD, 83, 023005
- Zheng et al. (2016) Zheng, X.-G., et al. 2016, ApJ, 79, 637
- Zheng et al. (2019) Zheng, X.-G., et al. 2019, EPJC, 79, 637
- Zheng et al. (2020) Zheng, X.-G., et al. 2020, ApJ, 892, 103