Coherent excitation of the highly forbidden electric octupole transition in 172Yb+
Abstract
We report on the first coherent excitation of the highly forbidden electric octupole (E3) transition in a single trapped 172Yb+ ion, an isotope without nuclear spin. Using the transition in 171Yb+ as a reference, we determine the transition frequency to be Hz. We map out the magnetic field environment using the forbidden electric quadrupole (E2) transition and determine its frequency to be Hz. Our results are a factor of () more accurate for the E2 (E3) transition compared to previous measurements. The results open up the way to search for new physics via precise isotope shift measurements and improved tests of local Lorentz invariance using the metastable state of Yb+.
Introduction
The Standard Model of particle physics (SM) successfully describes many phenomena of modern physics. However, it cannot be a complete description of nature as it lacks to explain experimental evidence of, e.g., dark matter and the matter-antimatter asymmetry within the universe. Moreover, gravitation, as covered by the well-tested theory of general relativity, can up until now not be included in the SM in a renormalizable way. Thus, tests of fundamental physics have become an important interdisciplinary field to gather new insights. Here, table-top low energy atomic physics experiments profit from high precision spectroscopy to make them competitive compared to high energy experiments in the search for new physics Safronova et al. (2018). In particular the Yb+ ion is an excellent candidate for this, as it features a directly accessible electric octupole (E3) transition with nHz linewidth to the electronic -state, enabling the study of violation of local Lorentz invariance (LLI) with the highest sensitivity among accessible trapped ion systems Dzuba et al. (2016); Sanner et al. (2019); Shaniv et al. (2018), similar to Tm in neutral atom systems Golovizin et al. (2019). In addition, the Yb+ ion allows for straightforward laser cooling and has two narrow electric quadrupole (E2) transitions that can be accessed from the electronic ground state.
Access to seven stable isotopes of Yb+ enables the search for new physics via the measurement of isotope shifts (IS) of the three narrow optical transitions and their analysis in King-plots. These measurements are especially sensitive for the search of a possible neutron number dependent force, mediated by an unknown boson, coupling electrons with neutrons Delaunay et al. (2017); Flambaum et al. (2018); Berengut et al. (2018, 2020). Very recent measurements of the E2 transitions in Ca+ with accuracies on the order of 10 Hz Knollmann et al. (2019); Solaro et al. (2020) have not yet led to significant signatures. Here, the Yb+ ion is more suitable due to its higher sensitivity of a factor of ten Berengut et al. (2018). In fact, a deviation of 3 from an expected linear behavior of the King-plot of the two E2 transitions in even isotopes of Yb+ was found recently Counts et al. (2020). The reported uncertainties of Hz are not sufficient yet to attribute the deviation clearly to new physics, in contrast to higher-order contributions from nuclear structure Allehabi et al. (2020). More accurate measurements with uncertainties on the Hz to mHz level, comparing the IS of the E2 and E3 transitions in Yb+ will provide a higher sensitivity to new physics as they are of different electronic type Berengut et al. (2018) and the uncertainties of the isotope mass can be eliminated using three transitions Berengut et al. (2020). However, the required precision in the Hz range has not been realized so far in even isotopes of Yb+, as they are magnetic field sensitive to order. With this work, we open up the even isotope 172Yb+ for clock spectroscopy and demonstrate frequency uncertainties at the Hz level for both the (E2) and the (E3) transition and by this improving the literature values by at least five orders of magnitude Roberts et al. (1997); Taylor et al. (1997).
The first laser excitation of the highly forbidden E3 transition in 172Yb+ ions was carried at the National Physical Laboratory (NPL) and led to an uncertainty of 0.7 MHz in the transition frequency and an excitation rate of about 0.03 s-1 on resonance Roberts et al. (1997). Here, we demonstrate the first coherent quantum state control, by achieving 90 % excitation probability for Rabi spectroscopy with 42 ms long pulses. The coherence time is found to be 190(27) ms and the achieved minimum linewidth of the transition is 6.0(6) Hz. We measure the frequency difference to the E3 clock transition in 171Yb+ (, ) with an uncertainty of 2.3 Hz and derive the transition frequency with an uncertainty of 2.4 Hz. For the E2 transition, we obtain an uncertainty of 4.4 Hz. For both frequency measurements we discuss the uncertainties and show that they can be kept at sub-Hz level for transition frequency differences between different isotopes. Our results will open up a way to precise IS measurements in Yb+ and for a rapid and defined preparation of the state for sensitive tests of LLI, increasing current limits by two orders of magnitude Shaniv et al. (2018); Sanner et al. (2019).
Experimental setup
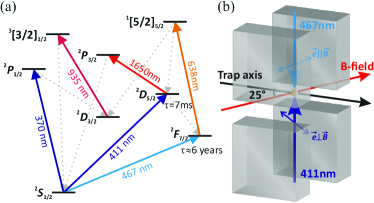
Our experiment is carried out in a radiofrequency (rf) Paul trap, as described in Ref. Keller et al. (2019a). Single ions are Doppler-cooled to 0.5(1) mK on the transition near , assisted by a repumper laser near 935 nm (see Fig. 1). For the interrogation of the E2 transition, we use a frequency-doubled diode laser near , locked to a cavity with a fractional instability of at averaging time Keller et al. (2014), providing the short-term stability of the system. The light is amplified with an injection-locked laser diode and frequency doubled in a periodically poled potassium titanyl phosphate (PPKTP) crystal to . A maximum power of about 0.6 mW is focused down to a waist of at the position of the ion.
Coherent excitation of the E3 transition requires an ultra-stable, high intensity laser source near 467 nm. For that we use a seed laser power of about 0.5 mW near 934 nm from the probe laser of the 171Yb+ single ion optical clock Huntemann et al. (2016) via a stabilized fiber link. We use an acousto-optical modulator (AOM) near 2.3 GHz to bridge the frequency difference and two injection-locked laser diodes for light amplification. The light is frequency-doubled in a periodically poled LiNbO3 (PPLN) waveguide to 467 nm. We obtain about 8 mW of probe light with beam waists of at the ion. During the spectroscopic interrogation, the 934 nm laser is referenced to the E3 clock transition of 171Yb+, a recommended secondary representation of the SI second Huntemann et al. (2012); Riehle et al. (2018).
For both probe lasers, power stabilization, switching and frequency tuning is performed via AOMs. Spectroscopy is carried out after optical pumping using circularly polarized cooling light to prepare population in one of the electronic ground states, followed by the respective probe laser pulse. Excitation is detected by the absence of fluorescence at the 370 nm cooling transition (electron shelving). Repumping is carried out as shown in Fig. 1.
Results on the transition
By coherent control of the E2 transition near 411 nm we achieve an excitation of over 95 % for a -pulse of s duration. Using this transition we map out and minimize magnetic field noise at the ion position, by actively stabilizing the magnetic field as described in Sup . Further, we align the focus of the 467 nm spectroscopy beam onto the ion by maximizing the induced ac Stark shift on the E2 () transition. A frequency shift of 2.1(1) kHz at a peak intensity of W/m2 is observed for a polarization of the 467 nm beam parallel to the quantization axis (see Fig. 1(b)).
We obtain spectra of the transitions by measuring population in the as a function of the frequency of the excitation laser. Alternating of the transitions cancels out slow drifts in the magnetic field. We use excitation pulsed of ms leading to about 80 % excitation probability. Averaging 40 spectra measured within 1.5 h leads to a statistical uncertainty of 2.5 Hz. During this period the 822 nm master laser frequency is calibrated using the primary frequency standard CSF2 Weyers et al. (2018) via an optical frequency comb Falke et al. (2011); Schwarz et al. (2020) using a hydrogen maser as a flywheel oscillator. A drift of the 822 nm locking cavity was accounted for via the data obtained by the frequency comb measurement. The short averaging time leads to an additional statistical uncertainty of 1.3 Hz. We determine the center frequency of the E2 transition to be Hz, improving upon the uncertainty given in literature by a factor of Taylor et al. (1997). The frequency is corrected for known systematic shifts as discussed at the end of the letter.
Excitation of the transition
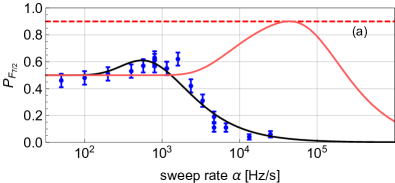
To initially observe the E3 transition within the large uncertainty interval of 1.4 MHz Roberts et al. (1997), we employ a RAP technique. The technique allows for a robust excitation of a transition in the presence of noise, e.g., from the laser source or magnetic fields Noel et al. (2012). This is achieved by sweeping the laser frequency adiabatically across the resonance during the spectroscopy pulse. For a reasonably slow sweep rate (with ), the transition probability reaches at least 50 %, without exact knowledge of the present noise figure and origin (e.g. frequency fluctuations of the probe laser) and exact resonant Rabi frequency Noel et al. (2012); Lacour et al. (2007). We choose the transitions as they are least magnetic field sensitive (kHz/T) in a field of T. After minimization of environmental noise sources, we use pulses of maximum intensity and sweep the detuning across the expected resonance in windows of Hz for a pulse length of s. We optimize the excitation probability by varying the sweep rate , as shown in Fig. 2(a) (blue). The data is fitted (black) using the model in Refs. Noel et al. (2012); Lacour et al. (2007),
| (1) |
The fit leads to Hz and a noise figure of Hz. At this Rabi frequency a maximum excitation probability of is obtained for pulse times of 360 ms (Hz/s), limited by the noise figure being similar to . However, the RAP technique can serve as a helpful tool to efficiently find the transition in other isotopes for the search of new physics when looking for anomalies in IS Berengut et al. (2018); Counts et al. (2020).
To achieve a higher spectroscopic resolution and faster population transfer, as required for an efficient test of LLI in the -manifold of Yb+, we use Rabi spectroscopy with pulses of constant frequency and intensity. Within the 200 Hz window identified with RAP, the resonance can be found easily. On resonance, Rabi spectroscopy at maximum power leads to , as depicted in Fig. 2 (b) (blue), where Rabi-oscillations of the -state population are shown along with a sinusoidal fit (black) with exponential decaying envelope. The fit leads to decoherence time of ms and Hz, similar to the RAP model. Note that achieving a similar excitation probability using the RAP method would require an intensity of a factor 180(20) higher (Fig. 2(a), solid red) to satisfy .
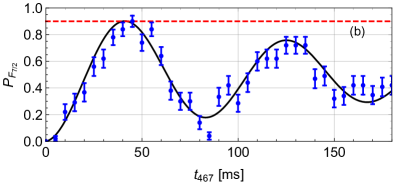
To investigate the minimum achievable linewidth of the transition, we varied the intensity of the spectroscopy beam and the resonant -pulse time accordingly. The fitted linewidths of the spectra (FWHM: full width at half maximum) for several pulse times are shown in Fig. 3 (blue).
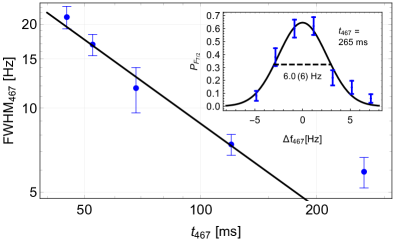
The black line corresponds to the Fourier limit of for rectangular shaped -pulses. The inset shows a spectrum for ms, deviating from the Fourier limit by additional 2.5(7) Hz due to incoherent contributions of the magnetic field during the 180 s of measurement time. The additional broadening is in agreement with the noise level extracted from the RAP measurements.
To determine the frequency, we alternately measure the spectra of the two Zeeman components using -pulses of 124 ms to achieve order magnetic field insensitivity. We average the data over 16 spectra measured within 1 h, leading to a statistical uncertainty of 0.13 Hz. We determine the frequency shift to the () clock transition to be Hz.
For the determination of the transition frequency, the uncertainty of the recommended value of the reference frequency in 171Yb+ of 0.39 Hz Riehle et al. (2018) is taken into account. This yields Hz. The frequencies are corrected for known systematic shifts as discussed in the following.
Systematic shifts and uncertainties
Major contributions to the systematic shifts and their uncertainties are summarized in Tab. 1.
| E2 | E3 | |||
|---|---|---|---|---|
| Effect | ||||
| 935 nm ac Stark | 8.8 | 2.7 | – | |
| quadrupole shift | -9.9 | 2.0 | -0.07 | 0.01 |
| Stark shift (probe light) | 0.003 | 0.002 | 33.0 | 2.3 |
| blackbody radiation | -0.24 | 0.11 | -0.07 | 0.03 |
| total | -1.3 | 3.4 | 32.9 | 2.3 |
For both transitions, an electric quadrupole shift, resulting from the dc trapping potential Itano (2000) and stray electric fields has to be considered. The shift is calculated to be Hz for the E2 and Hz for the (E3) transition for an axial trap frequency of 213(5) kHz and an angle of between the trap axis and the magnetic field. The quadrupole moments are taken from Refs. Nandy and Sahoo (2014); Lange et al. (2020), respectively. The effect of stray electric fields can be estimated from the dc fields required to compensate excess micromotion and is at least an order of magnitude smaller and is included in the uncertainty budget. Note that our trap frequencies, and thus field gradients, show a long term stability of below and quadrupole shifts can be measured and monitored at the mHz level if needed Dubé et al. (2005).
The large intensity of the probe light leads to a significant ac Stark shift of the E3 transition. We deduce the shift by measuring the resonance frequency at different optical powers and extrapolate to zero as described in Sup . With this we obtain an ac Stark shift of 33.0(2.3) Hz for the 124 ms -pulses used in the frequency measurement. For the E2 transition, the ac Stark shift is much smaller. Using the information provided by Refs. Feldker et al. (2018); Roy et al. (2017); Schneider (2005); Roy (2020), we compute the differential polarizability of the used transition at 411 nm to be , leading to a shift of 0.003(2) Hz for the used -pulses of 1.6 ms.
An additional Stark shift stems from blackbody radiation (BBR) Keller et al. (2019b). At an effective temperature at the ion position of 297(3) K Doležal et al. (2015); Nordmann et al. (2020), the BBR shift is calculated to be -0.24(11) Hz for the E2 and Hz for the E3 transition, limited by the instability of the lab temperature. The involved differential polarizability for the E2 transition is computed to be using Refs. Feldker et al. (2018); Roy et al. (2017); Schneider (2005); Roy (2020), where the static value of was corrected for the BBR spectrum Farley and Wing (1981); Schneider (2005), whereas for the E3 transition the value can be found in Ref. Huntemann et al. (2012). Due to the lack of a fast laser shutter during the frequency measurement, the 935 nm repumper beam was present during the E2 interrogation, leading to an ac Stark shift. We determine the shift to be 8.8(2.7) Hz in a separate measurement with interleaved interrogation of the E2 transition with and without the 935 nm laser field. Additional systematic shifts Hz are discussed in the supplemental material Sup .
Combining statistical and systematic uncertainties we obtain a total uncertainty of 4.4 Hz and 2.4 Hz for the frequencies of the E2 and E3 transitions, respectively.
Conclusion
We report on the first coherent excitation of the highly forbidden E3 transition in the even isotope 172Yb+ with an excitation probability of 90 % within 42 ms. Fast and reliable state preparation in the state Zeeman manifold is an important requirement for an improved test of LLI with well-controllable trapped ion Coulomb crystals of 172Yb+ Keller et al. (2019b); Shaniv et al. (2018) to enable a high duty-cycle and give a high signal-to-noise ratio for the LLI signal.
We measured the frequencies of the E2 transition near 411 nm and the E3 transition with an uncertainty of 4.4 Hz and 2.4 Hz, respectively. In particular, in Ref. Berengut et al. (2018) it was proposed that reaching the Hz level in uncertainties of the isotope shifts (IS) of these transitions should allow one to investigate the so-called 8Be anomaly Krasznahorkay et al. (2016).
Probing the sub-Hz regime in IS for the E3 and both E2 transitions is predicted to provide further insights, as the measurement of a third transition will eliminate mass uncertainties and higher-order Standard Model contributions, which can also lead to a nonlinearity Berengut et al. (2020); Allehabi et al. (2020). Sub-Hz accuracy of the systematic shifts can be achieved by transferring techniques demonstrated in the 171Yb+ clock spectroscopy Tamm et al. (2014); Huntemann et al. (2016) to the even isotopes. Alternating interrogation of different isotopes suppresses common mode effects Counts et al. (2020) such as the quadrupole shift, BBR shift and trap-rf-related Stark shift, as the large uncertainties of the quadrupole moments and of the polarizabilities drop out. The BBR shifts can be kept reproducible at the mHz level if the temperature is stabilized to K. For the quardupole shift, the influence of the uncertainties of electric field gradient and angle of quantization axis can be kept stable at sub-mHz levels Dubé et al. (2005). Alternatively, entanglement of different co-trapped isotopes as presented in Ref. Manovitz et al. (2019) can be applied to Yb+ and has proven to reach mHz accuracies in IS measurements of Sr+.
Acknowledgements.
We kindly acknowledge help from Stefan Weyers in the frequency measurement of the quadrupole transition and Atish Roy for support with computation of the state polarizabilities. We thank Michel Wolf and Tjeerd J. Pinkert for work on the magnetic field stabilization and Michael Drewsen for fruitful discussions. This project has been supported by the Deutsche Forschungsgemeinschaft (DFG, German Research Foundation) through grant CRC SFB 1227 (DQ-mat, project B03) and through Germany’s Excellence Strategy – EXC-2123 QuantumFrontiers - 390837967. This work has been supported by the EMPIR project 18SIB05 “Robust Optical Clocks for International Timescales”. This project has received funding from the EMPIR programme co-financed by the Participating States and from the European Unions Horizon 2020 research and innovation programme. This work has been supported by the Max-Planck-RIKEN-PTB-Center for Time, Constants and Fundamental Symmetries.I Supplemental material
I.1 Magnetic field noise cancellation
Excitation of a nanohertz-wide magnetic field sensitive transition requires a high degree of control over the magnetic field environment. In our experiment we reduce fluctuations of the magnetic field by employing a feedback loop with a bandwidth of about 10 Hz. The field is measured with a sensor nearby the vacuum chamber. The loop provides feedback via coils in three dimensions. The arrangement is able to reduce typical quasistatic magnetic field variations to below nT, limited by the distance of about 5.5 cm between the sensor and the ion. During the spectroscopic measurements we ensured that nearby transient disturbances were avoided, limiting the variations to less than nT.
The ac mains voltage at 50 Hz and its higher harmonics lead to a periodic distortion of about nT peak-to-peak (pp) on top of the quantization magnetic field at the ion. This can lead to sidebands and reduced excitation probability on the narrow E3 transition. Employing the E2 transition, we sample this contribution by measuring the resonance frequency of the Zeeman component as a function of a delay relative to a line trigger, as shown in Fig. 4 (red). To compensate for this shift, we employ a shunt circuit that is fed by a waveform, derived by a microcontroller, similar to the approach in Ref. Merkel et al. (2019).
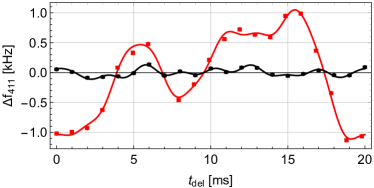
The circuit subtracts a time-dependent current from the original driving current in the quantization field coils leading to a suppression of more than a factor of 5, see Fig. 4 (black). From simulations we find this suppression to be sufficient for excitation of the E3 transitions without significant sideband amplitudes. The method is limited by the day-to-day fluctuations of the ac line noise within the building. Further incoherent contributions to the magnetic field noise are measured to be nT (pp).
I.2 Extrapolation of the ac Stark shift of the E3 transition
To measure the light-induced ac Stark shift of the E3 transition, we measure the resonance frequency of the transition for different beam powers . Assuming a linear behavior Huntemann et al. (2012), we fit the slope to extrapolate to zero intensity. Therefore we determine the beam powers using a calibrated photo-diode. Calibration errors are negligible on the timescales of the measurement. The error in the power reading stems from detection noise and is less than 0.03 mW whereas the linearity of the photo-diode in the used range can be neglected. Errors in the frequency determination stem from fit errors of the respective excitation spectra. Results are shown in Fig. 5 (black) along with the linear fit (blue). The inset shows the fitting residuals.
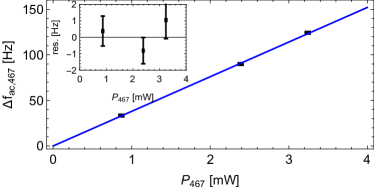
The fit leads to a shift of for the beam parameters used in the experiment, corresponding to Hz, with the Fourier limited linewidth (FWHM) of the spectroscopy -pulse, in agreement with the value for 171Yb+ Huntemann et al. (2012). Drifts due to beam pointing were measured to be Hz during the frequency measurements and are included in the computation of the total uncertainty of the ac Stark shift.
I.3 Additional frequency shifts of the transitions
The major contributions of the systematic frequency shifts and their uncertainties are discussed in the main text. Contributions that are negligible on the current measurement accuracy are given here for completeness. In addition, the gravitational redshift that stems from comparison of the probe laser frequencies to the frequency references is given.
Second-order Doppler shift
To compute the order Doppler shift Keller et al. (2019b), we measure the ion temperature to be 0.5(1) mK via carrier Rabi thermometry on the 411 nm quadrupole transition. Additionally, excess micromotion of the ion contributes to the shift. We compensate this micromotion to below V/m of RF electric field amplitude at the position of the ion. Thus we compute the absolute value of the order Doppler shift to be Hz for both transitions.
Second-order Zeeman shift
For both transitions, we average over two Zeeman components to be order Zeeman insensitive. The order Zeeman shifts in the even isotopes are negligible due to the lack of hyperfine structure and large fine structure splittings of the and states Herschbach et al. (2012); NIS . The shift for alkali-like ions is given by Herschbach et al. (2012), where is the Bohr magneton, the Planck constant and T the absolute value of the magnetic field. For the splittings between the -states and the -states, these shifts are and Hz, including ac contributions due to micromotion and currents of the trap drive Gan et al. (2018).
Second-order Stark shift due to trap rf
The order Stark shift caused by the electric fields of to the trap rf computes to -0.008(5) Hz for the E2 and -0.003(1) Hz for the E3 transition, including the effect of uncompensated excess micromotion and intrinsic micromotion due to the the finite ion temperature Keller et al. (2019b). The involved static differential polarizability for the E2 transition is computed to be using Refs. Feldker et al. (2018); Roy et al. (2017); Schneider (2005); Roy (2020), whereas for the E3 transition the value can be found in Ref. Huntemann et al. (2012).
Gravitational redshift
The values of the transition frequencies were corrected for gravitational
redshifts with uncertainties of 0.004 Hz and 0.005 Hz for
the E2 and E3 transition, respectively Denker et al. (2018).
References
References
- Safronova et al. (2018) M. S. Safronova, D. Budker, D. DeMille, D. F. J. Kimball, A. Derevianko, and C. W. Clark, Rev. Mod. Phys. 90, 025008 (2018).
- Dzuba et al. (2016) V. Dzuba, V. Flambaum, M. Safronova, S. Porsev, T. Pruttivarasin, M. Hohensee, and H. Häffner, Nat. Phys. 12, 465 (2016).
- Sanner et al. (2019) C. Sanner, N. Huntemann, R. Lange, C. Tamm, E. Peik, M. S. Safronova, and S. G. Porsev, Nature 567, 204 (2019).
- Shaniv et al. (2018) R. Shaniv, R. Ozeri, M. S. Safronova, S. G. Porsev, V. A. Dzuba, V. V. Flambaum, and H. Häffner, Phys. Rev. Lett. 120, 103202 (2018).
- Golovizin et al. (2019) A. Golovizin, E. Fedorova, D. Tregubov, D. Sukachev, K. Khabarova, V. Sorokin, and N. Kolachevsky, Nat. Commun. 10, 1 (2019).
- Delaunay et al. (2017) C. Delaunay, R. Ozeri, G. Perez, and Y. Soreq, Phys. Rev. D 96, 093001 (2017).
- Flambaum et al. (2018) V. V. Flambaum, A. J. Geddes, and A. V. Viatkina, Phys. Rev. A 97, 032510 (2018).
- Berengut et al. (2018) J. C. Berengut, D. Budker, C. Delaunay, V. V. Flambaum, C. Frugiuele, E. Fuchs, C. Grojean, R. Harnik, R. Ozeri, G. Perez, and Y. Soreq, Phys. Rev. Lett. 120, 091801 (2018).
- Berengut et al. (2020) J. C. Berengut, C. Delaunay, A. Geddes, and Y. Soreq, (2020), arXiv:2005.06144 [hep-ph] .
- Knollmann et al. (2019) F. W. Knollmann, A. N. Patel, and S. C. Doret, Phys. Rev. A 100, 022514 (2019).
- Solaro et al. (2020) C. Solaro, S. Meyer, K. Fisher, J. C. Berengut, E. Fuchs, and M. Drewsen, (2020), arXiv:2005.00529 [physics.atom-ph] .
- Counts et al. (2020) I. Counts, J. Hur, D. P. L. A. Craik, H. Jeon, C. Leung, J. Berengut, A. Geddes, A. Kawasaki, W. Jhe, and V. Vuletić, (2020), arXiv:2004.11383 [physics.atom-ph] .
- Allehabi et al. (2020) S. O. Allehabi, V. A. Dzuba, V. V. Flambaum, A. V. Afanasjev, and S. E. Agbemava, (2020), arXiv:2001.09422 [physics.atom-ph] .
- Roberts et al. (1997) M. Roberts, P. Taylor, G. P. Barwood, P. Gill, H. A. Klein, and W. R. C. Rowley, Phys. Rev. Lett. 78, 1876 (1997).
- Taylor et al. (1997) P. Taylor, M. Roberts, S. V. Gateva-Kostova, R. B. M. Clarke, G. P. Barwood, W. R. C. Rowley, and P. Gill, Phys. Rev. A 56, 2699 (1997).
- Keller et al. (2019a) J. Keller, D. Kalincev, T. Burgermeister, A. P. Kulosa, A. Didier, T. Nordmann, J. Kiethe, and T. E. Mehlstäubler, Phys. Rev. Applied 11, 011002 (2019a).
- Keller et al. (2014) J. Keller, S. Ignatovich, S. A. Webster, and T. E. Mehlstäubler, Appl. Phys. B 116, 203 (2014).
- Huntemann et al. (2016) N. Huntemann, C. Sanner, B. Lipphardt, C. Tamm, and E. Peik, Phys. Rev. Lett. 116, 063001 (2016).
- Huntemann et al. (2012) N. Huntemann, M. Okhapkin, B. Lipphardt, S. Weyers, C. Tamm, and E. Peik, Phys. Rev. Lett. 108, 090801 (2012).
- Riehle et al. (2018) F. Riehle, P. Gill, F. Arias, and L. Robertsson, Metrologia 55, 188 (2018).
- (21) See supplemental material at [URL will be inserted by publisher].
- Weyers et al. (2018) S. Weyers, V. Gerginov, M. Kazda, J. Rahm, B. Lipphardt, G. Dobrev, and K. Gibble, Metrologia 55, 789 (2018).
- Falke et al. (2011) S. Falke, H. Schnatz, J. S. R. Vellore Winfred, T. Middelmann, S. Vogt, S. Weyers, B. Lipphardt, G. Grosche, F. Riehle, U. Sterr, and C. Lisdat, Metrologia 48, 399 (2011).
- Schwarz et al. (2020) R. Schwarz, S. Dörscher, A. Al-Masoudi, E. Benkler, T. Legero, U. Sterr, S. Weyers, J. Rahm, B. Lipphardt, and C. Lisdat, (2020), arXiv:2005.07408 [physics.atom-ph] .
- Noel et al. (2012) T. Noel, M. R. Dietrich, N. Kurz, G. Shu, J. Wright, and B. B. Blinov, Phys. Rev. A 85, 023401 (2012).
- Lacour et al. (2007) X. Lacour, S. Guérin, L. P. Yatsenko, N. V. Vitanov, and H. R. Jauslin, Phys. Rev. A 75, 033417 (2007).
- Itano (2000) W. Itano, Journal of research of the National Institute of Standards and Technology 105, 829 (2000).
- Nandy and Sahoo (2014) D. K. Nandy and B. K. Sahoo, Phys. Rev. A 90, 050503 (2014).
- Lange et al. (2020) R. Lange, N. Huntemann, C. Sanner, H. Shao, B. Lipphardt, C. Tamm, and E. Peik, (2020), arXiv:2005.14687 [physics.atom-ph] .
- Dubé et al. (2005) P. Dubé, A. A. Madej, J. E. Bernard, L. Marmet, J.-S. Boulanger, and S. Cundy, Phys. Rev. Lett. 95, 033001 (2005).
- Feldker et al. (2018) T. Feldker, H. Fürst, N. V. Ewald, J. Joger, and R. Gerritsma, Phys. Rev. A 97, 032511 (2018).
- Roy et al. (2017) A. Roy, S. De, B. Arora, and B. Sahoo, JPB 50, 205201 (2017).
- Schneider (2005) T. Schneider, Optical frequency standard with a single 171Yb+ ion, Ph.D. thesis, University of Hanover (2005).
- Roy (2020) A. Roy, private communication (2020).
- Keller et al. (2019b) J. Keller, T. Burgermeister, D. Kalincev, A. Didier, A. P. Kulosa, T. Nordmann, J. Kiethe, and T. E. Mehlstäubler, Phys. Rev. A 99, 013405 (2019b).
- Doležal et al. (2015) M. Doležal, P. Balling, P. B. R. Nisbet-Jones, S. A. King, J. M. Jones, H. A. Klein, P. Gill, T. Lindvall, A. E. Wallin, M. Merimaa, C. Tamm, C. Sanner, N. Huntemann, N. Scharnhorst, I. D. Leroux, P. O. Schmidt, T. Burgermeister, T. E. Mehlstäubler, and E. Peik, Metrologia 52, 842 (2015).
- Nordmann et al. (2020) T. Nordmann, A. Didier, M. Doležal, P. Balling, T. Burgermeister, and T. E. Mehlstäubler, in preparation (2020).
- Farley and Wing (1981) J. W. Farley and W. H. Wing, Phys. Rev. A 23, 2397 (1981).
- Krasznahorkay et al. (2016) A. J. Krasznahorkay, M. Csatlós, L. Csige, Z. Gácsi, J. Gulyás, M. Hunyadi, I. Kuti, B. M. Nyakó, L. Stuhl, J. Timár, T. G. Tornyi, Z. Vajta, T. J. Ketel, and A. Krasznahorkay, Phys. Rev. Lett. 116, 042501 (2016).
- Tamm et al. (2014) C. Tamm, N. Huntemann, B. Lipphardt, V. Gerginov, N. Nemitz, M. Kazda, S. Weyers, and E. Peik, Phys. Rev. A 89, 023820 (2014).
- Manovitz et al. (2019) T. Manovitz, R. Shaniv, Y. Shapira, R. Ozeri, and N. Akerman, Phys. Rev. Lett. 123, 203001 (2019).
- Merkel et al. (2019) B. Merkel, K. Thirumalai, J. E. Tarlton, V. M. Schäfer, C. J. Ballance, T. P. Harty, and D. M. Lucas, Rev. Sci. Inst. 90, 044702 (2019).
- Herschbach et al. (2012) N. Herschbach, K. Pyka, J. Keller, and T. E. Mehlstäubler, Appl. Phys. B 107, 891 (2012).
- (44) NIST Atomic Spectra Database http://physics.nist.gov/PhysRefData/ASD.
- Gan et al. (2018) H. C. J. Gan, G. Maslennikov, K.-W. Tseng, T. R. Tan, R. Kaewuam, K. J. Arnold, D. Matsukevich, and M. D. Barrett, Phys. Rev. A 98, 032514 (2018).
- Denker et al. (2018) H. Denker, L. Timmen, C. Voigt, S. Weyers, E. Peik, H. S. Margolis, P. Delva, P. Wolf, and G. Petit, Journal of Geodesy 92, 487 (2018).