Properties of the Hot Ambient Medium of Early-type Galaxies Hosting Powerful Radio Sources
Abstract
We present an archival analysis of Chandra X-ray observations for twelve nearby early-type galaxies hosting radio sources with radio power at 1.4 GHz, similar to the radio power of the radio source in NGC 4261. Previously, in a similar analysis of eight nearby X-ray and optically-bright elliptical galaxies, Werner et al. (2012), found that NGC 4261 exhibited unusually low central gas entropy compared to the full sample. In the central 0.3 kpc of NGC 4261, the ratio of cooling time to freefall time () is less than , indicating that cold clouds may be precipitating out of the hot ambient medium and providing fuel for accretion in the central region. NGC 4261 also hosts the most powerful radio source in the original sample. Because NGC 4261 may represent an important phase during which powerful feedback from a central active galactic nucleus (AGN) is fueled by multiphase condensation in the central kpc, we searched the Chandra archive for analogs to NGC 4261. We present entropy profiles of those galaxies as well as profiles of . We find that one of them, IC 4296, exhibits properties similar to NGC 4261, including the presence of only single phase gas outside of kpc and a similar central velocity dispersion. We compare the properties of NGC 4261 and IC 4296 to hydrodynamic simulations of AGN feedback fueled by precipitation. Over the course of those simulations, the single phase galaxy has an entropy gradient that remains similar to the entropy profiles inferred from our observations.
1 Introduction
Over the past two decades, Chandra has been used to observe the ambient medium of early-type galaxies because of its high sensitivity in the soft X-ray band (0.5-2.0 keV) and its spatial resolution, resulting in 2D spectroscopy of unprecedented quality (e.g. Kim et al. 2018; Diehl & Statler 2007, 2008a, 2008b; Lakhchaura et al. 2018; Sun 2009). The hot atmospheres of those early-type galaxies have provided key clues about the energetic processes known as “feedback” (McNamara & Nulsen, 2012; Soker, 2016; Fabian, 2012). X-ray signatures of feedback processes observed in the hot atmospheres of nearby, early-type galaxies are also commonly and prominently observed in the hot atmospheres of Brightest Cluster Galaxies (BCG), the brightest and most massive galaxies in galaxy clusters. The supermassive black holes at the center of BCGs in clusters interact with the surrounding medium, inflating bubbles of relativistic plasma (e.g. Boehringer et al. 1993; Churazov et al. 2000; Fabian et al. 2003, 2006; Bîrzan et al. 2004; Dunn & Fabian 2006, 2008; Dunn et al. 2005; Forman et al. 2005, 2007; Rafferty et al. 2006; McNamara & Nulsen 2007). One insight from studying feedback processes in galaxy clusters is that the activity state of the central Active Galactic Nucleus (AGN) in a BCG is closely coupled to the thermodynamic state of the Intracluster Medium (ICM) (e.g. Cavagnolo et al., 2008; Rafferty et al., 2008; Voit & Donahue, 2015; Voit et al., 2015a). However, in individual early-type galaxies in groups, like those we discuss in this work, the relationship may be a little more complex (Sun, 2009; Connor et al., 2014). Because the gravitational potential depths are shallower for galaxies in groups than galaxies in clusters, supernova explosions and galactic winds are energetically more important for galaxies than for galaxy clusters. Furthermore, while nearly any reasonable amount of kinetic AGN output can be contained in a cluster atmosphere, the question of whether or not a powerful AGN jet thermalizes its energy output near or far from the AGN depends on the external gas pressure. In turn, the external gas pressure may depend on the large-scale structure the galaxy inhabits.
McNamara & Nulsen (2007, 2012) have summarized the evidence suggesting that black holes suppress the star formation in massive galaxies, but how the accretion onto the black hole is affected by the surrounding hot gas is less clear. Precipitation-regulated feedback models hypothesize that feedback suspends the ambient medium in a state that is marginally stable to multiphase condensation. Feedback input affects the thermodynamic state and susceptibility of the ambient gas to condensation. Feedback output depends sensitively on the rate at which cold clouds precipitate out of the hot medium (Pizzolato & Soker, 2005; Sharma et al., 2012; Gaspari et al., 2012, 2013, 2015, 2017; Voit et al., 2015b, 2017; Wang et al., 2019). Such a system is self-regulated, and finds a balance at the marginally stable point.
Spatially-resolved X-ray spectroscopy of the hot ambient medium provides insight into its thermal evolution. The normalization and shape of an X-ray spectrum yields gas electron density (), temperature (), and metallicity (). Broadly, for early-type galaxies, the temperature of the hot gas is 1 keV with a nearly isothermal radial profile, and the radial profile of the electron density approximately follows a power law. The temperature and density of the X-ray gas, considered independently, do not reveal the thermal history because heating and cooling of gravitationally confined gas can cause it to expand or contract without much change in temperature. However, combining these two X-ray observables to make the quantity provides us with more direct information about thermal history, because changes in correspond directly to changes in the specific entropy of the gas. Only gains and losses of heat energy in the gas can change the entropy, so we can trace the thermal history of the ambient gas of a galaxy cluster by observing the profile , which we will call an entropy profile.
In addition to what we have learned from X-ray observations, numerical simulations show that cool clouds can precipitate out of a galaxy’s hot-gas atmosphere via thermal instability even if the galaxy is in a state of global thermal balance, with heating approximately equal to cooling (McCourt et al., 2012; Sharma et al., 2012; Gaspari et al., 2012). The critical criterion for precipitation is the ratio between the cooling and free-fall times of the gas. Here, the cooling time () is defined to be the time needed for a gas at temperature to radiate an energy per particle, and the free fall time from a galactocentric radius at the local gravitational acceleration is defined to be . We note that these models do not presume to claim that the gas must be freely falling. The parameter merely specifies a useful dynamical timescale that characterizes gravitationally-driven motions. The free-fall time does not assume anything about the turbulence, viscosity, or other fluid properties, and is based on galaxy properties that can be inferred from observations of the stellar light.
In both observations and in simulations (McCourt et al., 2012; Sharma et al., 2012; Gaspari et al., 2012; Li & Bryan, 2014a), cooling appears to be fast enough for a fraction of the hot gas to condense into cold clouds and precipitate out of the hot medium if 10. Precipitation may therefore play an essential role in maintaining the required state of global thermal balance if gas cooled from the hot phase boosts the fuel supply for accretion (Pizzolato & Soker, 2010; Gaspari et al., 2013, 2015; Li & Bryan, 2014a, b). In numerical simulations, accretion of precipitating clouds can produce a black hole fueling rate two orders of magnitude greater than the Bondi accretion rate of ambient gas. Such strong accretion then produces a feedback response that heats the gas, bringing the system into approximate balance near . Voit et al. (2015b) showed that early-type galaxies do indeed have .
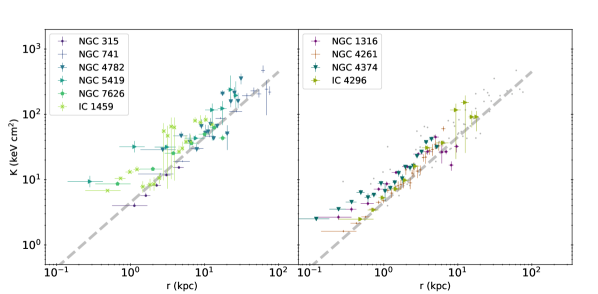
The hot atmosphere of an early-type galaxy can be broadly categorized as single phase gas or multiphase gas, depending on the extent of the H and [N II] emission. Observationally, galaxies with multiphase atmospheres have extended H and [N II] emission present outside their centers (central kpc), whereas galaxies with single phase atmospheres have no evidence for extended H emission outside of kpc. X-ray observations of giant ellipticals from Werner et al. (2012, 2014) showed that single and multiphase galaxies are distinctly bimodal from kpc. The entropy profiles of single phase galaxies scale as , while in multiphase galaxies, the entropy scales as . However, both types exhibit excess entropy in the innermost kpc equivalent to .
While Werner et al. (2012, 2014) showed that both single and multiphase galaxies tend to have entropy excesses relative to a power law in the central kpc, one galaxy differed from the rest. X-ray observations of NGC 4261 from Werner et al. (2012) revealed that the entropy profile of NGC 4261 follows a single power law (), but instead of exhibiting an excess within the central kpc, the power law continues into the central kpc (. The unusually low entropy in the center () results in , putting it slightly below the limit at which precipitation appears inevitable. NGC 4261’s radio luminosity is 2 orders of magnitude greater than the rest of the Werner et al. (2012) sample, and the central jet power is . Adopting a central black hole mass of (Gaspari et al., 2013) would require an implausible 30% mass-energy to jet power conversion efficiency for the radio source to be powered by Bondi accretion alone (Voit et al., 2015b). Simulations from Gaspari et al. (2013, 2015) showed that a transition to chaotic cold accretion could boost the jet power by up to 100 times over what Bondi accretion of hot ambient gas could achieve and occurs when .
Because this transitional regime has not been extensively investigated, we decided to explore it by looking for other galaxies like NGC 4261. To that end, we analyzed an archival sample of Chandra observations of twelve additional early-type galaxies with powerful radio sources. In this paper, we present a summary of our findings for this archival study, which yielded at least one additional nearby analog, IC 4296, that similarly has both a steep entropy profile with at small radii and a powerful radio source.
The structure of our paper is as follows. Section 2 describes our sample selection, data analysis, and our measurements of the thermodynamic properties. Section 3 presents a comparison of profiles to previous works, a comparison with simulations, and an analysis of the effects of metallicity assumptions on our measurements. Section 4 concludes by discussing how our sample adds to the paradigm of precipitation-regulated feedback in massive galaxies. Uncertainties are 1-sigma unless otherwise stated, and we assume a CDM cosmology with and throughout.
2 Sample Selection and Data Analysis
2.1 Sample Selection and Distances
| Galaxy | 1.4 GHz | Obsid | Exp | net cts | Profile | H[N II] | |||||
|---|---|---|---|---|---|---|---|---|---|---|---|
| (Mpc) | () | () | (ks) | per bin | (Y/N) | (1-10 kpc) | (km ) | morphc,c,Based on observations obtained at the Southern Astrophysical Research (SOAR) telescope, which is a joint project of the Ministério da Ciência, Tecnologia, Inovações e Comunicações (MCTIC) do Brasil, the U.S. National Optical Astronomy Observatory (NOAO), the University of North Carolina at Chapel Hill (UNC), and Michigan State University (MSU)ddBased on observations obtained with the Apache Point Observatory 3.5-meter telescope, which is owned and operated by the Astrophysical Research Consortium. | |||
| NGC193 | 0.015 | 63.08 | 2.46 | 0.468 | 11389 | 93.13 | 300 | N | - | 197.64.8 | E |
| NGC315 | 0.016 | 67.20 | 5.88 | 0.973 | 4156 | 53.84 | 930 | N | - | 293.610.1 | U |
| NGC741 | 0.018 | 75.42 | 4.24 | 0.327 | 17198 | 91.02 | 1500 | Y | - | 287.49.3 | N |
| NGC1316 | 0.006 | 25.51 | 1.99 | 9.75 | 2022 | 29.86 | 450 | Y | 0.800.08 | 223.13.3 | E |
| IC1459 | 0.006 | 25.51 | 0.94 | 0.1 | 2196 | 58.00 | 300 | Y | - | 296.16.4 | E |
| NGC3801 | 0.011 | 46.48 | 1.99 | 0.296 | 6843 | 59.20 | 330 | N | - | 191.816.6 | - |
| NGC3894 | 0.011 | 46.48 | 1.83 | 0.125 | 10389 | 38.54 | 300 | N | - | 252.811.3 | - |
| NGC4261 | 0.007 | 31.32 | 1.61 | 2.29 | 9569 | 100.34 | 1600 | Y | 1.090.07 | 296.74.3 | NE |
| IC4296 | 0.012 | 50.64 | 3.95 | 5.52 | 3394 | 24.84 | 800 | Y | 1.120.12 | 327.45.4 | NEbbIC 4296 was identified as E in Lakhchaura et al. (2018). Since its multiphase gas is at kpc, we classify it here as NE. |
| NGC4374 | 0.003 | 18.37 | 2.90 | 0.125 | 803 | 28.46 | 650 | Y | 0.750.05 | 277.62.4 | NE |
| NGC4782 | 0.015 | 63.08 | 3.10 | 3.33 | 3220 | 49.33 | 320 | Y | - | 310.011.3 | NE |
| NGC5419 | 0.014 | 58.94 | 5.40 | 0.146 | 5000 | 14.81 | 320 | Y | - | 344.35.4 | N |
| NGC7626 | 0.011 | 58.34 | 4.59 | 0.222 | 2074 | 26.54 | 370 | Y | - | 266.63.7 | E |
Note. — Column 1: galaxy name; Column 2: redshift obtained from NEDaaThe NASA/IPAC Extragalactic Database (NED) is funded by the National Aeronautics and Space Administration and operated by the California Institute of Technology.; Column 3: distance calculated from with the exception of NGC 4374 and NGC 7626, for which we use redshift-independent distances from Tonry et al. (2001) and Cantiello et al. (2007), respectively; Column 4: galactic neutral hydrogen column densities from Kalberla et al. (2005) and HI4PI Collaboration et al. (2016); Column 5: radio fluxes from VLA or NVSS (Condon et al., 2002) except for NGC 4261 (PKS, Wright & Otrupcek 1990); Column 9 refers to whether there were sufficient counts to make deprojected temperature and density profiles for a galaxy; Column 10: power-law entropy slope determined by fitting the relation in the 1–10 kpc interval; Column 11: central velocity dispersion from Makarov et al. (2014); Column 12: H[N II] morphology reported by Lakhchaura et al. (2018) from Connor (in prep) and Sun (in prep), classified as follows: N: no cool gas emission, NE: H[N II] extent 2 kpc, E: [N II] extent 2 kpc and U: galaxies for which the presence/absence of H[N II] could not be confirmed with current observations.
NGC 4261 exhibits an unusually low central entropy as well as at kpc (Voit et al., 2015b). It also has a powerful radio source emitting in the 1.4 GHz band, which may be powered by chaotic cold accretion onto the central supermassive black hole (Gaspari et al., 2012, 2013, 2015) fed by precipitation of cold clouds out of the hot atmosphere (Voit et al., 2015b).
In search of other systems similar to NGC 4261, we compiled a Chandra archival sample of nearby () massive early-type galaxies hosting radio sources with a power output at 1.4 GHz (Condon et al., 2002, see Table 1). Other recent studies of Chandra observations of early-type galaxies (e.g. Lakhchaura et al., 2018; Grossová et al., 2019; Juráňová et al., 2019) include some of the same galaxies, but our sample emphasizes powerful radio sources in order to identify galaxies similar to NGC 4261.
In our analysis, we used distances derived from the redshifts of the galaxies when calculating the electron density, because the effect of small uncertainties in distance on the inferred density, entropy, and cooling time is small. However, for NGC 4374 and NGC 7626 we used the redshift-independent measurements because the differences between the best redshift-independent distance measurements and the redshift-dependent distances are large (%, see Table 1).
In this work, we pay particular attention to NGC 4374 (M84), NGC 1316 (Fornax A), and IC 4296 because Chandra observations of the central 10 kpc of those galaxies have the best signal-to-noise ratios among those in our sample, and we are most interested in atmospheric properties closest to the center. Each galaxy represents a different manifestation of a powerful radio source. M84 hosts a Fanaroff-Riley-I radio source111Abbreviated as FR-I and defined as a radio source in which the low brightness regions of the radio source are further from the galaxy than the high brightness regions (Fanaroff & Riley, 1974)(Harris et al., 2002). Fornax A has a weak core in the radio (250 mJy), but its radio lobes are some of the brightest radio sources in the sky (125,000 mJy, Ekers et al., 1983). IC 4296 is the Brightest Group Galaxy (BGG) in a nearby galaxy group (Abell 3565), and Hubble Space Telescope (HST) spectroscopy indicates a central black hole mass of (Dalla Bontà et al., 2009). Recent VLA (Very Large Array) D-configuration observations show improved mapping of the 160 kpc diameter radio lobes, first discovered by Killeen et al. (1986), located over 230 kpc from the AGN host galaxy as well as XMM (X-ray Multi-Mirror Mission) observations that reveal a corresponding X-ray cavity (Grossová et al., 2019).
2.2 Chandra data reduction
All of the data used in this work are archival Chandra data taken between May 2000 and December 2015. All observations were taken with the ACIS-S detector, except for NGC 5419 and NGC 7626, which were obtained with the ACIS-I detector. We reprocessed the archival Chandra data listed in Table 1 using CIAO 4.9 and CALDB version 4.7.4. For simplicity, in the case of targets with multiple observations, we chose to analyze the one with the longest net exposure time.
The time intervals containing data with anomalously high background were identified and removed using the deflare script in CIAO. Bright point sources were identified and removed using the wavdetect script (Freeman et al., 2002). We opted to account for the effect of central point sources in our spatially-resolved spectral analysis. Background images and spectra were derived from the blank-sky fields available from the Chandra X-ray Center. The background files contain both particle and photon backgrounds and were filtered and reprojected to match the target observations. We rescaled the reprojected background rates to match the particle count rates, gauged from the event rate between keV (Hickox & Markevitch, 2006). Because our analyses are based on regions of the galaxy where the signal is much higher than the background, our results are insensitive to the details of the background scaling.
2.3 Spectral Analysis
We derived deprojected radial profiles of the X-ray gas properties: temperature, density, and gas entropy. To prepare the spectra, we defined radial annuli each containing at least 300 counts after background subtraction (at temperatures around keV, a minimum of counts between keV are required for a robust X-ray temperature estimate). We used the definitions of these radial bins to extract radially binned X-ray event spectra for each galaxy and background spectrum from the scaled and reprojected deep background data.
For each galaxy, we fit all radial bins simultaneously with XSPEC v.12.9 (Arnaud, 1996) using the projct model together with the X-ray thermal emission model apec and Galactic absorption column model phabs. Because the spectral band above keV is more likely to be dominated by emission from X-ray background and unresolved point sources in typical X-ray spectra of early-type galaxies, we restricted the energy range for the spectral fits to keV.
For each galaxy, the Galactic column density and redshift were fixed to the values in Table 1, and the gas metallicity was fixed at a solar abundance. We will discuss the impact of this abundance assumption in Section 3.4. Because the X-ray temperature gradient across the radial range we are interested in is small, we can produce better statistical fits with deprojection by fitting a single temperature across multiple (2-5) adjacent annuli while allowing the spectral normalization to be free in each annulus. The full tabulated results of these fits including uncertainties are provided in Table 2.
NGC 193, NGC 3801, and NGC 3894 were removed from our sample because there were not enough counts to obtain a deprojected temperature profile with three or more radial bins. NGC 4782 had sufficient counts to extract a profile but had a bright central point source resulting in large uncertainties in the central bins. For NGC 1316 and IC 4296, we do not attempt to fit the central point sources because our primary goal is to assess the shape of the entropy profile and the data quality for future work. Therefore the central from IC 4296 and NGC 1316, kpc and kpc, respectively, were excluded from our deprojection analyses of these two galaxies.
| Galaxy | radius | bin | bin | |||||||
|---|---|---|---|---|---|---|---|---|---|---|
| (kpc) | (kpc) | ID | (keV) | (keV) | ID | () | () | () | () | |
| IC 4296 | 0.48 | 0.24 | 1 | 0.75 | 0.02 | 1 | 16.50 | 0.57 | 2.48 | 0.09 |
| IC 4296 | 0.72 | 0.12 | 1 | 0.75 | 0.02 | 2 | 10.10 | 0.53 | 3.44 | 0.16 |
| IC 4296 | 0.97 | 0.12 | 2 | 0.78 | 0.03 | 3 | 5.62 | 0.39 | 5.29 | 0.33 |
| IC 4296 | 1.45 | 0.24 | 2 | 0.78 | 0.03 | 4 | 3.52 | 0.20 | 7.23 | 0.41 |
| IC 4296 | 1.93 | 0.24 | 3 | 0.84 | 0.03 | 5 | 2.50 | 0.18 | 9.82 | 0.63 |
| IC 4296 | 2.66 | 0.36 | 3 | 0.84 | 0.03 | 6 | 1.19 | 0.06 | 16.08 | 0.86 |
| IC 4296 | 3.87 | 0.60 | 4 | 0.89 | 0.05 | 7 | 0.49 | 0.03 | 30.82 | 1.98 |
| IC 4296 | 6.28 | 1.21 | 4 | 0.89 | 0.05 | 8 | 0.38 | 0.03 | 36.60 | 2.73 |
| IC 4296 | 9.42 | 1.57 | 5 | 2.10 | 1.07 | 9 | 0.24 | 0.03 | 116.60 | 59.92 |
| IC 4296 | 12.56 | 1.57 | 5 | 2.10 | 1.07 | 10 | 0.16 | 0.03 | 152.23 | 79.11 |
| IC 4296 | 15.46 | 1.45 | 6 | 1.29 | 0.21 | 11 | 0.17 | 0.03 | 91.31 | 18.74 |
| IC 4296 | 17.88 | 1.21 | 6 | 1.29 | 0.21 | 12 | 0.17 | 0.05 | 91.62 | 22.83 |
Note. — Table 2 is published in its entirety in the machine-readable format. A portion is shown here for guidance regarding its form and content. Errors given for radius represent bin widths, all other errors are 1 sigma. Column 1: galaxy name; Column 2: radial bin center; Column 3: half-width of the radial bin; Column 4: grouping of temperature bins; Columns 5-6: best fit temperatures and their errors; Column 7: electron density bin number; Columns 8-9: best fit densities and their errors; in units of for compactness; Columns 10-11: calculated entropies and their errors.
2.4 Thermodynamic Properties
2.4.1 Electron Density Profiles
To estimate the electron density within a given concentric shell , we use the best-fit spectral normalization from the deprojection model in XSPEC,
| (1) |
The projct model performs the projection from 3D to 2D, and the total emission measure within the extraction volume as shown in Equation 1, in which is the angular diameter distance to the galaxy in centimeters (Table 1), and are the electron and proton number densities, respectively, in , and is the volume of the concentric shell in . With this definition of normalization, the expression
| (2) |
gives us the deprojected radial electron density profile for each galaxy.
2.4.2 Entropy and Profiles
| (3) |
where is the total number density of particles, is the electron density, is the hydrogen density (where we assume ), and is the temperature dependent cooling function for plasma of metallicity . Our fiducial cooling function, from Schure et al. (2009), assumes a solar-metallicity () plasma. The free-fall time is calculated assuming a singular isothermal sphere with velocity dispersions found in Table 1. We calculated for NGC 4261 and three additional galaxies with the best data quality (NGC 1316, NGC 4374, and IC 4296).
3 Discussion
3.1 Profiles and Multiphase Gas
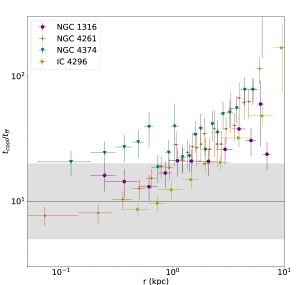
Figure 2 shows the profiles for the four galaxies with entropy profiles that come closest to probing the inner kpc of the galaxy. The profiles of IC 4296 and NGC 4374 are of particular interest. While the data are not of the resolution of NGC 4261 they still allow us to see the shape of the and entropy profiles near the central kpc of the galaxy. We also note that while the X-ray structure of NGC 315 is not resolved inside 1 kpc, its gas entropy profile appears to follow a single power law like IC4296 and NGC 4261. Furthermore, from the spectra reported in Ho et al. (1997, 1993), its multiphase gas appears to be confined to the nucleus, making it another promising candidate for a system in this powerful but possibly short-lived state.
Voit et al. (2015b) showed that in the central kpc of both single phase and multiphase galaxies usually remains above the apparent precipitation limit at . Further out from the center (1–10 kpc), galaxies with multiphase gas have profiles that approximately track this precipitation limit, whereas galaxies with single phase gas generally lie above the precipitation zone at (blue shaded region in Figure 2). Voit et al. (2015b) found that, in a sample of morphologically relaxed, X-ray bright galaxies (Werner et al., 2012), only the radial profile for NGC 4261 dipped below in the center.
In our sample, the profile for NGC 4374 remains above the precipitation zone, and NGC 1316 is consistent with the multiphase galaxy pattern from Voit et al. (2015b). However, IC 4296 goes down to near the center, as in NGC 4261, suggesting that the AGN feedback occurring in IC 4296 has interesting similarities to that of NGC 4261. The data were sufficient to probe the inner kpc of NGC 4261, but in general, the profiles more closely follow a single power law than a power law with an excess inside the central kpc.
The H emission in NGC 4261 is nuclear rather than extended (Ferrarese et al., 1996; Lakhchaura et al., 2018), consistent with the picture of giant galaxies with single phase gas having entropy profiles that scale as . Of our studied galaxies, IC 4296 most closely resembles NGC 4261, and Grossová et al. (2019) reported that in narrow band images from the Hubble and SOAR telescopes, IC 4296 also has no H emission beyond kpc.
3.1.1 Comparison with Previous X-ray Analysis
In an independent analysis, Lakhchaura et al. (2018) report entropy profiles for a sample of 49 elliptical galaxies, including eight of the galaxies analyzed in this paper: NGC 315, NGC 741, NGC 1316, NGC 4261, NGC 4374, NGC 4782, IC 4296, and NGC 5419. While there are small variations among bin sizes and radial ranges, we verified that our results are nevertheless mutually consistent within the measurement uncertainties. However, the work of Lakhchaura et al. (2018) treated gas metallicity differently, which we address in Section 3.4. In Section 3.2, we include some of the results of Lakhchaura et al. (2018) in our discussion. Additionally, in Table 1, we report the multiphase gas classifications from Lakhchaura et al. (2018) as well as additional results from Connor (in prep) and Sun (in prep) that use observations carried out using the SOAR optical Imager (SOI) and Goodman High Throughput Spectrograph of the 4.1m SOuthern Astrophysical Research (SOAR) telescope and the Apache Point Observatory (APO) Astrophysics Research Consortium (ARC) 3.5m telescope.
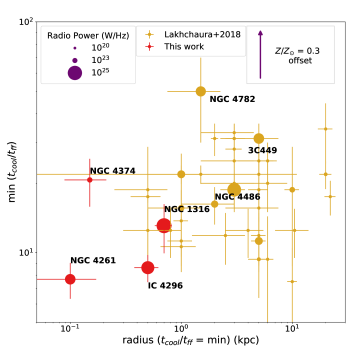
3.2 Radio Luminosity and
Figure 3 shows the minimum values of for NGC 4261, IC 4296, NGC 1316, and NGC 4374, along with the giant ellipticals from Lakhchaura et al. (2018), plotted as a function of the radius at which reaches its minimum value. We have adjusted the min() values reported by Lakhchaura et al. (2018) for uniform comparison with our work, using the correction factor estimated in Section 3.4. The typical amplitude and direction of that correction is plotted on Figure 3 in the form of a purple arrow. This adjustment typically decreased the estimates from Lakhchaura et al. (2018) by a factor of 1.6. Points vary in size according to radio power in the 1.4 GHz band.
Notice that NGC 4261, IC 4296, and NGC 1316 have a lower at a smaller radius than most of the other giant elliptical galaxies in the Lakhchaura et al. (2018) sample. Furthermore, the profiles in NGC 4261 and IC 4296, reach their minimum values in the central radial bin, raising the possibility that is overestimated in these galaxies because of limited spatial resolution. However, it is also possible for those values to be slight underestimates. In well-resolved galaxies that reach outside the central radial bin, statistical fluctuations tend to cause the measurement of to be biased low. Figure 2 shows why the magnitude of that bias in the galaxies we are focusing on is likely to be small. In all four galaxies, the second lowest value of is nearly identical to the minimum value, well within the 1-sigma statistical uncertainties. Also, the profiles of those four galaxies are not constant in the 1–10 kpc range but only within the central kpc, where there are only a few radial bins, reducing the likelihood of an unrepresentative statistical fluctuation. Consequently, the fact that NGC 4261 and IC 4296 have unusually low and greater radio power than most other galaxies in the sample, suggests that there may be a correlation between high radio power and at small radii. In particular, the combination of low and a power-law entropy slope that does not significantly flatten within the central kpc is a unique feature of NGC 4261 and IC 4296. The other galaxies, in which the central entropy profile is flatter and occurs at a larger radius, could be systems in which AGN feedback has recently elevated the entropy in the central kpc.
3.3 Comparison to Simulations
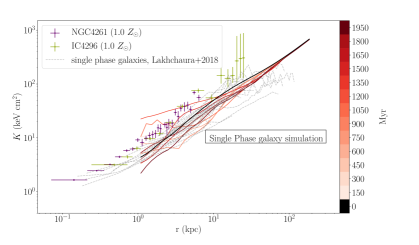
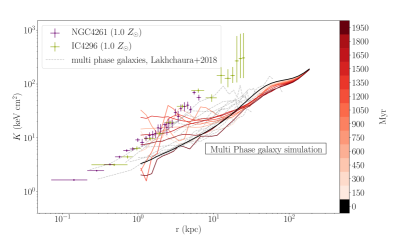
Voit et al. (2015b) showed that the presence of multiphase gas outside the central kpc of an early-type galaxy correlates with the slope of the entropy profile. Galaxies with an entropy slope of have multiphase gas present at kpc, while galaxies with an entropy slope of have only single phase gas beyond kpc. In order to better understand this relationship, we have compared our observed entropy profiles with the profiles of simulated galaxies from (Wang et al., 2019). Figure 4 shows a comparison between our data for NGC 4261 and IC 4296 and simulated elliptical galaxies with both single phase and multiphase gas as well as the entropy profiles for galaxies classified as having extended multiphase gas and no extended multiphase gas from Lakhchaura et al. (2018) . The initial conditions for the simulations are chosen to mimic X-ray observations of NGC 5044 (multiphase) and NGC 4472 (single phase), but the simulations were designed to represent generic multiphase and single phase galaxies. The simulations do not resolve the gas profiles at 1 kpc, meaning that our data have greater effective physical resolution than the simulations. However, we can still make comparisons in the kpc range.
We begin by considering if the simulated galaxies are appropriate comparisons for our sample. From Makarov et al. (2014), the velocity dispersions of NGC 5044 and NGC 4472 are and , respectively, while the velocity dispersion for IC 4296 and NGC 4261 are and , respectively. Voit et al. (2015b) introduced the idea that there may be a correlation between the presence of multiphase gas, the velocity dispersion, and entropy profile slope in early-type galaxies. In contrast, Lakhchaura et al. (2018) found little correlation in entropy profile slope and the presence of multiphase gas when examining a larger sample. However, this is still an area of open study in both theory and observations of early-type galaxies. We do not expect the simulated profiles to match our data exactly because the velocity dispersions of the simulated galaxies are smaller than those of NGC 4261 and IC 4296. However, we can still make useful comparisons between the overall behavior of the simulations and observations that account for how the entropy-profile slope correlates with velocity dispersion and the presence or absence of multiphase gas (Voit et al., 2015b).
For the multiphase and single phase initial conditions simulated by Wang et al. (2019), the entropy profiles agree with the expectations of the simple physical models shown in Voit et al. (2015b). The multiphase gas simulation has an entropy profile of , which corresponds to the hypothesized precipitation limit at . The steeper entropy profile characteristic of single phase galaxies, , is consistent with models in which heating by Type Ia supernovae drives an outflow. The implication is that self-regulated AGN feedback can maintain the observed properties of both the single phase and multiphase galaxies, consistent with both idealized analytical models (Voit et al., 2015b) and simulations (Wang et al., 2019).
When we compare the single phase simulation to NGC 4261 and IC 4296, the simulated galaxy does appear to maintain approximately the same entropy slope as our data. Furthermore, the comparison shows that the slopes of the single phase entropy profiles from Lakhchaura et al. (2018) are different from the slopes of the multiphase entropy profiles, and the multiphase data have similar slopes to the multiphase simulations. The comparison between NGC 4261 and IC 4296, the multiphase galaxy simulations, and the extended multiphase gas data, shows that our galaxies are better represented by single phase galaxies. The observed entropy profile slopes between 1-10 kpc are consistent with the entropy profile of a single phase galaxy, which has a steeper slope (). For some time steps, the central entropy profile of the simulated single phase galaxy flattens out, which could represent epochs when the black hole in the simulations is particularly active. However, it could also be a numerical effect because the resolution limit of the simulations can result in the simulated AGN affecting a larger region of the galaxy than real jets (Wang et al., 2019).
3.4 Metallicity Analysis
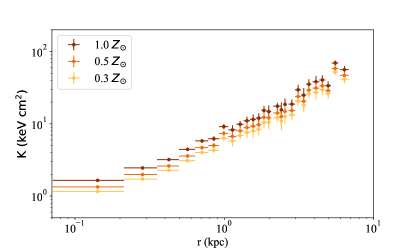
When fitting entropy profiles, we assumed each galaxy had a constant metallicity of across the profile. The hot gas abundances of early-type galaxies are difficult to obtain from low-resolution X-ray data, so we fixed the gas metallicities while fitting our observations. Here we quantify the sensitivity of our estimates of the X-ray densities and temperatures to the assumed metallicities. In Figure 5, we show an example result of the impact of three different metallicity assumptions on the entropy profiles for NGC 4261: , , and . This range of abundances spans those from various treatments of early-type galaxies in observations and simulations found in the literature (Werner et al., 2012; Wang et al., 2019; Li & Bryan, 2014b). The amplitude of the inferred entropy increases as assumed abundance increases, but the slope of the entropy profile shows little change. Therefore, abundance changes over the full range of expected gas abundances from solar would result in a change in amplitude of the inferred entropy profile on the order of 10-20% (see Figure 5).
In comparing our results with entropy profiles from previous work, we find that different abundance assumptions indeed result in small differences in the inferred entropy profiles. However, when the identical assumptions for abundances are used, the entropy profile results for different authors are the same within the uncertainties. For example, the giant ellipticals examined by Werner et al. (2012), the assumed abundances in the central kpc were and match our entropy profile results for NGC 4261 for a metallicity of .
The relation between abundance and electron density for an apec model for a narrow range of gas temperatures ( keV) can be quantified approximately by
| (4) |
where is metallicity assumed in the determination of and is the power-law slope. We would expect based on the dependence of on in this temperature range (approximately ) and form of the emission integral. To verify this estimate, we found the best-fit and for the four galaxies with the best data quality, sampling a range of assumed metallicities. We determined that the best-fit temperature was insensitive to the metallicity assumption, while density and assumed metallicity were related as in Equation 4 with: (NGC 1316), (NGC 4261), (NGC 4374), and (IC 4296), where uncertainties on are 1-sigma. These results are consistent with the expectations from X-ray plasma emission model for keV. The inferred electron density is therefore inversely related to the assumed abundance.
Furthermore, if the abundance is actually lower in the center than we assume, we have underestimated the central density and overestimated the central entropy. So if a galaxy’s gas is less metal-rich in the center than we have assumed, its central entropy profile could be slightly steeper than shown (e.g. Lakhchaura et al., 2019). However, even if the central metallicity is lower than we assumed, the minima of the profiles are less than for NGC 4261 and IC 4296.
4 Conclusions
Our analysis of the entropy profiles for a sample of nearby early-type galaxies with powerful radio sources shows that at least one other galaxy (IC 4296) is like NGC 4261 in having a powerful AGN and 10 at 1 kpc. While the spatial resolution of the X-ray data for IC 4296 is not as good as for NGC 4261, both of their entropy profiles appear to be single power laws, and neither has extended multiphase gas greater than 2 kpc from their nuclei. To be certain of their similarity, we will need additional Chandra observations of IC 4296 to match the data quality of NGC 4261.
We produced deprojected temperature and density profiles for the hot gas surrounding seven additional early-type galaxies with powerful radio sources, but these observations lacked sufficient data quality to quantify the slope in the central kpc. Unfortunately, these galaxies are likely not good candidates for further study at this time because the additional Chandra ACIS observations needed to achieve comparable data quality to NGC 4261 are prohibitively long, given the degradation of Chandra’s sensitivity to soft X-rays. We found that, in comparing independent analyses of entropy profiles in early-type galaxies, the treatment of abundance affects the amplitude of the entropy profile. Additionally, if the gas is not well-mixed, it may have a metallicity gradient, meaning that the slope of the profile could be affected as well. Finally, we compared IC 4296 and NGC 4261 to recent simulations (Wang et al., 2019) and found that they are consistent with a single phase gas model galaxy. The simulations agree well with our observational results, providing positive evidence for their ability to robustly model the hot ambient medium in early-type galaxies. In this work we were able to show excellent agreement between our observations, the theory of Voit et al. (2015b), and the simulations of Wang et al. (2019).
References
- Arnaud (1996) Arnaud, K. A. 1996, in Astronomical Society of the Pacific Conference Series, Vol. 101, Astronomical Data Analysis Software and Systems V, ed. G. H. Jacoby & J. Barnes, 17
- Bîrzan et al. (2004) Bîrzan, L., Rafferty, D. A., McNamara, B. R., Wise, M. W., & Nulsen, P. E. J. 2004, ApJ, 607, 800
- Boehringer et al. (1993) Boehringer, H., Voges, W., Fabian, A. C., Edge, A. C., & Neumann, D. M. 1993, MNRAS, 264, L25
- Cantiello et al. (2007) Cantiello, M., Blakeslee, J., Raimondo, G., Brocato, E., & Capaccioli, M. 2007, ApJ, 668, 130
- Cavagnolo et al. (2008) Cavagnolo, K. W., Donahue, M., Voit, G. M., & Sun, M. 2008, ApJ, 683, L107
- Churazov et al. (2000) Churazov, E., Forman, W., Jones, C., & Böhringer, H. 2000, A&A, 356, 788
- Condon et al. (2002) Condon, J. J., Cotton, W. D., Greisen, E. W., et al. 2002, VizieR Online Data Catalog, VIII/65
- Connor (in prep) Connor, T. in prep
- Connor et al. (2014) Connor, T., Donahue, M., Sun, M., et al. 2014, ApJ, 794, 48
- Dalla Bontà et al. (2009) Dalla Bontà, E., Ferrarese, L., Corsini, E. M., et al. 2009, ApJ, 690, 537
- Diehl & Statler (2007) Diehl, S. & Statler, T. S. 2007, ApJ, 668, 150
- Diehl & Statler (2008a) Diehl, S. & Statler, T. S. 2008a, ApJ, 687, 986
- Diehl & Statler (2008b) Diehl, S. & Statler, T. S. 2008b, ApJ, 680, 897
- Dunn & Fabian (2006) Dunn, R. J. H. & Fabian, A. C. 2006, MNRAS, 373, 959
- Dunn & Fabian (2008) Dunn, R. J. H. & Fabian, A. C. 2008, MNRAS, 385, 757
- Dunn et al. (2005) Dunn, R. J. H., Fabian, A. C., & Taylor, G. B. 2005, MNRAS, 364, 1343
- Ekers et al. (1983) Ekers, R. D., Goss, W. M., Wellington, K. J., et al. 1983, A&A, 127, 361
- Fabian (2012) Fabian, A. C. 2012, ARA&A, 50, 455
- Fabian et al. (2003) Fabian, A. C., Sanders, J. S., Allen, S. W., et al. 2003, MNRAS, 344, L43
- Fabian et al. (2006) Fabian, A. C., Sanders, J. S., Taylor, G. B., et al. 2006, MNRAS, 366, 417
- Fanaroff & Riley (1974) Fanaroff, B. L. & Riley, J. M. 1974, MNRAS, 167, 31P
- Ferrarese et al. (1996) Ferrarese, L., Ford, H. C., & Jaffe, W. 1996, ApJ, 470, 444
- Forman et al. (2005) Forman, W., Nulsen, P., Heinz, S., et al. 2005, ApJ, 635, 894
- Forman et al. (2007) Forman, W., Jones, C., Churazov, E., et al. 2007, ApJ, 665, 1057
- Freeman et al. (2002) Freeman, P. E., Kashyap, V., Rosner, R., & Lamb, D. Q. 2002, ApJS, 138, 185
- Gaspari et al. (2015) Gaspari, M., Brighenti, F., & Temi, P. 2015, A&A, 579, A62
- Gaspari et al. (2013) Gaspari, M., Ruszkowski, M., & Oh, S. P. 2013, MNRAS, 432, 3401
- Gaspari et al. (2012) Gaspari, M., Ruszkowski, M., & Sharma, P. 2012, ApJ, 746, 94
- Gaspari et al. (2017) Gaspari, M., Temi, P., & Brighenti, F. 2017, MNRAS, 466, 677
- Grossová et al. (2019) Grossová, R., Werner, N., Rajpurohit, K., et al. 2019, MNRAS, 488, 1917
- Harris et al. (2002) Harris, D. E., Finoguenov, A., Bridle, A. H., Hardcastle, M. J., & Laing, R. A. 2002, ApJ, 580, 110
- HI4PI Collaboration et al. (2016) HI4PI Collaboration, Ben Bekhti, N., Flöer, L., et al. 2016, A&A, 594, A116
- Hickox & Markevitch (2006) Hickox, R. C. & Markevitch, M. 2006, ApJ, 645, 95
- Ho et al. (1993) Ho, L. C., Filippenko, A. V., & Sargent, W. L. W. 1993, ApJ, 417, 63
- Ho et al. (1997) Ho, L. C., Filippenko, A. V., Sargent, W. L. W., & Peng, C. Y. 1997, ApJS, 112, 391
- Hunter (2007) Hunter, J. D. 2007, Computing in Science & Engineering, 9, 90
- Jones et al. (2001) Jones, E., Oliphant, T., Peterson, P., et al. 2001, SciPy: Open source scientific tools for Python
- Juráňová et al. (2019) Juráňová, A., Werner, N., Gaspari, M., et al. 2019, MNRAS, 484, 2886
- Kalberla et al. (2005) Kalberla, P. M. W., Burton, W. B., Hartmann, D., et al. 2005, A&A, 440, 775
- Killeen et al. (1986) Killeen, N. E. B., Bicknell, G. V., & Carter, D. 1986, ApJ, 309, 45
- Kim et al. (2018) Kim, D.-W., Anderson, C., Burke, D., et al. 2018, ApJ, 853, 129
- Lakhchaura et al. (2019) Lakhchaura, K., Mernier, F., & Werner, N. 2019, A&A, 623, A17
- Lakhchaura et al. (2018) Lakhchaura, K., Werner, N., Sun, M., et al. 2018, MNRAS, 481, 4472
- Li & Bryan (2014a) Li, Y. & Bryan, G. L. 2014a, ApJ, 789, 54
- Li & Bryan (2014b) Li, Y. & Bryan, G. L. 2014b, ApJ, 789, 153
- Makarov et al. (2014) Makarov, D., Prugniel, P., Terekhova, N., Courtois, H., & Vauglin, I. 2014, A&A, 570, A13
- McCourt et al. (2012) McCourt, M., Sharma, P., Quataert, E., & Parrish, I. J. 2012, MNRAS, 419, 3319
- McKinney (2010) McKinney, W. 2010, in Proceedings of the 9th Python in Science Conference, ed. S. van der Walt & J. Millman, 51
- McNamara & Nulsen (2007) McNamara, B. R. & Nulsen, P. E. J. 2007, ARA&A, 45, 117
- McNamara & Nulsen (2012) McNamara, B. R. & Nulsen, P. E. J. 2012, New Journal of Physics, 14, 055023
- Pizzolato & Soker (2005) Pizzolato, F. & Soker, N. 2005, ApJ, 632, 821
- Pizzolato & Soker (2010) Pizzolato, F. & Soker, N. 2010, MNRAS, 408, 961
- Rafferty et al. (2008) Rafferty, D. A., McNamara, B. R., & Nulsen, P. E. J. 2008, ApJ, 687, 899
- Rafferty et al. (2006) Rafferty, D. A., McNamara, B. R., Nulsen, P. E. J., & Wise, M. W. 2006, ApJ, 652, 216
- Schure et al. (2009) Schure, K. M., Kosenko, D., Kaastra, J. S., Keppens, R., & Vink, J. 2009, A&A, 508, 751
- Sharma et al. (2012) Sharma, P., McCourt, M., Quataert, E., & Parrish, I. J. 2012, MNRAS, 420, 3174
- Soker (2016) Soker, N. 2016, New A Rev., 75, 1
- Sun (2009) Sun, M. 2009, ApJ, 704, 1586
- Sun (in prep) Sun, M. in prep
- Tonry et al. (2001) Tonry, J. L., Dressler, A., Blakeslee, J. P., et al. 2001, ApJ, 546, 681
- van der Walt et al. (2011) van der Walt, S., Colbert, S. C., & Varoquaux, G. 2011, Computing in Science and Engineering, 13, 22
- Van Rossum & Drake Jr (1995) Van Rossum, G. & Drake Jr, F. L. 1995, Python tutorial (Centrum voor Wiskunde en Informatica Amsterdam, The Netherlands)
- Voit & Donahue (2015) Voit, G. M. & Donahue, M. 2015, ApJ, 799, L1
- Voit et al. (2015a) Voit, G. M., Donahue, M., Bryan, G. L., & McDonald, M. 2015a, Nature, 519, 203
- Voit et al. (2015b) Voit, G. M., Donahue, M., O’Shea, B. W., et al. 2015b, ApJ, 803, L21
- Voit et al. (2017) Voit, G. M., Meece, G., Li, Y., et al. 2017, ApJ, 845, 80
- Wang et al. (2019) Wang, C., Li, Y., & Ruszkowski, M. 2019, MNRAS, 482, 3576
- Werner et al. (2012) Werner, N., Allen, S. W., & Simionescu, A. 2012, MNRAS, 425, 2731
- Werner et al. (2014) Werner, N., Oonk, J. B. R., Sun, M., et al. 2014, MNRAS, 439, 2291
- Wright & Otrupcek (1990) Wright, A. & Otrupcek, R. 1990, PKS Catalog (1990)