Carbon-grain sublimation: a new top-down component of protostellar chemistry
Abstract
Earth’s carbon deficit has been an outstanding problem in our understanding of the formation of our Solar System. A possible solution would be the sublimation of carbon grains at the so-called soot line (300 K) early in the planet-formation process. Here, we argue that the most likely signatures of this process are an excess of hydrocarbons and nitriles inside the soot line, and a higher excitation temperature for these molecules compared to oxygen-bearing complex organics that desorb around the water snowline (100 K). Such characteristics have been reported in the literature, for example, in Orion KL, although not uniformly, potentially due to differences in observational settings and analysis methods of different studies or related to the episodic nature of protostellar accretion. If this process is active, this would mean that there is a heretofore unknown component to the carbon chemistry during the protostellar phase that is acting from the top down – starting from the destruction of larger species – instead of from the bottom up from atoms. In the presence of such a top-down component, the origin of organic molecules needs to be re-explored.
1 Introduction
One of the main goals in the fields of exoplanets and planet formation is to determine the composition of terrestrial, potentially habitable, planets and to link this to the composition of protoplanetary disks. A longstanding puzzle in this regard is the Earth’s severe carbon deficit. Earth is four orders of magnitude depleted in carbon compared to interstellar grains, and two well-characterized comets 1P/Halley and 67P/Churyumov-Gerasimenko (hereafter, 67P) (e.g., Geiss 1987; Bergin et al. 2015; Rubin et al. 2019). The exact depletion is uncertain as a significant amount of carbon could be present in the Earth’s core, but even genereous upper limits suggest one to two orders of magnitude depletion for the bulk Earth (see e.g., Marty 2012; Fischer et al. 2020; Li et al. 2020, subm.). A similar amount of depletion is seen in CI chondrites that are thought to represent the most primitive material in the Solar System and otherwise reflect solar abundances in terms of composition (Wasson & Kallemeyn, 1988). Moreover, this problem exists beyond the Solar System as carbon deficits in polluted white dwarfs are indicative of the accretion of carbon-depleted rocky material (e.g., Jura, 2006).
The only solution to this conundrum is that in the inner few au of planet-forming systems, carbon has to be in the gas phase instead of the refractory phase, and as such, becomes unavailable for accretion onto rocky bodies. Thus, there must be a mechanism to destroy carbon grains while leaving silicate grains intact. Furthermore, this must happen prior to planetesimal formation as it is much easier to destroy smaller grains than it is to break apart planetesimals and entirely ablate them. This points towards the early, embedded, phases in the evolution of young stars before significant grain growth sets in (i.e., the Class 0 and early Class I protostellar stages). As this mechanism is central to the supply of carbon to terrestrial worlds, constraining it is of fundamental importance. Carbon-grain destruction has been explored in the literature with a primary focus on oxidation (e.g., Finocchi et al., 1997; Lee et al., 2010; Gail & Trieloff, 2017), but detailed models by Anderson et al. (2017) and Klarmann et al. (2018) suggest that this mechanism is ineffective.
Here, we focus on sublimation of refractory carbon grains at a location that can be labeled as the “soot line” (Kress et al., 2010). Although the specific molecular form of carbon in grains is unknown, the majority of refractory carbon-rich solids are sublimating at temperatures between 350 and 450 K (Nakano et al. 2003; Gail & Trieloff 2017; Li et al. 2020, subm.). If the process of carbon-grain sublimation is indeed active, this would mean that there is a heretofore unrecognized contributor to the rich carbon chemistry. This pathway acts from the top down, that is, starting from the destruction of larger molecules, instead of from the bottom up as in traditional gas and ice chemistry (see also Tielens 2011 for a discussion on top-down chemistry). In Sect. 2, we outline what the observational signatures of carbon-grain sublimation could be. In Sect. 3 we review whether there is current evidence that this process is happening and in Sect. 4 we discuss future steps to establish whether carbon-grain sublimation is a common process during star- and planet formation.
2 Signatures of carbon-grain sublimation and top-down chemistry
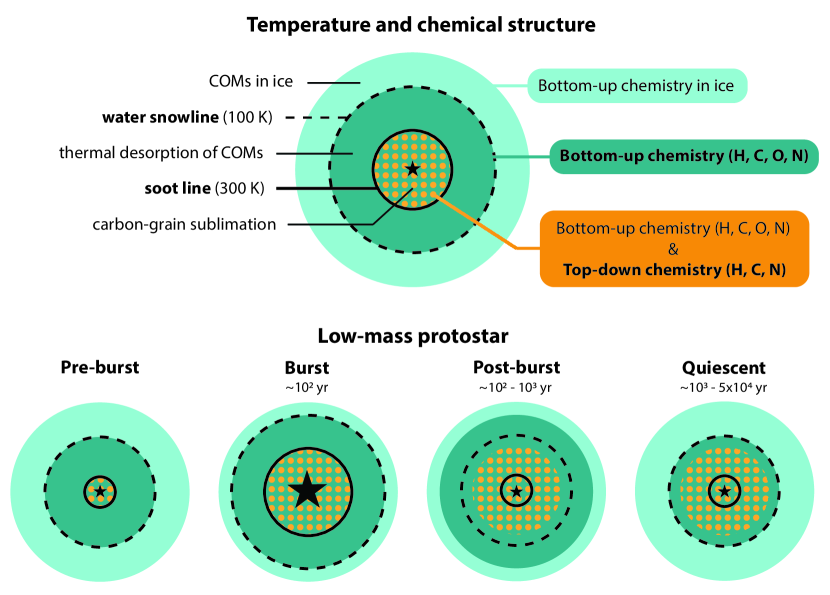
In hot cores, it is common to think of molecular abundance changes across the water snowline (100 K) as many complex molecules have binding energies similar to water. A simple approach would therefore be to look for an additional change in the chemical structure at the temperature of carbon-grain sublimation (see Fig. 1, top panel). The questions then become what these signatures are and where to look for them.
Before we explore these issues we need to address the sublimation temperature of carbonaceous grains, which is 425 K for pressures representing the regions in the solar nebula disk at a few au from the Sun (i.e., the formation zone for meteoritic material) (Nakano et al. 2003; Gail & Trieloff 2017; Li et al. 2020, subm.). This number is based upon the recent analysis of Li et al. (2020, submitted) who note that meteoritic constraints bound the sublimation temperature of the main carbon carrier to be within 200 - 650 K. Drawing upon the laboratory experiments of cometary organic analogs of Nakano et al. (2003) we adopt their number of 425 K. Sublimation has a well characterized exponential relation between pressure and temperature (e.g., the Clapeyron-Classius equation). To obtain a rough estimate of the sublimation temperature at hot core pressures we use the dPvap/dT (where Pvap is the vapor pressure) relations of PAHs characterized in the lab (Goldfarb & Suuberg, 2008; Aslam Siddiqi et al., 2009) and assume that only the density of H2 and temperature changes (i.e., abundance is constant). Based on these dependencies (see also, Bergin & Cleeves, 2018), we obtain a (very) rough estimate of 300 K for the temperature of carbon-grain destruction at reduced pressures (densities of H2 cm-3, 300 K; P bar) in the inner region around protostars, compared to the inner disk (P(1 au) 10-6 bar; D’Alessio et al., 2005). We note that strictly speaking the above relations refer to pure ices and the temperature of the medium. In this case the temperature refers to the gas and dust temperature which are coupled in these regions.
2.1 Excess carbon and nitrogen
The most obvious effect of carbon-grain sublimation is a flooding of the gas with carbon. Since most of the oxygen is expected to be locked up in water (Bergin & Snell, 2002; Caselli et al., 2012), this carbon enters gas that is rich in hydrogen, nitrogen (mostly in N2), CO, and H2O. Carbon will therefore most likely react to form hydrocarbons and nitriles (molecules with a CN bond, such as HCN and CH3CN) as shown in chemical models of protoplanetary disks in which the destruction of carbon grains is simulated by an excess of C+ (Wei et al., 2019). This gets complicated by the fact that some hydrocarbons and nitriles also form bottom up in the gas or ice.
However, based on the cometary inventory, there is significantly more nitrogen contained in refractories than in volatile ices (Rice et al., 2018; Rubin et al., 2019). Carbon is similar to nitrogen in comet 67P, and both are distinct from oxygen, which is twice as abundant in volatile ices as in refractory organics (Rubin et al., 2019). The refractory C/N elemental ratio in carbonaceous chondrites, comets 1P/Halley and 67P is 5-30 (Bergin et al., 2015; Jessberger et al., 1988; Rubin et al., 2019). Assuming 50% of the elemental carbon is in refractory form (150 ppm with respect to H; Mishra & Li 2015) then the destruction of carbon grains releases 5-30 ppm of refractory nitrogen into the gas. This is about 10-50% of the present day cosmic nitrogen abundance (Nieva & Przybilla, 2012).
Recently, evidence of the presence of ammonium salts was reported in comet 67P, providing an additional nitrogen-bearing component (Altwegg et al., 2020; Poch et al., 2020). These works derive an upper limit of 40 wt% for the mass fraction of ammonium salts, but depending on the composition of the salts, a 10 wt% mass fraction can be enough for a solar C/N ratio (3.4, Lodders 2010) for the entire comet. In these cases, 10% to almost 40% of all nitrogen, respectively, would be in refractories. Sublimation of carbon grains with these compositions would then release 9-36 ppm of refractory nitrogen. Furthermore, the desorption temperature of ammonium salts (roughly 200-250 K, Clementi & Gayles 1967; Raunier et al. 2004; Bossa et al. 2008; Danger et al. 2011; Vinogradoff et al. 2011; Noble et al. 2013; Bergner et al. 2016) is higher than that of water and comparable to that of refractory carbon. In the outlined scenarios, 60–90% of all nitrogen is expected to be in ammonium salts, so these salts could deliver an additional amount of nitrogen to the gas inside the soot line.
Sublimation of carbon grains would thus lead to an excess of carbon and nitrogen in the gas phase (see Fig. 1, top panel). The exact form in which these elements will be released (e.g., N along with C or NH with CH or C with CN or larger fragments) is unknown. If polycyclic aromatic hydrocarbons (PAHs) are freed, this carbon will not be readily available for gas-phase chemistry. However, both low and high-mass protostars lack PAH emission (van Dishoeck & van der Tak, 2000; Geers et al., 2009), while according to radiative transfer models, PAH emission should always be detectable in Herbig Ae/Be disk/envelope systems if they are present (Manske & Henning, 1999). It seems therefore unlikely that the 90% of carbon that is missing in inner Solar System bodies is present in PAHs. Another unknown is which molecules will be formed exactly and in what amounts. However, cometary compositions indicate that the top-down signal could dominate over the bottom-up contribution. Finally, it is possible that a highly refractory component might exist (e.g. SiC), but the carbon deficit in even the most primitive meteorites requires significant carbon grain destruction to the order of 90% (Bergin et al., 2015) at the time these materials are isolated from the gaseous nebula.
2.2 Isotopic fractionation
In the ISM, only % of all nitrogen is contained in refractories, while this is % in comets (Jensen et al., 2007; Bergin et al., 2015; Rice et al., 2018; Rubin et al., 2019). At some point during the star-formation process, nitrogen must thus be captured and placed into refractory material. The detection of benzonitrile in dark clouds suggest that there may be a pathway to do this at low temperatures (McGuire et al., 2018). Signatures of low-temperature formation, such as isotope fractionation, may therefore be present in the nitrogen that comes free upon grain sublimation. This may distinguish molecules formed through this top-down process from species formed in the gas through a bottom-up pathway. However, complex nitrogen-bearing molecules formed in the ice may carry similar fractionation features.
2.3 Higher excitation temperature for N-COMs
Observing the predicted excess of hydrocarbons and nitriles inside the soot line would require spatially resolving the K region. Protostars are the best sources to target because 1) the sublimation has to happen early in the planet-formation process and 2) the soot line is at larger distances than in protoplanetary disks due to the higher accretion rates of these younger systems and their different density structures that result in less shielding of the stellar irradiation. If the soot line is not resolved, a comparison of the excitation temperatures of nitrogen-bearing and oxygen-bearing complex organic molecules (N-COMs and O-COMs, respectively) could still indicate whether carbon-grain sublimation is taking place: the excitation temperatures of N-COMs, enhanced at temperatures K, will be higher than those of O-COMs that will be uniformly present inside the water snowline ( K; Fig. 1, top panel). In case of a large abundance of N-COMs formed through bottom-up chemistry outside the snowline, N-COM emission may be characterized by a hot ( K) and cold component. However, whether a temperature signal can be observed will depend on the extent of the K region within the telescope beam, and is thus not as good a diagnostic as spatial differentiation.
A separate complication is that the temperature profile itself will change as the young star evolves. Accretion is episodic (see e.g., Hartmann & Kenyon 1996; Evans et al. 2009; Scholz et al. 2013) and enhanced accretion rates cause the luminosity and thus the temperature to increase. This leads to chemical changes due to the soot line and snowlines moving outward (e.g., Lee 2007; Visser & Bergin 2012 and see Fig 1, burst panel). Catching a protostar during such a burst phase would thus make the detection of grain-sublimation signatures easier. Post-burst, the dust and gas temperature rapidly decay (1 year) to levels associated with the quiescent protostellar luminosity (Johnstone et al., 2013). However, chemical changes persist and sublimated molecules remain in the gas phase in the inner envelope for a depletion timescale of 10 years (Lee, 2007; Visser & Bergin, 2012). Thus it is possible that a chemical signature of carbon-grain sublimation is present even in cases where the temperature signature is absent (see Fig. 1, post-burst panel).
If the soot line does not get shifted past the quiescent snowline location, the species formed inside the extended soot line will remain present in the gas phase (see Fig. 1, quiescent panel). Alternatively, if the burst pushes the soot line beyond the quiescent snowline location, newly formed species outside the quiescent snowline will also freeze out. In this scenario there will be no spatial differentiation between gas-phase N-COMs and O-COMs as they both extend out to the quiescent snowline location. During the quiescent phase, it will thus depend on the burst location of the soot line compared to the quiescent lcoation of the snowline whether there is a spatial difference between N-COMs and O-COMs. If the spatial difference is small or absent, the only signal of carbon-grain sublimation may be an enhanced abundance of N-COMs. Whether a clear signature can be observed for an individual protostar will thus depend on the time since its last accretion burst and the strength of that, and potentially previous, bursts.
3 Observational evidence for carbon-grain sublimation and top-down chemistry
An increased abundance of hydrocarbons and nitriles inside the soot line, a smaller spatial extent for these species compared to oxygen-bearing COMs and/or higher excitation temperatures than O-COMs are thus expected signatures for sublimation of carbon grains. A clear manifestation of these signatures may be complicated by the occurrence of accretion bursts and the presence of N-COMs formed through bottom-up chemistry. Is there any evidence in the literature that this process is indeed taking place?
3.1 N-COM/O-COM spatial distribution and abundance correlation
Probably the most well-known example of N-COMs tracing different regions than O-COMs is Orion KL, where the N-COMs are associated with the hot core while O-COMs are predominantly found toward the compact ridge (e.g., Blake et al., 1987; Friedel & Snyder, 2008). The total abundance of N-COMs in the hot core is more than an order of magnitude higher than in the colder compact ridge (Crockett et al., 2014). If what we are seeing here is the results of carbon grain sublimation, this process may thus indeed result in observable enhancements of N-COMs.
A similar spatial differentiation was also observed toward the high-mass star-forming region W3, where N-COMs are found only toward the W3(H2O) core while O-COMs are present in both the W3(H2O) and W3(OH) regions (Wyrowski et al., 1999), and G34.26+0.15, where emission from N- and O-COMs peak at different positions within the core (Mookerjea et al., 2007). Recent high-resolution observations () reveal differences in AFGL 2591 VLA 3 (Jiménez-Serra et al., 2012; Gieser et al., 2019), AFGL 4176 (Bøgelund et al., 2019), G35.20 core B (Allen et al., 2017), and G328.2551-0.5321 (Csengeri et al., 2019). In these high-mass sources, the N-COMs are found to peak on source, while the O-COMs peak offset from the central protostar. In addition, Fayolle et al. (2015) find that the N-COMs are generally concentrated toward the source centers in the three massive young stellar objects NGC 7538 IRS9, W3 IRS5 and AFGL490, while O-COM emission is more extended.
A hint of more compact emission from N-COMs than O-COMs is also observed for the disk around the outbursting star V883-Ori (Lee et al., 2019). This result is tentative, because due to the vertical temperature structure of disks and the dust being optically thick in the inner 40 au in this system (Cieza et al., 2016) we may be seeing effects in the disk surface layers rather than the inner-disk midplane.
However, the spatial differentation between N-COMs and O-COMs is not always black and white. For example, the O-COMs ethylene glycol ((CH2OH)2) and acetic acid (CH3COOH) have a spatial distribution in Orion KL different from most other O-bearing molecules (Brouillet et al., 2015; Favre et al., 2017) and the overall distribution of acetone ((CH3)2CO) is similar to that of ethyl cyanide (C2H5CN) (Peng et al., 2013).
Another hint of a difference between N-COMs and O-COMs is found when comparing molecular abundances. Abundances of O-COMs are often found to be correlated, while N-COMs either tend to show stronger correlations with other N-COMs rather than O-COMs, or show no correlation with any other molecule (e.g., Bisschop et al., 2007; Bergner et al., 2017; Suzuki et al., 2018). This is also not uniform as, for example, C2H3CN and C2H5CN were found to be correlated with CH3OCH3 by Fontani et al. (2007), and Belloche et al. (2020) found a strong correlation between CH3OH and CH3CN. However, these results should be regarded with caution, as a correlation across sources does not necessarily reflect an actual chemical relationship but may also reflect underlying physical differences (e.g., temperatures, column densities or simply variations in the reference species).
3.2 Excitation temperature of N-COMs and O-COMs
Differences in excitation temperatures of N-COMs compared to O-COMs have been observed for Orion KL, with the N-COMs tracing hotter gas (300 K) than the O-COMs (Crockett et al., 2015). The latter are consistent with sublimation alongside water around 100 K. A similar picture emerges for Sgr B2(N2), although the temperature differences are smaller (Belloche et al., 2016). On the other hand, O-COMs toward IRAS 16293–2422 B can be divided in two groups based on their excitation temperature (125 K versus 300 K; Jørgensen et al. 2018), consistent with different binding energies. N-COMs generally have excitation temperatures of 100–150 K (Calcutt et al., 2018a, b), but a high-temperature component may be hidden inside the unresolved soot line or by the optically thick dust.
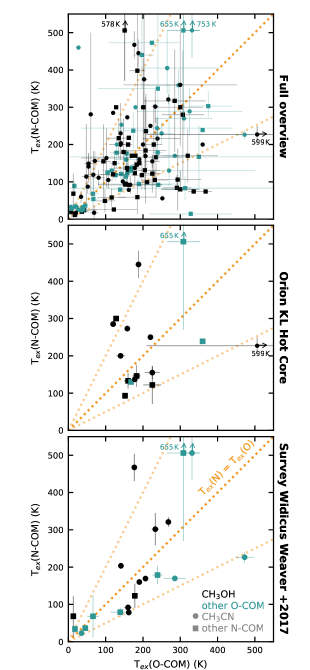
To assess whether a difference in excitation temperature is a widespread phenomenon, we compiled an overview of the existing literature that reports excitation temperatures for at least one N-COM and one O-COM. Because not all studies observe the same molecules, Fig. 2 (top panel, and see also Table 1) shows the highest reported excitation temperature for N-COMs versus that of O-COMs for each source in a particular study. Molecules with less than 5 atoms and molecules containing both nitrogen and oxygen, like HNCO and NH2CHO, are excluded. While there clearly are a large number of cases where a higher excitation temperature is reported for N-COMs than for O-COMs (64 out of 144 entries; 44%), this is certainly not always the case. Possible explanations will be discussed in Sect. 4.
4 Discussion and outlook
The spatial differentiation between N-COMs and O-COMs has been a longstanding problem (Blake et al., 1987). Initially, this was attributed to different ice compositions, because the relative amount of ammonia (NH3) ice had a large impact on the CH3CN/CH3OH ratio in the chemical models from Charnley et al. (1992) and Rodgers & Charnley (2001). However, more recent models do not predict a correlation between the CH3CN/CH3OH gas ratio and the NH3/CH3OH ice ratio (Garrod, 2013), consistent with observations of both low- and high-mass protostars (Fayolle et al., 2015; Bergner et al., 2017). Another explanation given in the literature is based on a difference in temperature between regions in combination with a different warm-up timescale, hence evolutionary stage (e.g., Caselli et al., 1993; Garrod et al., 2008; Allen et al., 2018).
Here, we suggest the thermal destruction of carbon grains inside the soot line ( 300 K) as the underlying reason for the differences in distribution between N-COMs and O-COMs: regions rich in N-COMs are currently heated to temperatures above 300 K, or have been in the past. While a different thermal history and evolutionary stage may explain the spatial differentiation and differences in excitation temperature, only carbon-grain sublimation can simultaneously explain the low carbon and nitrogen content of the Earth and CI chondrites, and the carbon-depleted pollution seen in white dwarf atmospheres.
As outlined in Sect. 3 and visualized in Fig. 2, a coherent picture indicating that carbon-grain sublimation is a common phenomenon during star formation does not yet exist. A complicating factor that could contribute to the non-uniformity in observed spatial distributions and abundance correlations, is that carbonaceous material could contain a small amount of oxygen. For example, about 25% of elemental oxygen is unaccounted for in the interstellar medium (e.g., Whittet, 2010; Poteet et al., 2015). There is some insight here from meteorites, as insoluble organic matter contains 22 O atoms for every 100 C atoms (Remusat, 2014), which is roughly consistent with interstellar inferences. Thus, there is likely some oxygen-bearing organic material released as carbon grains are ablated.
Figure 2 displays a wide spread in excitation temperatures derived for both N-COMs and O-COMs (from a few K up to 500 K). In addition, there is no clear correlation between the highest temperature for N-COMs and that for O-COMs, as N-COMs can be more than twice as hot as O-COMs but also more than twice as cold. The spread in excitation temperatures could be due to the heterogeneity of observations and analysis methods (see Fig. 2, middle panel, for an overview of studies toward Orion KL). Besides different spatial resolutions with respect to the size of the soot line, a relevant difference between studies is the covered wavelength range, as this determines which molecules are observed, the number of lines per molecule and the upper level energies of these lines. The latter can complicate conclusions about the spatial extent of a molecule, as even typical hot-core molecules, such as CH3OH and CH3CN, can be observed in the outer envelope when observing low-energy transitions (e.g., Öberg et al., 2013). In addition, these molecules often require both a hot and cold component to explain observations, and this hot component could be missed when only lines with low upper level energies are targeted.
Furthermore, differences could result from different analysis techniques. In general, excitation temperatures are derived from rotational diagrams or from fitting the observed spectrum, but different assumptions about beam dilution and/or optical depth could give significantly different results (see e.g., Gibb et al. 2000). Finally, rotational temperatures can be higher than the kinetic temperature due to optical depth effects and/or infrared pumping (see e.g. Churchwell et al., 1986) and for large-scale single-dish studies the critical density and dipole moment of a species may be more important for the excitation than the temperature. Equal or lower excitation temperatures for N-COMs therefore do not necessarily indicate that carbon-grain sublimation is not occurring.
However, also systematic surveys do not present a uniform picture (see Fig. 2, bottom panel, for results from the survey by Widicus Weaver et al. 2017). The spread could illustrate that the soot line is not resolved in all sources, but sources with higher N-COM excitation temperatures span the entire luminosity and distance range among the high-mass sources in the sample. Another explanation could therefore be that a clear signature of carbon-grain sublimation may not be present for all sources. The episodic nature of the protostellar accretion could erase the spatial difference between N-COMs and O-COMs as well as differences in their excitation temperature (see Fig. 1). The fraction of sources in the post-burst phase (with the O-COMs spatially more extended than the N-COMs) is equal to the freeze-out timescale divided by the burst interval. The O-COMs have desorption temperatures similar to water, so their freeze-out timescale is 1000 years (Visser et al., 2015). Several studies estimate that the burst interval is 20,000-50,000 years (e.g., Scholz et al., 2013; Jørgensen et al., 2015), while Hsieh et al. (2019) derive an interval of 2400 years during the Class 0 phase. This means that we would expect 2-5% up to 40% of protostars in the post-burst phase. These numbers are not inconsistent with the number of studies finding higher excitation temperatures for N-COMs than for O-COMs in Fig. 2. A caveat here is, however, that it is unclear whether burst statistics for low-mass sources also apply for high-mass sources, which make up the majority (80%) of Fig. 2.
To unambigously establish the presence of carbon-grain sublimation, large systematic surveys are thus required that spatially probe the soot line as well as cover a large number of lines with a range of upper level energies of many different molecular species. Chemical models incorporating the thermal destruction of carbon grains (such as done for protoplanetary disks by Wei et al. 2019) could help indicate what species are good indicators. The best candidates to establish the occurrence of carbon grain sublimation are sources with a clear spatial differentiation between N- and O-COMs (as listed in Sect. 3.1). A deep spectral survey and detailed analysis (e.g., of warm hydrocarbons) could reveal whether the observed distributions are consistent with suggested accretion shocks at the disk-envelope interface or with sublimation of carbon grains. Although the study of low-mass sources may be more appropriate to understand the formation of the Solar System and its analogs, the larger 300 K region makes high-mass sources the more accessible astrochemical laboratories.
If carbon grain sublimation is happening, it would mean that there is an unexplored top-down component to protostellar chemistry, that starts from the destruction of larger structures instead of from atoms. The implications for astrochemistry, the origin of organic molecules and carbon delivery to terrestrial worlds then needs to be re-explored.
| Source name | Source type | (N-COM)aaHighest excitation temperature among all N-bearing COMs in the study. | (O-COM)bbHighest excitation temperature among all O-bearing COMs in the study. | (CH3CN)ccExcitation temperature of CH3CN (or isotopologue) if this was not the highest temperature for all N-COMs. n/a means no is available for CH3CN. | (CH3OH)ddExcitation temperature of CH3OH (or isotopologue) if this was not the highest temperature for all O-COMs. n/a means no is available for CH3OH. | Sign of | Telescope | Analysis | Reference |
|---|---|---|---|---|---|---|---|---|---|
| (K) | (K) | (K) | (K) | CGSeeSign of carbon-grain sublimation, i.e., higher for N-COMs than O-COMs. | methodffMethod used to derive the excitation temperatures. Here we only make a broad distinction between rotational diagram analysis (RD) or spectral modeling (M). | ||||
| AFGL 2591 VLA 3 | High mass | 150 20 | 124 12 | n/a | yes | SMA | RD | Jiménez-Serra et al. (2012) | |
| 218 2 | 162 2 | 199 1 | yes | IRAM 30m + NOEMA | M | Gieser et al. (2019) | |||
| AFGL 4176 | High mass | 270 40 | 310 75 | 120 15 | ALMA | M | Bøgelund et al. (2019) | ||
| AFGL 490 | High mass | 164 78 | 102 67 | yes | IRAM 30m + SMA | RD | Fayolle et al. (2015) | ||
| B1-a | Low mass | 33 9 | 22 5 | n/a | yes | IRAM 30m | RD | Bergner et al. (2017) | |
| B1-c | Low mass | 18 2 | 4 1 | n/a | yes | IRAM 30m | RD | Bergner et al. (2017) | |
| B5 IRS 1 | Low mass | 11 2 | 17 2 | n/a | IRAM 30m | RD | Öberg et al. (2014); Bergner et al. (2017) | ||
| Cep E-A | Int. mass | 32 4 | 37 1 | 27 5 | IRAM 30m + NOEMA | RD | Ospina-Zamudio et al. (2018) | ||
| DR21(OH) | High mass | 55 | 252 | OSO | RD | Kalenskii & Johansson (2010a) | |||
| 79 11 | 138 24 | 56 2 | 92 2 | CSO | M | Widicus Weaver et al. (2017) | |||
| G9.62+0.19 | High mass | yes | JCMT | M | Hatchell et al. (1998) | ||||
| G10.47+0.03 | High mass | yes | JCMT | M | Hatchell et al. (1998) | ||||
| 176 35 | 156 37 | n/a | n/a | yes | IRAM 30m | RD | Fontani et al. (2007) | ||
| 753 72 | 331 20 | 258 1 | yes | CSO | M | Widicus Weaver et al. (2017) | |||
| 398 209 | 185 20 | n/a | yes | Nobeyama | RD | Suzuki et al. (2018) | |||
| 217 51 | 135 32 | n/a | yes | Nobeyama | RD | Suzuki et al. (2018) | |||
| 166 106 | 235 71 | n/a | ALMA | RD | Suzuki et al. (2019) | ||||
| G10.62–0.38 | High mass | 89 13 | 16 1 | n/a | n/a | yes | IRAM 30m | RD | Fontani et al. (2007) |
| 178 42 | 129 17 | 165 23 | n/a | yes | SMA | M | Wong & An (2018) | ||
| G12.21–0.10 | High mass | 78 4 | 161 3 | CSO | M | Widicus Weaver et al. (2017) | |||
| G12.89+0.49 | High mass | 24 | n/a | Nobeyama 45m + ASTE | RD | Taniguchi et al. (2018) | |||
| G12.91–0.26 | High mass | 122 31 | 178 4 | 116 5 | CSO | M | Widicus Weaver et al. (2017) | ||
| G16.86–2.16 | High mass | 20 | n/a | Nobeyama 45m + ASTE | RD | Taniguchi et al. (2018) | |||
| G19.61-0.23 | High mass | 123 24 | 158 17 | n/a | n/a | IRAM 30m | RD | Fontani et al. (2007) | |
| 578 134 | 151 6 | n/a | yes | SMA | RD | Qin et al. (2010) | |||
| 467 35 | 176 2 | yes | CSO | M | Widicus Weaver et al. (2017) | ||||
| G24.33+00.11 MM1 | High mass | 301 42 | 233 8 | yes | CSO | M | Widicus Weaver et al. (2017) | ||
| G24.78+0.08 | High mass | 211 13 | n/a | JCMT + IRAM 30m | RD | Bisschop et al. (2007) | |||
| 203 7 | 140 1 | yes | CSO | M | Widicus Weaver et al. (2017) | ||||
| G28.28–0.36 | High mass | 13 | n/a | Nobeyama 45m + ASTE | RD | Taniguchi et al. (2018) | |||
| G29.96–0.02 | High mass | yes | JCMT | M | Hatchell et al. (1998) | ||||
| 121 17 | 141 26 | n/a | n/a | IRAM 30m | RD | Fontani et al. (2007) | |||
| G31.41+0.31 | High mass | yes | JCMT | M | Hatchell et al. (1998) | ||||
| 118 13 | 127 25 | n/a | n/a | IRAM 30m | RD | Fontani et al. (2007) | |||
| 232 34 | n/a | JCMT | RD | Isokoski et al. (2013) | |||||
| 300 50 | n/a | 200 50 | JCMT | M | Isokoski et al. (2013) | ||||
| 320 12 | 268 4 | yes | CSO | M | Widicus Weaver et al. (2017) | ||||
| 59 44 | 185 51 | n/a | Nobeyama | RD | Suzuki et al. (2018) | ||||
| 184 141 | 207 55 | n/a | ALMA | RD | Suzuki et al. (2019) | ||||
| G34.26+0.15 | High mass | 74 5 | 368 16 | n/a | JCMT | RD | MacDonald et al. (1996) | ||
| 74 5 | 336 14 | n/a | JCMT | RD | MacDonald et al. (1996) | ||||
| yes | JCMT | M | Hatchell et al. (1998) | ||||||
| 130 13 | 116 25 | n/a | n/a | yes | IRAM 30m | RD | Fontani et al. (2007) | ||
| 300 130 | 201 4 | 298 8 | yes | SMA | RD | Fu & Lin (2016) | |||
| 160 3 | 190 1 | CSO | M | Widicus Weaver et al. (2017) | |||||
| 167 83 | 350 412 | n/a | 196 42 | Nobeyama | RD | Suzuki et al. (2018) | |||
| 49 30 | 98 27 | n/a | Nobeyama | RD | Suzuki et al. (2018) | ||||
| G35.03+0.35 A | High mass | ALMA | M | Allen et al. (2017) | |||||
| G35.20–0.74 N A | High mass | yes | ALMA | M | Allen et al. (2017) | ||||
| G35.20–0.74 N B3 | High mass | 189 14 | yes | ALMA | M | Allen et al. (2017) | |||
| G45.47+0.05 | High mass | 68 52 | 13 0 | n/a | yes | CSO | M | Widicus Weaver et al. (2017) | |
| G75.78+0.34 | High mass | 91 7 | 159 9 | CSO | M | Widicus Weaver et al. (2017) | |||
| G327.3–0.60 | High mass | Herschel HIFI | RD | Gibb et al. (2000) | |||||
| n/a | 102 10 | Herschel HIFI | RD | Gibb et al. (2000) | |||||
| 135 5 | n/a | Herschel HIFI | RD | Gibb et al. (2000) | |||||
| G331.512–0.103 | High mass | 156 25 | 71 10 | yes | APEX | RD | Mendoza et al. (2018) | ||
| IRAS 03235+3004 | Low mass | 13 2 | 18 4 | n/a | IRAM 30m | RD | Öberg et al. (2014); Bergner et al. (2017) | ||
| IRAS 16293–2422 | Low mass | 54 11 | 67 14 | n/a | n/a | IRAM 30m | RD | Cazaux et al. (2003) | |
| IRAS 16293–2422 A | Low mass | 160 20 | 155 31 | 120 10 | 130 26 | yes | ALMA | M | Calcutt et al. (2018a); Manigand et al. (2020) |
| IRAS 16293–2422 B | Low mass | 300 | 300 60 | n/a | ALMA | M | Coutens et al. (2018); Jørgensen et al. (2018) | ||
| IRAS 18089–1732 | High mass | 291 37 | n/a | JCMT | RD | Isokoski et al. (2013) | |||
| 300 50 | n/a | JCMT | M | Isokoski et al. (2013) | |||||
| IRAS 20126+4104 | High mass | 230 30 | 250 30 | n/a | PdBI | M | Palau et al. (2017) | ||
| IRAS 23238+7401 | Low mass | 33 6 | 6 2 | n/a | yes | IRAM 30m | RD | Bergner et al. (2017) | |
| IRDC-C9 Main | High mass | 460 | 27 5 | n/a | yes | ALMA | RD | Beaklini et al. (2020) | |
| L1448-C | Low mass | 105 23 | 107 11 | NOEMA | RD | Belloche et al. (2020) | |||
| L1489 IRS | Low mass | 20 13 | 8 4 | n/a | yes | IRAM 30m | RD | Öberg et al. (2014); Bergner et al. (2017) | |
| L1527 | Low mass | 25 4 | 27 23 | 21 2 | 13 8 | NRO 45m | RD | Yoshida et al. (2019) | |
| L483 | Low mass | 28 3 | 7 13 | n/a | n/a | yes | IRAM 30m | M | Agúndez et al. (2019) |
| NGC1333-IRAS2 A | Low mass | 289 63 | 325 140 | 179 62 | PdBI | RD | Taquet et al. (2015) | ||
| 140 20 | PdBI | RD | Taquet et al. (2015) | ||||||
| NGC1333-IRAS2 A1 | Low mass | 200 108 | 229 21 | 161 17 | NOEMA | RD | Belloche et al. (2020) | ||
| NGC1333-IRAS4 A | Low mass | 360 162 | 300 151 | yes | PdBI | RD | Taquet et al. (2015) | ||
| 140 30 | yes | PdBI | RD | Taquet et al. (2015) | |||||
| NGC1333-IRAS4 A2 | Low mass | 280 171 | 307 56 | 142 13 | NOEMA | RD | Belloche et al. (2020) | ||
| NGC1333-IRAS4 B | Low mass | 14 6 | 328 110 | n/a | 305 52 | NOEMA | RD | Belloche et al. (2020) | |
| NGC 2264 CMM3 | High mass | 25 4 | 122 62 | 9 4 | Nobeyama 45m / ASTE | RD | Watanabe et al. (2015) | ||
| NGC 6334-29 | High mass | 169 4 | 285 28 | 127 1 | CSO | M | Widicus Weaver et al. (2017) | ||
| NGC 6334-38 | High mass | 36 2 | 45 6 | 33 1 | 21 0 | CSO | M | Widicus Weaver et al. (2017) | |
| NGC 6334-43 | High mass | 33 8 | 17 4 | 17 2 | 16 0 | yes | CSO | M | Widicus Weaver et al. (2017) |
| NGC 6334-I(N) | High mass | 22 1 | 35 3 | 20 0 | CSO | M | Widicus Weaver et al. (2017) | ||
| NGC 6334 IRS1 | High mass | 241 35 | n/a | 178 10 | JCMT + IRAM 30m | RD | Bisschop et al. (2007) | ||
| 58 23 | 116 37 | n/a | Nobeyama | RD | Suzuki et al. (2018) | ||||
| NGC 6334 IRS1 F | High mass | 83 31 | 313 347 | n/a | 201 24 | Nobeyama | RD | Suzuki et al. (2018) | |
| NGC 6334I MM1 | High mass | 120 11 | 120 32 | n/a | ALMA | RD | Suzuki et al. (2019) | ||
| NGC 6334I MM2 | High mass | 137 46 | 157 36 | n/a | ALMA | RD | Suzuki et al. (2019) | ||
| NGC 7129 FIRS 2 | Int. mass | yes | PdBI | RD | Fuente et al. (2014) | ||||
| 405 | 265 | 238 | yes | PdBI | M | Fuente et al. (2014) | |||
| NGC 7538 14.37 | High mass | 68 56 | 66 14 | n/a | n/a | yes | CSO | M | Widicus Weaver et al. (2017) |
| NGC 7538 IRS9 | High mass | 281 218 | 60 6 | yes | IRAM 30m + SMA | RD | Öberg et al. (2013) | ||
| 60 15 | 34 2 | yes | RD | Öberg et al. (2013) | |||||
| 111 20 | 81 16 | yes | IRAM 30m + SMA | RD | Fayolle et al. (2015) | ||||
| Orion KL | High mass | 200 | 140 10 | yes | OSO | RD | Johansson et al. (1984) | ||
| 285 | 120 | yes | OVRO | RD | Sutton et al. (1985) | ||||
| 445 36 | 188 3 | yes | CSO | RD | Schilke et al. (1997) | ||||
| 273 | 158 | yes | TRAO 14m | RD | Lee et al. (2001) | ||||
| 227 21 | 599 295 | JCMT | RD | White et al. (2003) | |||||
| 250 | 220 | yes | CSO | M | Comito et al. (2005) | ||||
| 655 235 | 308 42 | 229 4 | 194 2 | yes | CSO | M | Widicus Weaver et al. (2017) | ||
| 146 28 | 183 10 | n/a | Nobeyama | RD | Suzuki et al. (2018) | ||||
| 122 50 | 225 23 | n/a | Nobeyama | RD | Suzuki et al. (2018) | ||||
| Orion KL hot core | High mass | 133 20 | 160 10 | n/a | Nobeyama | RD | Ohishi et al. (1986) | ||
| 130 | 168 | n/a | n/a | JCMT | RD | Sutton et al. (1995) | |||
| 93 7 | 152 | n/a | NRO, NRAO | RD | Ikeda et al. (2001) | ||||
| 239 | 360 | n/a | 303 | CSO | RD | Schilke et al. (2001) | |||
| 137 | 178 | Odin | RD | Persson et al. (2007) | |||||
| 300 | 128 | 260 | yes | Herschel HIFI | M | Crockett et al. (2014) | |||
| 155 16 | 225 19 | IRAM 30m + SMA | RD | Feng et al. (2015) | |||||
| Orion KL compact ridge | High mass | 101 9 | 146 3 | OVRO | RD | Blake et al. (1987) | |||
| 125 | 105 | n/a | n/a | yes | JCMT | RD | Sutton et al. (1995) | ||
| 230 | 140 | yes | Herschel HIFI | M | Crockett et al. (2014) | ||||
| SerpS-MM18a | Low mass | 244 28 | 238 202 | 154 22 | yes | NOEMA | RD | Belloche et al. (2020) | |
| SerpS-MM18b | Low mass | 17 18 | 69 10 | NOEMA | RD | Belloche et al. (2020) | |||
| Sgr B2(N) | High mass | n/a | yes | SEST | RD | Nummelin et al. (2000) | |||
| 180 89 | 148 26 | n/a | yes | NRO | RD | Ikeda et al. (2001) | |||
| 200 | 130 | n/a | yes | IRAM 30m | M | Belloche et al. (2009) | |||
| 200 | 200 | IRAM 30m | M | Belloche et al. (2013) | |||||
| 300 | 180 | 170 | yes | Herschel HIFI | M | Neill et al. (2014) | |||
| Sgr B2(N) N2 | High mass | 253 15 | 142 4 | n/a | yes | ALMA | RD | Belloche et al. (2016) | |
| 200 | 160 | 170 | yes | ALMA | M | Belloche et al. (2016) | |||
| Sgr B2(N) N3 | High mass | 170 | 170 | 145 | ALMA | M | Bonfand et al. (2017) | ||
| Sgr B2(N) N4 | High mass | 150 | 190 | 145 | ALMA | M | Bonfand et al. (2017) | ||
| Sgr B2(N) N5 | High mass | 170 | 180 | 145 | ALMA | M | Bonfand et al. (2017) | ||
| Sgr B2(M) | High mass | 300 | 200 | yes | IRAM 30m | M | Belloche et al. (2013) | ||
| n/a | 150 | yes | SEST | RD | Nummelin et al. (2000) | ||||
| Sgr B2(NW) | High mass | n/a | SEST | RD | Nummelin et al. (2000) | ||||
| SVS 4-5 | Low mass | 17 2 | 20 0 | IRAM 30m | RD | Öberg et al. (2014); Bergner et al. (2017) | |||
| SVS13-A | Low mass | 317 136 | 285 82 | 222 49 | yes | NOEMA | RD | Belloche et al. (2020) | |
| W3(H2O) | High mass | 375 210 | 203 8 | yes | JCMT | RD | Helmich & van Dishoeck (1997) | ||
| 189 108 | n/a | 139 8 | JCMT + IRAM 30m | RD | Bisschop et al. (2007) | ||||
| 200 | 360 | SMA | M | Qin et al. (2015) | |||||
| 178 23 | 239 12 | 152 3 | 151 1 | CSO | M | Widicus Weaver et al. (2017) | |||
| W3(OH) | High mass | 95 | 155 | SMA | M | Qin et al. (2015) | |||
| W3 IRS5 | High mass | 92 23 | 166 85 | IRAM 30m + SMA | RD | Fayolle et al. (2015) | |||
| W43-MM1 core 3 | High mass | 170 70 | 320 80 | 130 60 | ALMA | RD | Molet et al. (2019) | ||
| W51 | High mass | 226 12 | 472 23 | 257 4 | CSO | M | Widicus Weaver et al. (2017) | ||
| 118 38 | 197 28 | n/a | Nobeyama | RD | Suzuki et al. (2018) | ||||
| 106 82 | 293 62 | n/a | Nobeyama | RD | Suzuki et al. (2018) | ||||
| W51 e1/e2 | High mass | 236 99 | 208 | n/a | yes | NRO, NRAO | RD | Ikeda et al. (2001) | |
| 237 48 | 174 44 | 212 8 | 143 10 | yes | OSO | RD | Kalenskii & Johansson (2010b) | ||
| W51 e2 | High mass | 114 11 | 154 8 | n/a | n/a | IRAM 30m | RD | Demyk et al. (2008) | |
| 155 98 | 94 19 | n/a | yes | ALMA | RD | Suzuki et al. (2019) | |||
| W51 e8 | High mass | 131 51 | 205 40 | n/a | ALMA | RD | Suzuki et al. (2019) | ||
| W75N | High mass | 169 7 | 206 2 | CSO | M | Widicus Weaver et al. (2017) | |||
| 144ggTotal number of entries. | 64hhTotal number of entries showing a sign of carbon grain sublimation. |
References
- Agúndez et al. (2019) Agúndez, M., Marcelino, N., Cernicharo, J., Roueff, E., & Tafalla, M. 2019, A&A, 625, A147, doi: 10.1051/0004-6361/201935164
- Allen et al. (2017) Allen, V., van der Tak, F. F. S., Sánchez-Monge, Á., Cesaroni, R., & Beltrán, M. T. 2017, A&A, 603, A133, doi: 10.1051/0004-6361/201629118
- Allen et al. (2018) Allen, V., van der Tak, F. F. S., & Walsh, C. 2018, A&A, 616, A67, doi: 10.1051/0004-6361/201732553
- Altwegg et al. (2020) Altwegg, K., Balsiger, H., Hänni, N., et al. 2020, Nature Astronomy, 3, doi: 10.1038/s41550-019-0991-9
- Anderson et al. (2017) Anderson, D. E., Bergin, E. A., Blake, G. A., et al. 2017, ApJ, 845, 13, doi: 10.3847/1538-4357/aa7da1
- Aslam Siddiqi et al. (2009) Aslam Siddiqi, M., Siddiqui, R. A., & Atakan, B. 2009, Journal of Chemical & Engineering Data, 54, 2795, doi: 10.1021/je9001653
- Beaklini et al. (2020) Beaklini, P. P. B., Mendoza, E., Canelo, C. M., et al. 2020, MNRAS, 491, 427, doi: 10.1093/mnras/stz3024
- Belloche et al. (2009) Belloche, A., Garrod, R. T., Müller, H. S. P., et al. 2009, A&A, 499, 215, doi: 10.1051/0004-6361/200811550
- Belloche et al. (2016) Belloche, A., Müller, H. S. P., Garrod, R. T., & Menten, K. M. 2016, A&A, 587, A91, doi: 10.1051/0004-6361/201527268
- Belloche et al. (2013) Belloche, A., Müller, H. S. P., Menten, K. M., Schilke, P., & Comito, C. 2013, A&A, 559, A47, doi: 10.1051/0004-6361/201321096
- Belloche et al. (2020) Belloche, A., Maury, A. J., Maret, S., et al. 2020, arXiv e-prints, arXiv:2002.00592. https://arxiv.org/abs/2002.00592
- Bergin et al. (2015) Bergin, E. A., Blake, G. A., Ciesla, F., Hirschmann, M. M., & Li, J. 2015, Proceedings of the National Academy of Science, 112, 8965, doi: 10.1073/pnas.1500954112
- Bergin & Cleeves (2018) Bergin, E. A., & Cleeves, L. I. 2018, Chemistry During the Gas-Rich Stage of Planet Formation, 137, doi: 10.1007/978-3-319-55333-7_137
- Bergin & Snell (2002) Bergin, E. A., & Snell, R. L. 2002, ApJ, 581, L105, doi: 10.1086/346014
- Bergner et al. (2017) Bergner, J. B., Öberg, K. I., Garrod, R. T., & Graninger, D. M. 2017, ApJ, 841, 120, doi: 10.3847/1538-4357/aa72f6
- Bergner et al. (2016) Bergner, J. B., Öberg, K. I., Rajappan, M., & Fayolle, E. C. 2016, ApJ, 829, 85, doi: 10.3847/0004-637X/829/2/85
- Bisschop et al. (2007) Bisschop, S. E., Jørgensen, J. K., van Dishoeck, E. F., & de Wachter, E. B. M. 2007, A&A, 465, 913, doi: 10.1051/0004-6361:20065963
- Blake et al. (1987) Blake, G. A., Sutton, E. C., Masson, C. R., & Phillips, T. G. 1987, ApJ, 315, 621, doi: 10.1086/165165
- Bøgelund et al. (2019) Bøgelund, E. G., Barr, A. G., Taquet, V., et al. 2019, A&A, 628, A2, doi: 10.1051/0004-6361/201834527
- Bonfand et al. (2017) Bonfand, M., Belloche, A., Menten, K. M., Garrod, R. T., & Müller, H. S. P. 2017, A&A, 604, A60, doi: 10.1051/0004-6361/201730648
- Bossa et al. (2008) Bossa, J. B., Theulé, P., Duvernay, F., Borget, F., & Chiavassa, T. 2008, A&A, 492, 719, doi: 10.1051/0004-6361:200810536
- Brouillet et al. (2015) Brouillet, N., Despois, D., Lu, X. H., et al. 2015, A&A, 576, A129, doi: 10.1051/0004-6361/201424588
- Calcutt et al. (2018a) Calcutt, H., Jørgensen, J. K., Müller, H. S. P., et al. 2018a, A&A, 616, A90, doi: 10.1051/0004-6361/201732289
- Calcutt et al. (2018b) Calcutt, H., Fiechter, M. R., Willis, E. R., et al. 2018b, A&A, 617, A95, doi: 10.1051/0004-6361/201833140
- Caselli et al. (1993) Caselli, P., Hasegawa, T. I., & Herbst, E. 1993, ApJ, 408, 548, doi: 10.1086/172612
- Caselli et al. (2012) Caselli, P., Keto, E., Bergin, E. A., et al. 2012, ApJ, 759, L37, doi: 10.1088/2041-8205/759/2/L37
- Cazaux et al. (2003) Cazaux, S., Tielens, A. G. G. M., Ceccarelli, C., et al. 2003, ApJ, 593, L51, doi: 10.1086/378038
- Charnley et al. (1992) Charnley, S. B., Tielens, A. G. G. M., & Millar, T. J. 1992, ApJ, 399, L71, doi: 10.1086/186609
- Churchwell et al. (1986) Churchwell, E., Wood, D., Myers, P. C., & Myers, R. V. 1986, ApJ, 305, 405, doi: 10.1086/164256
- Cieza et al. (2016) Cieza, L. A., Casassus, S., Tobin, J., et al. 2016, Nature, 535, 258, doi: 10.1038/nature18612
- Clementi & Gayles (1967) Clementi, E., & Gayles, J. N. 1967, J. Chem. Phys., 47, 3837, doi: 10.1063/1.1701543
- Comito et al. (2005) Comito, C., Schilke, P., Phillips, T. G., et al. 2005, ApJS, 156, 127, doi: 10.1086/425996
- Coutens et al. (2018) Coutens, A., Willis, E. R., Garrod, R. T., et al. 2018, A&A, 612, A107, doi: 10.1051/0004-6361/201732346
- Crockett et al. (2015) Crockett, N. R., Bergin, E. A., Neill, J. L., et al. 2015, ApJ, 806, 239, doi: 10.1088/0004-637X/806/2/239
- Crockett et al. (2014) —. 2014, ApJ, 787, 112, doi: 10.1088/0004-637X/787/2/112
- Csengeri et al. (2019) Csengeri, T., Belloche, A., Bontemps, S., et al. 2019, A&A, 632, A57, doi: 10.1051/0004-6361/201935226
- D’Alessio et al. (2005) D’Alessio, P., Calvet, N., & Woolum, D. S. 2005, in Astronomical Society of the Pacific Conference Series, Vol. 341, Chondrites and the Protoplanetary Disk, ed. A. N. Krot, E. R. D. Scott, & B. Reipurth, 353
- Danger et al. (2011) Danger, G., Borget, F., Chomat, M., et al. 2011, A&A, 535, A47, doi: 10.1051/0004-6361/201117602
- Demyk et al. (2008) Demyk, K., Wlodarczak, G., & Carvajal, M. 2008, A&A, 489, 589, doi: 10.1051/0004-6361:200809354
- Evans et al. (2009) Evans, Neal J., I., Dunham, M. M., Jørgensen, J. K., et al. 2009, ApJS, 181, 321, doi: 10.1088/0067-0049/181/2/321
- Favre et al. (2017) Favre, C., Pagani, L., Goldsmith, P. F., et al. 2017, A&A, 604, L2, doi: 10.1051/0004-6361/201731327
- Fayolle et al. (2015) Fayolle, E. C., Öberg, K. I., Garrod, R. T., van Dishoeck, E. F., & Bisschop, S. E. 2015, A&A, 576, A45, doi: 10.1051/0004-6361/201323114
- Feng et al. (2015) Feng, S., Beuther, H., Henning, T., et al. 2015, A&A, 581, A71, doi: 10.1051/0004-6361/201322725
- Finocchi et al. (1997) Finocchi, F., Gail, H. P., & Duschl, W. J. 1997, A&A, 325, 1264
- Fischer et al. (2020) Fischer, R. A., Cottrell, E., Hauri, E., Lee, K. K. M., & Le Voyer, M. 2020, Proceedings of the National Academy of Sciences, 117, 8743, doi: 10.1073/pnas.1919930117
- Fontani et al. (2007) Fontani, F., Pascucci, I., Caselli, P., et al. 2007, A&A, 470, 639, doi: 10.1051/0004-6361:20077485
- Friedel & Snyder (2008) Friedel, D. N., & Snyder, L. E. 2008, ApJ, 672, 962, doi: 10.1086/523896
- Fu & Lin (2016) Fu, L., & Lin, G.-M. 2016, Research in Astronomy and Astrophysics, 16, 182, doi: 10.1088/1674-4527/16/12/182
- Fuente et al. (2014) Fuente, A., Cernicharo, J., Caselli, P., et al. 2014, A&A, 568, A65, doi: 10.1051/0004-6361/201323074
- Gail & Trieloff (2017) Gail, H.-P., & Trieloff, M. 2017, A&A, 606, A16, doi: 10.1051/0004-6361/201730480
- Garrod (2013) Garrod, R. T. 2013, ApJ, 765, 60, doi: 10.1088/0004-637X/765/1/60
- Garrod et al. (2008) Garrod, R. T., Widicus Weaver, S. L., & Herbst, E. 2008, ApJ, 682, 283, doi: 10.1086/588035
- Geers et al. (2009) Geers, V. C., van Dishoeck, E. F., Pontoppidan, K. M., et al. 2009, A&A, 495, 837, doi: 10.1051/0004-6361:200811001
- Geiss (1987) Geiss, J. 1987, A&A, 187, 859
- Gibb et al. (2000) Gibb, E., Nummelin, A., Irvine, W. M., Whittet, D. C. B., & Bergman, P. 2000, ApJ, 545, 309, doi: 10.1086/317805
- Gieser et al. (2019) Gieser, C., Semenov, D., Beuther, H., et al. 2019, A&A, 631, A142, doi: 10.1051/0004-6361/201935865
- Goldfarb & Suuberg (2008) Goldfarb, J. L., & Suuberg, E. M. 2008, Journal of Chemical & Engineering Data, 53, 670, doi: 10.1021/je7005133
- Hartmann & Kenyon (1996) Hartmann, L., & Kenyon, S. J. 1996, ARA&A, 34, 207, doi: 10.1146/annurev.astro.34.1.207
- Hatchell et al. (1998) Hatchell, J., Thompson, M. A., Millar, T. J., & MacDonald, G. H. 1998, A&AS, 133, 29, doi: 10.1051/aas:1998309
- Helmich & van Dishoeck (1997) Helmich, F. P., & van Dishoeck, E. F. 1997, A&AS, 124, 205, doi: 10.1051/aas:1997357
- Hsieh et al. (2019) Hsieh, T.-H., Murillo, N. M., Belloche, A., et al. 2019, ApJ, 884, 149, doi: 10.3847/1538-4357/ab425a
- Ikeda et al. (2001) Ikeda, M., Ohishi, M., Nummelin, A., et al. 2001, ApJ, 560, 792, doi: 10.1086/322957
- Isokoski et al. (2013) Isokoski, K., Bottinelli, S., & van Dishoeck, E. F. 2013, A&A, 554, A100, doi: 10.1051/0004-6361/201220959
- Jensen et al. (2007) Jensen, A. G., Rachford, B. L., & Snow, T. P. 2007, ApJ, 654, 955, doi: 10.1086/509096
- Jessberger et al. (1988) Jessberger, E. K., Christoforidis, A., & Kissel, J. 1988, Nature, 332, 691, doi: 10.1038/332691a0
- Jiménez-Serra et al. (2012) Jiménez-Serra, I., Zhang, Q., Viti, S., Martín-Pintado, J., & de Wit, W. J. 2012, ApJ, 753, 34, doi: 10.1088/0004-637X/753/1/34
- Johansson et al. (1984) Johansson, L. E. B., Andersson, C., Ellder, J., et al. 1984, A&A, 130, 227
- Johnstone et al. (2013) Johnstone, D., Hendricks, B., Herczeg, G. J., & Bruderer, S. 2013, ApJ, 765, 133, doi: 10.1088/0004-637X/765/2/133
- Jørgensen et al. (2015) Jørgensen, J. K., Visser, R., Williams, J. P., & Bergin, E. A. 2015, A&A, 579, A23, doi: 10.1051/0004-6361/201425317
- Jørgensen et al. (2018) Jørgensen, J. K., Müller, H. S. P., Calcutt, H., et al. 2018, A&A, 620, A170, doi: 10.1051/0004-6361/201731667
- Jura (2006) Jura, M. 2006, ApJ, 653, 613, doi: 10.1086/508738
- Kalenskii & Johansson (2010a) Kalenskii, S. V., & Johansson, L. E. B. 2010a, Astronomy Reports, 54, 295, doi: 10.1134/S1063772910040037
- Kalenskii & Johansson (2010b) —. 2010b, Astronomy Reports, 54, 1084, doi: 10.1134/S1063772910120036
- Klarmann et al. (2018) Klarmann, L., Ormel, C. W., & Dominik, C. 2018, A&A, 618, L1, doi: 10.1051/0004-6361/201833719
- Kress et al. (2010) Kress, M. E., Tielens, A. G. G. M., & Frenklach, M. 2010, Advances in Space Research, 46, 44, doi: 10.1016/j.asr.2010.02.004
- Lee et al. (2001) Lee, C. W., Cho, S.-H., & Lee, S.-M. 2001, ApJ, 551, 333, doi: 10.1086/320062
- Lee (2007) Lee, J.-E. 2007, Journal of Korean Astronomical Society, 40, 83, doi: 10.5303/JKAS.2007.40.4.083
- Lee et al. (2010) Lee, J.-E., Bergin, E. A., & Nomura, H. 2010, ApJ, 710, L21, doi: 10.1088/2041-8205/710/1/L21
- Lee et al. (2019) Lee, J.-E., Lee, S., Baek, G., et al. 2019, Nature Astronomy, 3, 314, doi: 10.1038/s41550-018-0680-0
- Lodders (2010) Lodders, K. 2010, Astrophysics and Space Science Proceedings, 16, 379, doi: 10.1007/978-3-642-10352-0_8
- MacDonald et al. (1996) MacDonald, G. H., Gibb, A. G., Habing, R. J., & Millar, T. J. 1996, A&AS, 119, 333
- Manigand et al. (2020) Manigand, S., Jørgensen, J. K., Calcutt, H., et al. 2020, A&A, 635, A48, doi: 10.1051/0004-6361/201936299
- Manske & Henning (1999) Manske, V., & Henning, T. 1999, A&A, 349, 907
- Marty (2012) Marty, B. 2012, Earth and Planetary Science Letters, 313, 56, doi: 10.1016/j.epsl.2011.10.040
- McGuire et al. (2018) McGuire, B. A., Burkhardt, A. M., Kalenskii, S., et al. 2018, Science, 359, 202, doi: 10.1126/science.aao4890
- Mendoza et al. (2018) Mendoza, E., Bronfman, L., Duronea, N. U., et al. 2018, ApJ, 853, 152, doi: 10.3847/1538-4357/aaa1ec
- Mishra & Li (2015) Mishra, A., & Li, A. 2015, ApJ, 809, 120, doi: 10.1088/0004-637X/809/2/120
- Molet et al. (2019) Molet, J., Brouillet, N., Nony, T., et al. 2019, A&A, 626, A132, doi: 10.1051/0004-6361/201935497
- Mookerjea et al. (2007) Mookerjea, B., Casper, E., Mundy, L. G., & Looney, L. W. 2007, ApJ, 659, 447, doi: 10.1086/512095
- Nakano et al. (2003) Nakano, H., Kouchi, A., Tachibana, S., & Tsuchiyama, A. 2003, ApJ, 592, 1252, doi: 10.1086/375856
- Neill et al. (2014) Neill, J. L., Bergin, E. A., Lis, D. C., et al. 2014, ApJ, 789, 8, doi: 10.1088/0004-637X/789/1/8
- Nieva & Przybilla (2012) Nieva, M. F., & Przybilla, N. 2012, A&A, 539, A143, doi: 10.1051/0004-6361/201118158
- Noble et al. (2013) Noble, J. A., Theule, P., Borget, F., et al. 2013, MNRAS, 428, 3262, doi: 10.1093/mnras/sts272
- Nummelin et al. (2000) Nummelin, A., Bergman, P., Hjalmarson, Å., et al. 2000, ApJS, 128, 213, doi: 10.1086/313376
- Öberg et al. (2013) Öberg, K. I., Boamah, M. D., Fayolle, E. C., et al. 2013, ApJ, 771, 95, doi: 10.1088/0004-637X/771/2/95
- Öberg et al. (2014) Öberg, K. I., Lauck, T., & Graninger, D. 2014, ApJ, 788, 68, doi: 10.1088/0004-637X/788/1/68
- Ohishi et al. (1986) Ohishi, M., Kaifu, N., Suzuki, H., & Morimoto, M. 1986, Ap&SS, 118, 405, doi: 10.1007/BF00651157
- Ospina-Zamudio et al. (2018) Ospina-Zamudio, J., Lefloch, B., Ceccarelli, C., et al. 2018, A&A, 618, A145, doi: 10.1051/0004-6361/201832857
- Palau et al. (2017) Palau, A., Walsh, C., Sánchez-Monge, Á., et al. 2017, MNRAS, 467, 2723, doi: 10.1093/mnras/stx004
- Peng et al. (2013) Peng, T. C., Despois, D., Brouillet, N., et al. 2013, A&A, 554, A78, doi: 10.1051/0004-6361/201220891
- Persson et al. (2007) Persson, C. M., Olofsson, A. O. H., Koning, N., et al. 2007, A&A, 476, 807, doi: 10.1051/0004-6361:20077225
- Poch et al. (2020) Poch, O., Istiqomah, I., Quirico, E., et al. 2020, Science, 367, aaw7462, doi: 10.1126/science.aaw7462
- Poteet et al. (2015) Poteet, C. A., Whittet, D. C. B., & Draine, B. T. 2015, ApJ, 801, 110, doi: 10.1088/0004-637X/801/2/110
- Qin et al. (2015) Qin, S.-L., Schilke, P., Wu, J., et al. 2015, ApJ, 803, 39, doi: 10.1088/0004-637X/803/1/39
- Qin et al. (2010) Qin, S.-L., Wu, Y., Huang, M., et al. 2010, ApJ, 711, 399, doi: 10.1088/0004-637X/711/1/399
- Raunier et al. (2004) Raunier, S., Chiavassa, T., Marinelli, F., & Aycard, J.-P. 2004, Chemical Physics, 302, 259, doi: 10.1016/j.chemphys.2004.04.013
- Remusat (2014) Remusat, L. 2014, BIO Web of Conferences, 2, 03001, doi: 10.1051/bioconf/20140203001
- Rice et al. (2018) Rice, T. S., Bergin, E. A., Jørgensen, J. K., & Wampfler, S. F. 2018, ApJ, 866, 156, doi: 10.3847/1538-4357/aadfdb
- Rodgers & Charnley (2001) Rodgers, S. D., & Charnley, S. B. 2001, ApJ, 546, 324, doi: 10.1086/318263
- Rubin et al. (2019) Rubin, M., Altwegg, K., Balsiger, H., et al. 2019, MNRAS, 489, 594, doi: 10.1093/mnras/stz2086
- Schilke et al. (2001) Schilke, P., Benford, D. J., Hunter, T. R., Lis, D. C., & Phillips, T. G. 2001, ApJS, 132, 281, doi: 10.1086/318951
- Schilke et al. (1997) Schilke, P., Groesbeck, T. D., Blake, G. A., Phillips, & T. G. 1997, ApJS, 108, 301, doi: 10.1086/312948
- Scholz et al. (2013) Scholz, A., Froebrich, D., & Wood, K. 2013, MNRAS, 430, 2910, doi: 10.1093/mnras/stt091
- Sutton et al. (1985) Sutton, E. C., Blake, G. A., Masson, C. R., & Phillips, T. G. 1985, ApJS, 58, 341, doi: 10.1086/191045
- Sutton et al. (1995) Sutton, E. C., Peng, R., Danchi, W. C., et al. 1995, ApJS, 97, 455, doi: 10.1086/192147
- Suzuki et al. (2018) Suzuki, T., Ohishi, M., Saito, M., et al. 2018, ApJS, 237, 3, doi: 10.3847/1538-4365/aac8db
- Suzuki et al. (2019) Suzuki, T., Majumdar, L., Tokuda, K., et al. 2019, arXiv e-prints, arXiv:1909.00528. https://arxiv.org/abs/1909.00528
- Taniguchi et al. (2018) Taniguchi, K., Saito, M., Majumdar, L., et al. 2018, ApJ, 866, 150, doi: 10.3847/1538-4357/aade97
- Taquet et al. (2015) Taquet, V., López-Sepulcre, A., Ceccarelli, C., et al. 2015, ApJ, 804, 81, doi: 10.1088/0004-637X/804/2/81
- Tielens (2011) Tielens, A. G. G. M. 2011, in IAU Symposium, Vol. 280, The Molecular Universe, ed. J. Cernicharo & R. Bachiller, 3–18, doi: 10.1017/S1743921311024823
- van Dishoeck & van der Tak (2000) van Dishoeck, E. F., & van der Tak, F. F. S. 2000, in IAU Symposium, Vol. 197, From Molecular Clouds to Planetary, ed. Y. C. Minh & E. F. van Dishoeck, 97. https://arxiv.org/abs/astro-ph/0002098
- Vinogradoff et al. (2011) Vinogradoff, V., Duvernay, F., Danger, G., Theulé, P., & Chiavassa, T. 2011, A&A, 530, A128, doi: 10.1051/0004-6361/201116688
- Visser & Bergin (2012) Visser, R., & Bergin, E. A. 2012, ApJ, 754, L18, doi: 10.1088/2041-8205/754/1/L18
- Visser et al. (2015) Visser, R., Bergin, E. A., & Jørgensen, J. K. 2015, A&A, 577, A102, doi: 10.1051/0004-6361/201425365
- Wasson & Kallemeyn (1988) Wasson, J. T., & Kallemeyn, G. W. 1988, Philosophical Transactions of the Royal Society of London Series A, 325, 535, doi: 10.1098/rsta.1988.0066
- Watanabe et al. (2015) Watanabe, Y., Sakai, N., López-Sepulcre, A., et al. 2015, ApJ, 809, 162, doi: 10.1088/0004-637X/809/2/162
- Wei et al. (2019) Wei, C.-E., Nomura, H., Lee, J.-E., et al. 2019, ApJ, 870, 129, doi: 10.3847/1538-4357/aaf390
- White et al. (2003) White, G. J., Araki, M., Greaves, J. S., Ohishi, M., & Higginbottom, N. S. 2003, A&A, 407, 589, doi: 10.1051/0004-6361:20030841
- Whittet (2010) Whittet, D. C. B. 2010, ApJ, 710, 1009, doi: 10.1088/0004-637X/710/2/1009
- Widicus Weaver et al. (2017) Widicus Weaver, S. L., Laas, J. C., Zou, L., et al. 2017, ApJS, 232, 3, doi: 10.3847/1538-4365/aa8098
- Wong & An (2018) Wong, W.-H., & An, T. 2018, Research in Astronomy and Astrophysics, 18, 134, doi: 10.1088/1674-4527/18/11/134
- Wyrowski et al. (1999) Wyrowski, F., Schilke, P., Walmsley, C. M., & Menten, K. M. 1999, ApJ, 514, L43, doi: 10.1086/311934
- Yoshida et al. (2019) Yoshida, K., Sakai, N., Nishimura, Y., et al. 2019, PASJ, 71, S18, doi: 10.1093/pasj/psy136