Simulating the “hidden giant" in cold and self-interacting dark matter models
Abstract
We perform a series of controlled N-body simulations to study realizations of the recently discovered Antlia 2 galaxy in cold dark matter (CDM) and self-interacting dark matter (SIDM) scenarios. Our simulations contain six benchmark models, where we vary the initial halo concentration and the self-scattering cross section. We adopt well-motivated initial stellar and halo masses, and our fiducial orbit has a small pericenter. After evolving in the Milky Way’s tidal field, the simulated galaxies experience significant mass loss and their stellar distributions expand accordingly. These tidal effects are more prominent if the initial halo concentration is lower and if the self-scattering cross section is larger. Our results show that Antlia 2-like galaxies could be realized in CDM if the halo concentration is low and the stellar distribution is diffuse at the infall time, while these conditions could be relaxed in SIDM. We also find all the simulated galaxies predict approximately the same stellar velocity dispersion after imposing selection criteria for stellar particles. This has important implications for testing dark matter models using tidally disturbed systems.
keywords:
methods: numerical-galaxies: evolution-galaxies: formation-galaxies: structure- cosmology: theory1 Introduction
The newly discovered Antlia 2 satellite galaxy is the lowest surface brightness galaxy known to date (Torrealba et al., 2019). Its half-light radius is , making it two orders of magnitude more diffuse than ultra-diffuse galaxies (Koda et al., 2015). It is located near the Galactic plane, at a galactic latitude of . Because of these unique properties, the Antlia 2 galaxy has been dubbed “hidden giant." In fact, Bullock et al. (2010) predicted the existence of this type of so-called stealth galaxies, which have similar luminosities but more extended stellar distributions, compared to ultra-faint dwarf galaxies.
Chakrabarti et al. (2019) used Gaia proper motions (Gaia Collaboration, 2018) to derive orbital parameters of the Antlia 2 galaxy. They also calculated its dynamical effect on the outer HI disk of the Milky Way and found orbits with low pericenters ( kpc) could match the observed disturbances in the HI disk (Levine et al., 2006). Interestingly, Chakrabarti & Blitz (2009, 2011) proposed that the HI disturbances could be explained by the existence of a subhalo as a perturber, and its predicted radial location at the present time is consistent with that of Antlia 2.
Torrealba et al. (2019) used controlled N-body simulations to explore the origin of Antlia 2 in the Milky Way’s tidal field, and they considered both cuspy and cored dark matter density profiles. To match the observations, they found that the cuspy halo requires unreasonable model parameters. For example, the adopted initial halo mass is , which is too low to form galaxies (Okamoto et al., 2008; Benitez-Llambay & Frenk, 2020), and the ratio of stellar-to-halo scale radii at the infall is , too large to be produced in hydrodynamical simulations even with strong baryonic feedback (Fitts et al., 2017; Wheeler et al., 2019; Lazar et al., 2020). For their cored profile, the initial halo mass is much larger, , and the assumed radius of the stellar distribution is comparable to the halo’s scale radius. They found that Antlia 2 favors a cored halo than a cuspy one.
The indication that Antlia 2 may prefer a cored halo profile is of significant interest in the context of the core vs. cusp issue of cold dark matter (CDM), i.e., many dwarf spiral galaxies favor a dark matter density core over a cusp as predicted in CDM-only simulations (Dubinski & Carlberg, 1991; Navarro et al., 1997); see de Blok (2010); Bullock & Boylan-Kolchin (2017); Tulin & Yu (2018) for reviews. Recent simulations show that baryonic feedback could produce density cores (Read & Gilmore, 2005; Governato et al., 2010; Chan et al., 2015; Santos-Santos et al., 2018; Fitts et al., 2019) and the dark matter core size could be as large as for a CDM halo (Lazar et al., 2020). On the other hand, the cores could also form if dark matter has strong self-interactions (Spergel & Steinhardt, 2000; Feng et al., 2009; Arkani-Hamed et al., 2009; Loeb & Weiner, 2011; Tulin et al., 2013; Kaplinghat et al., 2016). It has been shown that this self-interacting dark matter (SIDM) scenario could explain diverse dark matter distributions in the field galaxies (Creasey et al., 2017; Kamada et al., 2017; Ren et al., 2019), dwarf galaxies of the Milky Way (Vogelsberger et al., 2012; Zavala et al., 2013; Valli & Yu, 2018; Kahlhoefer et al., 2019; Sameie et al., 2020) and ultra diffuse galaxies (Yang et al., 2020). It is interesting to see whether Antlia 2 could shed further light on the nature of dark matter.
In this work, we study realizations of Antlia 2 using controlled N-body simulations in both CDM and SIDM scenarios. The simulated satellites contain halo and stellar components and their masses are well motivated by the stellar-halo mass (Moster et al., 2013; Behroozi et al., 2013) and mass-metallicity (Kirby et al., 2013) relations. For the CDM simulations, we vary initial halo concentration, while for the SIDM simulations we fix the concentration, but vary the dark matter self-scattering cross section. Our orbital distribution is derived from the observed Gaia proper motions of Antlia 2, and our fiducial orbit has a low pericenter and is nearly co-planar, like the orbit that Chakrabarti et al. (2019) found matched the disturbances in the outer HI disk of the Milky Way. We further compare our simulations to Antlia 2’s observables reported in Torrealba et al. (2019), including the observed line-of-sight (LoS) velocity dispersion, half-light radius, stellar mass, as well as dynamical mass within the half-light radius.
As we will show, tidal interactions play an important role in shaping dark matter and stellar distributions of our simulated galaxies in both CDM and SIDM. In contrast to the early results (Torrealba et al., 2019), we find Antlia 2-like galaxies could be realized in CDM if the initial halo has a low concentration and the initial stellar distribution is highly diffuse, while in SIDM a higher halo concentration and a compact stellar distribution are also allowed. All our simulated galaxies have approximately the same LoS stellar velocity dispersion after a realistic velocity cut, although their inner dark matter densities are different. We discuss its implications for discriminating between CDM and SIDM models. We also investigate gravitational boundedness on the computation of the stellar kinematics and the impact of different orbital trajectories.
2 Simulations
We perform our simulations using a modified version of the code Arepo (Springel, 2010), which includes a module implementing the dark matter self-interactions (Vogelsberger et al., 2012; Vogelsberger et al., 2016; Vogelsberger et al., 2019). Following Chakrabarti et al. (2019), we model the host including both halo and stellar components with a Hernquist profile (Hernquist, 1990),
| (1) |
where and are total mass and characteristic length scale, respectively. The corresponding virial mass of the halo is . This is comparable to recent mass models of the Milky Way inferred from observations (Boylan-Kolchin et al., 2013; Fritz et al., 2018; Watkins et al., 2019; Deason et al., 2019; Posti & Helmi, 2019). In our simulations, we assume the host potential given in Eq. 1 is static.
We use a Navarro-Frenk-White profile (Navarro et al., 1997) to model the initial dark matter distribution of the simulated galaxies,
| (2) |
where and are the characteristic density and length scale. Equivalently, we can use the virial mass and halo concentration to specify a halo, where is the halo’s virial radius. We consider six benchmark models for our simulations. We fix , estimated from the stellar-halo mass relation (Moster et al., 2013; Behroozi et al., 2013). For CDM, we choose and , corresponding to the median of relationship and and deviations below the median concentration at fixed mass found in cosmological simulations at (Dutton & Macciò, 2014). Compared to Torrealba et al. (2019), where is fixed, we explore a broader range of halo models. For our SIDM simulations, we set , but vary the self-scattering cross section as and (hereafter denoted as SIDM1, SIDM3 and SIDM5, respectively). These cross sections are motivated to address CDM’s small-scale issues and pass observational tests on galactic scales (Tulin & Yu, 2018).
The initial stellar component of the satellites is modeled with a Plummer profile (Plummer, 1911),
| (3) |
where is the mass and is the scale length of the stellar distribution. In order to accommodate stellar mass loss after tidal evolution, we assume , which is on the higher limit of the mass-metallicity relation (Kirby et al., 2013). We choose the length scale as . This is motivated by recent hydrodynamical simulations in Lazar et al. (2020), where they showed a 3D half-mass radius of could be achieved for a halo. Note for a Plummer profile the 2D projected half-mass radius is , and (Wolf et al., 2010).
The simulated galaxies consist of million dark matter and million star particles. The mass resolutions are and for the dark matter and stars. The Plummer-equivalent softening length is . The initial conditions for the simulated galaxies are generated using the publicly available code SPHERIC (Garrison-Kimmel et al., 2013).
We follow Chakrabarti et al. (2019) and obtain the orbits for the simulated galaxies. The initial position and velocities are derived from backward integrating the observed Gaia proper motions of the Antlia 2 dwarf for . We further sample the errors in the proper motions to derive an orbital distribution. The orbit we consider has apocenter and pericenter radii of and .
3 Results
3.1 Tidal evolution and dark matter distributions
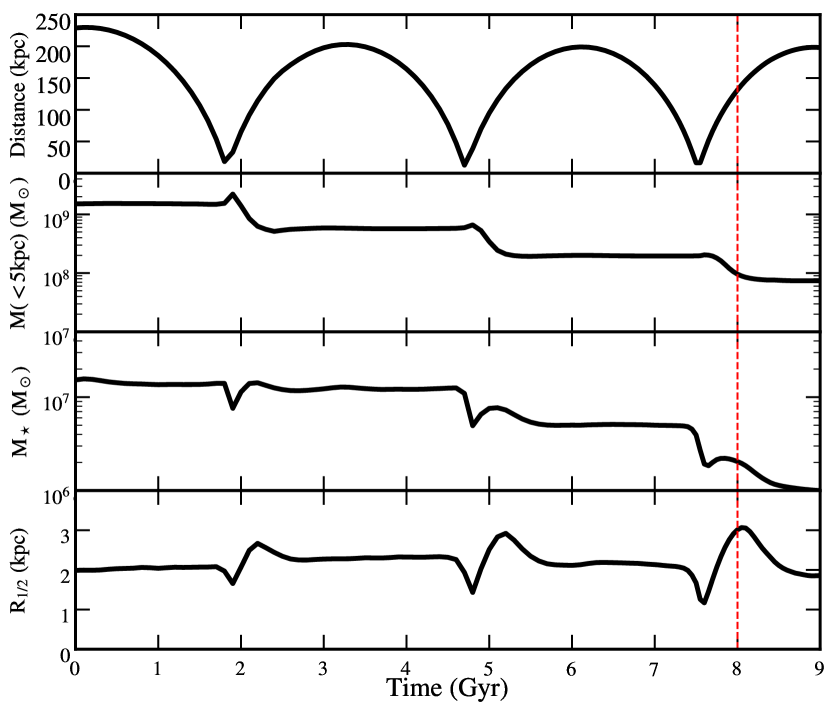
We investigate the tidal evolution of the CDM galaxy. Fig. 1 shows the characteristic observables vs. time, including the distance from the host, dynamical mass, stellar mass and 2D half-mass radius. In computing the dynamical mass, we sum both halo and stellar masses within an inner radius of the galaxy. To estimate the stellar mass and half-mass radius, we first choose stars that pass a velocity cut of km/s, where is the LoS velocity of the stars and is the bulk velocity of the satellite; we will discuss velocity cut in detail later. Then, the stellar mass and half-mass radius are evaluated by fitting a Plummer profile to the simulated stellar particles inside of a radius at each snapshot.
We estimate Antlia 2’s infall to be around ago, based on orbit-integration calculations (Chakrabarti et al., 2019). From Fig. 1, we see the distance of the simulated galaxy from its host at is , in good agreement with the measured value of for Antlia 2 (Torrealba et al., 2019). The dynamical mass decreases substantially at each pericenter passage, especially at the first two, due to tidal stripping. After of evolution, the satellite has lost more than of its initial mass. In contrast, the tidal mass loss of stars only becomes more significant on the later stages. This is because the tidal stripping is an outside-in process, i.e., it first removes most of the mass in the outskirts dominated by dark matter, and then continues to strip more concentrated stellar mass in the inner regions (see also Peñarrubia et al., 2008; Peñarrubia et al., 2010). In addition, there is an oscillatory trend in the half-mass radius over the course of the evolution. The stellar distribution progressively becomes more diffuse after each pericenter passage. At , the 2D half-mass radius is maximized, , which is close to the measured value, and is larger than its initial value.
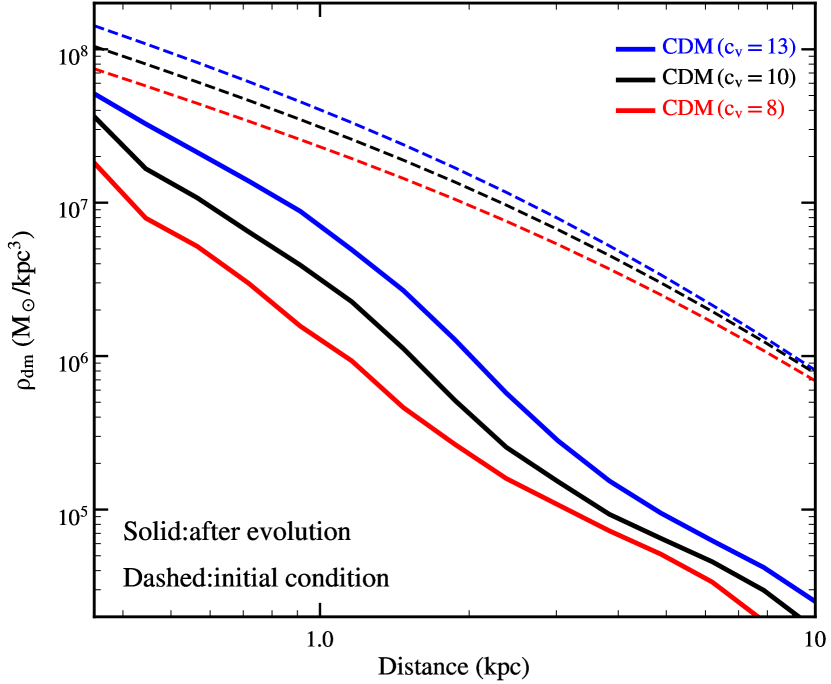
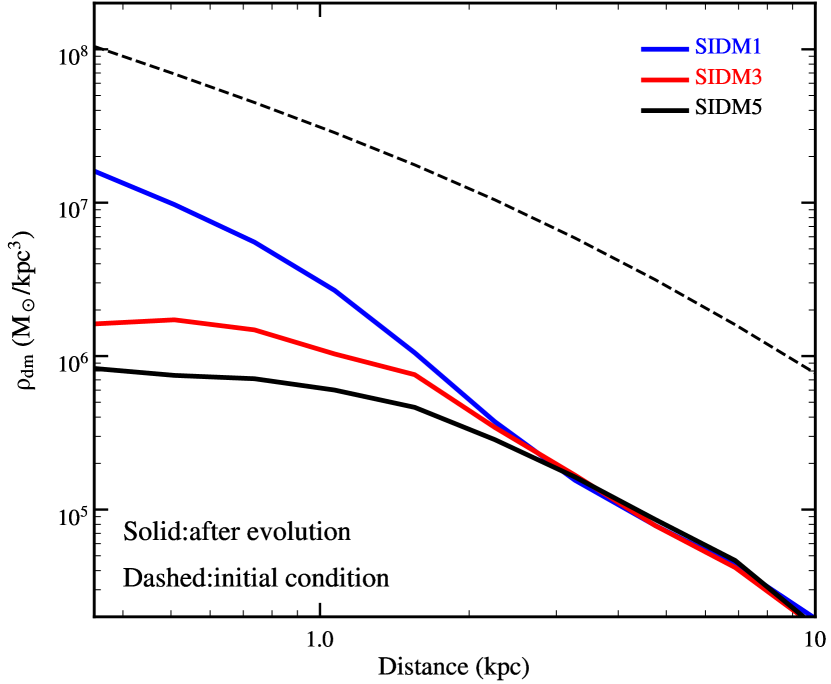
Fig. 2 shows dark matter density profiles at for the CDM (left) and SIDM (right) models, together with their initial conditions. All the haloes experience severe mass loss due to the tidal stripping from the host potential and the significance of tidal interactions is more prominent if the concentration is lower or the SIDM cross section is larger. The CDM haloes still retain their inner cuspy structure after tidal evolution (Kazantzidis et al., 2004; Peñarrubia et al., 2008). This is true even for the halo with the lowest concentration in our simulations (), which is below the median of the relation (Dutton & Macciò, 2014). For the SIDM haloes, density cores form and the core size increases with the self-scattering cross section (Sameie et al., 2020).
3.2 Line-of-sight velocity dispersion profiles
The observed LoS velocity dispersion of Antlia 2 provides an important test for our simulations. A fair comparison requires a good understanding of selection criteria for the stellar members. Torrealba et al. (2019) selected spectroscopic members of Antlia 2 having the best measurements of radial velocities with uncertainties better than for their kinematic analysis; see their Table 2. All the star members fall inside an on-the-sky distance of . The velocity distribution of the spectroscopic members has a peak at , which is the bulk velocity of Antlia 2, and a spread of . They used a foreground model that excludes star members with radial velocities higher or lower than this limit as foreground contamination.
We select simulated stars within a 2D projected distance of to be consistent with Torrealba et al. (2019). Fig. 3 shows distributions of LoS velocities for the CDM and SIDM simulations, after imposing a loose velocity cut and a tight cut , together with the distribution of observed spectroscopic members from Torrealba et al. (2019). With the loose velocity cut, the stellar velocity distributions of the simulated galaxies reveal two side peaks, which are remnants of the tidal debris of stellar particles in our simulations. The peaks are higher for the haloes with lower initial or higher , as their potentials are shallower and stellar orbits are more likely to be tidally disturbed. Our tight velocity cut removes some of the remnants and the resulting velocity distributions of stars show good agreement with the observations.
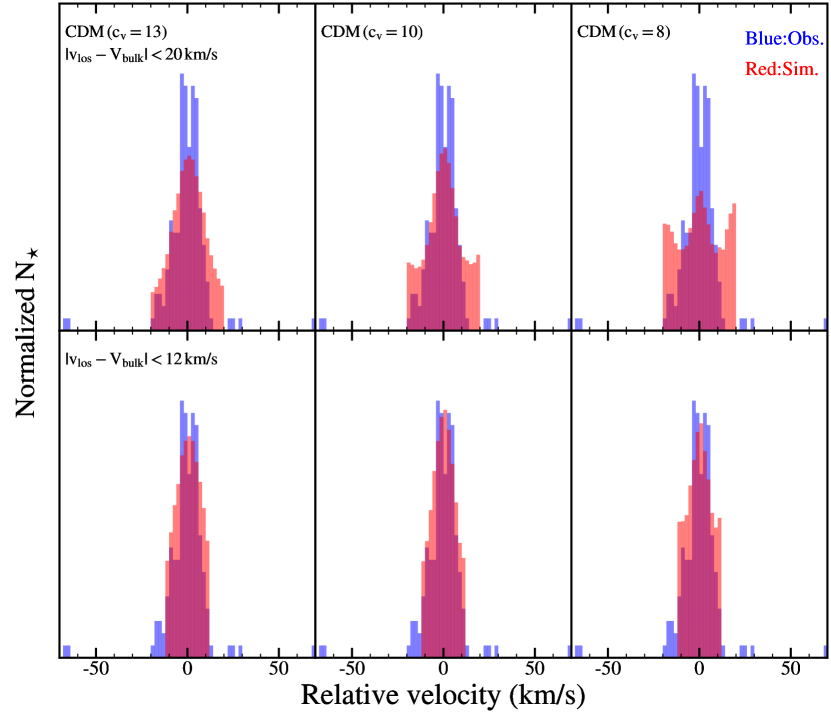
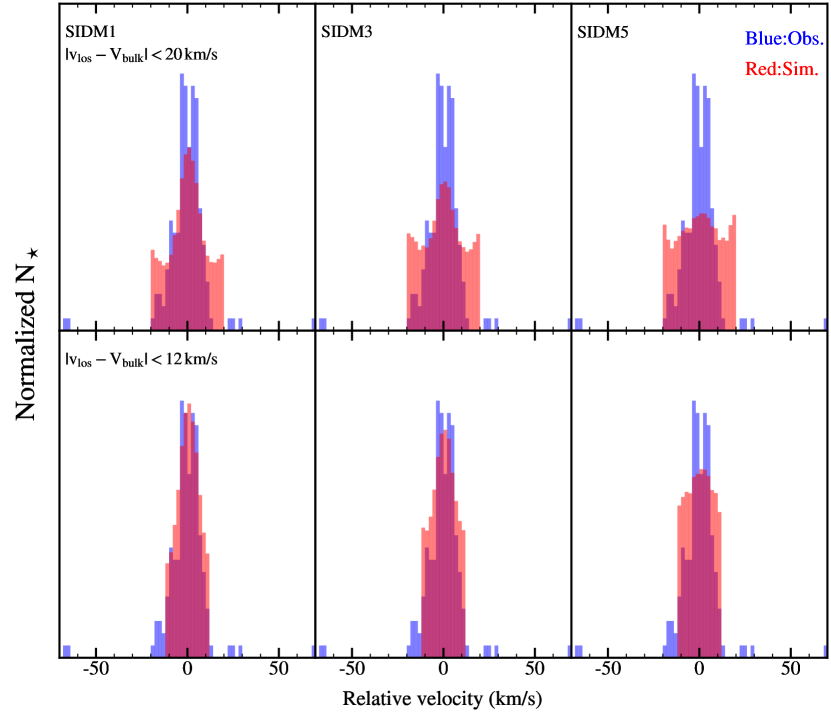
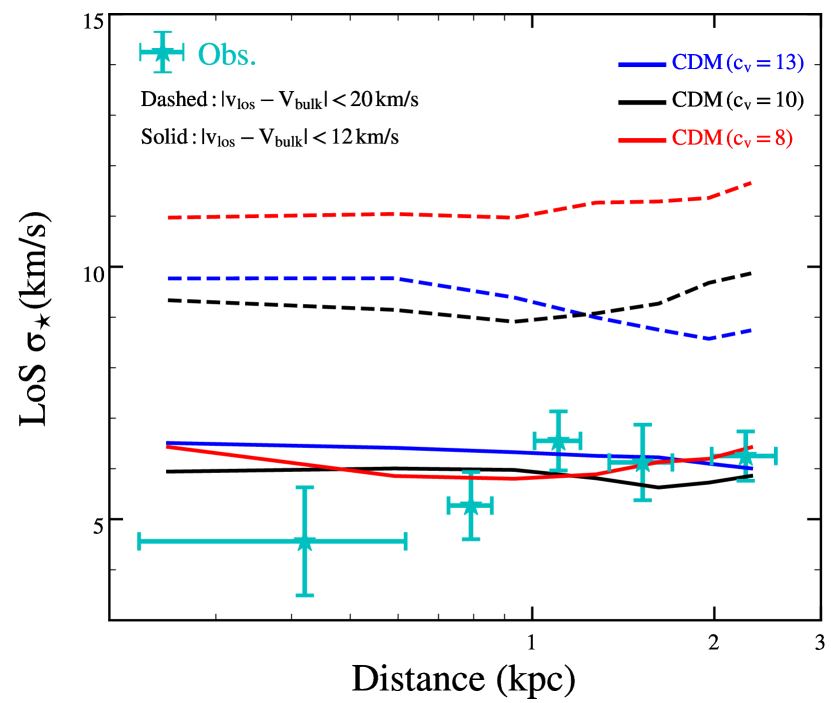
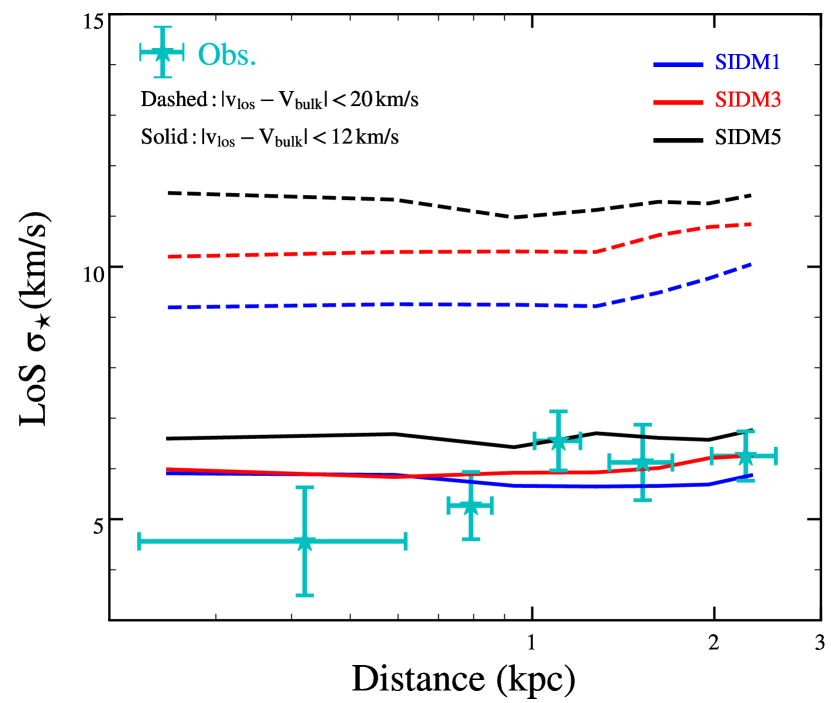
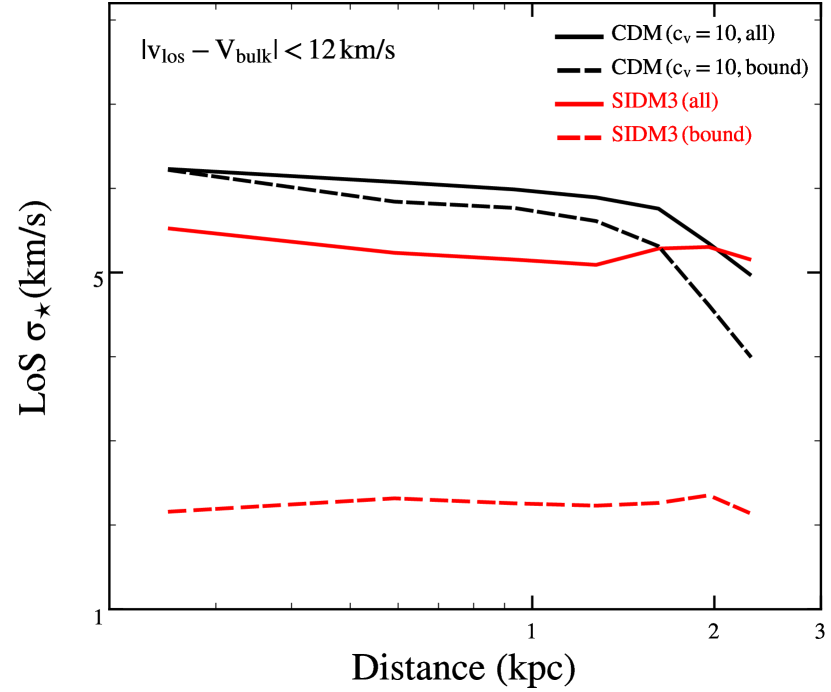
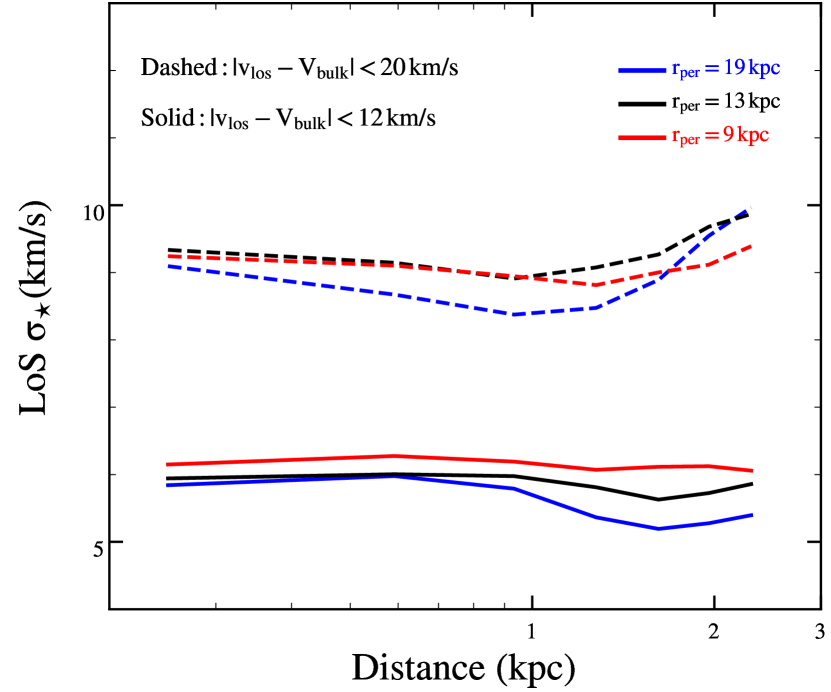
Fig. 4 shows LoS velocity dispersion profiles for our CDM (left) and SIDM (right) simulations with the two velocity cuts, as well as the observed profile computed using the data compiled in Torrealba et al. (2019). It is clear that relaxing the cut leads to a significant increase in the velocity dispersion. The effect is more prominent for lower initial or larger , as expected. This is also consistent with the results shown in Fig. 3, i.e., the cut reveals tidal debris structures in the stellar velocity distribution, and the galaxies with lower or larger have a relatively higher fraction of stellar particles on the tidal tail. Future observations of the tidal debris of Antlia 2 would provide a means of testing those models.
We see that with the tight cut all the simulated galaxies reproduce consistently the observed LoS velocity distribution, although their dark matter densities inside a few radii are different, as indicated in Fig. 2. In fact, the resulting LoS profiles are remarkably similar; they are flat toward the center with little variation. It seems hard to use the measured LoS velocity dispersion of Antlia 2 to discriminate between the CDM and SIDM models in this work, because the simulated galaxies are tidally disturbed and their stellar particles do not provide a faithful tracer for the local mass distribution.
| Name | ) | ||
|---|---|---|---|
| Antlia 2 | |||
| CDM(=13) | 2.4 | 2.6e6 | 1.2e8 |
| CDM(=10) | 2.7 | 1.6e6 | 6.0e7 |
| CDM(=8) | 2.9 | 9.5e5 | 3.2e7 |
| SIDM1 | 2.8 | 1.4e6 | 5.4e7 |
| SIDM3 | 3.0 | 1.0e6 | 3.7e7 |
| SIDM5 | 3.2 | 9.6e5 | 3.3e7 |
3.3 Stellar distributions and dynamical masses
For each simulated galaxy, we compute its stellar half-mass radius and mass including all stars inside of radius that pass the tight velocity cut and the results are summarized in Table 1. We see that expands relative to its initial value (), and the galaxies with shallower dark matter profiles, either lower or higher , have more diffuse stellar distributions after tidal evolution (Errani et al., 2015; Dooley et al., 2016; Yang et al., 2020). It is also evident that the stars expand more significantly in SIDM than CDM, as the CDM halo retains its density cusp even if its concentration is as low as ; see Fig. 2. All of our simulated galaxies have diffuse stellar distributions and their values are in good agreement with the observed half-light radius of Antlia 2, (Torrealba et al., 2019) within the errors. Overall, our SIDM models match the observations slightly better than their CDM counterparts. It is important to note that for the halo mass we consider, our initial is already on the higher end of the stellar distribution predicted in simulations with realistic baryonic feedback (Lazar et al., 2020). If the initial is smaller, SIDM would be more favored to reproduce Antlia 2’s low surface brightness.
We compute the total stellar mass inside a radius of ; see Table 1. The stellar mass decreases as the halo concentration decreases or the cross section increases, as expected. All of the galaxies have comparable to Antlia 2’s (Torrealba et al., 2019) within a factor of two, and the models with lower or larger agree better with the data. If we choose a smaller stellar mass at the infall time, the resulting would match the observed value closer. On the other hand, there could be additional uncertainties associated with the stellar mass measurements (Simon, 2019; Applebaum et al., 2020). Keeping those considerations in mind, we find the comparison to the stellar mass of Antlia 2 favors an under-dense halo. In addition, we have checked that the simulated stellar distributions can be well fitted by a Plummer profile and the relation holds for our simulated galaxies to be better than (see also Gonz lez-Samaniego et al., 2017; Campbell et al., 2017).
In Table 1, we also list the dynamical mass within for each simulated galaxy, computed from our simulations directly. There is a clear trend that is reduced as decreases or increases. Torrealba et al. (2019) estimated the dynamical mass of Antlia 2 enclosed within a sphere of radius as . It is based on the mass estimator (Walker et al., 2009), where and is the overall LoS of Antlia 2. The mass estimator assumes that the stars follow a Plummer profile, which is a good approximation for our galaxies. Taking the average values, and , we apply the estimator to our galaxies and find , in good agreement with the estimated one for Antlia 2.
However, compared to the results directly from our simulations, the mass estimator underestimates the dynamical mass for the CDM halo with by a factor of , while overestimates it for SIDM5 by the same factor. As shown in Fig. 4, all the galaxies have approximately the same LoS profile after the tight velocity cut. For the CDM halo (), our cut removes stellar particles on the high velocity tail, resulting in relatively low ; see Fig. 3 (left). If we were taking from the loose cut, the agreement would be much better for the CDM halo. On the other hand, SIDM5 has the shallowest potential and its stellar orbits are disturbed most significantly, leading to LoS much higher than that expected without the tidal effects. The discrepancy is not surprising, because the mass estimator is based on Jeans modeling, which assumes a system in dynamical equilibrium, but SIDM5 is least equilibrated among the six simulated galaxies.
3.4 Bound vs. unbound stellar particles
All dark matter and stellar particles are gravitationally bound to the simulated satellites at by construction, while subsequent tidal interactions with the host potential will unbind significant amounts of mass. Loosely bound or unbound particles are more frequently stripped at outer radii of the galaxies. In computing the LoS velocity dispersion shown previously, we did not exclude the unbound stellar particles, because from the observational perspective it is not possible to single out unbound stars. It is interesting to check how the LoS velocity dispersion profile change if we only include bound stellar particles.
Fig. 5 (left) shows LoS profiles for the CDM model with and the SIDM3 model around when the unbound particles are included or excluded, where we adopt the tight velocity cut, . Interestingly, ignoring the contribution from the unbound particles only slightly decreases the LoS velocity dispersion in the CDM model, while in the SIDM3 model it reduces by more than a factor of two. This is because the latter has a shallower gravitational potential and most of stellar particles become unbound after tidal evolution. Thus, we expect to see more tidal streams in the SIDM models.
3.5 Impact of different pericenters
After sampling observed errors of the Gaia DR-2 proper motions, Chakrabarti et al. (2019) derived an orbital distribution for the Antlia 2 galaxy. The resulting pericenter is in the range of , with a median around for a typical mass for the Milky Way halo. The orbit that we have chosen has a pericenter of . It is interesting to investigate how our results change if we choose other orbits from this orbital distribution.
We focus on the impacts on the LoS velocity dispersion and perform two additional simulations for the CDM model with . The corresponding orbits have pericenters of and , which are within of the orbital distribution derived from Gaia DR-2 data (Chakrabarti et al., 2019). Fig. 5 (right) shows the LoS stellar velocity dispersion for the three orbits for the CDM model with . The LoS profiles change very mildly with the pericenter for the CDM model. It would be interesting to explore the impact of different pericenters on SIDM haloes.
4 Conclusions
We have performed N-body simulations to model the recently discovered Antlia 2 galaxy. The simulation suite consists of three CDM haloes with halo concentrations and , and three SIDM haloes with and and . The simulated dwarf galaxies start with an NFW and Plummer profiles for their dark matter and stellar components, respectively, with well-motivated model parameters. Our main findings are:
-
•
After of tidal evolution, the CDM haloes remain cuspy in the inner regions even if the initial concentration is as low as , while the SIDM haloes develop dark matter density cores and their sizes increase with the cross section.
-
•
The Milky Way’s tidal field strips most of the dark matter and star particles, resulting in significant tidal debris for the simulated galaxies. The stripping increases with decreasing or increasing . The stellar velocity distribution exhibits a feature of tidal “arms" (Fig. 3). If this is verified in the future observations of Antlia 2, it would serve as an important test of this scenario. In general, SIDM haloes predict more tidal debris than their CDM counterparts.
-
•
The simulated LoS velocity dispersion agrees with the observed one after imposing the tight cut, . All our simulated galaxies have similar stellar dispersion profiles, regardless the initial concentration and the self-scattering dark matter cross section.
-
•
The half-mass radius of the simulated galaxies expands after tidal evolution. The haloes with less dense central densities, either due to low or high , allow the stellar distribution to become more diffuse, and the stellar mass decreases accordingly; see Table 1. Our results indicate Antlia 2 has an under-dense progenitor.
-
•
Similar to the stellar mass, the dynamical mass within the half-mass radius, dominated by dark matter, also correlates with the initial halo concentration and the SIDM cross section. For a system with a shallow density profile, its stellar orbits can be significantly disturbed in the tidal field and the mass estimator based on the Jeans modeling can significantly overestimate its dynamical mass.
-
•
The simulated CDM galaxies contain more gravitationally bound stellar particles than their SIDM counterparts, as the former has a deeper potential. The velocity dispersion profile is insensitive to the pericenter for the CDM model that we have checked.
Considering the above observations, we find that Antlia 2 could be realized in both CDM and SIDM with well-motivated model parameters. In our simulations, we chose the initial stellar and halo masses using the mass-metallicity and abundance-matching relations, respectively, and adopted the stellar scale radius consistent with predictions from hydrodynamical simulations with realistic feedback prescriptions. We find that the initial halo concentration in CDM should be lower than the cosmological mean to be consistent with the observations of Antlia 2. In SIDM, core formation enhances the tidal mass loss for both dark matter and stars; it also enhances the expansion of the stellar distribution. SIDM, therefore, allows a higher halo concentration and a denser stellar distribution compared to CDM for models that match observations of Antlia 2. In this work, we used controlled simulations with a static host potential to study the key ingredients to realize Antlia 2-like galaxies. It would be of great interest to further explore this topic with cosmological hydrodynamical simulations.
Acknowledgements
We thank Volker Springel for providing Arepo for this work, Josh Simon and Ting Li for useful discussions. SC acknowledges support from NASA ATP NNX17AK90G, NSF AAG grant 1517488, and from Research Corporation for Scientific Advancement’s Time Domain Astrophysics Scialog. HBY acknowledges support from U.S. Department of Energy under Grant No. de-sc0008541, and NASA grant 80NSSC20K0566. MBK acknowledges support from NSF CAREER award AST-1752913, NSF grant AST-1910346, NASA grant NNX17AG29G, and HST-AR-15006, HST-AR-15809, HST-GO-15658, HST-GO-15901, and HST-GO-15902 from the Space Telescope Science Institute, which is operated by AURA, Inc., under NASA contract NAS5-26555. MV acknowledges support through an MIT RSC award, a Kavli Research Investment Fund, NASA ATP grant NNX17AG29G, NSF grants AST-1814053 and AST-1814259. JZ acknowledges support by a Grant of Excellence from the Icelandic Research Fund (grant number 173929).
References
- Applebaum et al. (2020) Applebaum E., Brooks A. M., Quinn T. R., Christensen C. R., 2020, MNRAS, 492, 8
- Arkani-Hamed et al. (2009) Arkani-Hamed N., Finkbeiner D. P., Slatyer T. R., Weiner N., 2009, Phys. Rev. D, 79, 015014
- Behroozi et al. (2013) Behroozi P. S., Wechsler R. H., Conroy C., 2013, ApJ, 770, 57
- Benitez-Llambay & Frenk (2020) Benitez-Llambay A., Frenk C., 2020, arXiv e-prints, p. arXiv:2004.06124
- Boylan-Kolchin et al. (2013) Boylan-Kolchin M., Bullock J. S., Sohn S. T., Besla G., van der Marel R. P., 2013, ApJ, 768, 140
- Bullock & Boylan-Kolchin (2017) Bullock J. S., Boylan-Kolchin M., 2017, ARA&A, 55, 343
- Bullock et al. (2010) Bullock J. S., Stewart K. R., Kaplinghat M., Tollerud E. J., Wolf J., 2010, ApJ, 717, 1043
- Campbell et al. (2017) Campbell D. J. R., et al., 2017, Monthly Notices of the Royal Astronomical Society, 469, 2335?2360
- Chakrabarti & Blitz (2009) Chakrabarti S., Blitz L., 2009, MNRAS, 399, L118
- Chakrabarti & Blitz (2011) Chakrabarti S., Blitz L., 2011, ApJ, 731, 40
- Chakrabarti et al. (2019) Chakrabarti S., Chang P., Price-Whelan A. M., Read J., Blitz L., Hernquist L., 2019, ApJ, 886, 67
- Chan et al. (2015) Chan T. K., Kereš D., Oñorbe J., Hopkins P. F., Muratov A. L., Faucher-Giguère C. A., Quataert E., 2015, MNRAS, 454, 2981
- Creasey et al. (2017) Creasey P., Sameie O., Sales L. V., Yu H.-B., Vogelsberger M., Zavala J., 2017, MNRAS, 468, 2283
- Deason et al. (2019) Deason A. J., Belokurov V., Sanders J. L., 2019, MNRAS, 490, 3426
- Dooley et al. (2016) Dooley G. A., Peter A. H. G., Vogelsberger M., Zavala J., Frebel A., 2016, Mon. Not. Roy. Astron. Soc., 461, 710
- Dubinski & Carlberg (1991) Dubinski J., Carlberg R., 1991, Astrophys. J., 378, 496
- Dutton & Macciò (2014) Dutton A. A., Macciò A. V., 2014, MNRAS, 441, 3359
- Errani et al. (2015) Errani R., Penarrubia J., Tormen G., 2015, MNRAS, 449, L46
- Feng et al. (2009) Feng J. L., Kaplinghat M., Tu H., Yu H.-B., 2009, J. Cosmology Astropart. Phys., 2009, 004
- Fitts et al. (2017) Fitts A., et al., 2017, MNRAS, 471, 3547
- Fitts et al. (2019) Fitts A., et al., 2019, MNRAS, 490, 962
- Fritz et al. (2018) Fritz T. K., Battaglia G., Pawlowski M. S., Kallivayalil N., van der Marel R., Sohn S. T., Brook C., Besla G., 2018, A&A, 619, A103
- Gaia Collaboration (2018) Gaia Collaboration 2018, A&A, 616, A1
- Garrison-Kimmel et al. (2013) Garrison-Kimmel S., Rocha M., Boylan-Kolchin M., Bullock J. S., Lally J., 2013, MNRAS, 433, 3539
- Gonz lez-Samaniego et al. (2017) Gonz lez-Samaniego A., Bullock J. S., Boylan-Kolchin M., Fitts A., Elbert O. D., Hopkins P. F., Kere D., Faucher-Gigu re C.-A., 2017, Monthly Notices of the Royal Astronomical Society, 472, 4786?4796
- Governato et al. (2010) Governato F., et al., 2010, Nature, 463, 203
- Hernquist (1990) Hernquist L., 1990, ApJ, 356, 359
- Kahlhoefer et al. (2019) Kahlhoefer F., Kaplinghat M., Slatyer T. R., Wu C.-L., 2019, J. Cosmology Astropart. Phys., 2019, 010
- Kamada et al. (2017) Kamada A., Kaplinghat M., Pace A. B., Yu H.-B., 2017, Phys. Rev. Lett., 119, 111102
- Kaplinghat et al. (2016) Kaplinghat M., Tulin S., Yu H.-B., 2016, Phys. Rev. Lett., 116, 041302
- Kazantzidis et al. (2004) Kazantzidis S., Kravtsov A. V., Zentner A. R., Allgood B., Nagai D., Moore B., 2004, ApJ, 611, L73
- Kirby et al. (2013) Kirby E. N., Cohen J. G., Guhathakurta P., Cheng L., Bullock J. S., Gallazzi A., 2013, ApJ, 779, 102
- Koda et al. (2015) Koda J., Yagi M., Yamanoi H., Komiyama Y., 2015, Astrophys. J. Lett., 807, L2
- Lazar et al. (2020) Lazar A., et al., 2020, arXiv e-prints, p. arXiv:2004.10817
- Levine et al. (2006) Levine E. S., Blitz L., Heiles C., 2006, Science, 312, 1773
- Loeb & Weiner (2011) Loeb A., Weiner N., 2011, Phys. Rev. Lett., 106, 171302
- Moster et al. (2013) Moster B. P., Naab T., White S. D. M., 2013, MNRAS, 428, 3121
- Navarro et al. (1997) Navarro J. F., Frenk C. S., White S. D. M., 1997, ApJ, 490, 493
- Okamoto et al. (2008) Okamoto T., Gao L., Theuns T., 2008, MNRAS, 390, 920
- Peñarrubia et al. (2008) Peñarrubia J., Navarro J. F., McConnachie A. W., 2008, ApJ, 673, 226
- Peñarrubia et al. (2010) Peñarrubia J., Benson A. J., Walker M. G., Gilmore G., McConnachie A. W., Mayer L., 2010, MNRAS, 406, 1290
- Plummer (1911) Plummer H. C., 1911, MNRAS, 71, 460
- Posti & Helmi (2019) Posti L., Helmi A., 2019, A&A, 621, A56
- Read & Gilmore (2005) Read J. I., Gilmore G., 2005, Mon. Not. Roy. Astron. Soc., 356, 107
- Ren et al. (2019) Ren T., Kwa A., Kaplinghat M., Yu H.-B., 2019, Physical Review X, 9, 031020
- Sameie et al. (2020) Sameie O., Yu H.-B., Sales L. V., Vogelsberger M., Zavala J., 2020, Phys. Rev. Lett., 124, 141102
- Santos-Santos et al. (2018) Santos-Santos I. M., Di Cintio A., Brook C. B., Macciò A., Dutton A., Domínguez-Tenreiro R., 2018, MNRAS, 473, 4392
- Simon (2019) Simon J. D., 2019, ARA&A, 57, 375
- Spergel & Steinhardt (2000) Spergel D. N., Steinhardt P. J., 2000, Phys. Rev. Lett., 84, 3760
- Springel (2010) Springel V., 2010, MNRAS, 401, 791
- Torrealba et al. (2019) Torrealba G., et al., 2019, MNRAS, 488, 2743
- Tulin & Yu (2018) Tulin S., Yu H.-B., 2018, Phys. Rep., 730, 1
- Tulin et al. (2013) Tulin S., Yu H.-B., Zurek K. M., 2013, Phys. Rev. D, 87, 115007
- Valli & Yu (2018) Valli M., Yu H.-B., 2018, Nature Astron., 2, 907
- Vogelsberger et al. (2012) Vogelsberger M., Zavala J., Loeb A., 2012, MNRAS, 423, 3740
- Vogelsberger et al. (2016) Vogelsberger M., Zavala J., Cyr-Racine F.-Y., Pfrommer C., Bringmann T., Sigurdson K., 2016, MNRAS, 460, 1399
- Vogelsberger et al. (2019) Vogelsberger M., Zavala J., Schutz K., Slatyer T. R., 2019, MNRAS, 484, 5437
- Walker et al. (2009) Walker M. G., Mateo M., Olszewski E. W., Peñarrubia J., Evans N. W., Gilmore G., 2009, ApJ, 704, 1274
- Watkins et al. (2019) Watkins L. L., van der Marel R. P., Sohn S. T., Evans N. W., 2019, ApJ, 873, 118
- Wheeler et al. (2019) Wheeler C., et al., 2019, MNRAS, 490, 4447
- Wolf et al. (2010) Wolf J., Martinez G. D., Bullock J. S., Kaplinghat M., Geha M., Muñoz R. R., Simon J. D., Avedo F. F., 2010, MNRAS, 406, 1220
- Yang et al. (2020) Yang D., Yu H.-B., An H., 2020, arXiv e-prints, p. arXiv:2002.02102
- Zavala et al. (2013) Zavala J., Vogelsberger M., Walker M. G., 2013, MNRAS, 431, L20
- de Blok (2010) de Blok W., 2010, Adv. Astron., 2010, 789293