Quantification of the Chiral Magnetic Effect in Au+Au collisions at GeV
Abstract
The Multi-Phase Transport model, AMPT, and the Anomalous Viscous Fluid Dynamics model, AVFD, are used to assess a possible chiral-magnetically-driven charge separation () recently measured with the correlator in Au+Au collisions at GeV. The Comparison of the experimental and simulated distributions indicates that background-driven charge separation is insufficient to account for the measurements. The AVFD model calculations, which explicitly account for CME-driven anomalous transport in the presence of background, indicate a CME signal quantified by the -odd Fourier dipole coefficient in mid-central collisions. A similar evaluation for the correlator suggests that only a small fraction of this signal () is measurable with this correlator in the same collisions. The related prediction for signal detection in isobaric collisions of Ru+Ru and Zr+Zr are also presented.
pacs:
25.75.-q, 25.75.Gz, 25.75.LdHeavy-ion collisions at the Relativistic Heavy Ion Collider (RHIC) and the Large Hadron Collider (LHC) lead to the production of a magnetized chiral relativistic quark-gluon plasma (QGP) Kharzeev (2006); Liao (2015); Miransky and Shovkovy (2015); Huang (2016); Kharzeev et al. (2016), akin to the primordial plasma produced in the early Universe Rogachevskii et al. (2017); Rubakov and Gorbunov (2017) and several degenerate forms of matter found in compact stars Weber (2005). Pseudo-relativistic analogs include Dirac and Weyl semimetals Vafek and Vishwanath (2014); Burkov (2015); Gorbar et al. (2018). The study of anomalous transport in the QGP can give fundamental insight not only on the complex interplay of chiral symmetry restoration, axial anomaly and gluon topologyMoore and Tassler (2011); Mace et al. (2016); Liao et al. (2010); Kharzeev et al. (2016); Koch et al. (2017), but also on the evolution of magnetic fields in the early Universe Joyce and Shaposhnikov (1997); Tashiro et al. (2012).
A major anomalous process predicted to occur in the magnetized QGP is the chiral magnetic effect (CME) Fukushima et al. (2008). It is characterized by the vector current:
| (1) |
where is the color factor, is the magnetic field and is the axial chemical potential that quantifies the axial charge asymmetry or imbalance between right- and left-handed quarks in the plasma Fukushima et al. (2008); Son and Surowka (2009); Zakharov (2012); Fukushima (2013). Experimentally, the CME manifests as the separation of electrical charges along the -field Kharzeev (2006); Fukushima et al. (2008). This stems from the fact that the CME preferentially drives charged particles, originating from the same “P-odd domain”, along or opposite to the -field depending on their charge.
The charge separation can be quantified via measurements of the first -odd sine term , in the Fourier decomposition of the charged-particle azimuthal distribution Voloshin (2004):
| (2) |
where gives the particle azimuthal angle with respect to the reaction plane () angle, and and denote the coefficients of the -even and -odd Fourier terms, respectively. A direct measurement of the P-odd coefficients , is not possible due to the strict global and symmetry of QCD. However, their fluctuation and/or variance can be measured with charge-sensitive correlators such as the -correlator Voloshin (2004) and the correlator Magdy et al. (2017, 2018); Huang et al. (2019); Magdy et al. (2020).
The -correlator measures charge separation as:
where is the azimuthal angle of the event plane, denote the particle azimuthal emission angles, denote the electric charge or and SS and OS represent same-sign () and opposite-sign () charges.
The correlator Magdy et al. (2017, 2018) is constructed for the -order event plane , as the ratio:
| (3) |
where and are correlation functions that quantify charge separation , parallel and perpendicular (respectively) to the -field. measures both CME- and background-driven charge separation while measures only background-driven charge separation. The absence of a strong correlation between the orientation of the plane and the -field, also renders and insensitive to a CME-driven charge separation, but not to the background, so it can give additional insight into the relative importance of background-driven and CME-driven charge separation Magdy et al. (2017, 2018).
Recently, the STAR collaboration reported new charge separation measurements for the correlator, which suggested a possible CME-driven charge separation in Au+Au collisions 179 (2020). Here, we use the AMPT Lin et al. (2005) and AVFD Shi et al. (2018); Jiang et al. (2018) models with varying degrees of charge separation, characterized by the dipole term , to calibrate the correlator and extract an estimate of the magnitude of the suggested CME signal. We also use the AVFD model to calibrate the correlators for isobaric collisions (Ru+Ru and Zr+Zr) and estimate the magnitude of a possible signal for each isobar and the signal and background differences between them. Both models are known to give good representations of the experimentally measured particle yields, spectra, flow, etc.,Lin et al. (2005); Ma and Lin (2016); Ma (2013, 2014); Bzdak and Ma (2014); Heinz et al. (2017). Thus, they include realistic estimates for several backgrounds such as flow and flow fluctuations, resonance decays, local charge conservation, and global momentum conservation. They also provide an important benchmark for evaluating the interplay between possible CME- and background-driven charge separation in actual data.
Anomalous transport due to the CME is explicitly implemented in the AVFD model. An in-depth account of this implementation can be found in Refs. Shi et al. (2018) and Jiang et al. (2018). In brief, the second-generation Event-by-Event version of the model, called E-by-E AVFD, uses Monte Carlo Glauber initial conditions to simulate the evolution of fermion currents in the QGP, in concert with the bulk fluid evolution implemented in the VISHNU hydrodynamic code, followed by a URQMD hadron cascade stage. A time-dependent magnetic field , acting in concert with a nonzero initial axial charge density , is used to generate a CME current (embedded in the fluid dynamical equations), leading to a charge separation along the magnetic field. The peak values , obtained from event-by-event simulations Bloczynski et al. (2013), are used with a relatively conservative lifetime fm/c. The commonly used estimate based on the strong chromo-electromagnetic fields in the early-stage glasma is adopted for the initial axial charge density arising from gluonic topological charge fluctuations. The anomalous transport in AVFD results in primordial charge separations on the freeze-out surface and final-state charge separation of the produced hadrons, quantified by the -odd Fourier coefficients and respectively. Note that due to smearing and dilution from resonance feed-down in the hadronic phase. The signal loss, relative to , is about 30% for Au+Au collisions Shi et al. (2018).
Anomalous transport from the CME is not implemented in AMPT. Instead, modifications have been made to the model to mimic CME-induced charge separation in the partonic phase Ma and Zhang (2011). This is accomplished by switching the values of a fraction of the downward moving () quarks with those of the upward moving () quarks to produce a net charge-dipole separation. Here, the axis is along the direction of the impact parameter , the axis points along the beam direction, and the axis is perpendicular to the plane, i.e, the direction of the proxy -field. The strength of this proxy “primordial” charge separation is regulated by the fraction Ma and Zhang (2011); Huang et al. (2019):
| (4) |
where is the number of a given species of quarks, and denote positive and negative charges, respectively, and and represent the directions along and opposite to that of the axis.
The fraction , is related to the -odd dipole coefficient for the produced hadrons (cf. Eqs. 2 and 4). However, the “partonic” dipole coefficient has a different relationship to the final hadrons’ , than that for AVFD and other models Jiang et al. (2018); Shi et al. (2018); Sun and Ko (2018). A comparison of the models for Au+Au collisions at GeV indicates that and are approximately linearly related, and the events for both models give the same correlator response for . This factor reflects the fact that the signal loss in AMPT, due to parton cascade and resonance feed-down Ma and Zhang (2011), is much larger than that for AVFD. Because CME-driven anomalous transport is explicit in the AVFD model, we use , and as quantitative measures in the following.
Simulated AMPT and AVFD events, generated for a broad set of values, were analyzed with both the and the correlators to facilitate the calibrations necessary for estimating the magnitude of a possible CME-driven signal from the measurements. Event selections and cuts included charged particles with and transverse momentum GeV/. To enhance the statistical significance of the AMPT events, the plane was determined with charged hadrons in the range . The charge separation of charged hadrons for was then measured relative to .
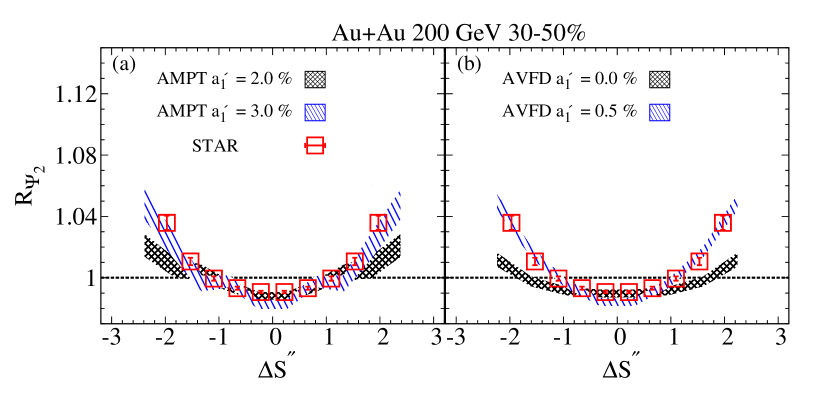
Figure 1 shows a representative comparison between the experimental distribution (open squares) and those simulated with AMPT (a) and AVFD (b) events for central Au+Au collisions. In these plots, the charge separation is scaled () to account for the effects of particle-number fluctuations and the event-plane resolution Magdy et al. (2017). The magnitude of the charge separation is encoded in the variance (or width ) of the concave-shaped distribution Magdy et al. (2017, 2018, 2020).
The simulated distributions for (panel a) and (panel b) show good agreement with the data. By contrast, the distributions simulated for (background only) do not agree with the data, as shown in Fig. 1 (b). This disagreement indicates that background-driven charge separation alone is insufficient to account for the measurement. Here, it is noteworthy that the background-driven charge separation for AVFD is constrained by ensuring good agreement between the experimental and simulated distributions for or mean centrality . For such collisions, background-driven charge separation predominates over CME-driven charge separation due to the approximately random -field orientations relative to the event plane. The -independent distributions obtained with AVFD for the same centrality selection, confirms this expected insensitivity to the signal in peripheral collisions.
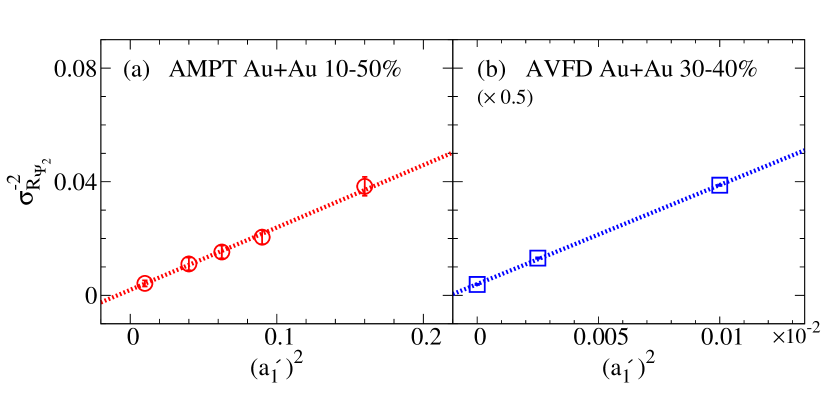
To further calibrate the signal strength, we extracted the variance of the distributions, obtained for several values of and in Au+Au collisions; the values correspond to the values of 0.0, 0.1 and 0.2 respectively. Figs. 2 (a) and (b) show representative plots of the inverse variance vs. for 10–50% central AMPT events (a) and 30–40% central AVFD events (b). Both calibration curves indicate an essentially linear dependence of on (note the dotted lines of best fit), albeit with slope differences that reflect the observation that for similar response at the same centrality. The relatively small associated intercepts in Figs. 2 (a) and (b), indicate an influence from background-driven charge separation, possibly dominated by the effects of local charge conservation.
The comparison of the Au+Au data to the AVFD calibration curve in Fig. 2 (b) indicates the value % for mid-central collisions. This value, which corresponds to , is similar to the estimate obtained from the comparison between the experimental and simulated distributions (cf. Fig. 1 (b)). The inverse variances for % and % also allow evaluation of the fraction of attributable to the CME as:
This sizable value is a good benchmark for the sensitivity of the correlator to CME-driven charge separation in these collisions.
The AMPT and AVFD events used to calibrate the correlator were also employed to calibrate the correlator and predict the magnitude of the CME-driven signal strength expected from its measurements. The calibration procedure involving the analysis of AMPT and AVFD events with varying degrees of the signal is similar to that for the correlator.
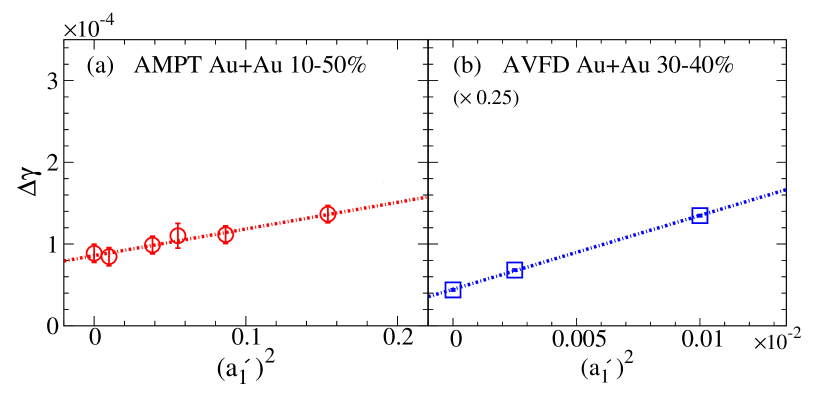
Figures 3 (a) and (b) show the resulting calibration curves [ vs. )] obtained for AMPT and AVFD events, respectively. Both plots indicate the expected linear dependence of on [note the dotted lines of best fit]. However, the non-negligible intercepts indicate significant background contributions to the values for . The slopes of the calibration curves also reflect the signal losses Ma and Zhang (2011); Huang et al. (2019) alluded to earlier. The steeper slope for AVFD events, apparent in Fig. 3 (b), is also in line with the hierarchy of more significant signal losses for AMPT events than for AVFD events.
For the value [extracted with the correlator] and its AMPT equivalent, Figs. 3 (a) and (b) indicate that the fraction of the value attributable to the CME,
This value is consistent with the recent measurements reported in Ref. Adam et al. (2020), albeit with sizable uncertainties. It is also roughly a factor of three times smaller than , suggesting that the correlator is more sensitive for this signal level Sun and Ko (2018); Huang et al. (2019); Shi et al. (2020).
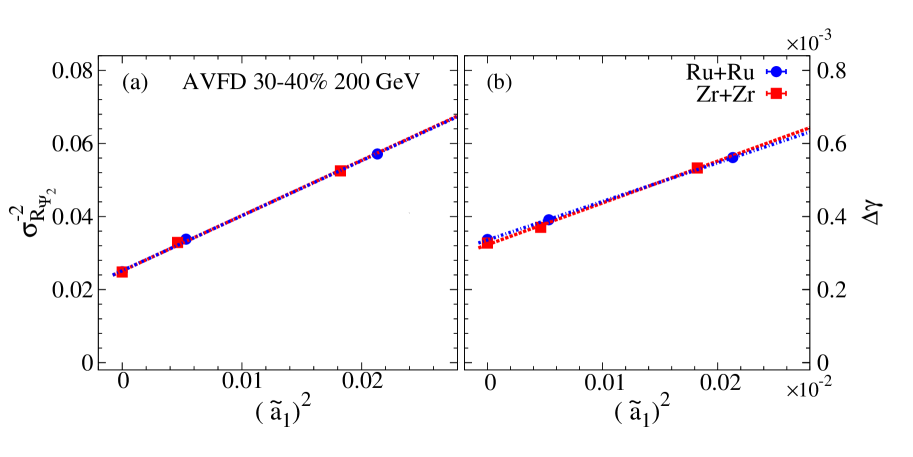
The AVFD model was also used to calibrate the and correlators and predict the magnitude of the CME-driven signal strength expected in isobaric collisions of Ru+Ru and Zr+Zr at GeV. The calibration, which followed the procedure outlined earlier, involved the analysis of 30-40% central AVFD events for the same values employed in the Au+Au simulations i.e., and respectively.
Figures 4 (a) and (b) show the respective calibration curves for the isobaric collisions. Both plots indicate the expected linear dependence of and on with signal differences [between the isobars] that depend on the magnitude of . The plotted values for the latter correspond to and respectively. The non-negligible intercepts, also apparent in the figures, indicate significant background contributions to both and for . These contributions are reflected in the values and evaluated for the isobars for . They indicate that the sensitivity of both correlators is significantly reduced compared to that for Au+Au collisions simulated for , albeit with an approximate factor of two difference between and . This difference suggests that, for the 30-40% isobaric collisions, background-driven charge separation already begins to prevail over CME-driven charge separation. More central collisions might be needed to achieve better sensitivity. Note that the background dominates in peripheral Au+Au collisions but not in mid-central collisions.
The isobaric signal difference is shown in Figs. 4 (a) and (b); for it is much smaller than the respective signal magnitude for each isobar, relative to the background, and will require substantial statistical significance to measure. Therefore, CME characterization in these collisions will benefit significantly from the planned measurements of the respective signal magnitude for each isobar, in addition to measurements of the isobaric signal and background differences.
In summary, AVFD model simulations that incorporate varying degrees of CME- and background-driven charge separation are used to quantify a possible chiral-magnetically-driven charge separation measured with the correlator in Au+Au collisions at GeV. The simulations which quantify the CME via the -odd Fourier dipole coefficient indicate the value % in mid-central collisions, consistent with a modest CME signal. A similar calibration for the correlator suggests that, only a small fraction of this signal () is measurable with the correlator in the same collisions. A further calibration for isobaric collisions of Ru+Ru and Zr+Zr, suggests that CME characterization in these collisions not only require measurement of the isobaric signal difference, but also the respective signal magnitude for each isobar and an estimate of the background difference between them.
Acknowledgments
Acknowledgements.
This research is supported by the US Department of Energy, Office of Science, Office of Nuclear Physics, under contracts DE-FG02-87ER40331.A008 (RL) and DE-FG02-94ER40865 (NM).References
- Kharzeev (2006) Dmitri Kharzeev, “Parity violation in hot QCD: Why it can happen, and how to look for it,” Phys. Lett. B633, 260–264 (2006), arXiv:hep-ph/0406125 .
- Liao (2015) Jinfeng Liao, “Anomalous transport effects and possible environmental symmetry ‘violation’ in heavy-ion collisions,” Pramana 84, 901–926 (2015), arXiv:1401.2500 [hep-ph] .
- Miransky and Shovkovy (2015) Vladimir A. Miransky and Igor A. Shovkovy, “Quantum field theory in a magnetic field: From quantum chromodynamics to graphene and Dirac semimetals,” Phys. Rept. 576, 1–209 (2015), arXiv:1503.00732 [hep-ph] .
- Huang (2016) Xu-Guang Huang, “Electromagnetic fields and anomalous transports in heavy-ion collisions — A pedagogical review,” Rept. Prog. Phys. 79, 076302 (2016), arXiv:1509.04073 [nucl-th] .
- Kharzeev et al. (2016) D. E. Kharzeev, J. Liao, S. A. Voloshin, and G. Wang, “Chiral magnetic and vortical effects in high-energy nuclear collisions—A status report,” Prog. Part. Nucl. Phys. 88, 1–28 (2016), arXiv:1511.04050 [hep-ph] .
- Rogachevskii et al. (2017) Igor Rogachevskii, Oleg Ruchayskiy, Alexey Boyarsky, Jürg Fröhlich, Nathan Kleeorin, Axel Brandenburg, and Jennifer Schober, “Laminar and turbulent dynamos in chiral magnetohydrodynamics-I: Theory,” Astrophys. J. 846, 153 (2017), arXiv:1705.00378 [physics.plasm-ph] .
- Rubakov and Gorbunov (2017) Valery A. Rubakov and Dmitry S. Gorbunov, Introduction to the Theory of the Early Universe (World Scientific, Singapore, 2017).
- Weber (2005) Fridolin Weber, “Strange quark matter and compact stars,” Prog. Part. Nucl. Phys. 54, 193–288 (2005), arXiv:astro-ph/0407155 [astro-ph] .
- Vafek and Vishwanath (2014) Oskar Vafek and Ashvin Vishwanath, “Dirac Fermions in Solids: From High-Tc cuprates and Graphene to Topological Insulators and Weyl Semimetals,” Ann. Rev. Condensed Matter Phys. 5, 83–112 (2014), arXiv:1306.2272 [cond-mat.mes-hall] .
- Burkov (2015) A. A. Burkov, “Chiral anomaly and transport in Weyl metals,” J. Phys. Condens. Matter 27, 113201 (2015), arXiv:1502.07609 [cond-mat.mes-hall] .
- Gorbar et al. (2018) E. V. Gorbar, V. A. Miransky, I. A. Shovkovy, and P. O. Sukhachov, “Anomalous transport properties of Dirac and Weyl semimetals (Review Article),” Low Temp. Phys. 44, 487–505 (2018), [Fiz. Nizk. Temp.44,635(2017)], arXiv:1712.08947 [cond-mat.mes-hall] .
- Moore and Tassler (2011) Guy D. Moore and Marcus Tassler, “The Sphaleron Rate in SU(N) Gauge Theory,” JHEP 02, 105 (2011), arXiv:1011.1167 [hep-ph] .
- Mace et al. (2016) M. Mace, S. Schlichting, and R. Venugopalan, “Off-equilibrium sphaleron transitions in the Glasma,” Phys. Rev. D93, 074036 (2016), arXiv:1601.07342 [hep-ph] .
- Liao et al. (2010) Jinfeng Liao, Volker Koch, and Adam Bzdak, “On the Charge Separation Effect in Relativistic Heavy Ion Collisions,” Phys. Rev. C82, 054902 (2010), arXiv:1005.5380 [nucl-th] .
- Koch et al. (2017) Volker Koch, Soeren Schlichting, Vladimir Skokov, Paul Sorensen, Jim Thomas, Sergei Voloshin, Gang Wang, and Ho-Ung Yee, “Status of the chiral magnetic effect and collisions of isobars,” Chin. Phys. C41, 072001 (2017), arXiv:1608.00982 [nucl-th] .
- Joyce and Shaposhnikov (1997) M. Joyce and Mikhail E. Shaposhnikov, “Primordial magnetic fields, right-handed electrons, and the Abelian anomaly,” Phys. Rev. Lett. 79, 1193–1196 (1997), arXiv:astro-ph/9703005 [astro-ph] .
- Tashiro et al. (2012) Hiroyuki Tashiro, Tanmay Vachaspati, and Alexander Vilenkin, “Chiral Effects and Cosmic Magnetic Fields,” Phys. Rev. D86, 105033 (2012), arXiv:1206.5549 [astro-ph.CO] .
- Fukushima et al. (2008) Kenji Fukushima, Dmitri E. Kharzeev, and Harmen J. Warringa, “The Chiral Magnetic Effect,” Phys. Rev. D78, 074033 (2008), arXiv:0808.3382 [hep-ph] .
- Son and Surowka (2009) Dam T. Son and Piotr Surowka, “Hydrodynamics with Triangle Anomalies,” Phys. Rev. Lett. 103, 191601 (2009), arXiv:0906.5044 [hep-th] .
- Zakharov (2012) Valentin I. Zakharov, “Chiral Magnetic Effect in Hydrodynamic Approximation,” (2012), 10.1007/978-3-642-37305-3-11, [Lect. Notes Phys.871,295(2013)], arXiv:1210.2186 [hep-ph] .
- Fukushima (2013) Kenji Fukushima, “Views of the Chiral Magnetic Effect,” Lect. Notes Phys. 871, 241–259 (2013), arXiv:1209.5064 [hep-ph] .
- Voloshin (2004) Sergei A. Voloshin, “Parity violation in hot QCD: How to detect it,” Phys. Rev. C70, 057901 (2004), arXiv:hep-ph/0406311 [hep-ph] .
- Magdy et al. (2017) Niseem Magdy, Shuzhe Shi, Jinfeng Liao, N. Ajitanand, and Roy A. Lacey, “A New Correlator to Detect and Characterize the Chiral Magnetic Effect,” (2017), arXiv:1710.01717 [physics.data-an] .
- Magdy et al. (2018) Niseem Magdy, Shuzhe Shi, Jinfeng Liao, Peifeng Liu, and Roy A. Lacey, “Examination of the observability of a chiral magnetically driven charge-separation difference in collisions of the and isobars at energies available at the BNL Relativistic Heavy Ion Collider,” Phys. Rev. C98, 061902 (2018), arXiv:1803.02416 [nucl-ex] .
- Huang et al. (2019) Ling Huang, Mao-Wu Nie, and Guo-Liang Ma, “Sensitivity analysis of the chiral magnetic effect observables using a multiphase transport model,” (2019), arXiv:1906.11631 [nucl-th] .
- Magdy et al. (2020) Niseem Magdy, Mao-Wu Nie, Guo-Liang Ma, and Roy A. Lacey, “A sensitivity study of the primary correlators used to characterize chiral-magnetically-driven charge separation,” (2020), arXiv:2002.07934 [nucl-ex] .
- 179 (2020) “Charge separation measurements in ()+Au and Au+Au collisions; implications for the chiral magnetic effect,” (2020), Note that the error recently found in the evaluation of has no impact on the data reported in 179 (2020) and employed in the present study., arXiv:2006.04251 .
- Lin et al. (2005) Zi-Wei Lin, Che Ming Ko, Bao-An Li, Bin Zhang, and Subrata Pal, “A Multi-phase transport model for relativistic heavy ion collisions,” Phys. Rev. C72, 064901 (2005), arXiv:nucl-th/0411110 [nucl-th] .
- Shi et al. (2018) Shuzhe Shi, Yin Jiang, Elias Lilleskov, and Jinfeng Liao, “Anomalous Chiral Transport in Heavy Ion Collisions from Anomalous-Viscous Fluid Dynamics,” Annals Phys. 394, 50–72 (2018), arXiv:1711.02496 [nucl-th] .
- Jiang et al. (2018) Yin Jiang, Shuzhe Shi, Yi Yin, and Jinfeng Liao, “Quantifying the chiral magnetic effect from anomalous-viscous fluid dynamics,” Chin. Phys. C42, 011001 (2018), arXiv:1611.04586 [nucl-th] .
- Ma and Lin (2016) Guo-Liang Ma and Zi-Wei Lin, “Predictions for TeV Pb+Pb Collisions from a Multi-Phase Transport Model,” Phys. Rev. C93, 054911 (2016), arXiv:1601.08160 [nucl-th] .
- Ma (2013) Guo-Liang Ma, “Decomposition of the jet fragmentation function in high-energy heavy-ion collisions,” Phys. Rev. C88, 021902 (2013), arXiv:1306.1306 [nucl-th] .
- Ma (2014) Guo-Liang Ma, “Medium modifications of jet shapes in Pb+Pb collisions at = 2.76 TeV within a multiphase transport model,” Phys. Rev. C89, 024902 (2014), arXiv:1309.5555 [nucl-th] .
- Bzdak and Ma (2014) Adam Bzdak and Guo-Liang Ma, “Elliptic and triangular flow in +Pb and peripheral Pb+Pb collisions from parton scatterings,” Phys. Rev. Lett. 113, 252301 (2014), arXiv:1406.2804 [hep-ph] .
- Heinz et al. (2017) Ulrich Heinz, Olga Evdokimov, and Peter Jacobs, eds., Proceedings, 26th International Conference on Ultra-relativistic Nucleus-Nucleus Collisions (Quark Matter 2017): Chicago, Illinois, USA, February 5-11, 2017, Vol. 967 (Elsevier, 2017).
- Bloczynski et al. (2013) John Bloczynski, Xu-Guang Huang, Xilin Zhang, and Jinfeng Liao, “Azimuthally fluctuating magnetic field and its impacts on observables in heavy-ion collisions,” Phys. Lett. B718, 1529–1535 (2013), arXiv:1209.6594 [nucl-th] .
- Ma and Zhang (2011) Guo-Liang Ma and Bin Zhang, “Effects of final state interactions on charge separation in relativistic heavy ion collisions,” Phys. Lett. B700, 39–43 (2011), arXiv:1101.1701 [nucl-th] .
- Sun and Ko (2018) Yifeng Sun and Che Ming Ko, “Chiral kinetic approach to the chiral magnetic effect in isobaric collisions,” (2018), arXiv:1803.06043 [nucl-th] .
- Adam et al. (2020) J. Adam et al. (STAR), “Pair invariant mass to isolate background in the search for the chiral magnetic effect in Au+Au collisions at = 200 GeV,” (2020), arXiv:2006.05035 [nucl-ex] .
- Shi et al. (2020) Shuzhe Shi, Hui Zhang, Defu Hou, and Jinfeng Liao, “Signatures of Chiral Magnetic Effect in the Collisions of Isobars,” Phys. Rev. Lett. 125, 242301 (2020), arXiv:1910.14010 [nucl-th] .