Sgr A* near-infrared flares from reconnection events in a magnetically arrested disc
Abstract
Large-amplitude Sgr A* near-infrared flares result from energy injection into electrons near the black hole event horizon. Astrometry data show continuous rotation of the emission region during bright flares, and corresponding rotation of the linear polarization angle. One broad class of physical flare models invokes magnetic reconnection. Here we show that such a scenario can arise in a general relativistic magnetohydrodynamic simulation of a magnetically arrested disc. Saturation of magnetic flux triggers eruption events, where magnetically dominated plasma is expelled from near the horizon and forms a rotating, spiral structure. Dissipation occurs via reconnection at the interface of the magnetically dominated plasma and surrounding fluid. This dissipation is associated with large increases in near-infrared emission in models of Sgr A*, with durations and amplitudes consistent with the observed flares. Such events occur at roughly the timescale to re-accumulate the magnetic flux from the inner accretion disc, h for Sgr A*. We study near-infrared observables from one sample event to show that the emission morphology tracks the boundary of the magnetically dominated region. As the region rotates around the black hole, the near-infrared centroid and linear polarization angle both undergo continuous rotation, similar to the behavior seen in Sgr A* flares.
keywords:
accretion, accretion discs — black hole physics — Galaxy: centre — MHD — polarization — radiative transfer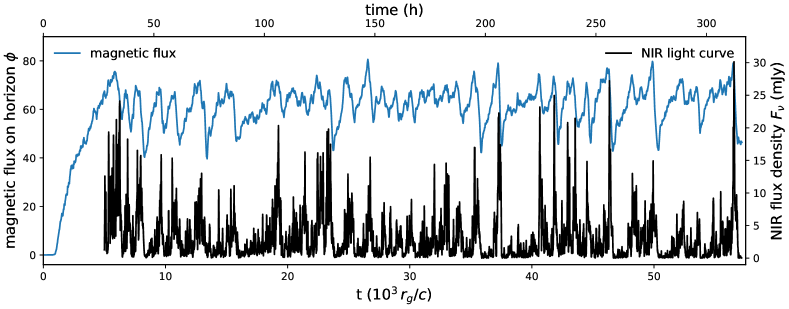
1 Introduction
The Galactic center massive black hole, Sgr A*, shows variable near-infrared (NIR) emission with factor increases (Genzel et al., 2003; Ghez et al., 2004) over its median value (Schödel et al., 2011; Dodds-Eden et al., 2011; Witzel et al., 2018). The so-called “flares” are often accompanied by simultaneous events in the X-ray (Baganoff et al., 2001; Eckart et al., 2008b; Marrone et al., 2008). The lack of a clear submillimeter counterpart (submm, electron energy ) implies that the flares are due to the acceleration of electrons to energies (Markoff et al., 2001). Linear polarization fractions of – indicate that the NIR emission is due to synchrotron radiation (Eckart et al., 2006; Trippe et al., 2007; Eckart et al., 2008a). Despite nearly two decades of study, their physical origin remains uncertain.
Recently, NIR long baseline interferometry with the VLT Interferometer instrument GRAVITY (Gravity Collaboration et al., 2017) showed a continuous rotation of the NIR centroid during three bright flares with apparent periods of – minutes (Gravity Collaboration et al., 2018). The observed clockwise motion on sky is consistent with models of a compact orbiting emission region (Broderick & Loeb, 2005, 2006) at a radius of –, where is the gravitational radius (Gravity Collaboration et al., 2020a, but see Matsumoto et al. 2020 and Ball et al. 2020). Simultaneous rotation of the linear polarization angle with a comparable period is consistent with the same scenario, as long as there is a significant poloidal magnetic field component in the emission region (Gravity Collaboration et al., 2018, Gravity Collaboration et al., 2020, submitted). The circular pattern of the centroid motion on sky and lack of a strong Doppler beaming signature in the flares disfavors inclination angles close to edge-on (, Gravity Collaboration et al., 2020a).
Radiative models based on general relativistic magnetohydrodynamic (GRMHD) simulations of Sgr A* accretion are consistent with the source spectrum, image sizes, and image-integrated polarization properties (Mościbrodzka et al., 2009, 2014; Dexter et al., 2009; Dexter et al., 2010; Shcherbakov et al., 2012; Chan et al., 2015a; Ressler et al., 2017; Chael et al., 2018; Anantua et al., 2020). In some cases, the models produce sufficiently hot electrons to match the observed NIR luminosity (e.g., Dexter & Fragile, 2013; Chan et al., 2015b; Ressler et al., 2017). The NIR emission region is usually found to be concentrated close to the black hole event horizon (e.g., Dolence et al., 2009; Ressler et al., 2017; Petersen & Gammie, 2020).
Here we consider a scenario for Sgr A* flares as the result of stochastic, repeating, large-scale magnetic reconnection events occurring in GRMHD models of magnetically arrested discs (MADs, Bisnovatyi-Kogan & Ruzmaikin, 1974; Igumenshchev et al., 2003; Narayan et al., 2003; Tchekhovskoy et al., 2011; McKinney et al., 2012). We study one GRMHD model that we found to be broadly consistent with observations of Sgr A* (Dexter et al., 2020). We show that NIR flares occur every h in the same models as the result of magnetic eruptions originating close to the black hole (section 2). The flares show continuous rotation of the astrometric centroid as a result of rotating spiral structure in the emission region (section 3). We find a corresponding rotation of the polarization angle due to the strong poloidal fields near the black holes. We discuss the limitations of the current model and implications for our understanding of accretion onto Sgr A* (section 4). We note that Porth et al. (2020) have also carried out a study of these events and their possible connection to Sgr A* flares, including calculations of their dynamics, energetics, magnetic field configuration, and dependence on black hole spin.
 |
 |
 |
 |
2 Flux eruptions in numerical models of magnetically arrested discs
Here we study one fiducial, long duration, MAD, 3D GRMHD simulation described in Dexter et al. (2020) and run with the harmpi111https://github.com/atchekho/harmpi code (Tchekhovskoy, 2019). Using a resolution of grid cells in the , , and directions, respectively, the simulation was run for a time of after being initialized from a Fishbone-Moncrief torus with inner radius , pressure maximum radius , and black hole spin parameter of . A single poloidal loop of magnetic field particularly designed to supply a large amount of magnetic flux was added inside the torus such that , where and are the gas and magnetic pressures (see, e.g., Tchekhovskoy et al. 2011). By the end of the run, inflow equilibrium was established out to , somewhat lower than the found in the long duration MAD simulation of Narayan et al. (2012). The simulation included a scheme for self-consistently evolving four separate electron internal energy densities along with that of the single MHD fluid (Ressler et al., 2015). We use an ideal fluid equation of state with adiabatic index of for the fluid, and for the electrons. Following Ressler et al. (2017) and Chael et al. (2018), we implemented four different electron internal energies using electron heating models based on both turbulent and magnetic reconnection kinetics calculations. Here we focus on the magnetic reconnection model of Werner et al. (2018, electron heating fraction of , parameterized using their equation 3), which can produce both the median NIR flux density and large-amplitude flaring behavior. The results presented here are consistent across all electron heating models.
The blue line in Figure 1 shows the dimensionless magnetic flux accumulated on the horizon as a function of time, , where is the magnetic flux and is the accretion rate which we smooth over timescales of . Magnetic flux is advected inwards with the flow and rapidly builds up on the event horizon, saturating in a MAD state where (e.g., Tchekhovskoy et al., 2011; McKinney et al., 2012; Tchekhovskoy, 2015). The normalized magnetic flux undergoes cycles of gradual build up and rapid dissipation. The dissipation is due to stochastic magnetic flux “eruption” events from near the black hole (Igumenshchev, 2008).
The flux eruptions occur after the time required to replenish the magnetic flux lost by the black hole during the previous event. We can estimate the recurrence timescale for the largest eruptions, in which the black hole loses about half of its magnetic flux, as the time it takes for the accreting gas (with frozen-in magnetic flux) to reach the black hole from , the distance within which the disc contains half as much magnetic flux as the black hole (Tchekhovskoy & McKinney, 2012). The accretion timescale from this distance is
| (1) |
where is the dimensionless viscosity parameter and is the disc scale height. This order of magnitude estimate gives the upper limit for the flare recurrence timescale. Typical recurrence times for major eruptions in our fiducial simulation are (–h for Sgr A*), broadly consistent with this estimate.
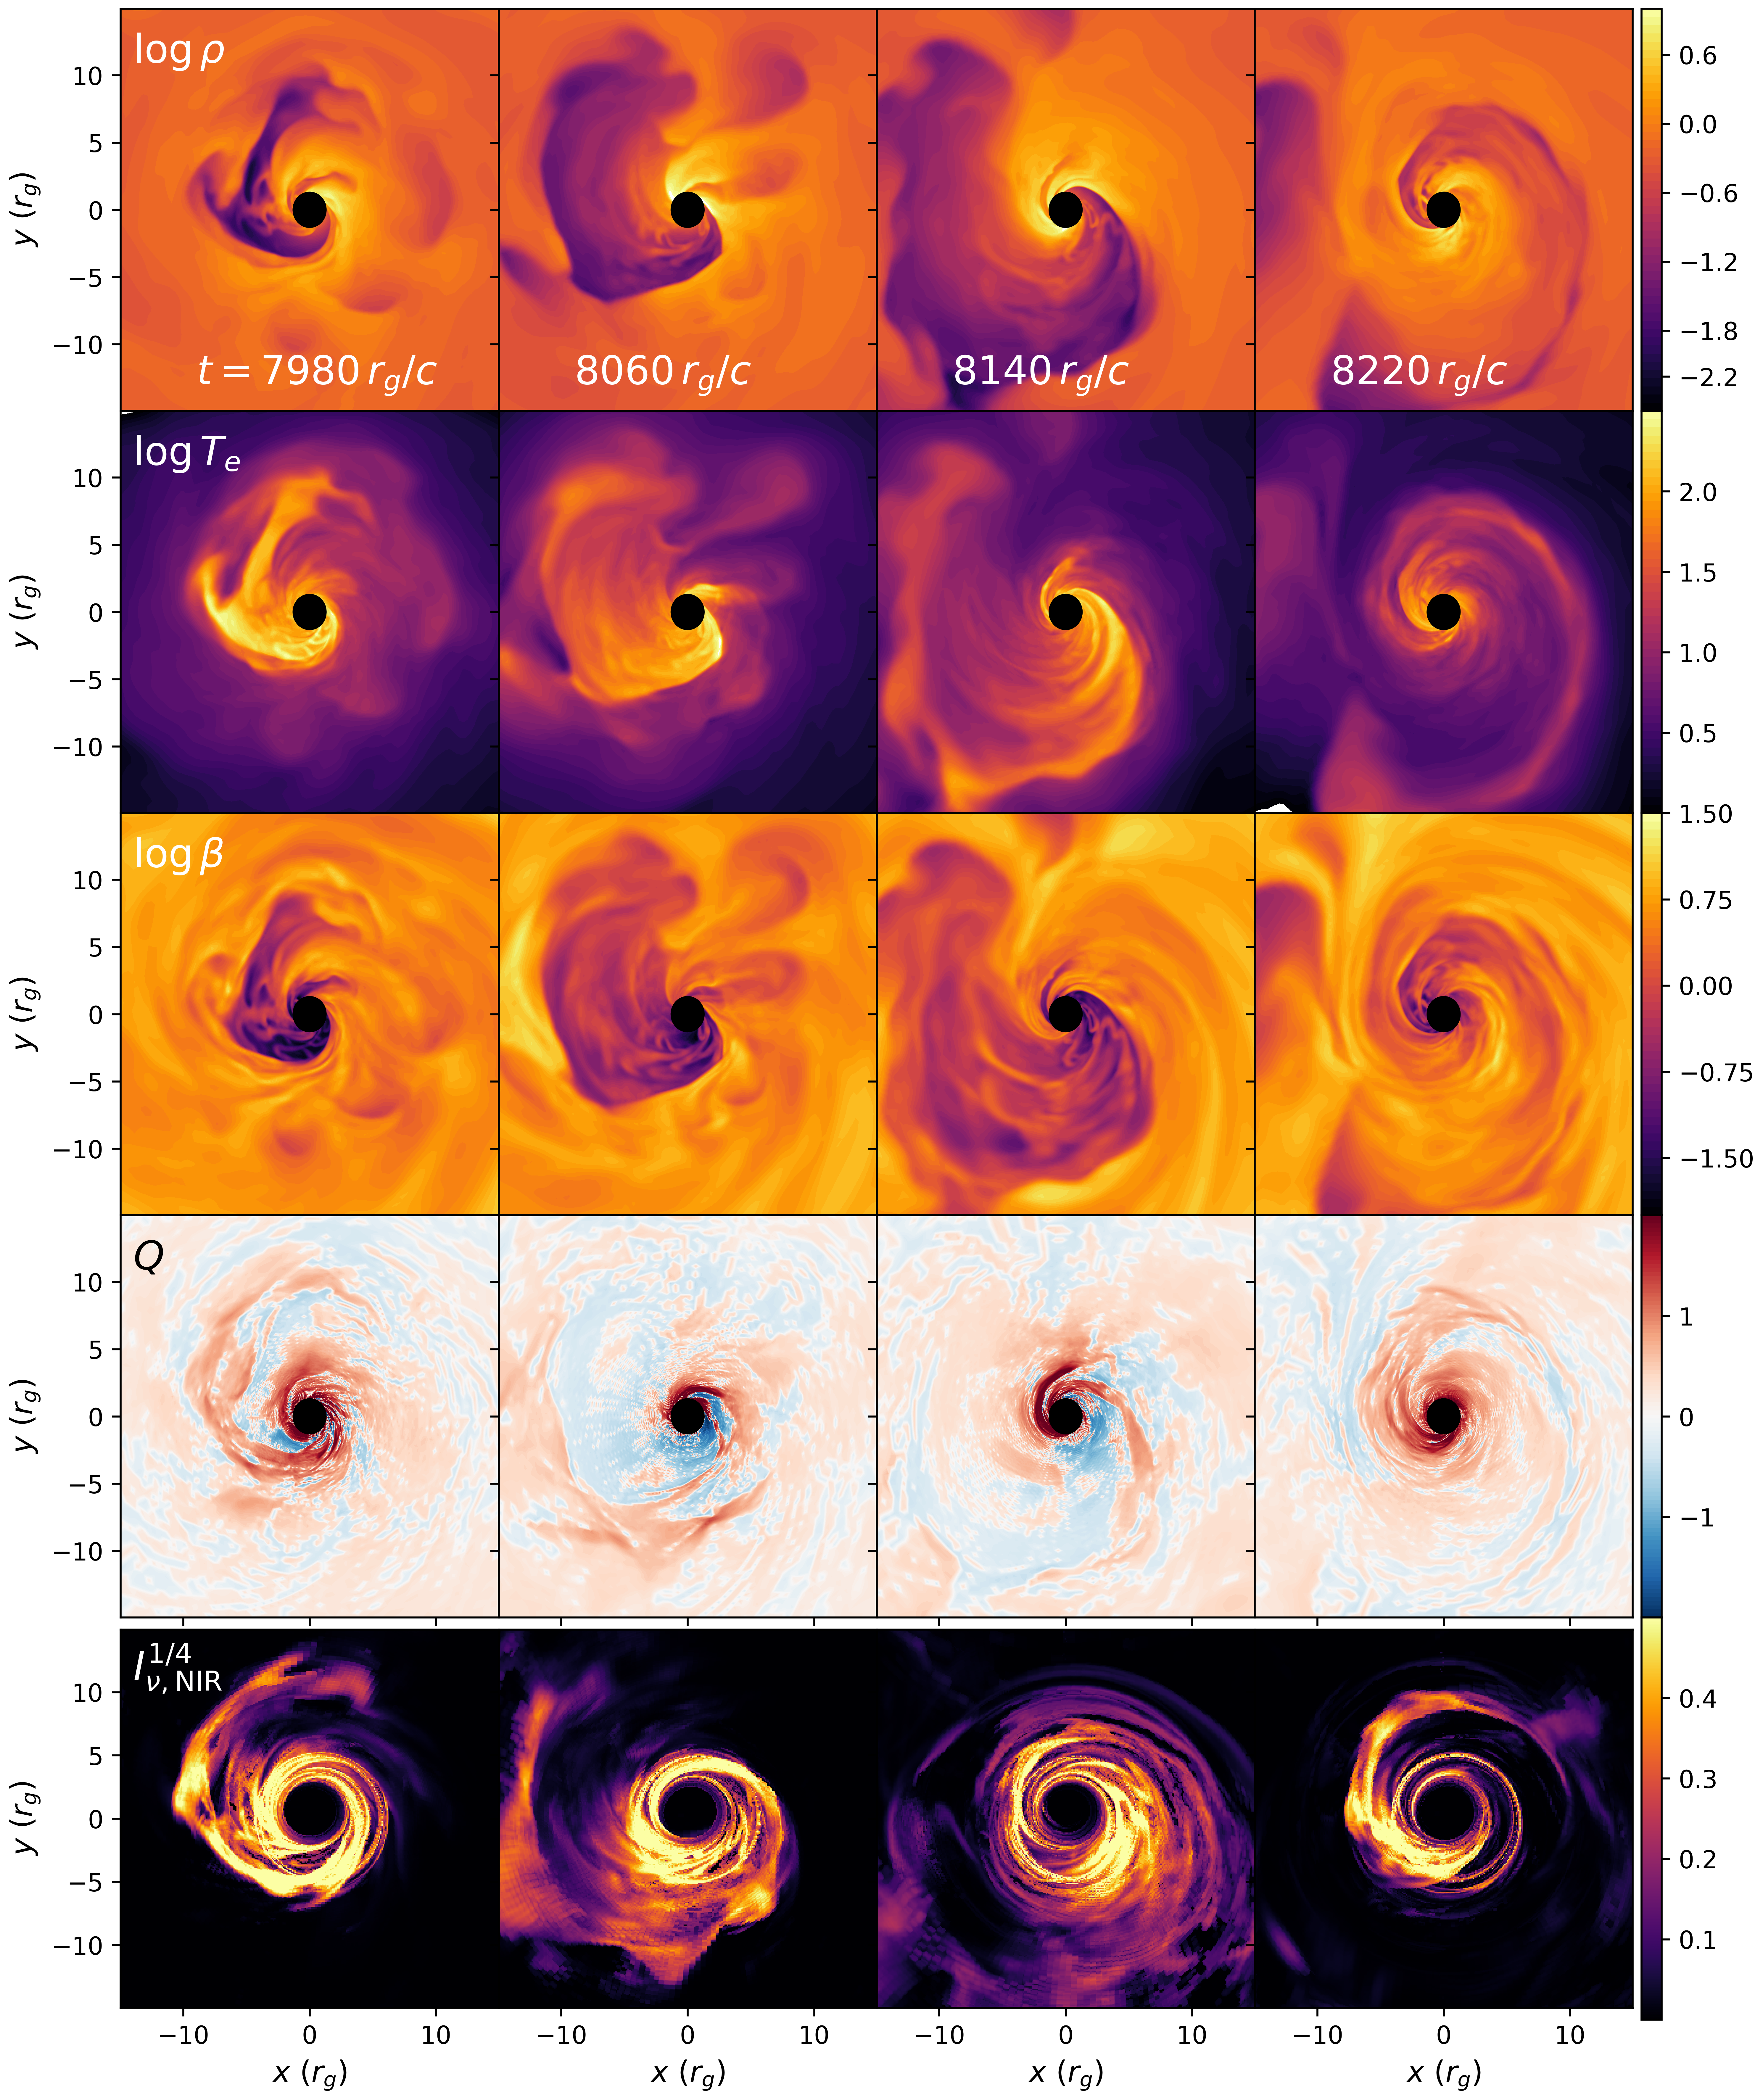
These magnetic flux eruptions launch low-density tubes of magnetic flux from near the black hole, which form a rotating spiral pattern (Igumenshchev, 2008; Tchekhovskoy et al., 2011). Figure 2 shows density-weighted, vertically averaged maps of particle density, electron temperature, plasma (the ratio of gas to magnetic pressure), and fluid heating rate, , at four snapshots near the eruption event in our fiducial simulation. Hot, strongly magnetized, low density plasma forms a spiral structure which rotates around the black hole at small radii of . Particularly strong heating (red regions in fourth row of Figure 2) occurs near the boundary between the strongly magnetized (plasma ), low density and more weakly magnetized (plasma ), higher density regions. Similar non-axisymmetric spirals are seen in all eruption events. Note that the unphysical values (blue regions in fourth row of Figure 2) occur due to unavoidable truncation error in low density, high entropy, high magnetization regions (see §6 of Ressler et al. 2017 and §3.1 of Sądowski et al. 2017 for discussions of this issue). These regions are excluded from our emission calculations (section 3).
 |
 |
3 Near-infrared observables
We calculate NIR observables from the time period corresponding to this same magnetic flux eruption event. We scale the simulation data to cgs units using an average mass accretion rate of yr-1 (chosen to match the Sgr A* submm to NIR spectrum, Dexter et al., 2020). We calculate the NIR emissivity assuming a thermal energy distribution of electrons using the angle-dependent fitting function from Mahadevan et al. (1996). We then calculate polarized movies of synchrotron radiation using the grtrans222https://github.com/jadexter/grtrans code (Dexter et al., 2009; Dexter, 2016) including all relativistic effects. We fix the observer inclination angle at , consistent with GRAVITY results (Gravity Collaboration et al., 2018, 2020a) except that our fluid is rotating counterclockwise on sky. Images are calculated with a field of view of as with pixels. We exclude any emission from the most highly magnetized regions with the ratio of magnetic to rest mass energy density , with both quantities in code units. We fix the mass of Sgr A* at with a distance to the Galactic center of kpc (e.g., Ghez et al., 2008; Gillessen et al., 2009; Gravity Collaboration et al., 2019; Do et al., 2019a; Gravity Collaboration et al., 2020b). These choices lead to characteristic length, time, and angular scales of cm, s, and as.
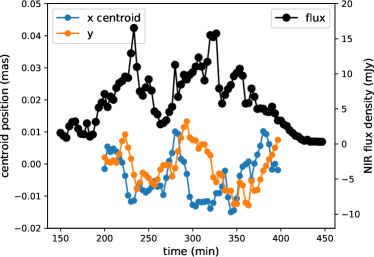
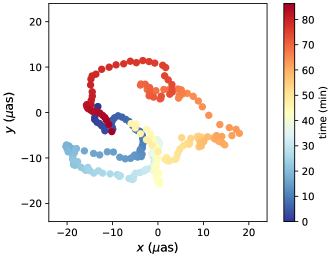
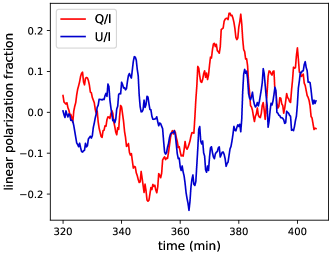
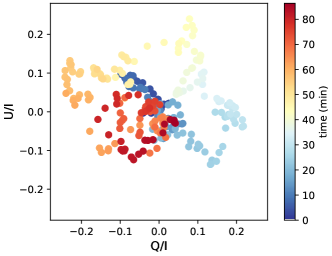
The black curve in Figure 1 shows the NIR model light curve over a continuous h time interval for Sgr A*. Strong peaks in near-infrared flux density are apparent, each corresponding to a sharp decrease in magnetic flux on the event horizon. Sample snapshot images are shown in the last row of Figure 2. The spiral morphology matches that seen in the coordinate frame simulation data of the same flare, particularly that of the fluid heating rate . The emission region rotates continuously completing one full period over this time span. The left panel of Figure 3 shows one double-peaked K band (m) NIR flare corresponding to the time period of the eruption event studied above. The and centroids also show motion suggestive of rotation, with an on sky diameter of as (). We show the astrometric motion on sky in the right panel. Here we use simulation data spaced by s and account for light travel time delays through the emission region (“slow light"). The NIR centroid rotates continuously over the minutes. Figure 4 shows that this rotation is accompanied by a single rotation of the linear polarization angle on the same time scale, which shows up as oscillations of the fractional Stokes parameters and (e.g., Marrone et al., 2006).
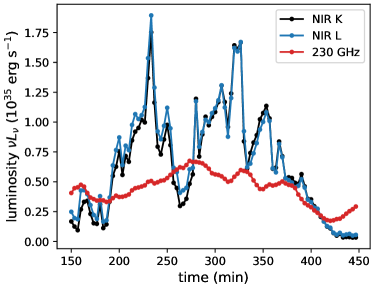
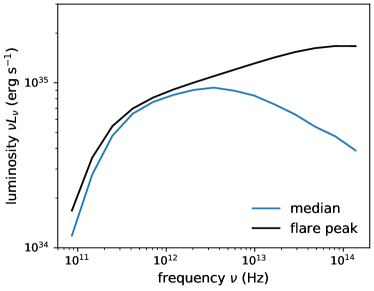
Figure 5 compares NIR and band light curves with that at mm (230 GHz). The spectral index is variable during the flare but fairly flat, ranging from values of for . There is no simultaneous rise in submm flux during the NIR flare, but rather the emergence of a new higher energy spectral component (see median and flare spectral energy distributions in the right panel of Figure 5).
Where does the emission originate? The flux eruptions are associated with magnetically dominated, low density material. Synchrotron radiation scales with density, and we explicitly exclude emission from highly magnetized regions where . The observed emission morphology tracks that of the magnetized material, but most closely with the regions of highest dissipation at the interface between magnetically dominated regions and the rest of the fluid. Typical fluid properties calculated as intensity-weighted averages are , G, K, . The temperature is one order of magnitude higher than that of the submm emitting electrons. Still, the bulk of the NIR radiation does not originate from magnetically dominated plasma. If we instead apply a cut where , the flux density increases by a factor . The average properties of radiating electrons all change by a simlar amount, e.g. the new emission comes from more highly magnetized material. The emission region morphology, centroid motion, and polarization behavior remain the same.
4 Discussion
We have shown that flux eruption events associated with magnetically arrested discs produce non-axisymmetric, magnetically dominated regions which travel outwards and heat the plasma via magnetic reconnection. These events are a direct consequence of strong magnetic fields near the black hole event horizon, which become dynamically important and repel accreting gas. The existence of such a flow structure near Sgr A* may be a natural consequence of the accretion of weakly magnetized stellar winds in the central parsec (Ressler et al., 2019; Ressler et al., 2020).
By calculating NIR observables of Sgr A* from a fiducial 3D GRMHD simulation, we have shown that such events trigger large-amplitude NIR variability which matches many observed properties of the NIR/X-ray flares:
-
•
factor of 10–20 increases in flux density compared to the median with durations of 30–60 minutes;
-
•
a recurrence timescale of several hours;
-
•
a flat spectral index in the NIR, without a simultaneous submillimeter counterpart;
-
•
linear polarization fractions of 10–20;
-
•
continuous rotation of the emission region accompanied by a rotation of the linear polarization angle.
These flaring events occur in a model which satisfies many other Sgr A* submm to NIR observational constraints (Dexter et al., 2020). The flare recurrence time is the timescale for magnetic flux to accumulate on the black hole and saturate following a dissipation event. The flares are driven primarily by increases in electron temperature due to particle heating from magnetic reconnection. The polarization oscillation is due to strong poloidal magnetic field components in the inner MAD accretion flow (Gravity Collaboration et al., 2018). While we do see rapid, large-amplitude variations in intensity in SANE simulations, those events do not show significant centroid motion or variations in the linear polarization angle.
The flares in our MAD model could thus be a promising explanation for the observed Sgr A* NIR flares. There are still some inconsistencies with the data. Compared to the observations, i) the flux distribution shows too many moderate and not enough very bright flares (The GRAVITY Collaboration et al., 2020), ii) the flare spectra might be too steep (too “red”), iii) the astrometric and polarization periods are at the long end of the observed range, and iv) the astrometric pattern on sky is a factor of 2–3 too small.
One possible reason for these differences is that our physical model is overly simplistic. We assume a purely thermal distribution of electrons, while relativistic magnetic reconnection can produce significant non-thermal particle acceleration (e.g., Sironi & Spitkovsky, 2014; Guo et al., 2015; Werner et al., 2016). Particle acceleration is commonly invoked to explain the NIR and especially X-ray flares from Sgr A* (e.g., Markoff et al., 2001; Yuan et al., 2004; Ball et al., 2016; Chael et al., 2018). The cooling time given the typical parameters of our radiating electrons is min, similar to the dynamical time close to the black hole and shorter than the flare duration. Radiative cooling may be important, particularly if higher energy non-thermal electrons contribute significantly to the observed flux. On the other hand, we do see continuous heating of the flaring electrons in our simulation (Figure 2). We do not include non-thermal emission or Compton scattering, and so are at present unable to make predictions for the X-ray luminosity or spectra of the flaring events studied here. Using the one zone prescription of Chiaberge & Ghisellini (1999) and our average NIR emission parameters above, we estimate an X-ray luminosity of for synchrotron self-Compton and for Compton upscattering of NIR seed photons by submm electrons. The results suggest that Compton cooling is likely sub-dominant (Compton ). At the same time, the one zone estimate of the inverse Compton luminosity estimate is only a factor of a few below that seen in Sgr A* X-ray flares. Our brightest flare peak is a factor of fainter than the brightest observed NIR flare to date (Do et al., 2019b), and Gutiérrez et al. (2020) suggested that MAD eruptions could be energetic enough to produce this event.
There are also numerical complications inherent to modeling MADs. Strongly magnetized regions are difficult to evolve accurately in ideal GRMHD simulations such as those used here. Flux eruptions are particularly challenging in this regard, since they produce steep gradients in magnetization over a large part of the inner accretion flow. Our results qualitatively match those in previous MAD simulations (e.g., Tchekhovskoy et al., 2011; White et al., 2019; Liska et al., 2020). We have also carried out otherwise identical simulations at lower resolutions of and the number of cells in each dimension. The flow structure and the time evolution of ramp up and dissipation cycles in magnetic flux are consistent in all cases (see appendix A). Still, the robustness of the (thermo)dynamics of such events to changes in resolution, simulation density floors, or the grid scale dissipation in ideal MHD remains uncertain. In addition, while the magnetic dissipation in the simulations here does arise in current sheets near the disc midplane (see appendix B), we do not resolve the physics of the magnetic reconnection process itself at our limited spatial resolution and using ideal MHD.
In our models, there is an average as offset between the NIR emission region centroid and the position of the black hole. The offset, which depends on the chosen inclination angle (here ), is in the direction of approaching material and results from Doppler beaming due to relativistic motion. Since our models underproduce the observed amplitude of centroid motion seen in NIR flares, we consider this a lower limit to the bias that would be induced in GRAVITY astrometric measurements in the S2 orbit in 2017 and 2018. A as offset currently causes negligible bias in parameters inferred from the orbit of S2 (Gravity Collaboration et al., 2020b).
We find that NIR centroid motions are larger during flares than otherwise. All flares in the fiducial simulation are associated with some degree of continuous rotation, showing apparent periods of – min and completing – rotations. The observed rotation speed is consistent with the (sub-Keplerian) orbital speed at –, comparable to the outer radius of the magnetically dominated structure during flares. We do not find correlations between centroid size or astrometric period and the total radiated energy or peak flux during a flare. We also see similar periods and centroid excursions in a small number of flux eruption events in shorter duration and simulations. The saturated flux values and recurrence times of eruption events appears similar in those models. Ressler et al. (2020) found similar eruption events in an simulation with initial conditions taken from stellar wind feeding, but with longer recurrence times. According to our model, future flares should show a range of periods and astrometric sizes. In higher precision data, the centroid track would appear more complex than that of a compact region undergoing orbital motion.
Although the total submm intensity does not vary simultaneously with that of the NIR, our models do show rotations of the submm polarization angle during the flares. Similar features have been seen in submm polarimetry data (e.g., Moran et al., 2007). Since the flux eruption events disrupt the inner accretion flow, we generically expect that NIR flares should be accompanied by observable signatures in resolved submm images with the Event Horizon Telescope (Event Horizon Telescope Collaboration et al., 2019).
The eruption events studied here may have implications for variable emission seen in accreting black hole systems beyond Sgr A*. The flare recurrence times of weeks seen in blazars (e.g., Chatterjee et al., 2009, 2011) and of hours seen in the early light curve of the jetted tidal disruption event Swift J1644 (e.g., Tchekhovskoy et al., 2014) both match the eruption recurrence times found here. Much shorter timescale variability of ms might be expected in the light curves of both short (e.g., Christie et al., 2019) and long (e.g., Tchekhovskoy & Giannios, 2015) gamma-ray bursts. Exploring the implications for MAD flux eruptions in the non-thermal and jetted emission from a wide range of systems is a goal of future work.
Acknowledgements
J.D. thanks M. C. Begelman, C. F. Gammie, A. Philippov, B. Ripperda, and D. Uzdensky for helpful comments. J.D. and A.J.-R. were supported in part by a Sofja Kovalevskaja award from the Alexander von Humboldt foundation, by a CONACyT/DAAD grant (57265507), and by NASA Astrophysics Theory Program Grant 80NSSC20K0527. S.M.R. was supported by the Gordon and Betty Moore Foundation through Grant GBMF7392 and also in part by the National Science Foundation under Grant No. NSF PHY–1748958. AT was supported by the National Science Foundation AAG grants 1815304 and 1911080. The calculations presented here were carried out on the MPG supercomputers Hydra and Cobra hosted at MPCDF, and using resources supported by the NASA High-End Computing (HEC) Program through the NASA Advanced Supercomputing (NAS) Division at Ames Research Center.
Data Availability
Simulated images and averaged simulation data products used here will be shared on reasonable request to the corresponding author.
References
- Anantua et al. (2020) Anantua R., Ressler S., Quataert E., 2020, MNRAS, 493, 1404
- Baganoff et al. (2001) Baganoff F. K., et al., 2001, Nature, 413, 45
- Ball et al. (2016) Ball D., Özel F., Psaltis D., Chan C.-k., 2016, ApJ, 826, 77
- Ball et al. (2020) Ball D., Özel F., Christian P., Chan C.-K., Psaltis D., 2020, arXiv e-prints, p. arXiv:2005.14251
- Bisnovatyi-Kogan & Ruzmaikin (1974) Bisnovatyi-Kogan G. S., Ruzmaikin A. A., 1974, Ap&SS, 28, 45
- Broderick & Loeb (2005) Broderick A. E., Loeb A., 2005, MNRAS, 363, 353
- Broderick & Loeb (2006) Broderick A. E., Loeb A., 2006, ApJ, 636, L109
- Chael et al. (2018) Chael A., Rowan M., Narayan R., Johnson M., Sironi L., 2018, MNRAS, 478, 5209
- Chan et al. (2015a) Chan C.-K., Psaltis D., Özel F., Narayan R., Sadowski A., 2015a, ApJ, 799, 1
- Chan et al. (2015b) Chan C.-k., Psaltis D., Özel F., Medeiros L., Marrone D., Sadowski A., Narayan R., 2015b, ApJ, 812, 103
- Chatterjee et al. (2009) Chatterjee R., et al., 2009, ApJ, 704, 1689
- Chatterjee et al. (2011) Chatterjee R., et al., 2011, ApJ, 734, 43
- Chiaberge & Ghisellini (1999) Chiaberge M., Ghisellini G., 1999, MNRAS, 306, 551
- Christie et al. (2019) Christie I. M., Lalakos A., Tchekhovskoy A., Fernández R., Foucart F., Quataert E., Kasen D., 2019, MNRAS, 490, 4811
- Dexter (2016) Dexter J., 2016, MNRAS, 462, 115
- Dexter & Fragile (2013) Dexter J., Fragile P. C., 2013, MNRAS, 432, 2252
- Dexter et al. (2009) Dexter J., Agol E., Fragile P. C., 2009, ApJ, 703, L142
- Dexter et al. (2010) Dexter J., Agol E., Fragile P. C., McKinney J. C., 2010, ApJ, 717, 1092
- Dexter et al. (2020) Dexter J., et al., 2020, MNRAS, 494, 4168
- Do et al. (2019a) Do T., et al., 2019a, Science, 365, 664
- Do et al. (2019b) Do T., et al., 2019b, ApJ, 882, L27
- Dodds-Eden et al. (2011) Dodds-Eden K., et al., 2011, ApJ, 728, 37
- Dolence et al. (2009) Dolence J. C., Gammie C. F., Mościbrodzka M., Leung P. K., 2009, ApJS, 184, 387
- Eckart et al. (2006) Eckart A., Schödel R., Meyer L., Trippe S., Ott T., Genzel R., 2006, A&A, 455, 1
- Eckart et al. (2008a) Eckart A., et al., 2008a, A&A, 479, 625
- Eckart et al. (2008b) Eckart A., et al., 2008b, A&A, 492, 337
- Event Horizon Telescope Collaboration et al. (2019) Event Horizon Telescope Collaboration et al., 2019, ApJ, 875, L2
- Genzel et al. (2003) Genzel R., Schödel R., Ott T., Eckart A., Alexander T., Lacombe F., Rouan D., Aschenbach B., 2003, Nature, 425, 934
- Ghez et al. (2004) Ghez A. M., et al., 2004, ApJ, 601, L159
- Ghez et al. (2008) Ghez A. M., et al., 2008, ApJ, 689, 1044
- Gillessen et al. (2009) Gillessen S., Eisenhauer F., Trippe S., Alexand er T., Genzel R., Martins F., Ott T., 2009, ApJ, 692, 1075
- Gravity Collaboration et al. (2017) Gravity Collaboration et al., 2017, A&A, 602, A94
- Gravity Collaboration et al. (2018) Gravity Collaboration et al., 2018, A&A, 618, L10
- Gravity Collaboration et al. (2019) Gravity Collaboration et al., 2019, A&A, 625, L10
- Gravity Collaboration et al. (2020a) Gravity Collaboration et al., 2020a, A&A, 635, A143
- Gravity Collaboration et al. (2020b) Gravity Collaboration et al., 2020b, A&A, 636, L5
- Guo et al. (2015) Guo F., Liu Y.-H., Daughton W., Li H., 2015, ApJ, 806, 167
- Gutiérrez et al. (2020) Gutiérrez E. M., Nemmen R., Cafardo F., 2020, ApJ, 891, L36
- Igumenshchev (2008) Igumenshchev I. V., 2008, ApJ, 677, 317
- Igumenshchev et al. (2003) Igumenshchev I. V., Narayan R., Abramowicz M. A., 2003, ApJ, 592, 1042
- Liska et al. (2020) Liska M., Tchekhovskoy A., Quataert E., 2020, MNRAS, 494, 3656
- Mahadevan et al. (1996) Mahadevan R., Narayan R., Yi I., 1996, ApJ, 465, 327
- Markoff et al. (2001) Markoff S., Falcke H., Yuan F., Biermann P. L., 2001, A&A, 379, L13
- Marrone et al. (2006) Marrone D. P., Moran J. M., Zhao J.-H., Rao R., 2006, in Journal of Physics Conference Series. pp 354–362 (arXiv:astro-ph/0607432), doi:10.1088/1742-6596/54/1/056
- Marrone et al. (2008) Marrone D. P., et al., 2008, ApJ, 682, 373
- Matsumoto et al. (2020) Matsumoto T., Chan C.-H., Piran T., 2020, arXiv e-prints, p. arXiv:2004.13029
- McKinney et al. (2012) McKinney J. C., Tchekhovskoy A., Blandford R. D., 2012, MNRAS, 423, 3083
- Moran et al. (2007) Moran J. M., Marrone D. P., Zhao J. H., Rao R., 2007, in Aschenbach B., Burwitz V., Hasinger G., Leibundgut B., eds, Relativistic Astrophysics Legacy and Cosmology - Einstein’s Legacy. p. 163, doi:10.1007/978-3-540-74713-0_37
- Mościbrodzka et al. (2009) Mościbrodzka M., Gammie C. F., Dolence J. C., Shiokawa H., Leung P. K., 2009, ApJ, 706, 497
- Mościbrodzka et al. (2014) Mościbrodzka M., Falcke H., Shiokawa H., Gammie C. F., 2014, A&A, 570, A7
- Narayan et al. (2003) Narayan R., Igumenshchev I. V., Abramowicz M. A., 2003, PASJ, 55, L69
- Narayan et al. (2012) Narayan R., Sadowski A., Penna R. F., Kulkarni A. K., 2012, MNRAS, 426, 3241
- Nathanail et al. (2020) Nathanail A., Fromm C. M., Porth O., Olivares H., Younsi Z., Mizuno Y., Rezzolla L., 2020, arXiv e-prints, p. arXiv:2002.01777
- Petersen & Gammie (2020) Petersen E., Gammie C., 2020, MNRAS, 494, 5923
- Porth et al. (2020) Porth O., Mizuno Y., Younsi Z., Fromm C. M., 2020, arXiv e-prints, p. arXiv:2006.03658
- Ressler et al. (2015) Ressler S. M., Tchekhovskoy A., Quataert E., Chand ra M., Gammie C. F., 2015, MNRAS, 454, 1848
- Ressler et al. (2017) Ressler S. M., Tchekhovskoy A., Quataert E., Gammie C. F., 2017, MNRAS, 467, 3604
- Ressler et al. (2019) Ressler S. M., Quataert E., Stone J. M., 2019, MNRAS, 482, L123
- Ressler et al. (2020) Ressler S. M., White C. J., Quataert E., Stone J. M., 2020, arXiv e-prints, p. arXiv:2006.00005
- Ripperda et al. (2020) Ripperda B., Bacchini F., Philippov A., 2020, arXiv e-prints, p. arXiv:2003.04330
- Schödel et al. (2011) Schödel R., Morris M. R., Muzic K., Alberdi A., Meyer L., Eckart A., Gezari D. Y., 2011, A&A, 532, A83
- Shcherbakov et al. (2012) Shcherbakov R. V., Penna R. F., McKinney J. C., 2012, ApJ, 755, 133
- Sironi & Spitkovsky (2014) Sironi L., Spitkovsky A., 2014, ApJ, 783, L21
- Sądowski et al. (2017) Sądowski A., Wielgus M., Narayan R., Abarca D., McKinney J. C., Chael A., 2017, MNRAS, 466, 705
- Tchekhovskoy (2015) Tchekhovskoy A., 2015, Launching of Active Galactic Nuclei Jets. p. 45, doi:10.1007/978-3-319-10356-3_3
- Tchekhovskoy (2019) Tchekhovskoy A., 2019, HARMPI: 3D massively parallel general relativictic MHD code (ascl:1912.014)
- Tchekhovskoy & Giannios (2015) Tchekhovskoy A., Giannios D., 2015, MNRAS, 447, 327
- Tchekhovskoy & McKinney (2012) Tchekhovskoy A., McKinney J. C., 2012, MNRAS, 423, L55
- Tchekhovskoy et al. (2011) Tchekhovskoy A., Narayan R., McKinney J. C., 2011, MNRAS, 418, L79
- Tchekhovskoy et al. (2014) Tchekhovskoy A., Metzger B. D., Giannios D., Kelley L. Z., 2014, MNRAS, 437, 2744
- The GRAVITY Collaboration et al. (2020) The GRAVITY Collaboration et al., 2020, arXiv e-prints, p. arXiv:2004.07185
- Trippe et al. (2007) Trippe S., Paumard T., Ott T., Gillessen S., Eisenhauer F., Martins F., Genzel R., 2007, MNRAS, 375, 764
- Werner et al. (2016) Werner G. R., Uzdensky D. A., Cerutti B., Nalewajko K., Begelman M. C., 2016, ApJ, 816, L8
- Werner et al. (2018) Werner G. R., Uzdensky D. A., Begelman M. C., Cerutti B., Nalewajko K., 2018, MNRAS, 473, 4840
- White et al. (2019) White C. J., Stone J. M., Quataert E., 2019, ApJ, 874, 168
- Witzel et al. (2018) Witzel G., et al., 2018, ApJ, 863, 15
- Yuan et al. (2004) Yuan F., Quataert E., Narayan R., 2004, ApJ, 606, 894
Appendix A Impact of grid resolution on magnetic flux evolution and flow structure
 |
 |
 |
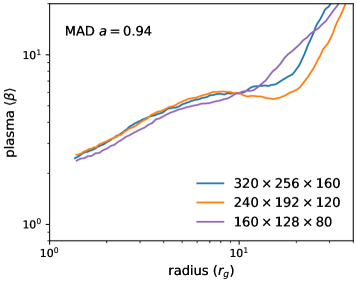 |
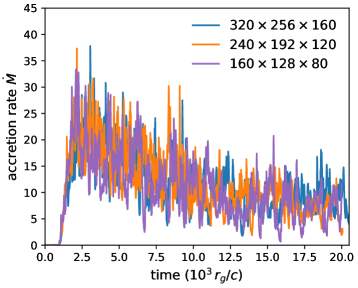
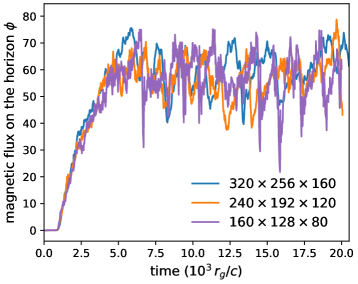
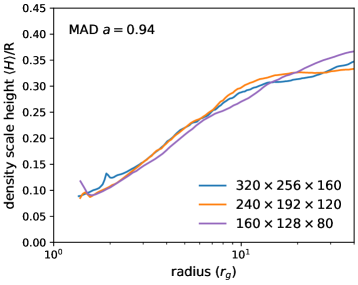
To study convergence, we have run additional simulations at and the number of cells in each grid dimension as our fiducial simulation. All other parameters are kept the same, and the lower resolution simulations are run for a time . Figure 6 shows the time evolution of the mass accretion rate through the event horizon and the dimensionless magnetic flux accumulated on the black hole for the fiducial and lower resolution simulations. We see qualitatively similar time evolution in all cases, including ramp up and dissipation cycles of magnetic flux on similar timescales and with similar amplitudes. Figure 7 shows density-weighted shell-averaged radial profiles of the disc scale height and plasma . Inside of , the results are nearly identical for all resolutions. Many individual eruptions occur at similar times and look similar between the full and resolution cases in terms of vertically integrated maps like those shown in Figure 2. In particular, they show spiral structures of erupting, highly magnetized plasma from near the black hole. We conclude that the results presented here would not change if we were to use a somewhat smaller grid resolution for our fiducial simulation.
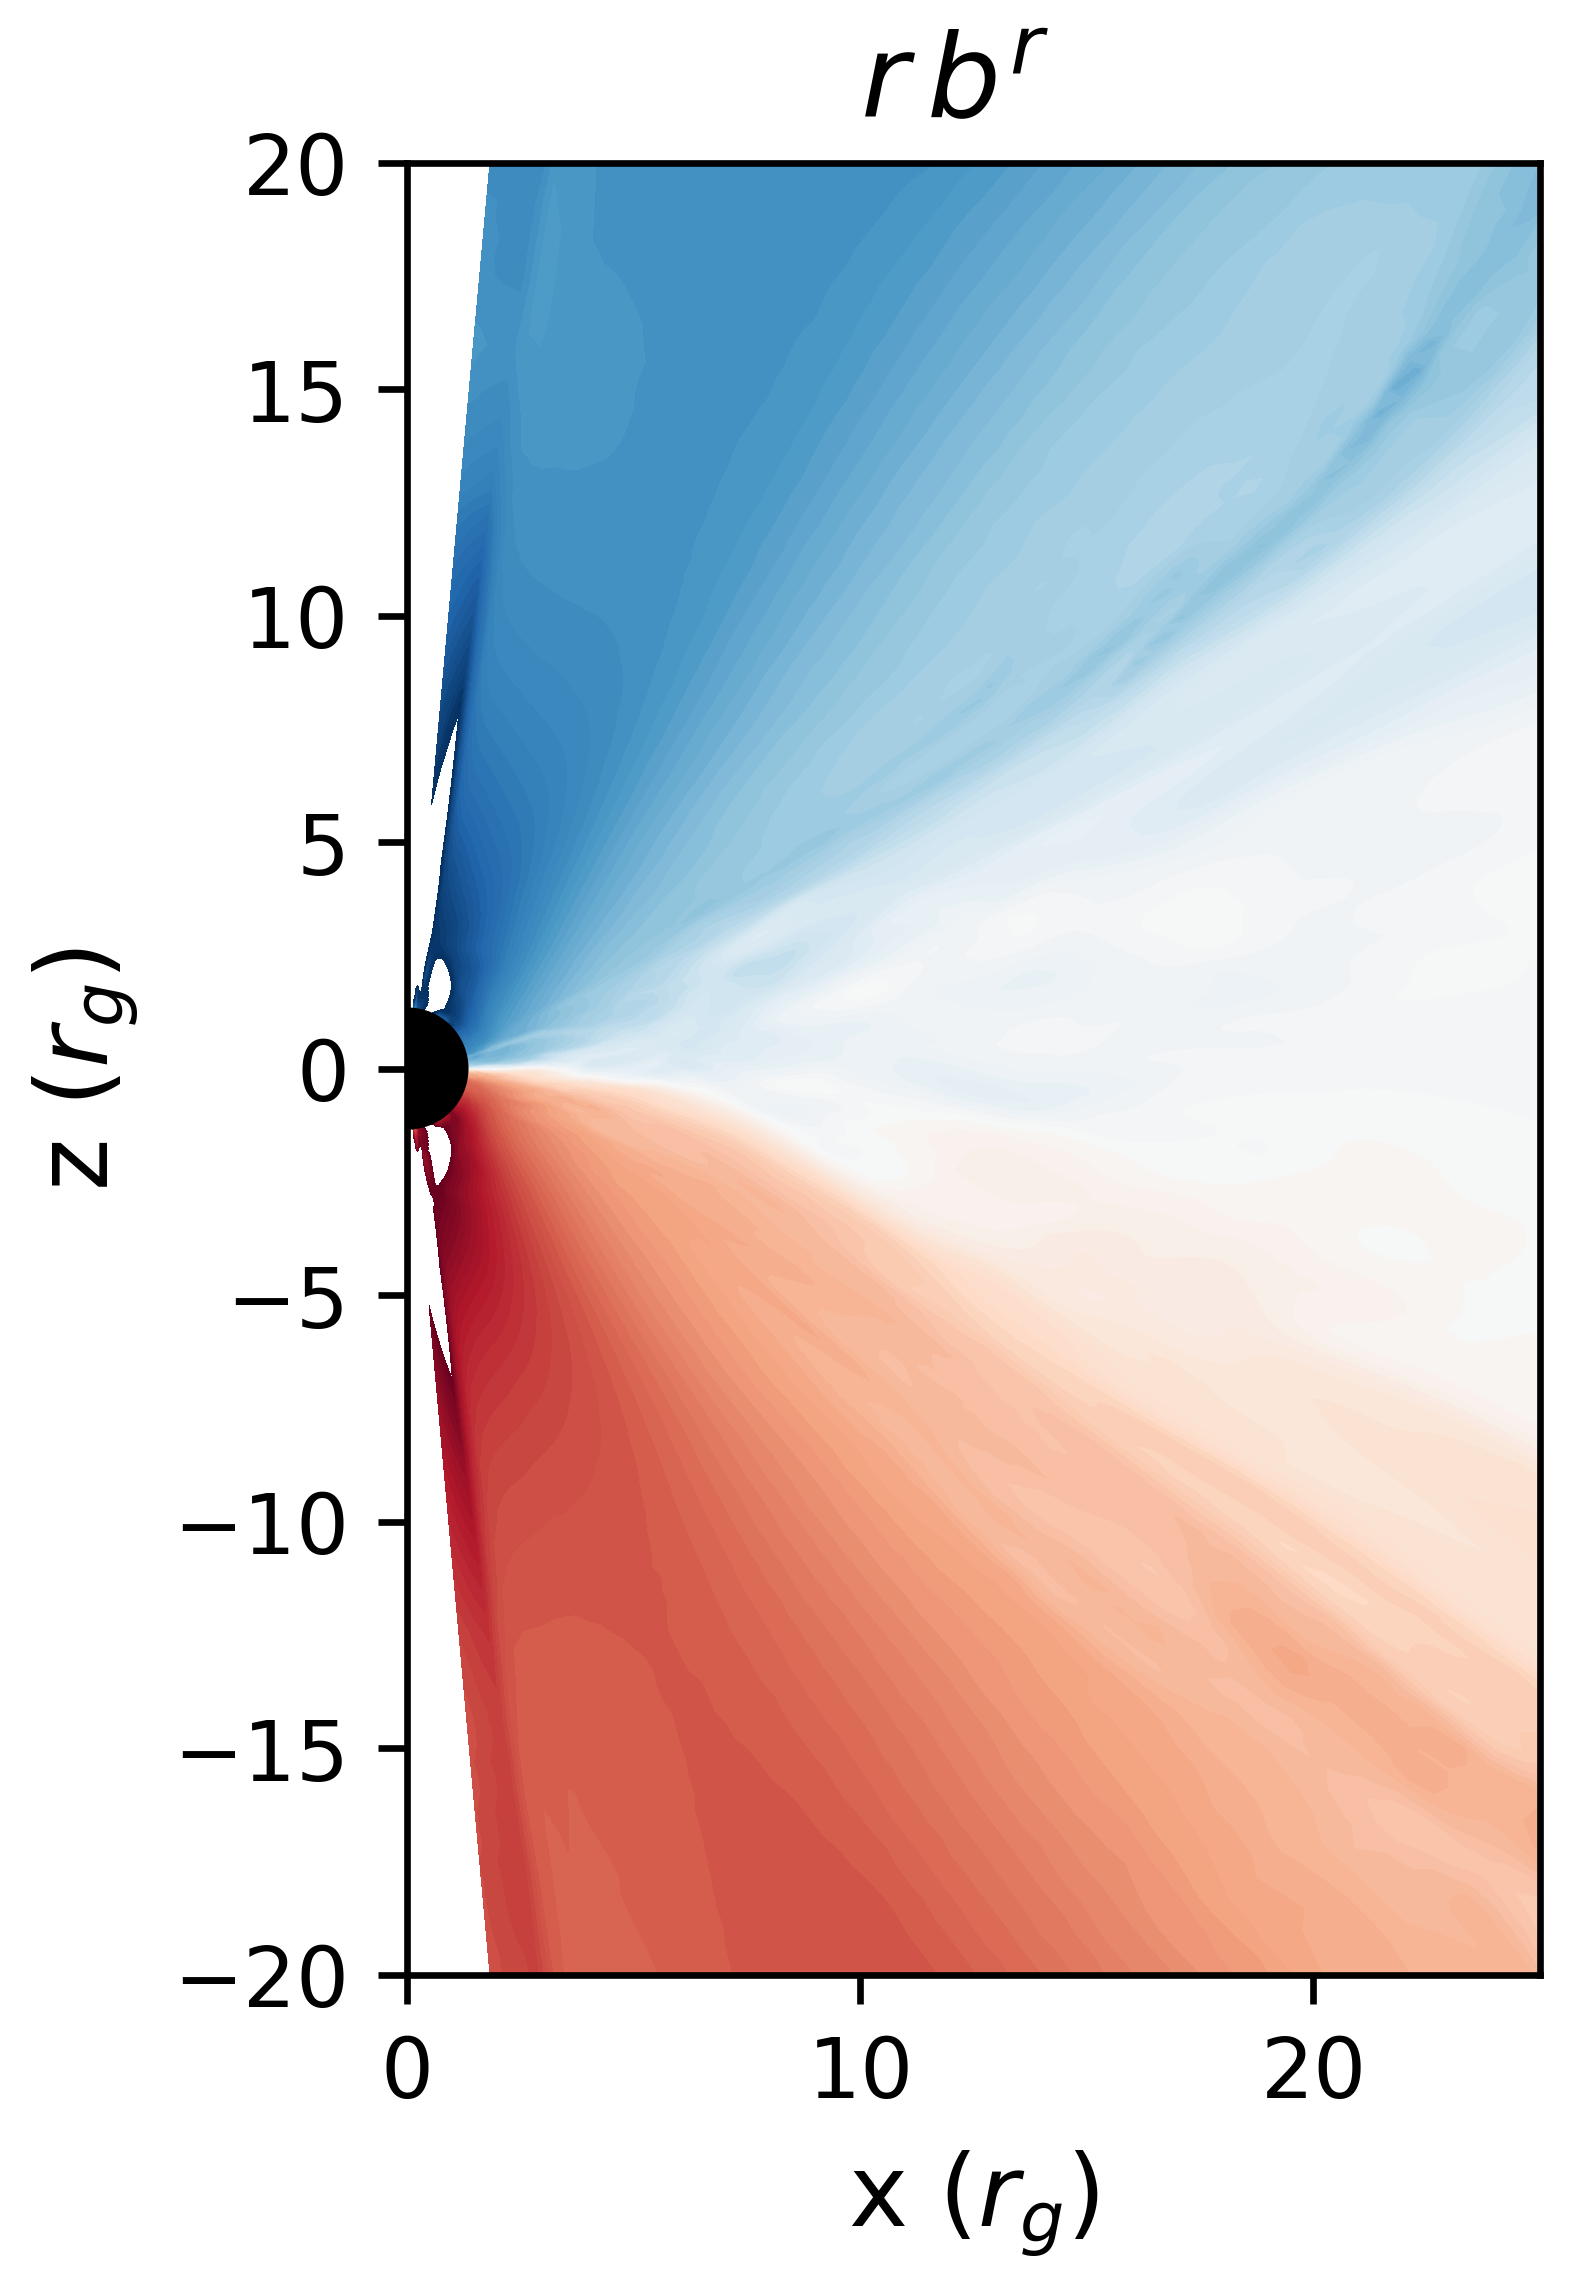
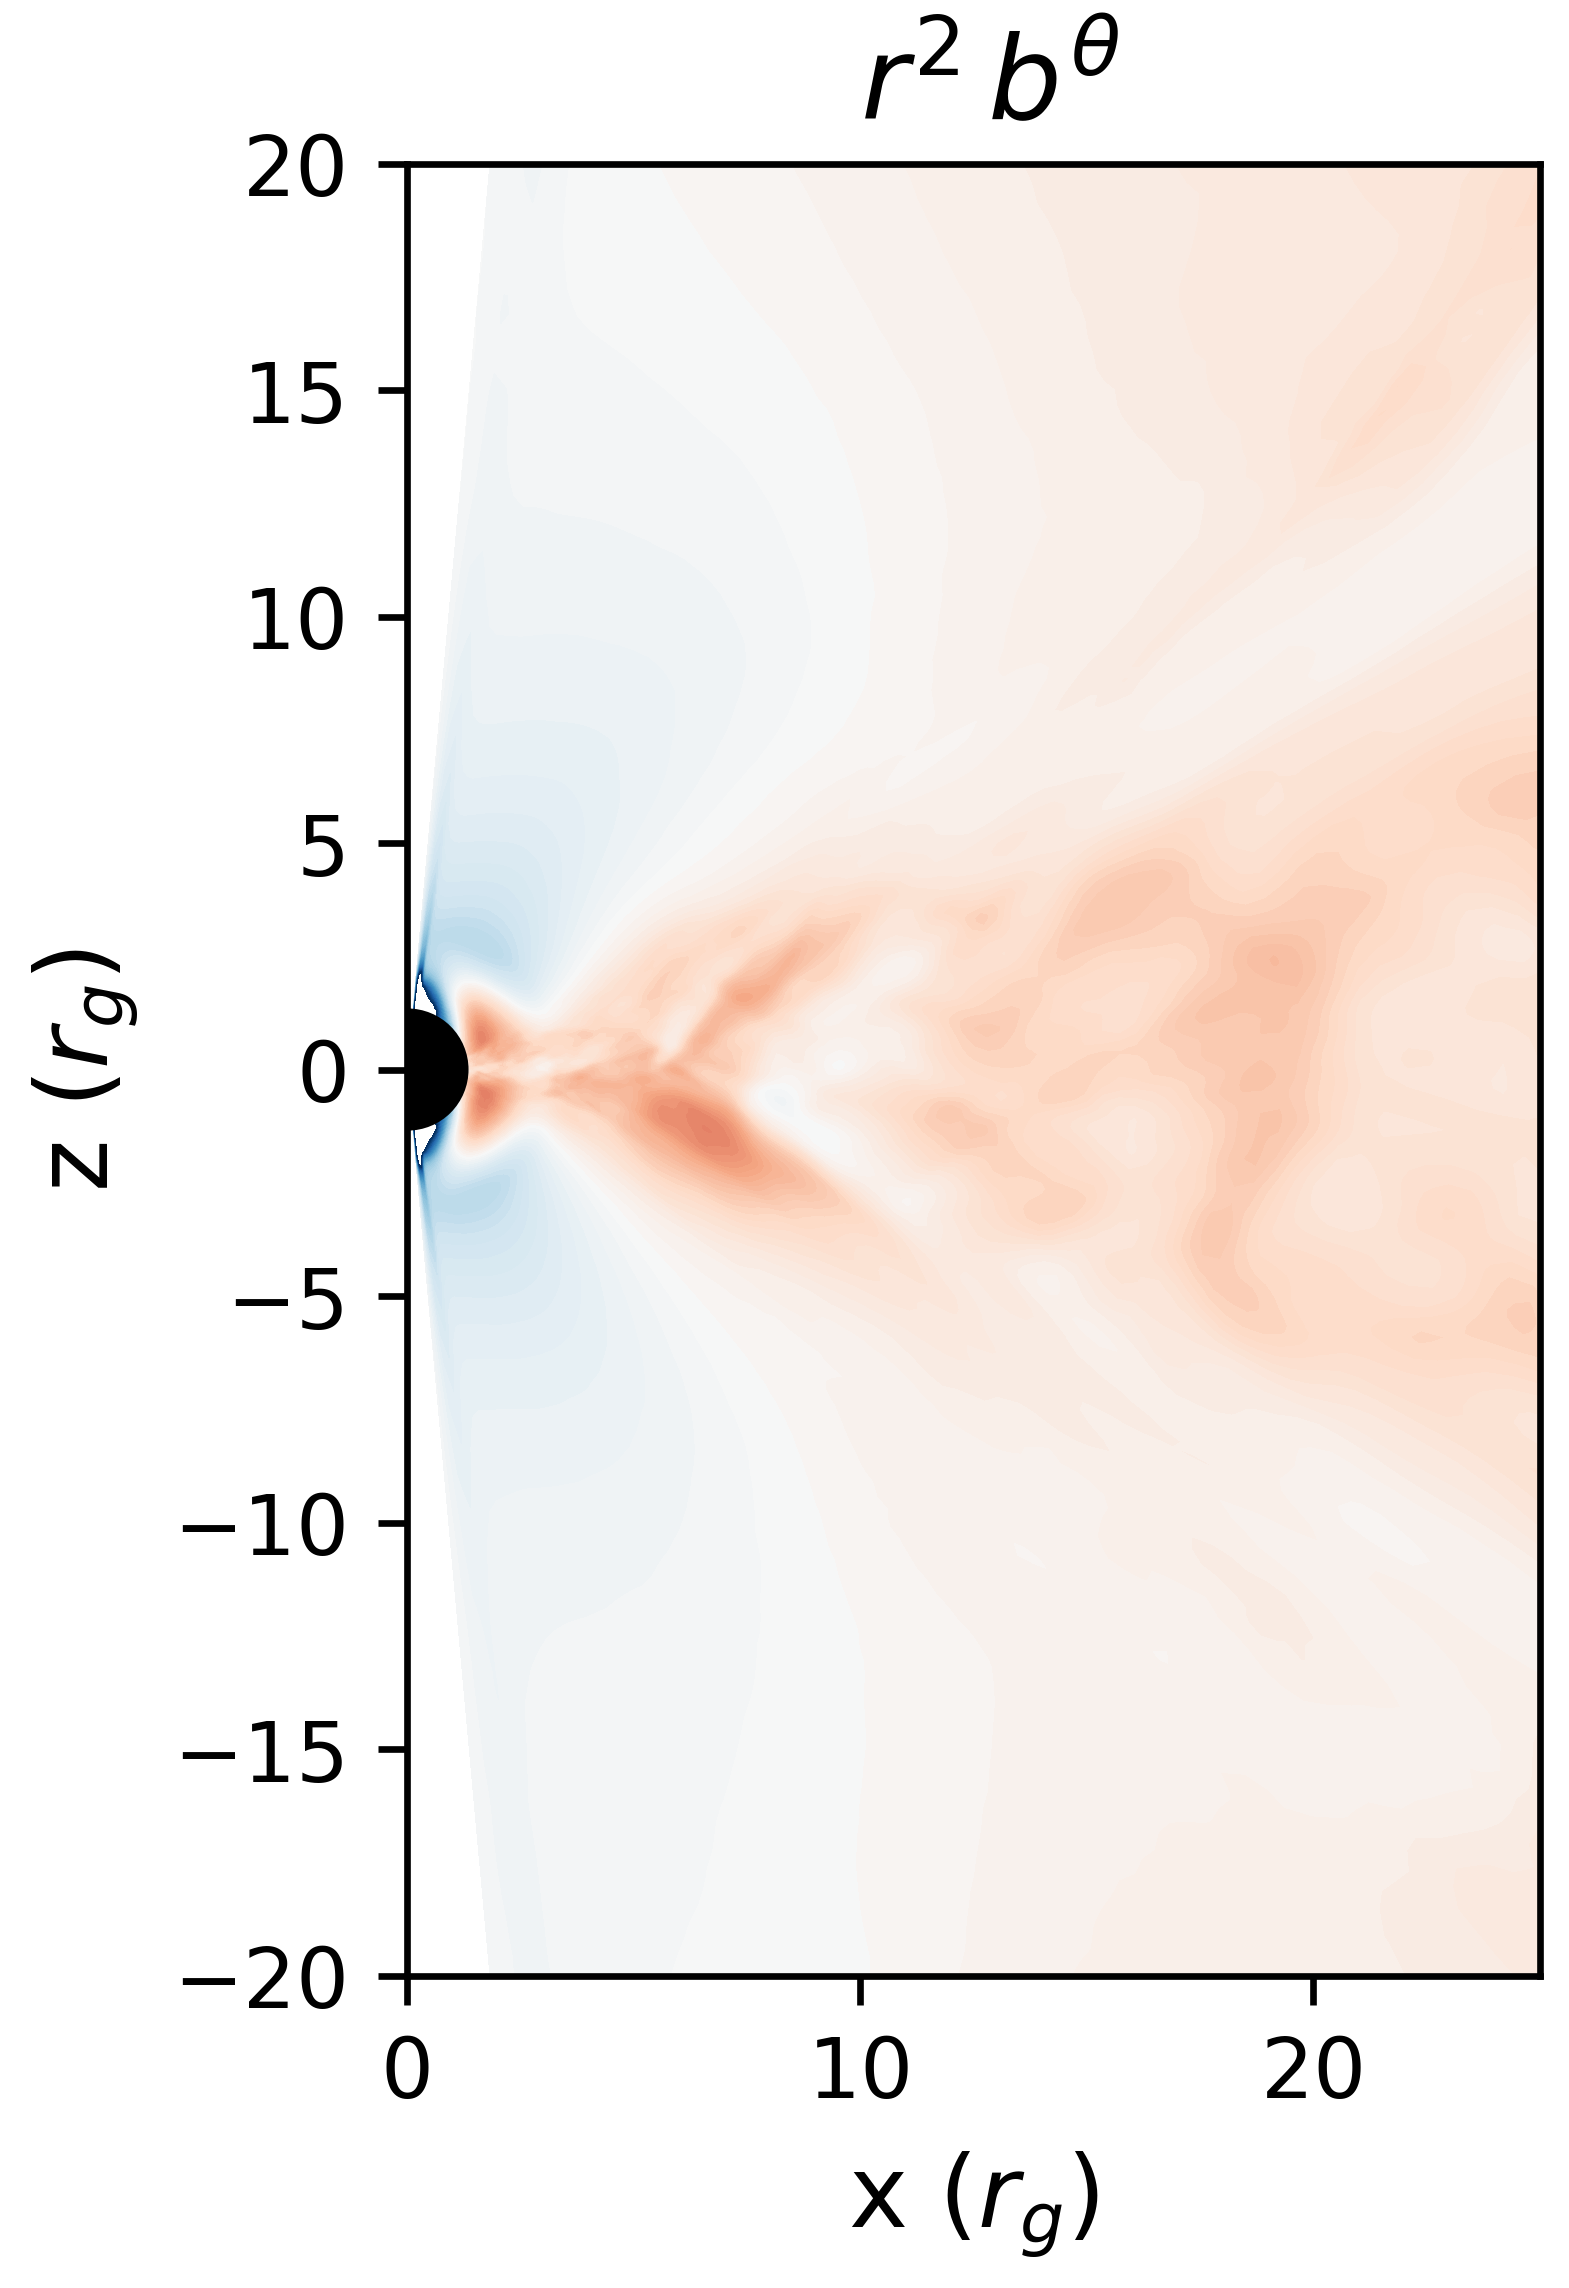
Appendix B Magnetic field structure
 |
 |
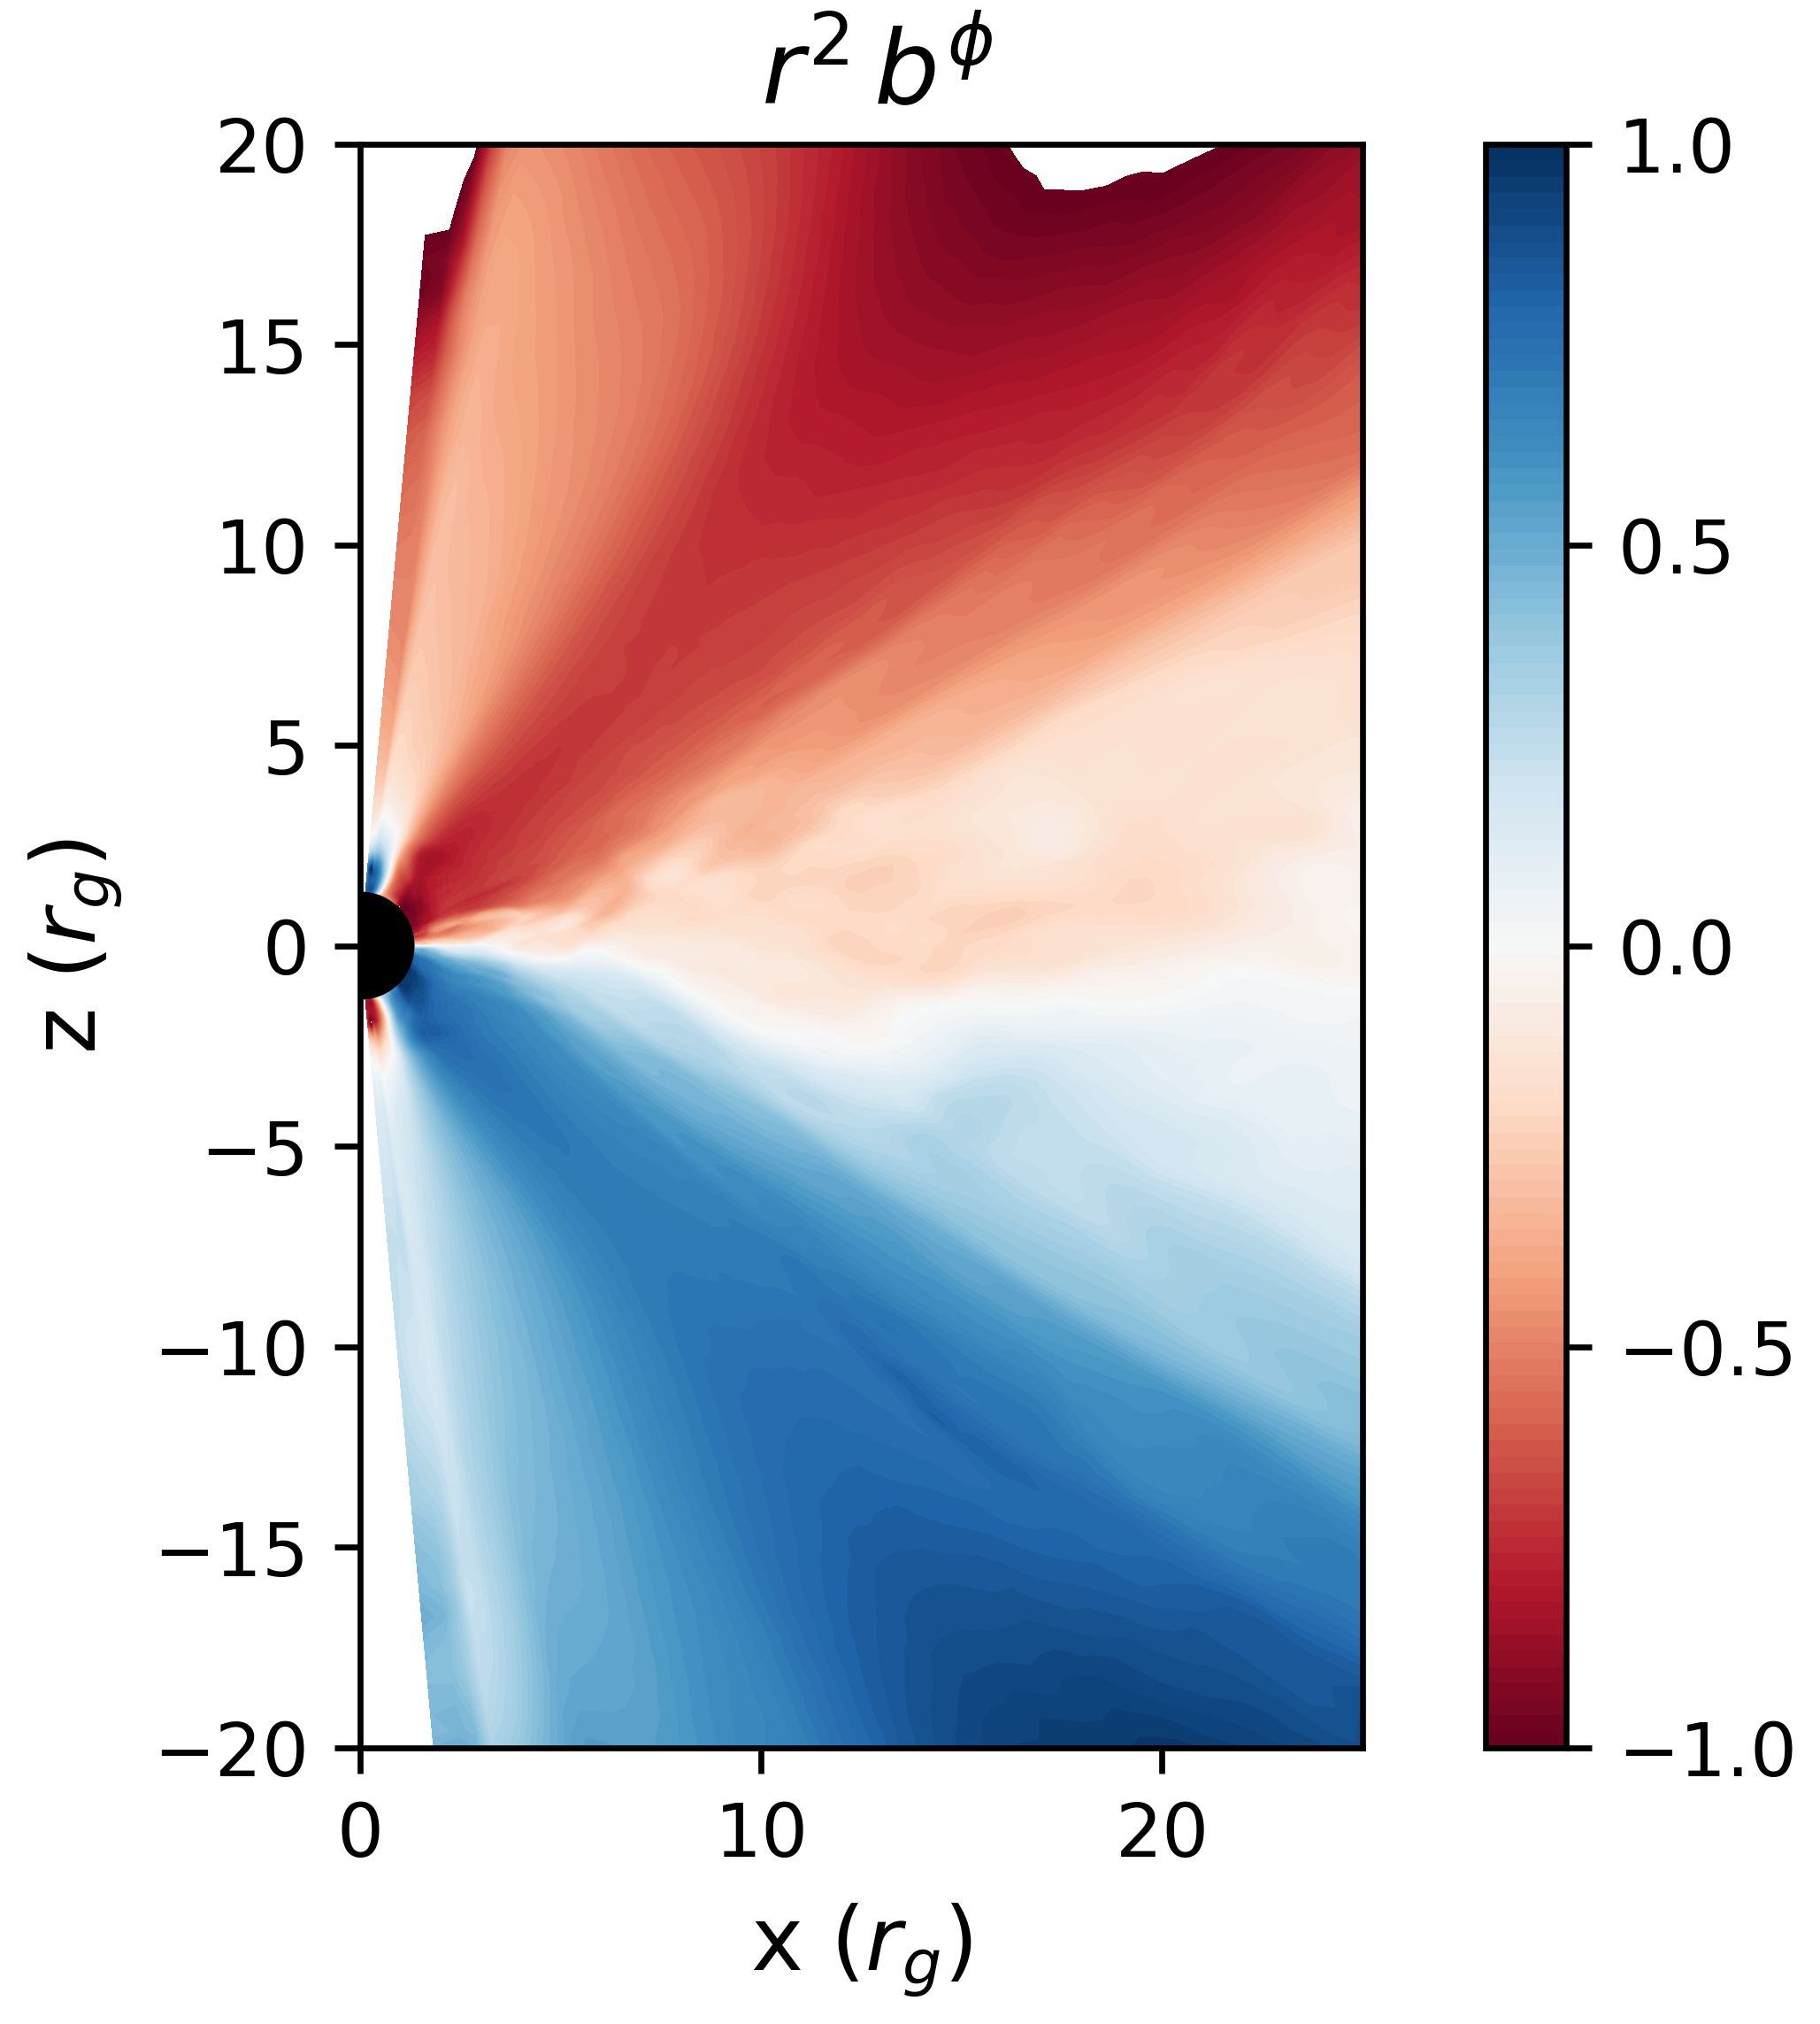 |
Figure 8 shows sample snapshots of the magnetic field structure in our simulation, at a time of during the flare studied here. Sign reversals are present in the and components, indicating the presence of a midplane current sheet. Future studies at higher resolution and/or with explicit resistivity (e.g., Nathanail et al., 2020; Ripperda et al., 2020) may be able to determine which components are responsible for the observed magnetic reconnection and measure key parameters such as the relative guide field strength.