Thermal conductivity of amorphous and crystalline GeTe thin film at high temperature: Experimental and Theoretical study
Abstract
Thermal transport properties bear a pivotal role in influencing the performance of phase change memory (PCM) devices, in which, the PCM operation involves fast and reversible phase change between amorphous and crystalline phases. In this article, we present a systematic experimental and theoretical study on the thermal conductivity of GeTe at high temperatures involving fast-change from amorphous to crystalline phase upon heating. Modulated photothermal radiometry (MPTR) is used to experimentally determine thermal conductivity of GeTe at high temperatures in both amorphous and crystalline phases. Thermal boundary resistances are accurately taken into account for experimental consideration. To develop a concrete understanding of the underlying physical mechanism, rigorous and in-depth theoretical exercises are carried out. For this, first-principles density functional methods and linearized Boltzmann transport equations (LBTE) are employed using both direct and relaxation time based approach (RTA) and compared with that of the phenomenological Slack model. The amorphous phase experimental data has been described using the minimal thermal conductivity model with sufficient precision. The theoretical estimation involving direct solution and RTA method are found to retrieve well the trend of the experimental thermal conductivity for crystalline GeTe at high temperatures despite being slightly overestimated and underestimated respectively compared to the experimental data. A rough estimate of vacancy contribution has been found to modify the direct solution in such a way that it agrees excellently with the experiment. Umklapp scattering has been determined as the significant phonon phonon scattering process. Umklapp scattering parameter has been identified for GeTe for the whole temperature range which can uniquely determine and compare umklapp scattering processes for different materials.
I Introduction
Chalcogenide alloys have been evolved as excellent candidates for the purpose of electronic nonvolatile memory storage (phase change memories-PCM)Kolobov et al. (2015); Wuttig and Yamada (2007); Wang et al. (2008); Lu et al. (2013); Campi et al. (2015, 2017); Kusiak et al. (2016). This application involves a fast and reversible alteration between amorphous and crystalline phase on heating. PCM cells consist of a nanoscale volume of a phase change (PC) material, normally a Tellurium (Te) based alloy, which undergoes a reversible change between amorphous and crystalline states, possessing a contrasting electrical resistivity and thus enabling the PCMs to be used for binary data storage Kolobov et al. (2015); Lu et al. (2013). In a PCM device, crystallization by heating the amorphous PC alloy above its crystallization temperature with electric current pulses is called SET operation while amorphization of the crystalline region by melting and quenching using higher and shorter electric current pulses is called RESET operation Kusiak et al. (2016). Germanium telluride (GeTe) is one of the promising candidates within the phase change materials due to its notably high contrast in electrical resistance as well as a stable amorphous phase with a higher crystallization temperature upon doping for the data retention process Kusiak et al. (2016); Wdowik et al. (2014). The crystallization temperature for GeTe is 180∘C (453 K) Mantovan et al. (2017); Fallica et al. (2013). GeTe has also been implemented with a superlattice configuration as GeTe-Sb2Te3 that are extensively used for their application in optical as well as PCM storage devices Boschker et al. (2018). Further, the interface between the GeTe and Sb2Te3 in the superlattice configuration is found to control the phase transition, accompanied by a reduced entropy loss, which helps in making fast and efficient PCMs Simpson et al. (2011). Doped GeTe with either N or C has been studied as a way to postpone the phase change for high temperature applications Kusiak et al. (2016); Fallica et al. (2013). The effect of doping is also found to reduce the thermal conductivity () of GeTe significantly Fallica et al. (2013). Thermal conductivity () serves as a crucial parameter for PCM operations as heat dissipation, localization and transport can significantly affect the SET/RESET processes and can therefore considerably influence the performance of PCMs in terms of cyclability, switching time and data retention.
While considerable amount of investigations have been reported on the electronic transport properties of GeTe Kagdada et al. (2018); Levin et al. (2013), very few reports on the thermal conductivity of GeTe starting from room temperature to high-temperature range are found to exist in the literature. P. Nath et al. Nath and Chopra (1974) characterized the thermal properties of thick GeTe films in both crystalline and amorphous phases. While amorphous phase showed negligible electronic contribution in the thermal conductivity (), the contribution in crystalline phases were found to be nearly 25 of the measured value of Nath and Chopra (1974) at the room temperature. E.M. Levin et al. Levin et al. (2013) observed high thermal conductivity of GeTe at 300 K and 720 K which they attributed mostly to free charge carriers. Non-equilibrium molecular dynamics simulation (NEMD) studies by Davide Campi et al. Campi et al. (2015) showed that a 3 of Ge vacancies effectively reduce the bulk lattice thermal conductivity of crystalline GeTe from 3.2 Wm-1K-1 to 1.38 Wm-1K-1 at 300 K, justifying a large spread of the experimentally measured thermal conductivities. First principles calculations Campi et al. (2017) also revealed this large variability of experimentally measured bulk thermal conductivity due to the presence of Ge vacancies. Very recently, frequency domain thermoreflectance study Warzoha et al. (2019) was carried out for determining thermal conductivity in GeTe thin films as a function of film thickness for both amorphous and crystalline phases.
Though the aforementioned studies dealt with the thermal transport of GeTe in a broader sense, there are plenty of open questions that still remain. A thorough and systematic understanding of the thermal conductivity of GeTe as a function of temperatures, ranging from room temperature to a temperature that is higher than the crystallization temperature, in the context of different scattering processes involved, is one amongst them. This systematic understanding involves multiple approaches: (a) An accurate experimental estimation of the thermal conductivity of GeTe thin films by taking into account the significant contributions of thermal boundary resistances at the boundaries of the GeTe layer. (b) A consistent and thorough theoretical investigation of the temperature variation of thermal conductivity starting from first-principles density functional theory as well as solving the linearized Boltzmann transport equations (LBTE) and (c) Using simple phenomenological models such as Slack model, which exhibit closed-form solutions that can easily identify the underlying physical mechanism involved in the thermal transport. As revealed in the study by E. Bosoni et al. Bosoni et al. (2017), thermal conductivity () calculated from the Slack model Morelli and Slack (2006), was indeed found in good agreement with the experimentally measured value of at room temperature.
In this article, we investigate the thermal conductivity of GeTe films from room temperature up to 230∘C (503 K) starting from the amorphous state. The contribution of the film thermal conductivity from the thermal resistance at the interfaces between the GeTe film and lower and upper layers are clearly discriminated in the whole temperature range. The modulated photothermal radiometry (MPTR) is employed as the experimental technique for the study. The Levenberg-Marquardt (LM) technique is used in order to identify the essential parameters from phase measurements and a model that simulates the phase within the experimental configuration. In a stand-alone exercise of theoretical understanding, thermal conductivity of GeTe is calculated starting from first-principles density functional theory (DFT) coupled with solving linearized Boltzmann transport equations (LBTE) by both direct method and relaxation time approach. In order to explain the measured change in , distinct contributions coming from various scattering mechanisms are understood. Further, phenomenological models by Slack et al. Slack and Galginaitis (1964) and Cahill et al. Cahill et al. (1992) are also employed to elucidate the physical mechanisms in the heat transport process. These systematic theoretical and experimental investigations are found to provide significant clarity and insight in understanding the variation of thermal conductivity of GeTe for a wide range of temperature. This work is organized as follows: Section II deals with experimental measurements using MPTR method. Computational details involving first principles and thermal conductivity calculations are described in Section III. Section IV presents the theoretical results followed by summary and conclusions in Section V.
II Experimental results
Amorphous GeTe films, with thicknesses of 200, 300 and 400 nm, are deposited by magnetron sputtering in an Ar atmosphere on 200 mm silicon wafers covered by a 500 nm thick SiO2 top layer. The thicknesses of the deposited films as well as their homogeneity are controlled by X-Ray Reflectivity (XRR). The detailed description of the MPTR setup had been presented elsewhere Kusiak et al. (2016). The main principle consists of front face periodic heating of the studied sample by a laser source. Since the GeTe layer is not opaque at the laser wavelength (1064 nm) and in order to prevent oxidation or evaporation of the GeTe at high temperature, a 100 nm thick platinum (Pt) layer is deposited by sputtering in order to act as an optical to thermal transducer. The periodic heat flux is thus absorbed by the Pt layer due to its high extinction coefficient at the laser wavelength, and the optical source is then transformed into heat. On the other hand, thanks to its high thermal conductivity and low thickness, the Pt layer is assumed to be isothermal for the frequency range swept during the experiment. The thermal response of the sample at the location of the heating area by the laser is measured using an infrared detector. As the temperature change is low at the heated area, the linearity assumption of heat transfer is fulfilled and the emitted infrared radiation from the sample surface is linearly proportional to the temperature at the heated area. A lock-in amplifier is used to extract the amplitude and the phase from the signal of the IR detector as a function of the frequency. The thermal properties are thus obtained by fitting of the experimental phase by means of a thermal model which allows to describe the heat transfer within the sample. According to the film thickness and modulation frequency, the transient behaviour fulfils the Fourier regime of heat conduction. Since the heated area is much larger (laser spot of 2 mm in diameter) than the film thickness, the one-dimensional heat transfer is considered. The explored frequency range in our experiment is 1-5 kHz. At angular frequency , the phase is defined as , where the transfer function denotes the ratio between the periodic temperature at the heated area and as:
| (1) |
Parameters and are calculated from the quadrupoles formalism Maillet et al. (2000) as:
| (2) |
Where
| (3) | |||||
| (4) |
With , where (), , and are the effective thermal diffusivity, effective thermal conductivity, specific heat per unit volume and thickness of layer respectively. For the SiO2 and Si layers, the effective thermal conductivity is equal to the real thermal conductivity, i.e., and . On the other hand, the effective thermal resistance for GeTe () accounts with the intrinsic thermal conductivity of the GeTe layer and the thermal resistance at the two interfaces with Pt and SiO2 as:
| (5) |
where is the total interfacial thermal resistance. It must be precisely mentioned here that the GeTe layer cannot be considered as thermally resistive for the highest frequency values and especially for the high thickness of the layer. This is the reason why we consider heat diffusion within the quadrupole model. This can be easily demonstrated by calculating the Fourier related quantity , using the known value of at room temperature and comparing it to the thickness . Considering the measured value of the phase at different frequencies , the value of is estimated by minimizing the objective function , where and are vectors with length , related respectively to the measured and simulated phase at all the investigated frequencies. This minimization is achieved by implementing the Lavenberg-Marquardt (LM) algorithm Aster et al. (2019). Then, the effective thermal resistance of GeTe thin film is plotted as a function of film thicknesses () for different temperatures as shown in Fig 1.
A linear regression is found that allows to extract
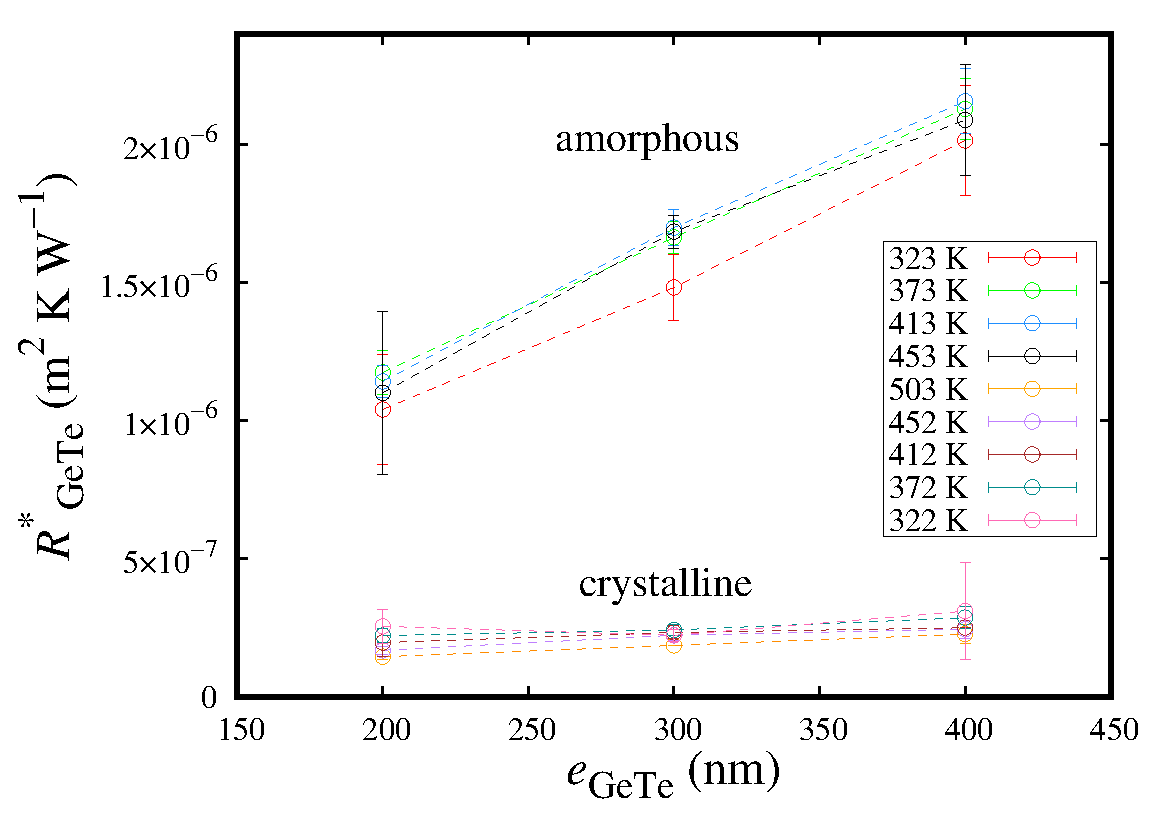
from the slope (shown in Fig 2.(b)) and the sum of the two interfacial resistances by extrapolation to (shown in Fig 2.(a)). The standard deviation of is calculated from the covariance matrix at the end of the iterative minimization process as: where the covariance matrix is: with vector with denoting the sensitivity function of the phase according to calculated for where is the optimal value for . Finally the residual vector is . The standard deviation on is obtained starting from by application of the law of propagation of uncertainties. Finally, the standard deviations on and are expressed according to residual variance of linear fitting on points. We mention here that the grain size of GeTe at the time of the crystallization is found to be 40 nm as reported in our earlier work Kusiak et al. (2016) and it increases while increasing the annealed temperature (Fig 4 in Kusiak et al. (2016)). Since the MPTR investigates a very large area, it is thus expected to measure the average thermal conductivity that is given by + , where = + , where, and stand for the lattice thermal conductivities along hexagonal a and c axes respectively.
The phase change occurs well within the range of the expected temperature ( 180∘C = 453 K). We note that for amorphous state is difficult to estimate because of the very low values of . For crystalline phase, we retrieve a consistent behavior with the value of being increased as the temperature is lowered (Fig 2.(a)). In the high temperature regime, diffuse mismatch model (DMM) has been found to describe quite satisfactorily for crystalline solids Reifenberg et al. (2010). According to DMM model,
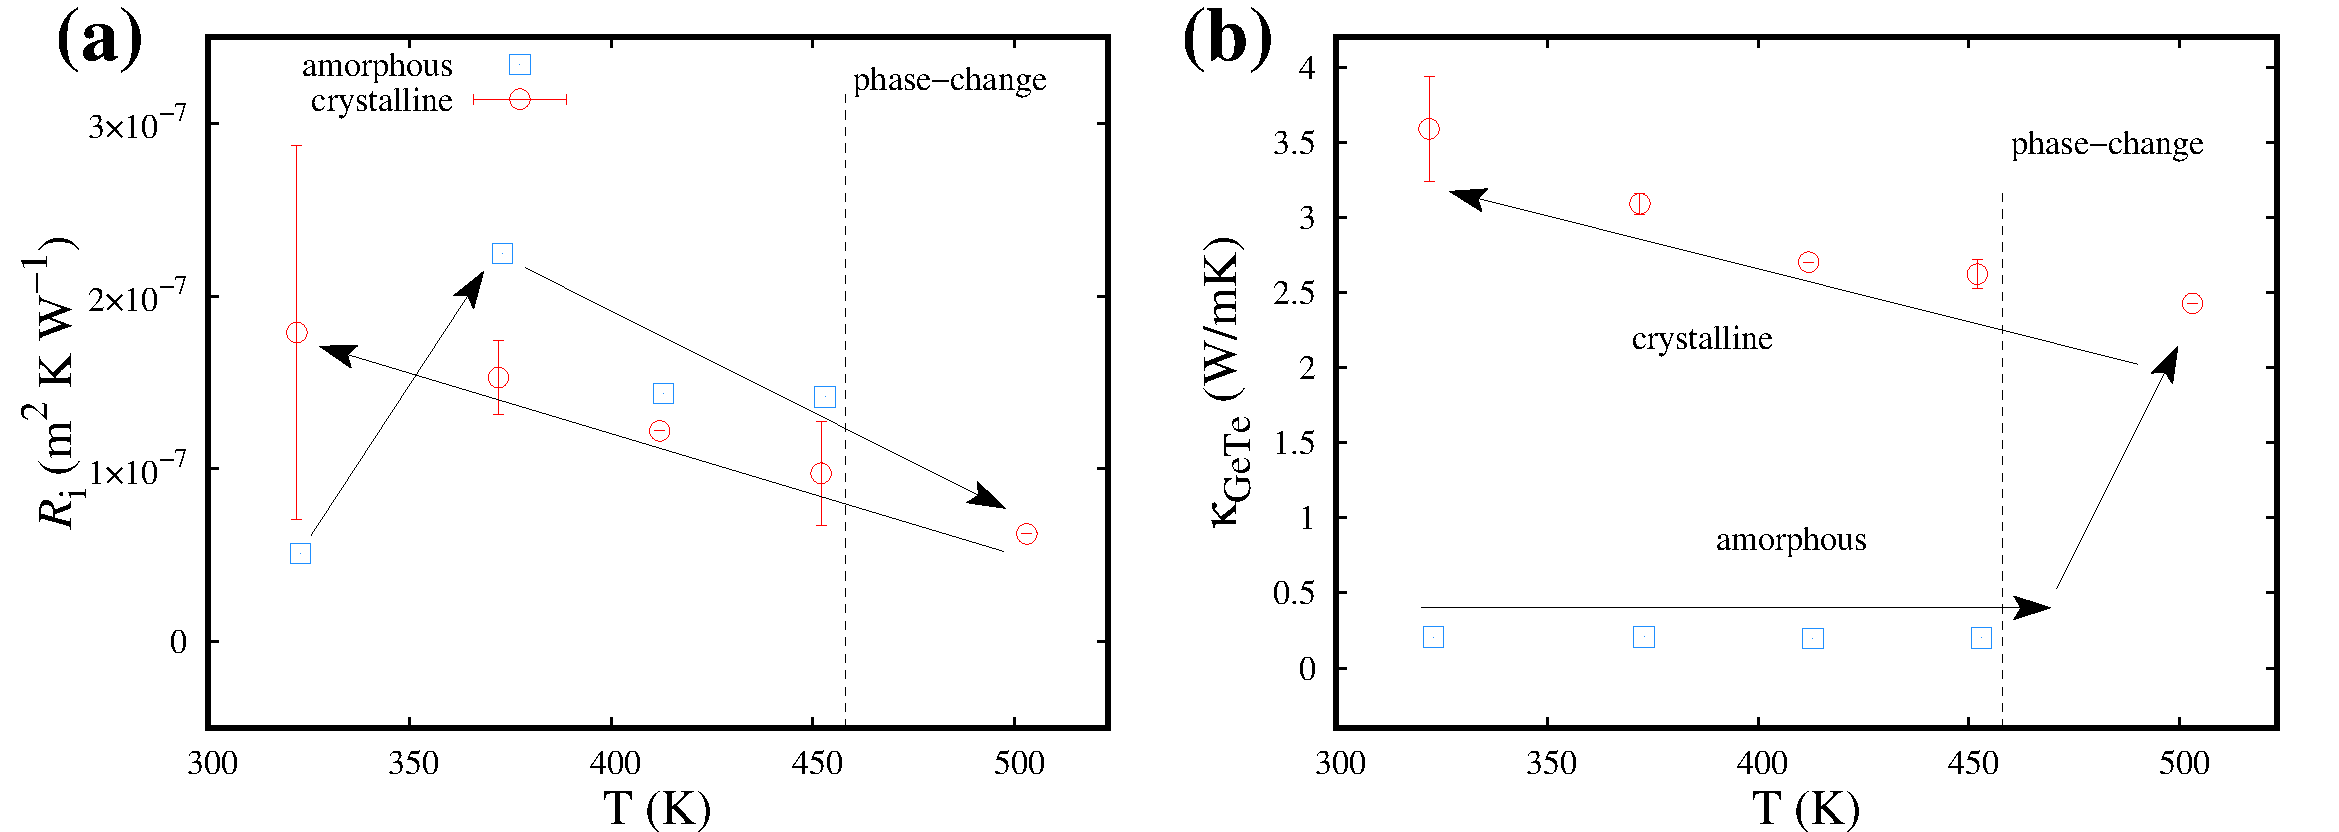
asymptotic behavior of at high temperatures depends inversely on the heat capacity as Reifenberg et al. (2010)
| (6) |
where, is the heat capacity of material 1 at and is the velocity of phonon mode in material . Here all the parameters except are temperature independent. Since increases with temperature, the above relation shows that decreases with increasing temperature. In Fig 2.(b), we observe a monotonically decreasing trend of as a function of T. Indeed, at high temperatures (T ), where is Debye temperature, umklapp scattering is the dominating phonon-phonon scattering process associated with high momentum change in phonon-phonon collisions Kittel (1986). Glen A. Slack et al.Slack and Galginaitis (1964) approximated umklapp relaxation time as = which becomes = when T . This relaxation time estimation leads to 1/ 1/.
III Computational details
Phonon density of states (PDOS) of crystalline GeTe (space group R3m) has been calculated employing the density functional perturbation theory (DFPT) Baroni et al. (2001) using the QUANTUM-ESPRESSO Giannozzi et al. (2009) suite of programs. As the first step, self-consistent calculations, within the framework of density functional theory (DFT), are carried out to compute the total ground state energy of the crystalline R3m-GeTe. For this purpose, Perdew-Burke-Ernzerhof (PBE) Perdew et al. (1996) generalized gradient approximation (GGA) is used as the exchange-correlation functional. The spin-orbit interaction has been ignored due to its negligible effects on the vibrational features of GeTe as mentioned in literature Shaltaf et al. (2009); Campi et al. (2017). Electron-ion interactions are represented by pseudopotentials using the framework of projector-augmented-wave (PAW) method Blochl (1994). The Kohn-Sham (KS) orbitals are expanded in a plane-wave (PW) basis with a kinetic cutoff of 60 Ry and a charge density cutoff of 240 Ry as prescribed by the pseudopotentials of Ge and Te. The Brillouin zone integration for self consistent electron density calculations are performed using a 121212 Monkhorst-Pack (MP) Monkhorst and Pack (1976) k-point grid.
For phonon calculations, a hexagonal 221 supercell, consisting of 24 atoms, is used. A representative
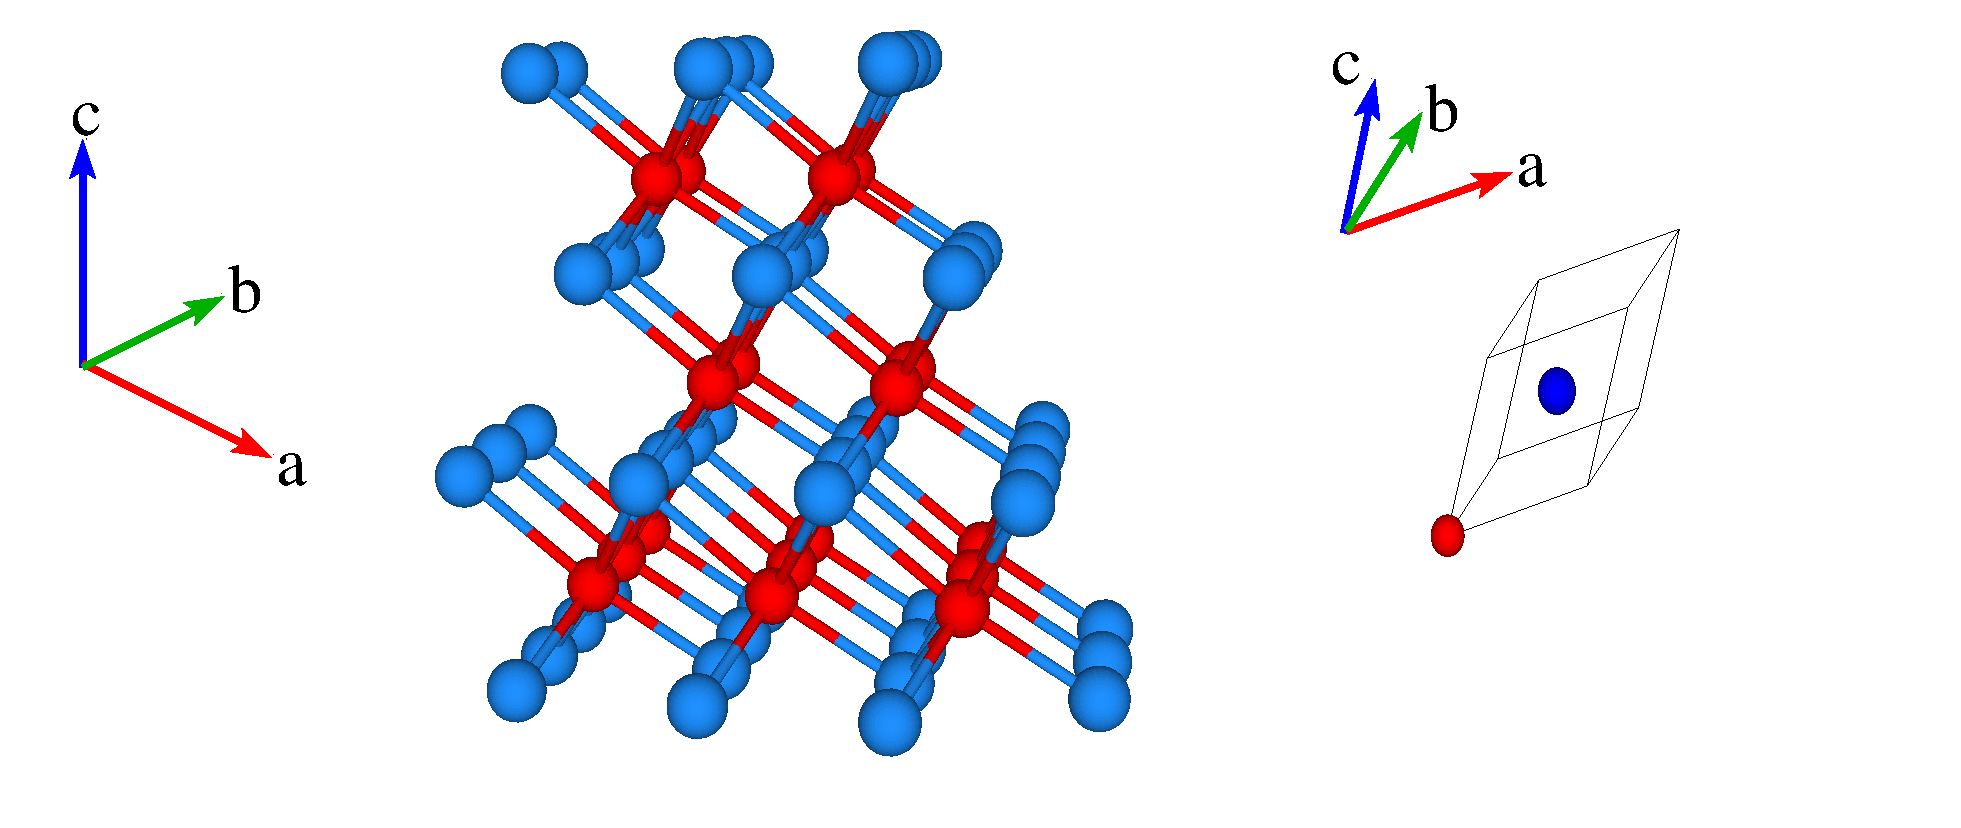
structure of crystalline GeTe as stacking bilayers is shown in Fig 3. To study the phonon density of states, linear response theory is applied via DFPT, to the Kohn-Sham equations to solve the electronic charge density () under small perturbations. As the force constants are connected to the derivatives of with respect to atomic displacements, harmonic force constants are calculated by diagonalizing the dynamical matrix in reciprocal space. Phonon density of states (PDOS) are then evaluated by the inverse Fourier transform of the interatomic force constants (IFC) to real space from that of the dynamical matrices, using a uniform 555 grid of q-vectors.
The thermal conductivity of GeTe can be separated into two distinct contributions, one from electronic transport and the other from the phonon transport or the lattice contribution, such that = + , where is the lattice thermal conductivity and is the electronic thermal conductivity. has been obtained from first-principles calculations by solving semi-classical Boltzmann transport equation (BTE) for electrons. Constant relaxation time approximation (CRTA) and rigid band approximation (RBA) are employed as implemented in BoltzTraP code Madsen and Singh (2006). The energy projected conductivity tensor is calculated using:
| (7) |
Therefore, the transport tensors, or more specifically the electrical conductivity tensor in this study, can be obtained from
| (8) |
where, N is the number of k-points sampled, is the band index, are band energies, is the volume of unit cell, is the Fermi distribution function and is the chemical potential. The code computes the Fermi integrals and returns the transport coefficients for different temperature and Fermi levels.
For getting lattice thermal conductivity , linearized phonon Boltzmann transport equation (LBTE) is solved using both direct method introduced by L. Chaput et al. Chaput (2013) as well as the single mode relaxation time approximation or relaxation time approximation (RTA) employing PHONO3PY Togo et al. (2015) software package. Initially, the supercell approach with finite displacement of 0.03 Å is applied to calculate the harmonic (second order) and the anharmonic (third order) force constants, given by
| (9) |
and
| (10) |
respectively. First principles calculations using QUANTUM-ESPRESSO Giannozzi et al. (2009) are implemented to calculate the forces acting on atoms in supercells. Using finite difference method, harmonic force constants are approximated as Togo et al. (2015)
| (11) |
where F[; u()] is atomic force computed at r( ) with an atomic displacement u() in a supercell. Similarly, anharmonic force constants are obtained usingTogo et al. (2015)
| (12) |
where F[; u(), u( )] is atomic force computed at r( ) with a pair of atomic displacements u() and u() in a supercell. These two sets of linear equations are solved using Moore-Penrose pseudoinverse as is implemented in PHONO3PY Togo et al. (2015).
We use a 222 supercell of GeTe for our first-principles calculations of anharmonic force constants. Using the supercell and finite displacement approach, 228 supercells are obtained, having different pairs of displaced atoms, for the calculations for the anharmonic force constants. A larger 333 supercell is employed for calculating the harmonic force constants. For all the supercell force calculations, the reciprocal space is sampled using a 333 k-sampling MP mesh shifted by a half grid distances along all three directions from - point. The total energy convergence threshold has been kept at 10-10 a.u. for supercell calculations. For lattice thermal conductivity calculations employing both the direct solution of LBTE and that of the RTA, q-mesh of 242424 are used. The imaginary part of self-energy have been calculated using tetrahedron method from which phonon lifetimes are obtained .
IV Theoretical results and Discussions
IV.1 Phonon density of states
The structural parameters are optimized via DFT calculations and the optimized lattice parameter (a = 4.23 Å) and unit cell volume (56.26 Å3) of GeTe, are found to be quite consistent with the values presented in literature Campi et al. (2017); Jain et al. (2013). It is quite well established that at normal conditions GeTe crystallizes in trigonal phase (space group R3m) with 2 atoms per unit cell. This structure gives rise to a 3+3 coordination of Ge with three short stronger intrabilayer bonds and three long weaker interbilayer bonds Campi et al. (2015, 2017). The bond lengths (shorter bonds = 2.85 Å, longer bonds = 3.25 Å) are also found to be consistent with the studies done by Davide Campi et al. Campi et al. (2017).
To investigate the effect of phonons in the heat transfer processes, we study the phonon density of states and the
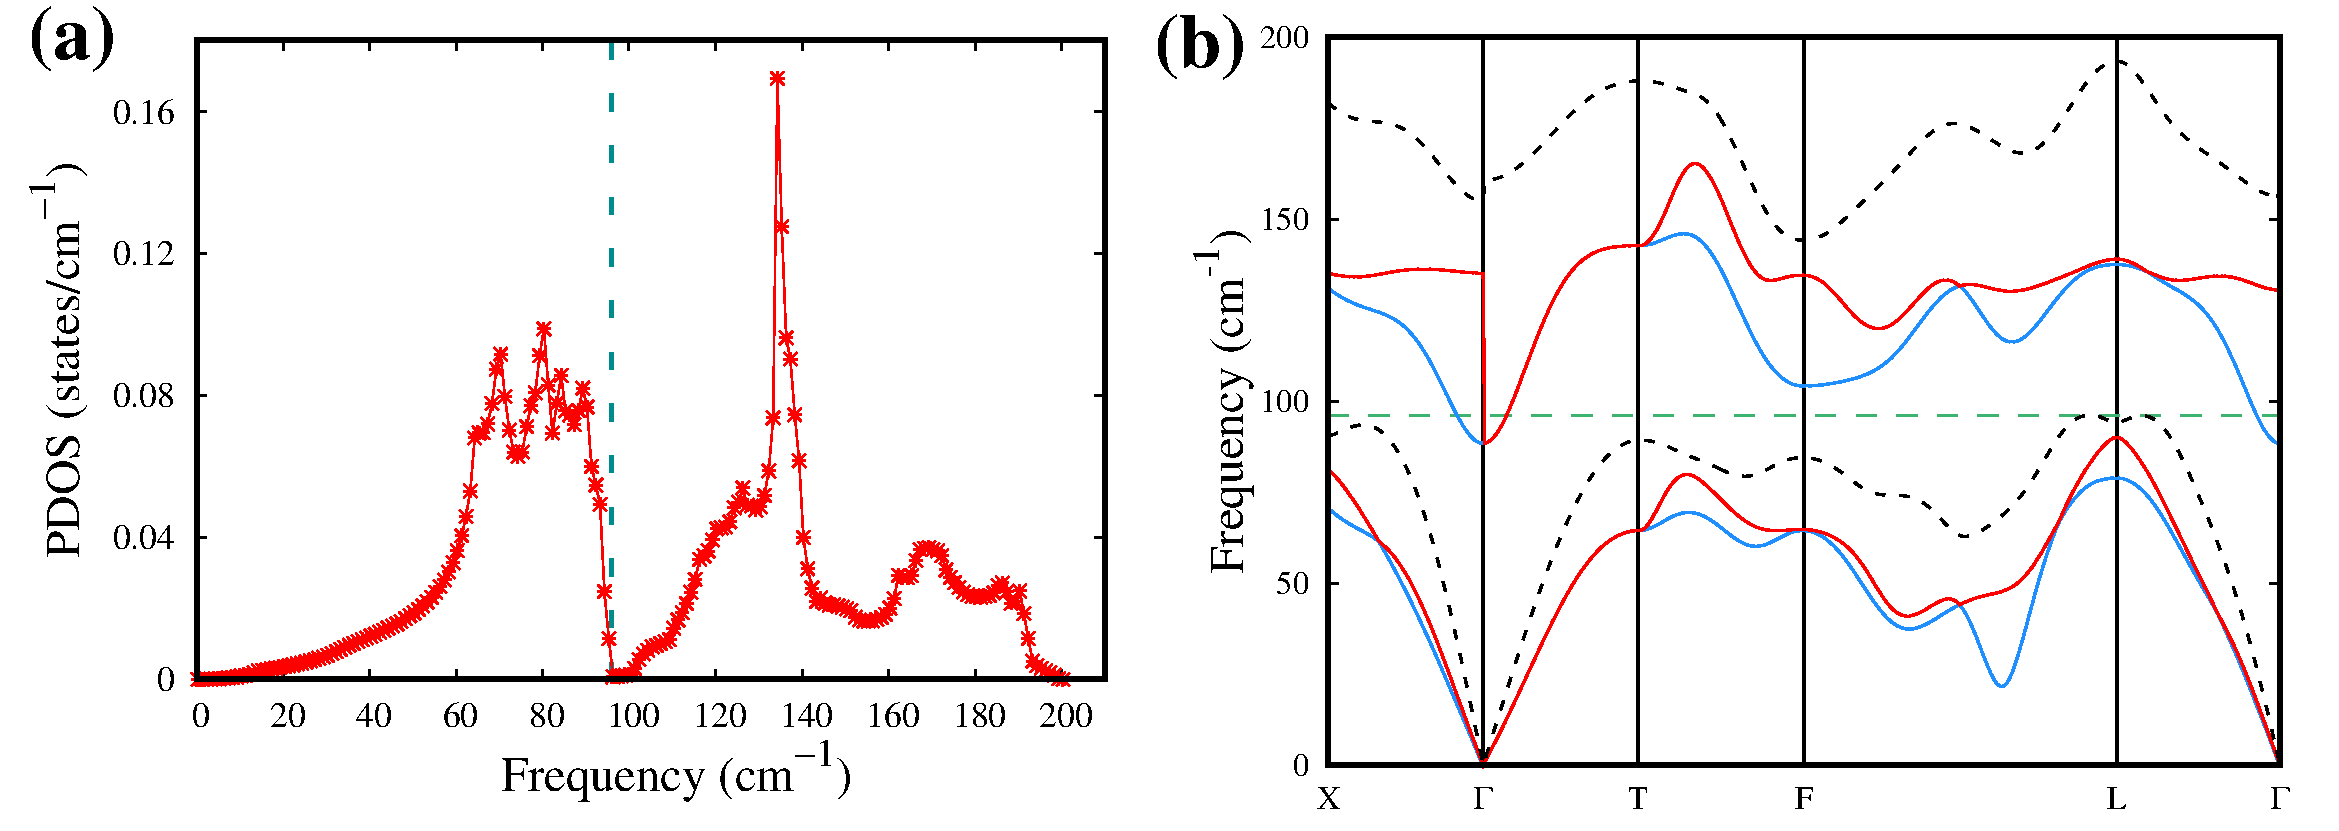
dispersion relation of crystalline rhombohedral (R3m) GeTe. Figure 4.(a) and (b) show the phonon density of states and the phonon dispersion relation of undoped crystalline (R3m) GeTe, calculated at ground state. The dashed line in Fig 4.(a) serves as a separator between the acoustic and optical contribution of phonons. The acoustic phonons extend from 0 to 96 cm-1 (= 2.88 THz) in the frequency domain which is consistent with the observations of Urszula D. Wdowik et al. Wdowik et al. (2014). The frequencies of the two most prominent peaks in PDOS corresponding to acoustic ( 80 cm-1 = 2.40 THz) and optical phonons ( 140 cm-1 = 4.20 THz) respectively, are also found to be close to the values observed by Kwangsik Jeong et al. Jeong et al. (2017). Phonon dispersion relation (Fig 4.(b)) along the high symmetry direction in the Brillouin zone (BZ) also shows similar trends to that of the earlier works Wdowik et al. (2014); Bosoni et al. (2017). We observe the signature of LO-TO splitting as the discontinuities of the phonon dispersion at the point arising from the long range Coulomb interactions Wdowik et al. (2014); Bosoni et al. (2017). The approximate separator between acoustic and optical modes at 96 cm-1 is also shown by a horizontal dashed line in the phonon dispersion relation (Fig 4.(b)). Except a small and negligible contribution of transverse optical modes at the point, all frequencies 96 cm-1 contribute to the acoustic modes.
IV.2 Electronic thermal conductivity
The calculation of the electronic thermal conductivity rests generally on the use of the Wiedemann-Franz law where is the Lorenz number, is the temperature and is the electrical conductivity. Crystalline GeTe is a p-type degenerate semiconductor Bahl and Chopra (1970); Nath and Chopra (1974) with a high hole concentration and the Fermi level lying well inside the valence band that holds the charge carriers. Therefore it behaves similar to a metal. In that case, the value for ( is the Boltzmann constant and is the electron charge) had generally been employed in most of the research works Nath and Chopra (1974). However, for highly doped materials at temperature higher than the Debye temperature , the Hall mobility depends on the temperature as , where is the scattering mechanism parameter, and decreases as decreases with increasing temperature. Therefore, it is shown that the Lorenz number is given by Goldsmid (2010); Gelbstein et al. (2010):
| (13) |
where is the reduced Fermi energy for -type semiconductors and when scattering by acoustic phonons is dominant Gelbstein et al. (2010). The Fermi integral is defined as: .
| T (K) | () | L (W ) | = (W/mK) |
|---|---|---|---|
| 322 | 9.78 | 2.40 | 0.76 |
| 372 | 9.35 | 2.33 | 0.81 |
| 412 | 9.14 | 2.27 | 0.85 |
| 452 | 8.84 | 2.20 | 0.88 |
| 503 | 8.45 | 2.13 | 0.91 |
Following the method adopted by Gelbstein et al. Gelbstein et al. (2010), E. M. Levin and co authors Levin et al. (2013) obtained that for crystalline GeTe varies between at 320 K and at 720 K. Using this method, we calculate the variation of for GeTe as a function of temperature within the investigated range in the present study and we report the results in Table 1.
The electrical resistivity of GeTe films has been measured experimentally using the Van der Pauw technique and is found to be at the room temperature (300 K), which corresponds for the hole concentration to be 6.24 1019 cm-3. The constant relaxation time approximation (CRTA) with a constant electronic relaxation time of 10-14s is used following the work of S. K. Bahl et al. Bahl and Chopra (1970). After identifying the hole concentration, we compute the electrical conductivity () by using DFT and solving the Boltzmann transport equation (BTE) for electrons, as implemented in the BoltzTaP code Madsen and Singh (2006) for the given hole concentration at different temperatures. Considering the values for , the calculated electronic thermal conductivity varies linearly from 0.76 W/mK at 322 K ( at 322 K) to 0.91 W/mK at 503 K ( at 503 K) (Table 1). These results are consistent with the experimental ones by R. Fallica et al. Fallica et al. (2013).
IV.3 Lattice thermal conductivity
In Fig 2.(b), total thermal conductivity of GeTe is seen to manifest a fast change process with gradually increasing temperature, where a phase change from amorphous to crystalline phase is found to occur 180∘C or 453 K. We first focus on the thermal conductivity of the amorphous phase of GeTe. Figure 5 shows lower values of for amorphous phase compared to that of the crystalline phase. The values of in amorphous phase are also observed to be almost constant throughout the temperature range studied in this work. Theoretically, the minimal thermal conductivity model derived by Cahill et al. Cahill et al. (1992) allows one to calculate for the amorphous materials as:
| (14) |
where is the number of phonons per unit volume (which can also be calculated more rigorously from the phonon DOS apart from using the values of Table 2), is the speed of sound calculated as Pereira et al. (2013) and is the Debye temperature per branch. When , this relation simplifies as
| (15) |
Using the required parameter values from Table 2, the minimal thermal conductivity () is found to be consistent with the experimental data in amorphous phase considering the error bars involved in the experimental measurements (Fig 5). The reasonable agreement between the experimental data and based on Cahill model indicates that the dominant thermal transport in the amorphous GeTe occurs in short length scales Kaviany (2014) between neighboring vibrating entities owing to the disorder present in it.
We then investigate the phonon contributions to the total thermal conductivity of crystalline GeTe. In order to evaluate the lattice thermal conductivity () through the direct solution of LBTE, the method developed by L. Chaput Chaput (2013) is adopted. According to this method, lattice thermal conductivity is given as Chaput (2013)
| (16) |
where, is the Moore-Penrose inverse of the collision matrix , given by Chaput (2013); Togo et al. (2015)
| (17) |
Here, denotes the interaction strength between three phonon , and scattering Togo et al. (2015). However, adopting the relaxation time approximation (RTA) in solving LBTE, lattice thermal conductivity tensor can be written in a convenient and closed form as Fugallo et al. (2013); Togo et al. (2015)
| GeTe (R3m) | Parameter description(s) | Value(s) |
|---|---|---|
| [Å3] | Volume of the elementary cell | 56.26 Jain et al. (2013),[calculated from DFT] |
| [kg m-3] | Density | 5910 Jain et al. (2013),[calculated from DFT] |
| [g mol-1] | Molar mass of Ge | 72.63 |
| [g mol-1] | Molar mass of Te | 127.6 |
| [K] | Debye temperature | 180 Campi et al. (2017) |
| [m s-1] | Phonon group velocity (longitudinal) | 2500 Pereira et al. (2013) |
| [m s-1] | Phonon group velocity (Transverse) | 1750 Pereira et al. (2013) |
| Gruneisen parameter | 1.7 Bosoni et al. (2017) | |
| [eV] | Fermi energy | 7.2552 [calculated from DFT] |
| [kg-1] | number of phonon per unit mass | [calculated from PDOS] |
| (18) |
where is the number of unit cells and is the volume of unit cell. The phonon modes (q, ) comprising wave vector q and branch are denoted with . The modal heat capacity if given by
| (19) |
Here, denotes temperature, is reduced Planck constant and is the Boltzmann constant. and represent phonon group velocity and phonon lifetime respectively. We consider three scattering processes, namely normal, umklapp and isotope, denoted by N, U and I respectively, in the theoretical study. For each of these processes, the phonon lifetime has been realized using Matthiessen rule as Kaviany (2014)
| (20) |
where , and are phonon lifetimes corresponding to the normal, umklapp and isotope scattering respectively.
Generally, in harmonic approximation, phonon lifetimes are infinite whereas, anharmonicity in a crystal gives rise to a phonon self energy + . The phonon lifetime has been computed from imaginary part of the phonon self energy as = fromTogo et al. (2015)
| (21) |
where = is the phonon occupation number at the equilibrium. = 1 if , or 0 otherwise. Here G represents reciprocal lattice vector. Integration over q-point triplets for the calculation is made separately for normal (G = 0) and umklapp processes (G 0). For both direct method and RTA, scattering of phonon modes by randomly distributed isotopes Togo et al. (2015) are also incorporated for comparison. The isotope scattering rate, using second-order perturbation theory, is given by Shin-ichiro Tamura ichiro Tamura (1983) as
|
|
(22) |
where is mass variance parameter, defined as
| (23) |
is the mole fraction, is relative atomic mass of th isotope, is the average mass = and W is polarization vector. The database of the natural abundance data for elements Laeter et al. (2003) is used for the mass variance parameters.
For consistency check, we first simulate the lattice thermal conductivity () of crystalline rhombohedral GeTe at 300 K using RTA method and compare the value of with the results of the work done by D. Campi et al.Campi et al. (2017). , obtained from our study using RTA, is 2.29 W/mK using the PBE functional in the DFT framework, which is in good agreement with the results of D. Campi et al.Campi et al. (2017) with = 2.34 W/mK. After this consistency check, we use the DFT and Boltzmann transport equation (BTE) to get the lattice thermal conductivity of GeTe at the temperature regime studied in this work (322 K 503 K).
Figure 5 and Table 3 present the various contributions of thermal conductivity, obtained theoretically, superimposed with the experimental data. Starting from first principles calculations, both direct solution and RTA method are used to solve the LBTE to get the lattice thermal conductivity. Since is anisotropic along hexagonal c axis and a-b axes, the average lattice thermal conductivity is calculated as = + Mizokami et al. (2018); Campi et al. (2017). Figure 5 and Table 3 show that the resulting theoretical for the direct solution of LBTE is slightly overestimated compared to the experimental results, specifically at the higher temperatures ( 322 K). However, the direct method is found to capture the trend of quite well. Consistently, slightly lower values of are found due to the incorporation of the effect of phonon mode scattering due to isotopes. On the other hand, the results of thermal conductivity, obtained by solving Boltzmann transport equation under the relaxation time approximation (RTA), are found to be slightly underestimated as compared to the experimental results. However, as T 372 K, RTA results seem to be in better agreement with the experimental data and the difference between experimental and RTA goes down from 19 at 322 K to 6 at 503 K. The trend of obtained through RTA, alike the direct solution, is found to be in good agreement with the experimental trend. This trend of implies that umklapp scattering seems to dominate the phonon-phonon scattering at higher temperatures, as predicted by experiments.
Previously, the hole concentration of GeTe is found to be 6.24 1019 cm-3, indicating a significant role of vacancies for the reported overestimation of the , obtained via direct solution of LBTE. Indeed, D. Campi et al. Campi et al. (2017) found a considerable amount of lowering of of crystalline GeTe at 300 K due to the vacancy present in the sample.
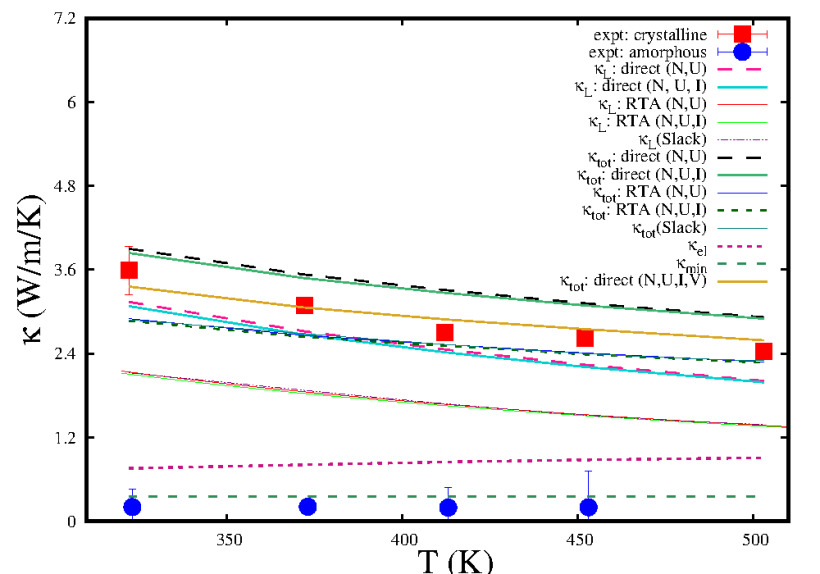
| T (K) | Expt. | Direct (N,U) | Direct (N,U,I) | Slack | RTA(N,U) | RTA(N,U,I) | Direct (N, U, I, V) |
|---|---|---|---|---|---|---|---|
| 322 | 3.59 | 3.90 | 3.84 | 2.88 | 2.90 | 2.87 | 3.36 |
| 372 | 3.09 | 3.53 | 3.48 | 2.69 | 2.66 | 2.64 | 3.06 |
| 412 | 2.70 | 3.31 | 3.27 | 2.53 | 2.53 | 2.51 | 2.89 |
| 452 | 2.62 | 3.12 | 3.09 | 2.40 | 2.41 | 2.39 | 2.75 |
| 503 | 2.43 | 2.92 | 2.90 | 2.30 | 2.28 | 2.27 | 2.59 |
The phonon scattering rate by vacancy defects are prescribed by C. A. Ratsifaritana et al. Ratsifaritana and Klemens (1987) as
| (24) |
where, is the density of vacancies, denotes the number of atoms in the crystal and is the phonon density of states (PDOS). Using vacancies as isotope impurity, C. A. Ratsifaritana et al Ratsifaritana and Klemens (1987) denoted mass change = 3, where is the mass of the removed atom. Eq. 24 states that the phonon-vacancy relaxation time is temperature independent. D. Campi et al. Campi et al. (2017) used this phonon-vacancy scattering contribution for a GeTe sample with hole concentration of 8 1019 cm-3 and found an almost 15.6 reduction of at 300 K. As the hole concentration is almost similar to that of our work (6.24 1019 cm-3) , in conjunction with the fact that is temperature independent, we estimate an overall 15.6 decrement of throughout the temperature range studied as an effect of phonon-vacancy scattering. We find that the estimated , incorporating the vacancy contribution, in addition to the normal, umklapp and isotope scattering, agrees excellently with the experimental data for the whole temperature range in our study. This exercise strongly depicts the significant participation of the scattering between phonons and vacancy defects at high temperatures.
It is well known that the RTA, although describes the depopulation of phonon states well, fails to rigorously account the repopulation of phonon states Fugallo et al. (2013). While at low temperatures, the applicability of RTA can be questioned due to the dominance of momentum conserving normal scattering and almost absence of umklapp scattering of phonons, in the high temperature regime of our study, RTA is found to be a good trade off between accuracy and the computational cost to describe the experimental results. This is primarily because of the higher number of scattering events at higher temperature which ensures an isothermal repopulation of the phonon modes Fugallo and Colombo (2018). However, the difference from the total solution of LBTE exists due to the over resistive nature of the scattering rates that effectively lowers the value compare to the direct solution. This feature has been discussed in literature Fugallo and Colombo (2018); Bosoni et al. (2017). The reason of this underestimation is that the RTA treats both umklapp and normal scattering processes as resistive while the momentum conserving normal scattering processes do not equally contribute to the thermal resistance as that of the umklapp scattering Bosoni et al. (2017).
Simple phenomenological models can also serve a fast and efficient way to decipher the underlying physical mechanism. The Slack model Morelli and Slack (2006) expresses the lattice thermal conductivity, when and the heat conduction happens mostly by acoustic phonons, starting from the analytical expression of the relaxation time related to umklapp processes as:
| (25) |
with:
| (26) |
where is the number of atoms per unit cell, is volume per atom ( is in angstrom in the relation), is average atomic mass of the alloy and is the Gruneisen parameter (see Table 2). This relation between lattice thermal conductivity and Gruneisen parameter in a solid is valid within a temperature range where only interactions among the phonons, particularly, anharmonic umklapp processes are dominant Morelli and Slack (2006). E. Bosoni et al. Bosoni et al. (2017) found a good agreement between the lattice thermal conductivity of crystalline GeTe coming from the full solution of BTE and that of the Slack model at room temperature. Lattice thermal conductivity due to Slack model ((Slack)) is presented in Fig 5. Total thermal conductivity is then realized by adding (Slack) with . We retrieve an almost identical trend of both lattice () and total thermal conductivity () in Slack model as that of the RTA based solutions. This almost identical values of (Slack) and (RTA) depicts that the optical phonons contribute very little to (RTA) as (Slack) takes into account only acoustic phonon contributions. The values obtained for (Slack) are found to be lower than the experimental data for 412 K and gradually seem to agree well for 412 K (Fig 5 and Table 3).
Though RTA based solutions underestimate the experimental data, the trend of , which is almost identical to phenomenological Slack model, is what needs attention to elucidate the underlying heat transport mechanism at high temperatures. Further, RTA based solutions are straightforward and can reveal the distinct role of each contributing parameters appearing in Eq.18. Consequently, in the following sections, we systematically study the thermal transport properties of GeTe using both frequency and temperature variations using the results obtained from RTA solutions.
IV.4 Variation of lattice thermal conductivity () with phonon frequency: Contribution of acoustic and optical modes
To investigate lattice thermal conductivity () in a more comprehensive manner, we calculate the cumulative lattice thermal conductivity as a function of phonon frequency for the high temperature regime defined as Togo et al. (2015); Mizokami et al. (2018)
| (27) |
where () is defined as Togo et al. (2015); Mizokami et al. (2018)
| (28) |
with is weighted density of states (DOS).
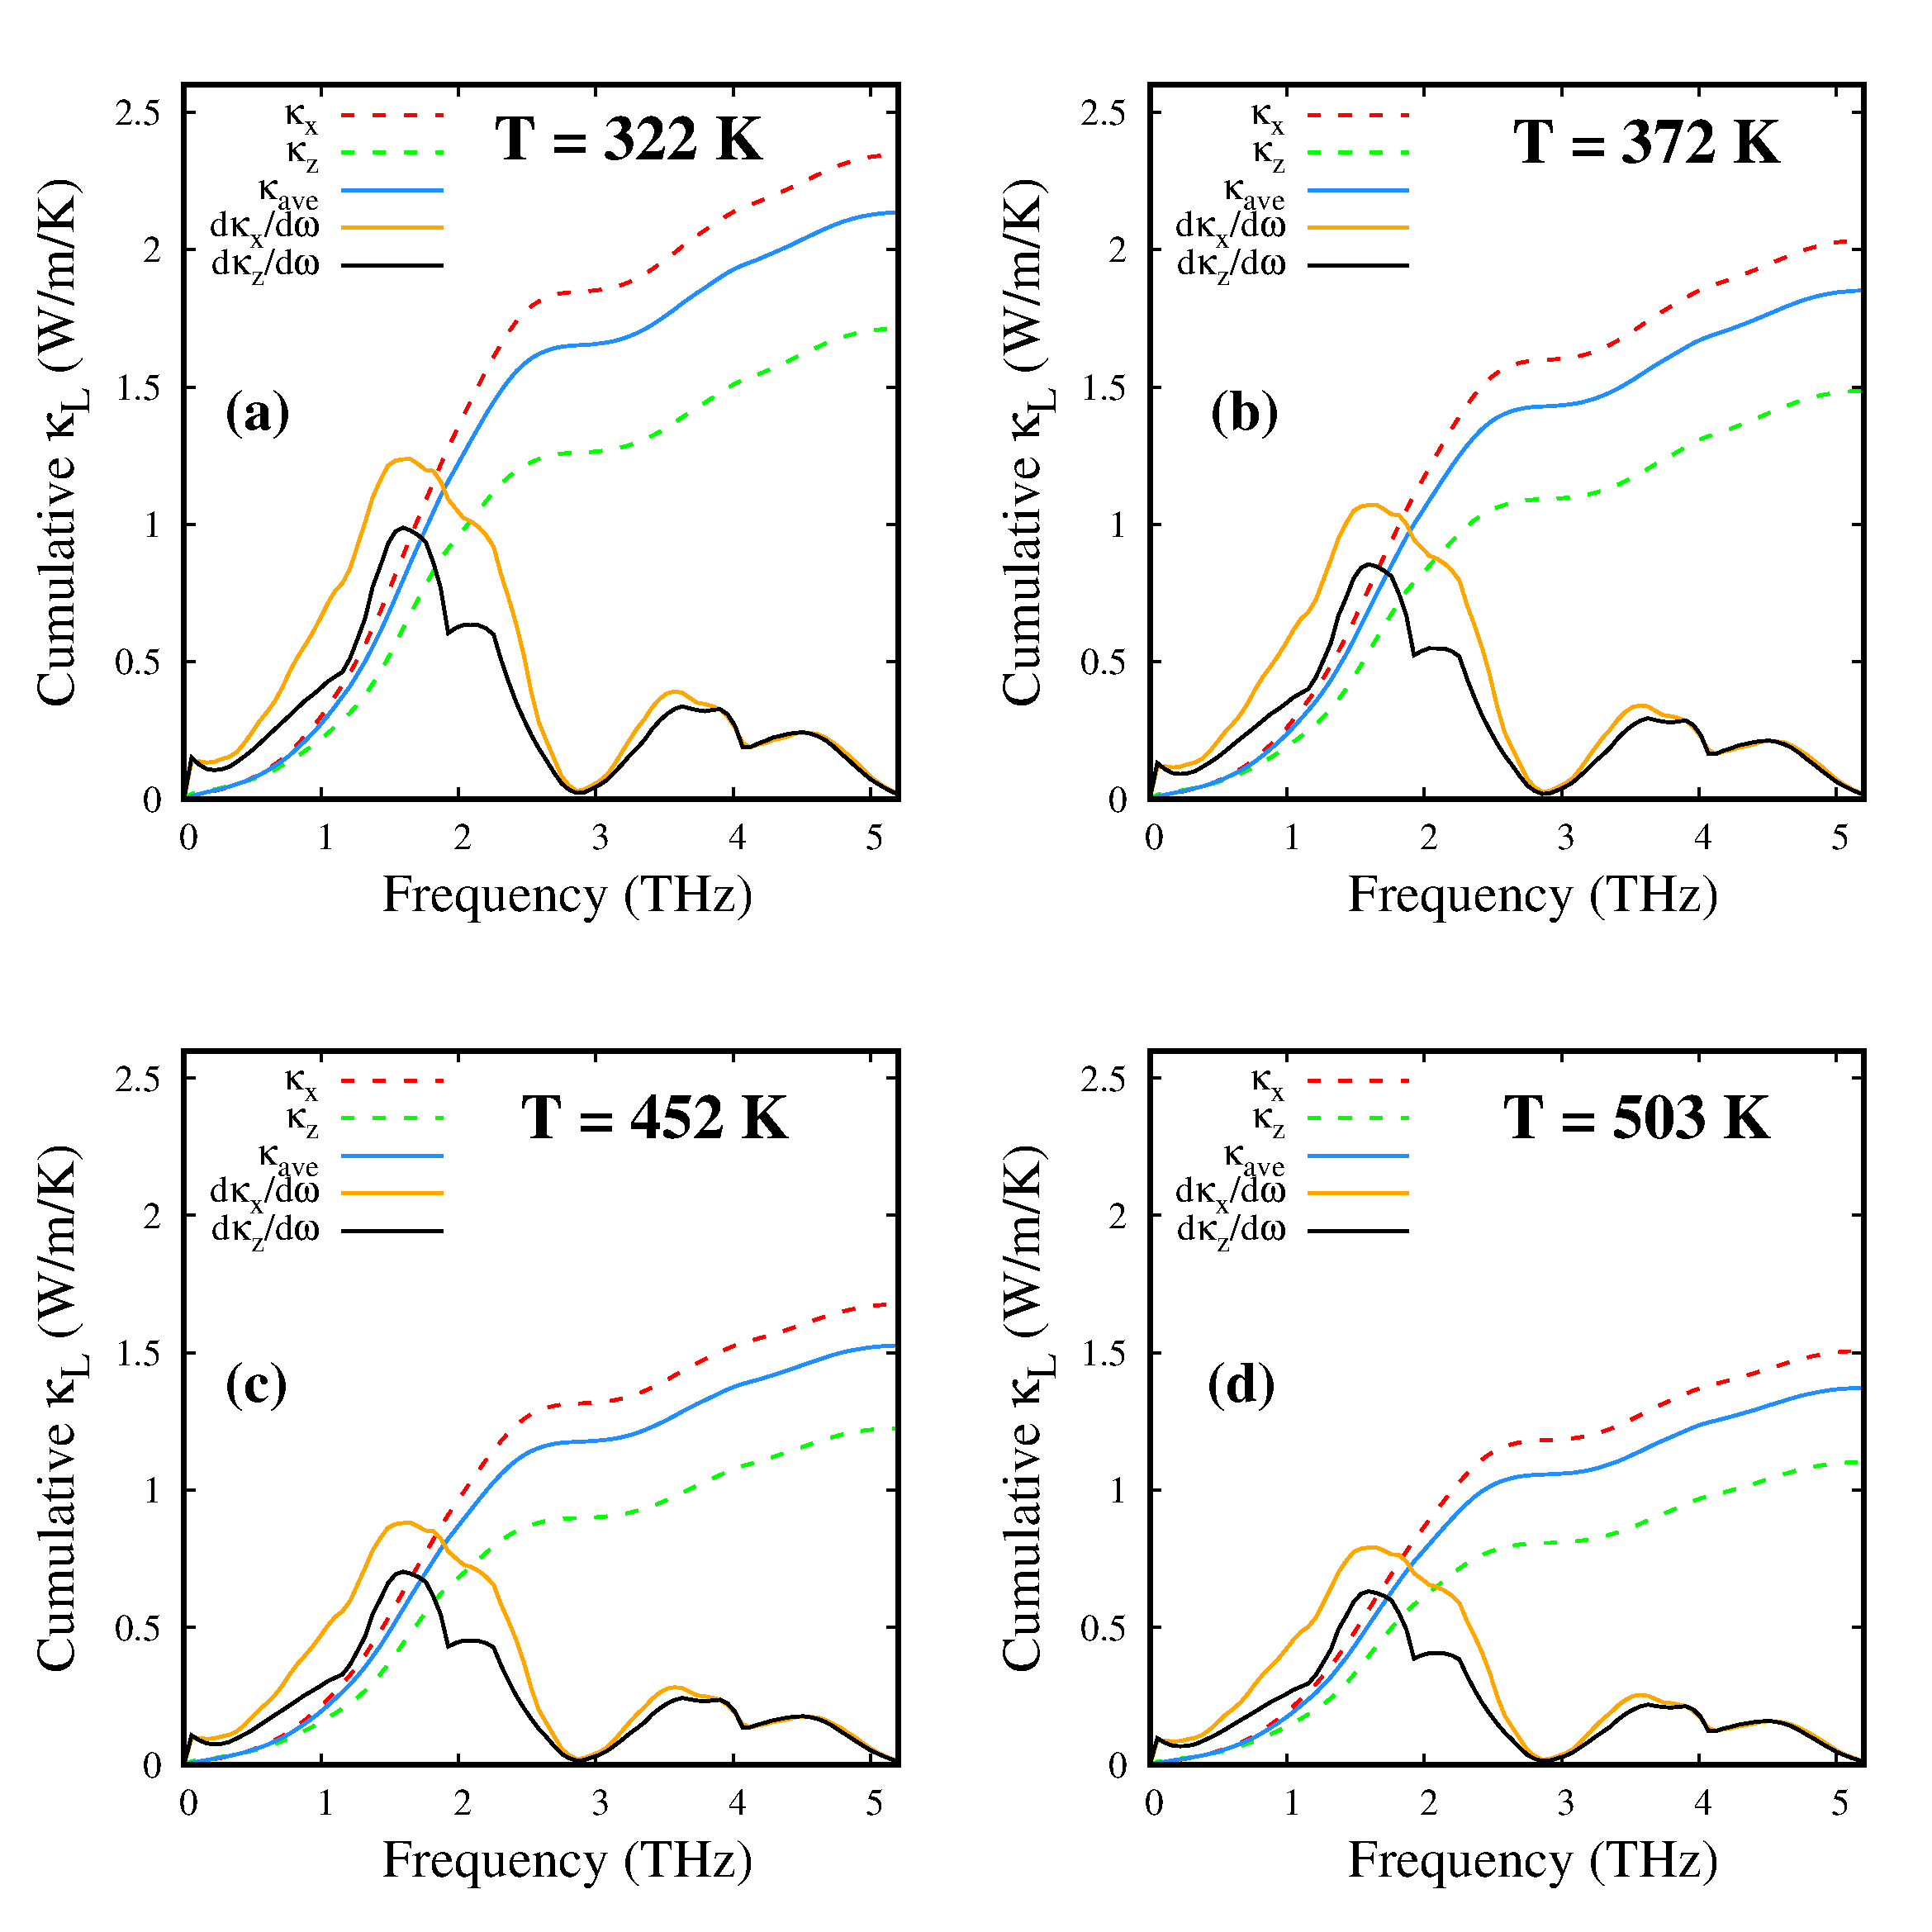
Figure 6 shows the cumulative of crystalline rhombohedral GeTe, along hexagonal c axis (), along its perpendicular direction () and their average = (2 + )/3, as a function of phonon frequencies for four different temperatures using RTA framework. The derivatives of the cumulative values of and with respect to frequencies are also shown for each temperature. It is found that the lattice thermal conductivity () of GeTe is anisotropic with the value along , parallel to the c axis in the hexagonal notation, is found to be smaller with respect to that of the plane for the whole range of temperature studied. This picture is consistent with the recent theoretical findings Campi et al. (2017). More details to the anisotropic aspect of will be discussed in the next subsection.
Figure 6 shows some distinct features in the cumulative lattice thermal conductivity () of GeTe as a function of both phonon frequency and temperature. As the temperature is increased, is found to saturate at gradually
| T (K) | (RTA) | Contribution of | Contribution of |
|---|---|---|---|
| acoustic modes () | optical modes () | ||
| 322 | 2.14 | 77.1 | 22.9 |
| 372 | 1.85 | 77.3 | 22.7 |
| 452 | 1.53 | 77.1 | 22.9 |
| 503 | 1.37 | 77.4 | 22.6 |
lower values, indicating gradual decrement of the lattice thermal conductivity with temperature. Further, the derivatives of with respect to phonon frequencies indicate the density of heat carrying phonons with respect to the phonon frequencies Linnera and Karttunen (2017) and their contribution to the . We note that this density of modes go to zero at a frequency where reaches a plateau. This frequency ( 2.87 THz) has been found to be identical to the frequency where phonon DOS marks the separation between acoustic and optical modes ( 96 cm-1 = 2.88 THz in Fig 4). This correspondence imply that the phonon density of states play a crucial role as a deciding factor to the . While in Fig 6, a significantly higher contribution of these modes correspond to is observed compared to that of the in the acoustic frequency regime (frequency 2.87 THz), an almost equal contribution of d/d and d/d are found in the optical frequency regime (frequency 2.87 THz).
To get a clear quantitative picture, we evaluate the separate contributions of acoustic and optical modes to the . The values of for phonon frequencies 2.87 THz have unambiguously been considered to be the contribution from acoustic modes while the same for frequencies 2.87 THz have been taken as optical modes contribution. Table 4 shows the percentage contributions of both acoustic and optical modes to the lattice thermal conductivity () as a function of temperature. We observe that a dominant 77 of the contribution comes from acoustic modes compared to only around 23 from the optical modes for the whole temperature range studied.
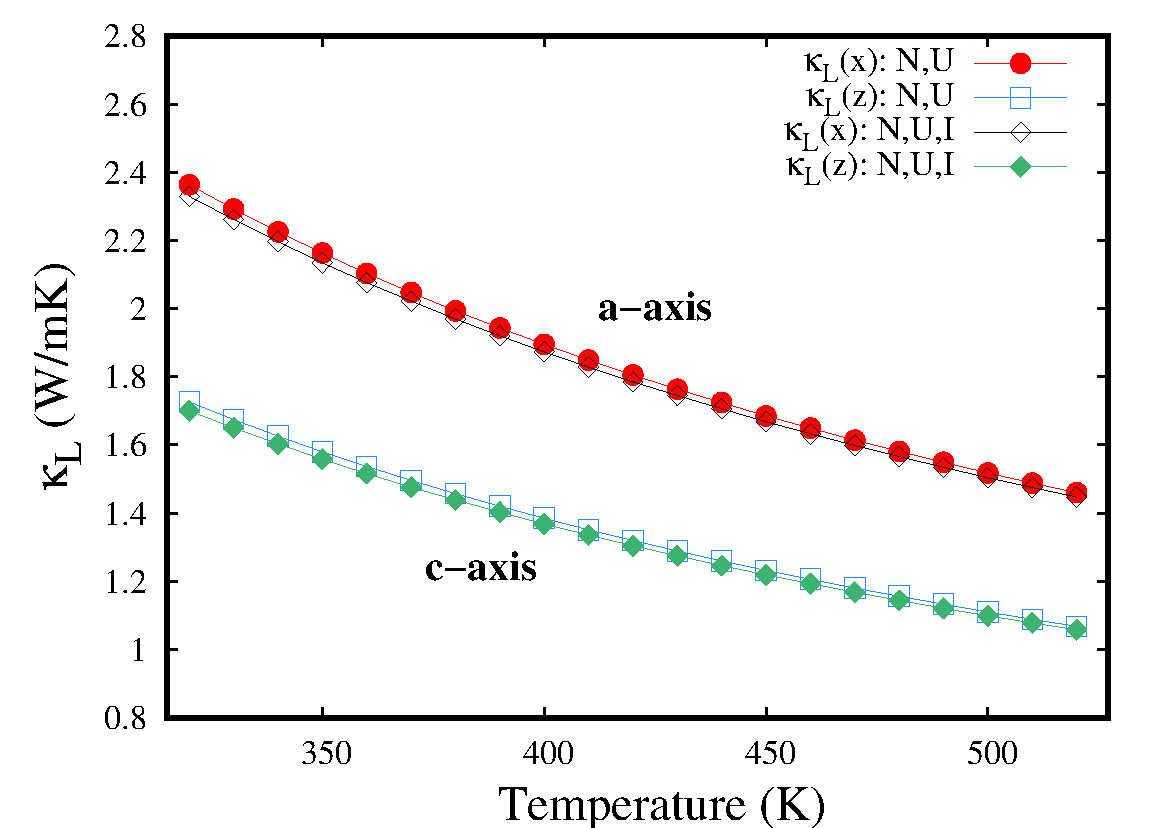
IV.5 Anisotropy of lattice thermal conductivity () of crystalline
As mentioned in the previous subsection, the lattice thermal conductivity () of crystalline GeTe shows anisotropic behavior. The resulting along direction (), parallel to the c axis in the hexagonal notation (along axis c in Fig 3) is found to be smaller than that of the plane (a-b plane in Fig 3),(), as shown in Fig 7.
To investigate the anisotropy, we study the ratio /, where and represent the cumulative lattice thermal conductivities along
plane (a-b plane in Fig 3) and direction (along c axis in Fig 3) respectively. Figure 8.(a) shows this ratio as a function of phonon frequencies for the four different temperatures. We observe that despite the wide temperature range studied, the shape of the curves remain independent of the temperature. The ratio /, initially starts with a low value, becomes maximum to 1.5 at around 1.4 THz. With further increase of frequencies, the ratio decreases and settles at a value of 1.37.
The temperature independence of the anisotropy ratio / can be further understood by studying the cumulative outer product of the phonon group velocities , defined as
| (29) |
and ()/(), which is the ratio between the cumulative outer product of the phonon group velocities along and direction.
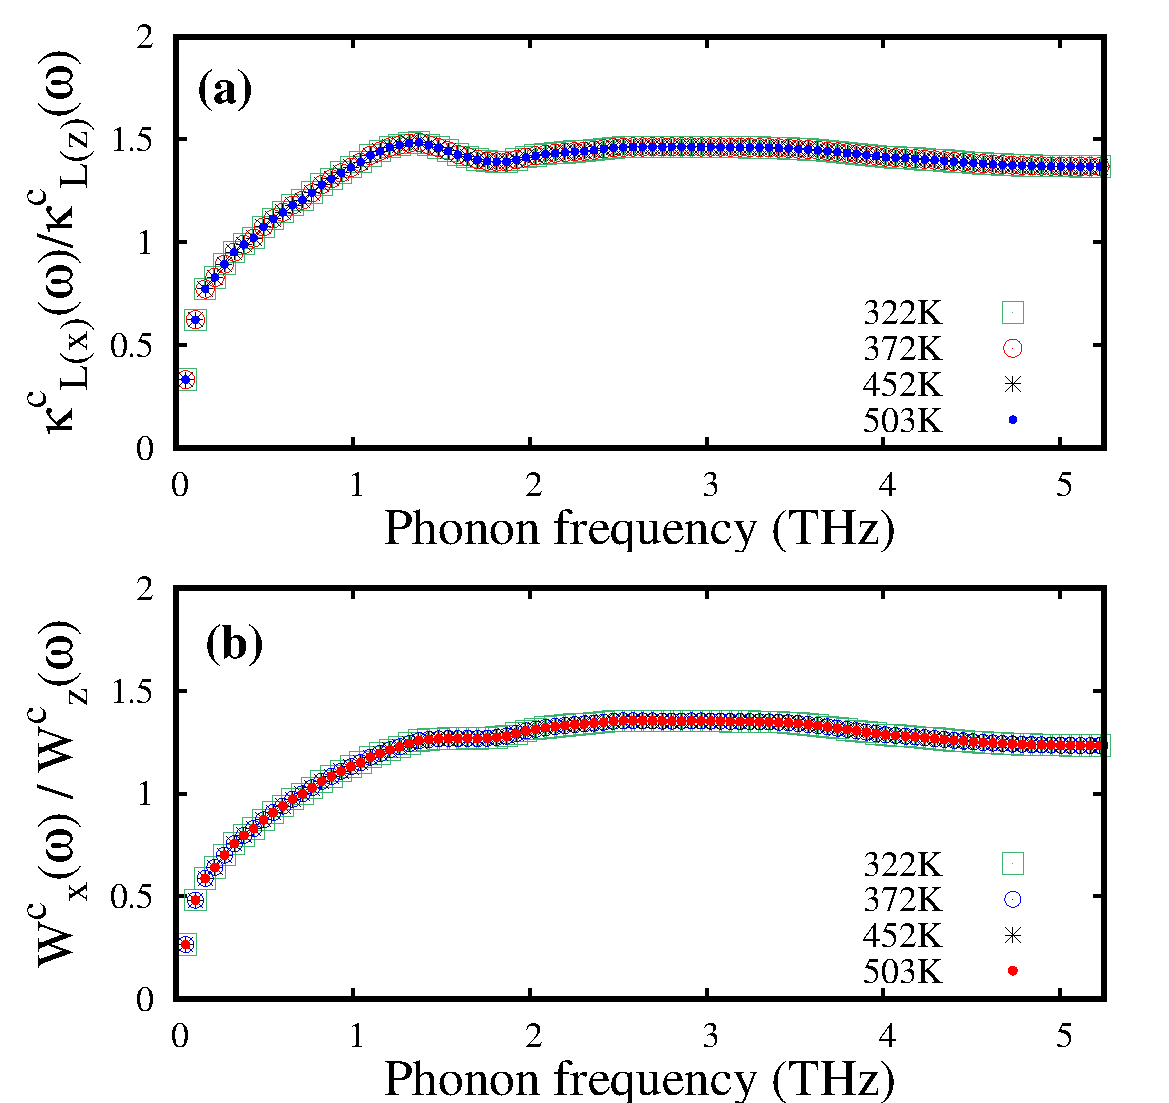
Since phonon group velocities are almost temperature independent, following that feature, we find that the ratio of ()/() is strongly correlated with /. From zero frequency, ()/() starts increasing and reaches the ratio 1 around 0.7 THz, close to that of the / (0.4 THz). Further increasing frequency increases the anisotropy between the in-plane () and out-of the plane () components of the cumulative outer product of phonon group velocities and finally saturates to a value of 1.23 at higher frequencies which is also comparable to the saturation value of /, that is 1.37. Thus, the anisotropy associated with the phonon group velocities, or more specifically, the cumulative outer product of phonon group velocities determines the anisotropy in the cumulative lattice thermal conductivity.
IV.6 Variation of lattice thermal conductivity () with temperature: Phonon lifetime and phonon mean free path
Recalling Equation 18, in an alternate way to understand the frequency dependence of the different parameters that contribute to the lattice thermal conductivity (), we study the variation of modal heat capacity (), phonon group velocity () and the phonon lifetime () as a function of phonon frequency for the high temperature regime studied in this work. The dominant contribution of phonon group velocities () are found to arise from the acoustic phonons and the optical modes are found to exhibit substantially lower group velocities than the former. Furthermore, as expected, increasing temperatures does not change the dependence of group velocities on phonon frequencies. Similar behavior is expected from the modal heat capacity (Cλ) as a function of phonon frequencies for different temperatures. Indeed, Cλ stays nearly constant with a small 2-5 deviation (2 for 503 K and 5 for 322 K) from which is consistent with the classical limit of Cλ at high temperatures.
This almost non varying patterns of phonon group velocities and mode heat capacity with temperature prompt us to look closely on the frequency variation of phonon lifetimes () at these temperatures. We note here that defines modal phonon relaxation time or phonon lifetime with denotes each mode. Figure 9 depicts the phonon lifetimes, coming from TA, LA and optical modes as a function of phonon frequency. We observe that increasing phonon frequency from 0 THz gives an initial rise and then a quick decay of lifetimes within 3 THz and with relatively smaller values afterwards. This clearly indicates that the dominant contribution of phonon lifetime and in turn, the lattice thermal conductivity is coming from the acoustic modes, which operate in the frequencies 2.87 THz.
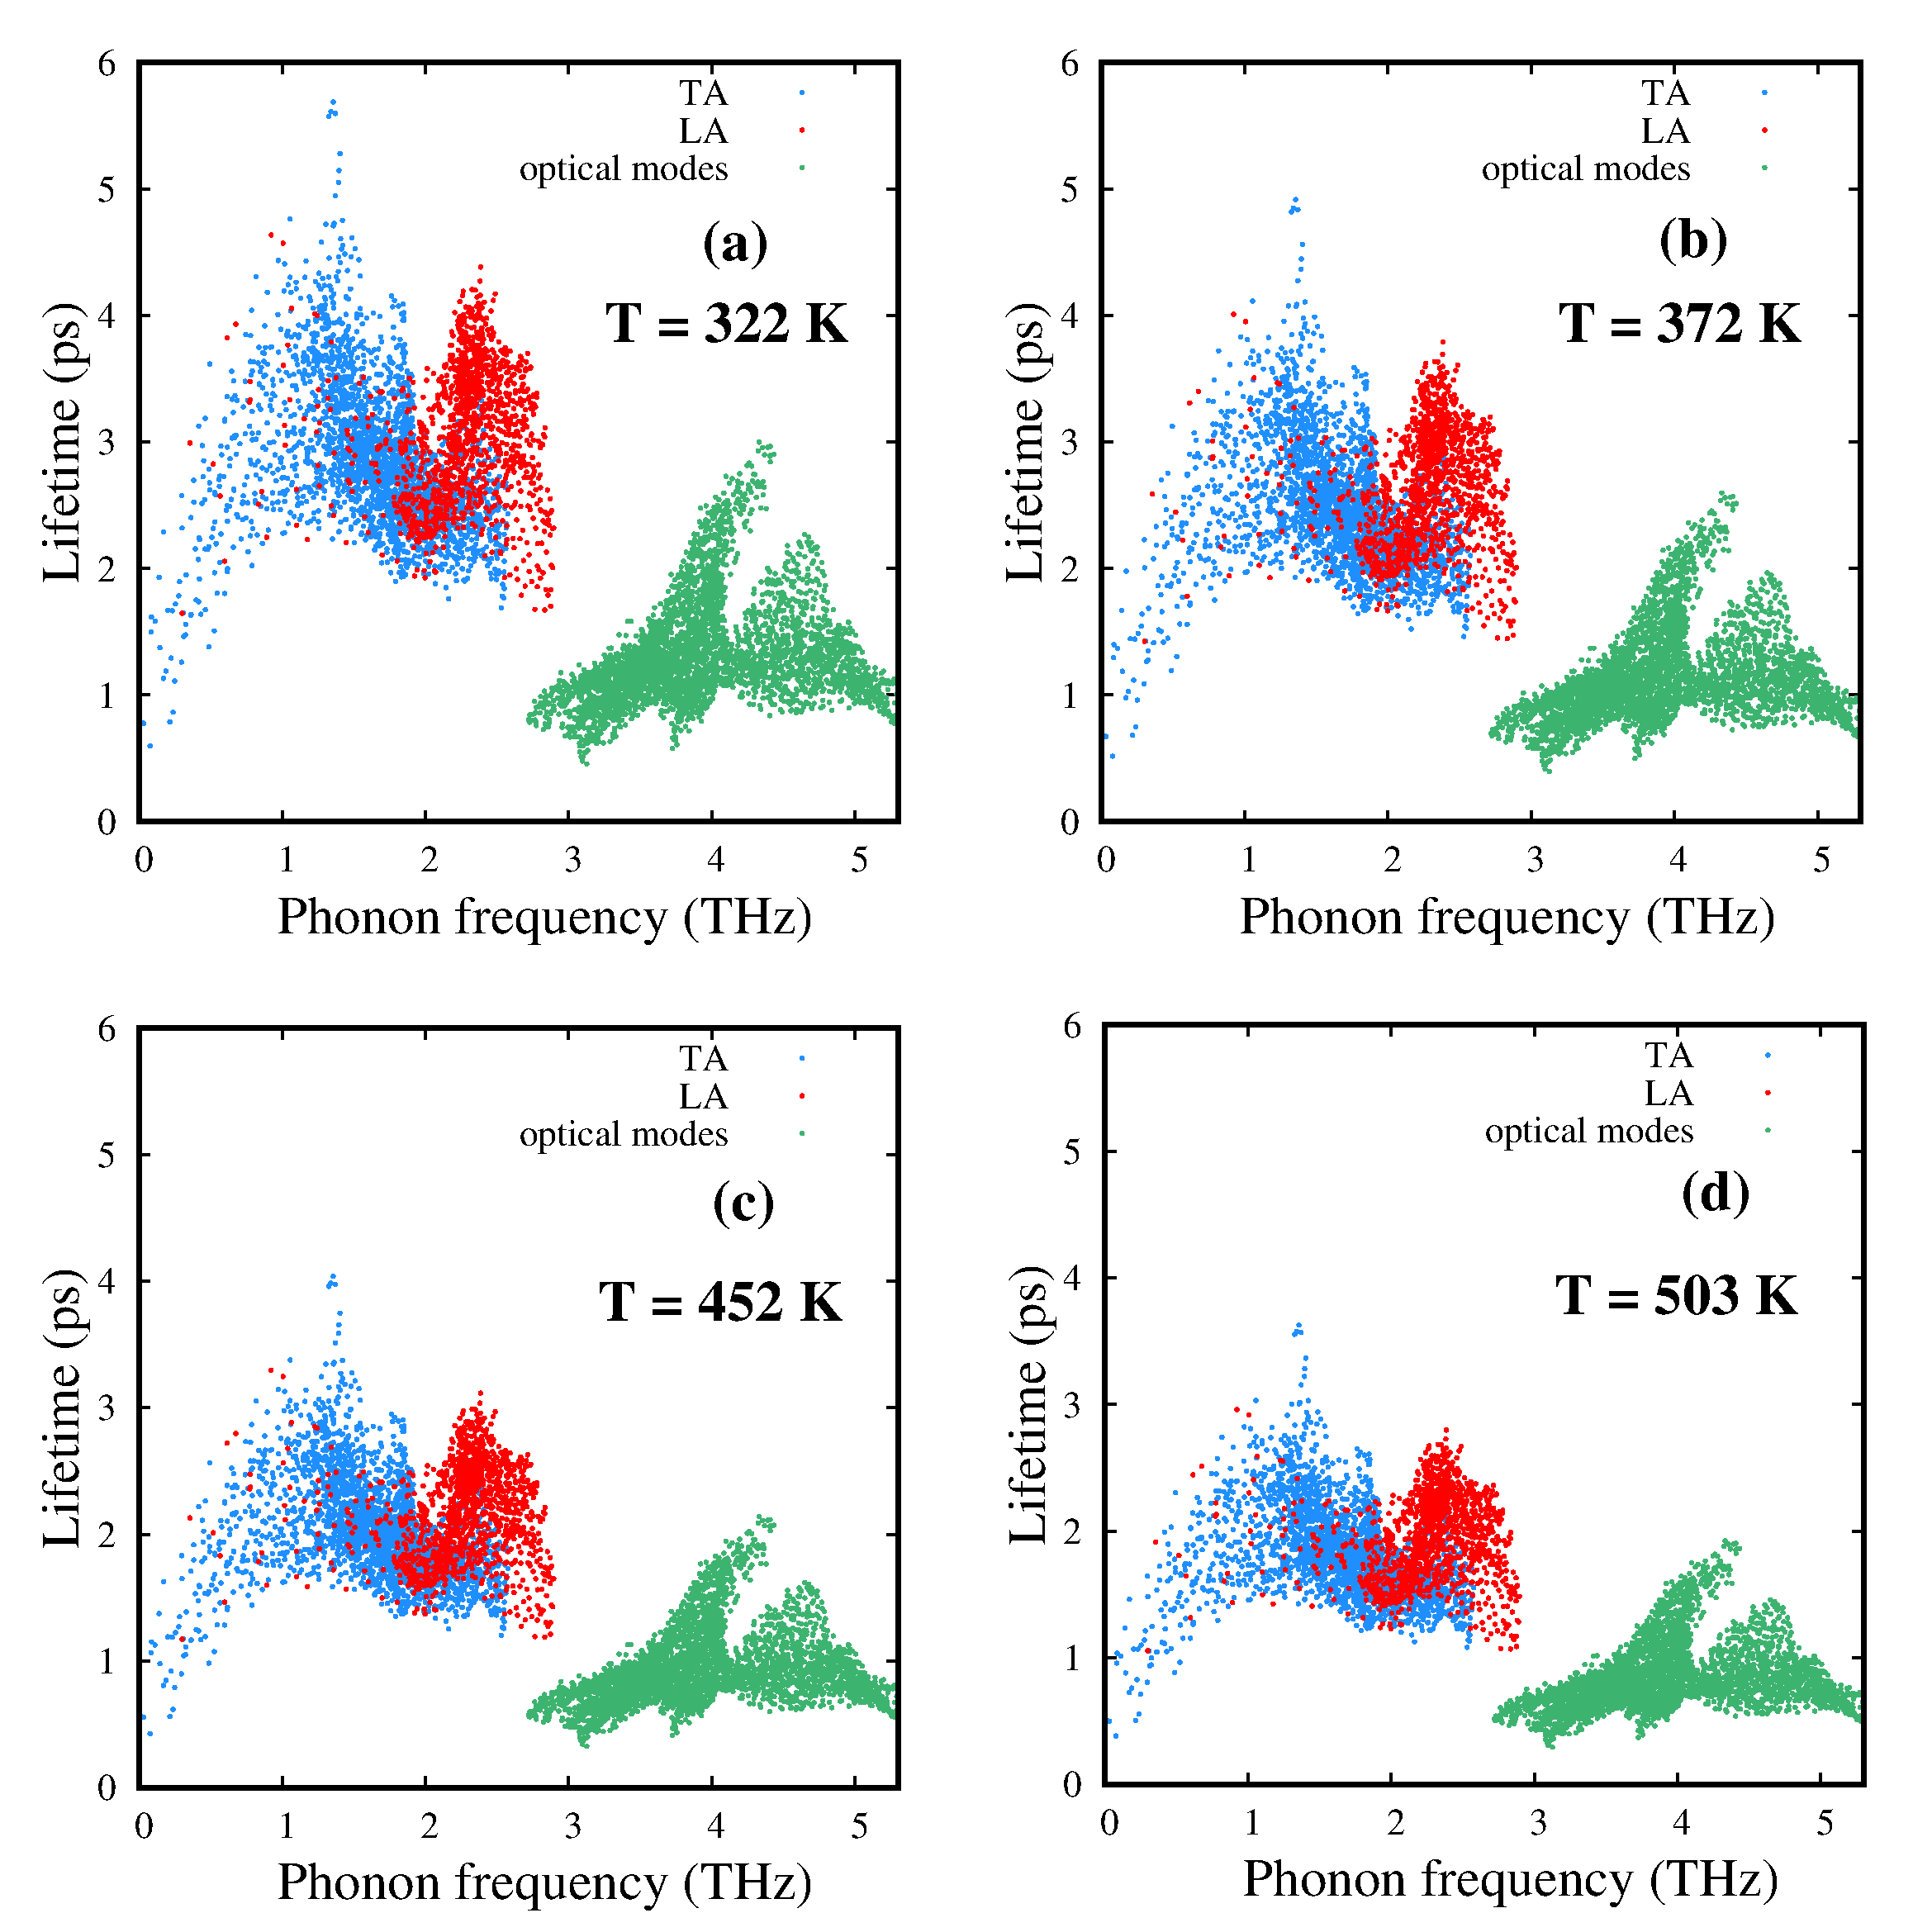
Considering the temperature variation, we find that acoustic modes induce smaller values of phonon lifetimes with increasing temperature (Fig 9). Two prominent observations evolve through this: (a) the trends in phonon lifetimes () as a function of frequency reassure the fact that acoustic phonons are the dominant carriers of heat which contributes to , (b) as the phonon lifetime is directly proportional to , the reduced contribution of phonon lifetime with increasing temperature directs towards a gradual decrement of with temperature. The gradually reducing values of phonon lifetime with increasing temperature can be understood more prominently considering the mean free path picture. The modal mean free path of phonons () can be written as
| (30) |
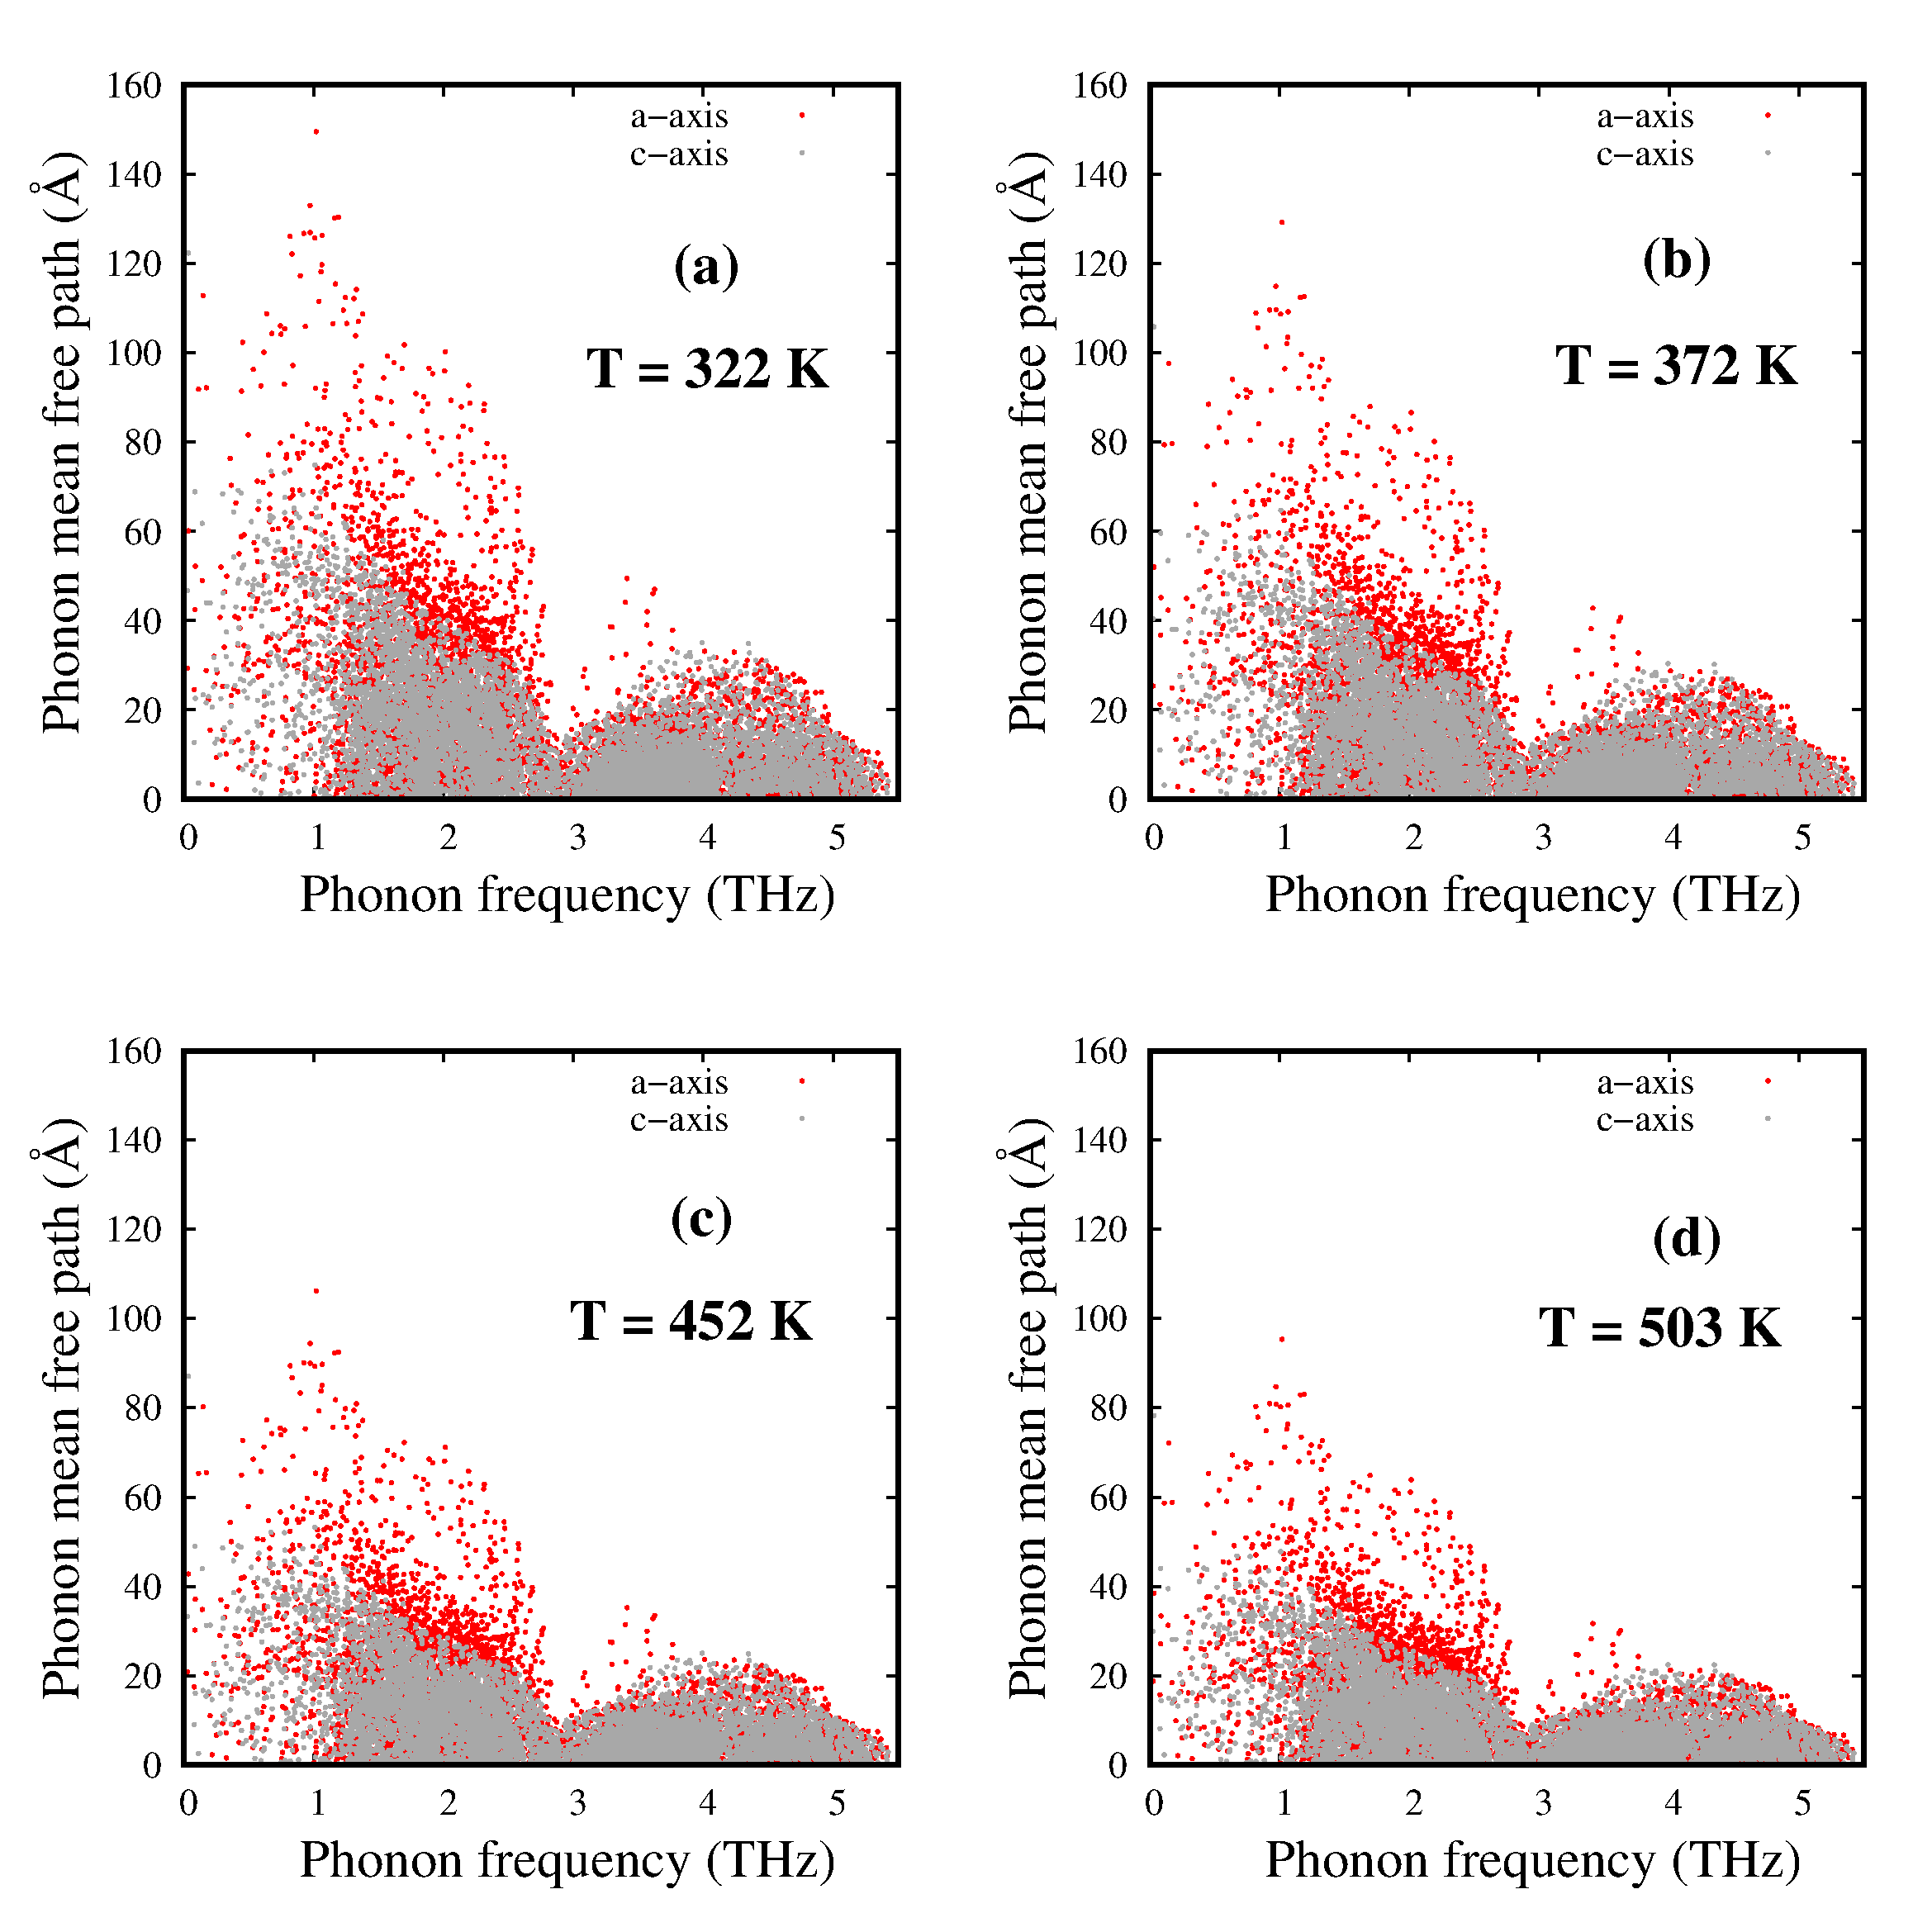
The transport of heat through phonons in the diffusive regime ( , = linear dimension of the medium of travelling phonons) undergoes several scattering processes namely scattering by electrons, other phonons, impurities or grain boundaries Kaviany (2014). At high temperatures, phonon-phonon scattering dominates along with impurity scattering to some extent. It is well understood that anharmonic coupling on thermal resistivity leads to at high temperatures Kittel (1986). To elaborate it further, we study the mean free paths of phonons () as a function of phonon frequencies for different temperatures. As can be seen from Fig 10, the mean free paths decay quickly within 3 THz with gradually increasing phonon frequency starting from 0 THz and saturate at lower values afterwards. This is precisely due to the dominance of the acoustic modes in thermal transport of GeTe. With increasing temperature, the mean free paths are observed to exhibit lower values validating . The anisotropic nature of has also been understood by means of the mean free paths along a and c axes of R3m-GeTe. Separate contributions of the mean free paths along a-axis and c-axis are shown in Fig 10. Throughout the temperature range studied, phonon mean free paths correspond to the a-axis show higher values compared to that of the c-axis, giving rise to an enhanced heat transfer along a-axis with higher values of compared to the c-axis with lower values of . Thus, the anisotropic mean free path distribution of phonons is found to be the key reason for exhibiting an anisotropic heat transfer in crystalline R3m-GeTe.
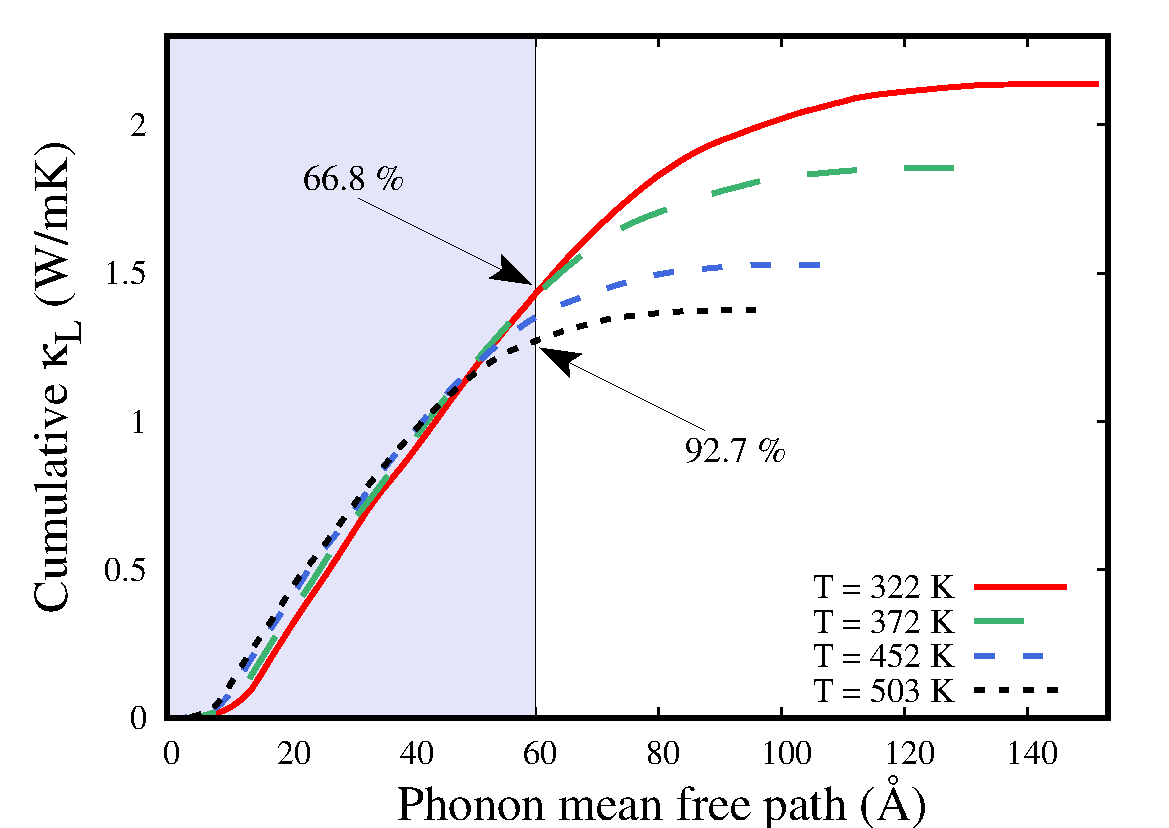
To investigate the contribution of mean free paths of different lengthscales to , cumulative lattice thermal conductivity (considering the = (2 + )/3) is studied as a function of phonon mean free paths for the four different temperatures (Fig 11). We observe from Fig 11 that the maximum values of the phonon mean free paths () gradually decrease with temperature (T = 322 K, 152 Å; T = 372 K, 131 Å; T = 452 K, 108 Å; T = 503 K, 97 Å), consistently with . Moreover, a dominant contribution ( 67 ) to the lattice thermal conductivity is found to be coming from the phonon mean free paths 60 Å. As temperature increases, the contributions from the phonon mean free paths 60 Å are increased to almost 93 (Fig 11).
Increasing temperature, thus, manifests in a way of increasing phonon-phonon scattering processes which acts
on the lowering of mean free path of phonons. With almost similar , the lowering of mean free path of phonons can be associated with the decrements of .
IV.7 Contribution of transverse and longitudinal acoustic phonons
Up till now we understood the dominant contributions of the acoustic modes to the thermal transport mechanisms of crystalline rhombohedral GeTe. In this section, we further systematically discriminate the relative contributions of transverse and longitudinal acoustic phonons to the lattice thermal conductivity of crystalline GeTe for the temperature range investigated in this study. It is observed that the transverse modes (TA) contribute to almost 75 while the longitudinal counterpart (LA) adds up the rest of 25 to the lattice thermal conductivity for the whole temperature range.
Figure 12 presents the lattice thermal conductivities, obtained via Ab-initio DFT calculations coupled with RTA, due to both transverse (TA) and longitudinal (LA) acoustic phonons as a function of temperature. For consistency, we also plot the values for acoustic modes from the experimentally measured values of . This has been evaluated by subtracting the electronic thermal conductivity (), measured from the simulation, as well as the due to optical phonons, computed from Ab-initio DFT and RTA, from the experimentally measured values of . Indicating a consistent picture from both experiment and theoretical calculations, as discussed earlier, an identical trend is found (Fig 12) between the data calculated from experiment and the simulated values of due to acoustic phonons (TA+LA) despite the differences
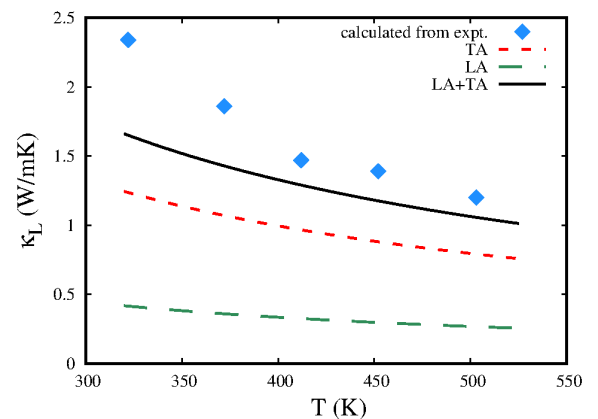
between the values, mostly for T 412 K.
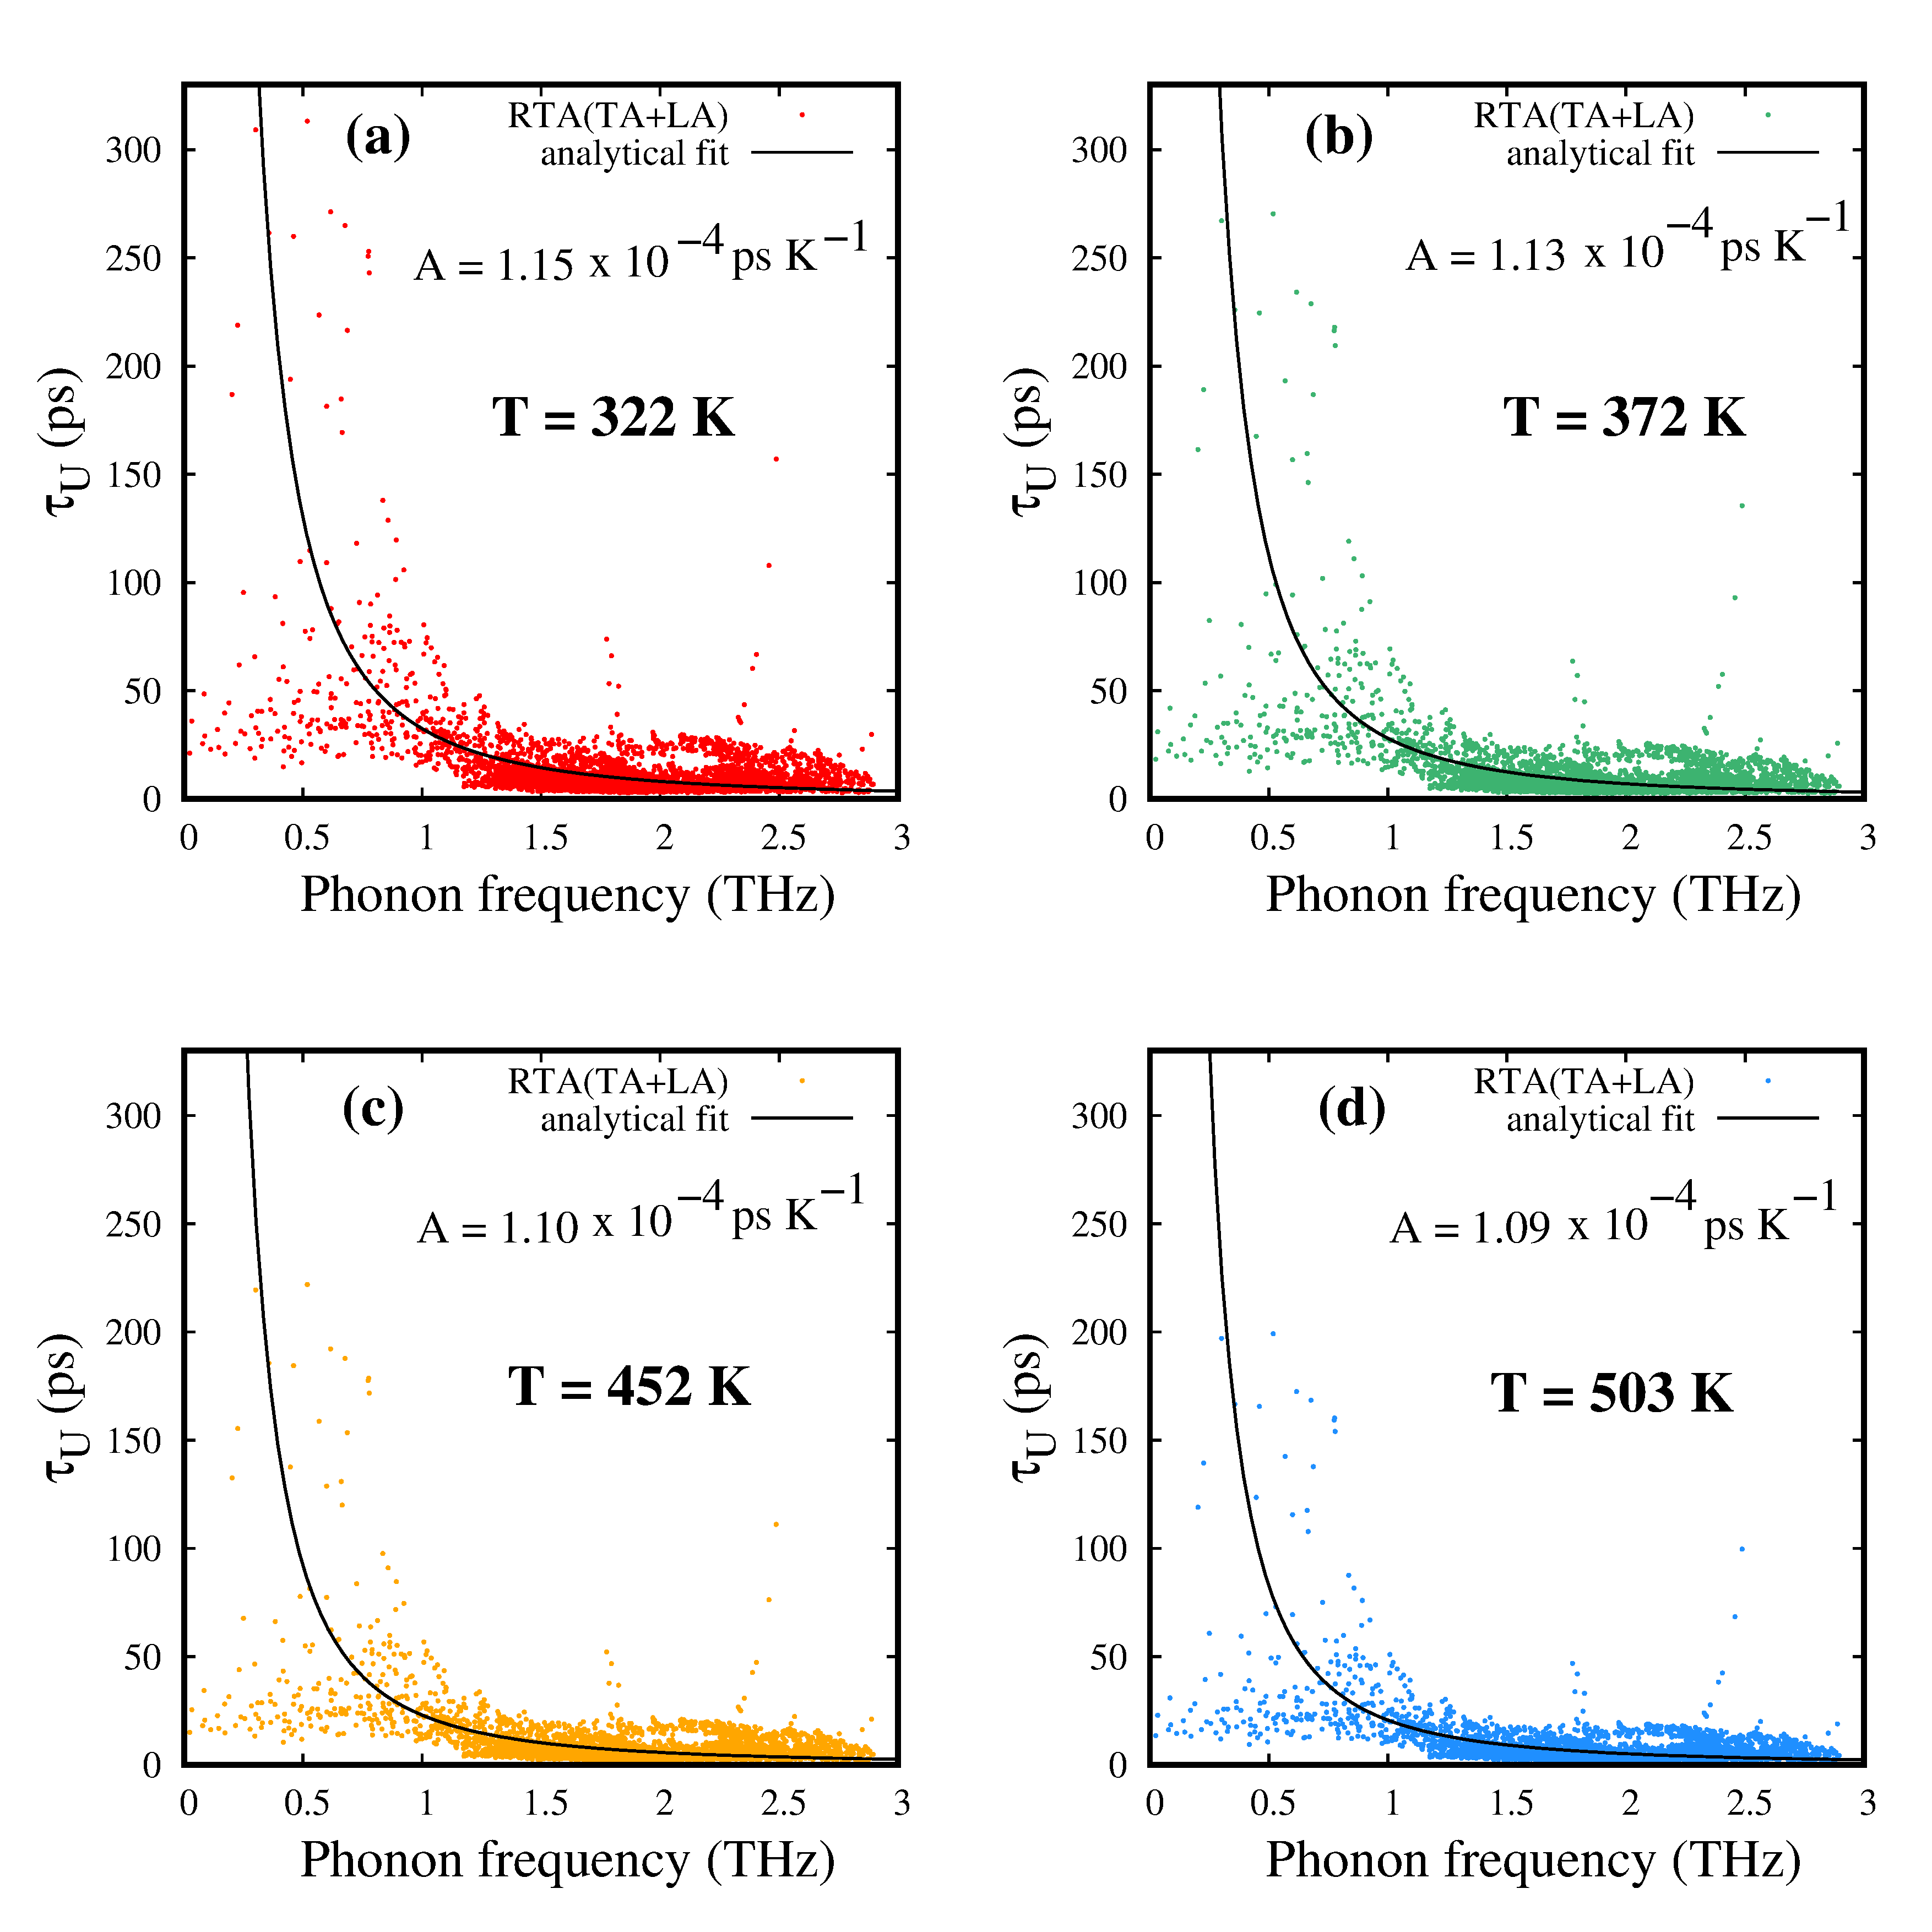
Throughout this work, the trend of simulated using RTA has been found to be a straightforward and convenient framework to describe the temperature dependence of the experimental results of for crystalline GeTe. Further, the exact similarity between RTA and the phenomenological Slack model, indicates that umklapp scattering plays an important and significant phonon-phonon scattering mechanism in the high temperature range ( ), being the Debye temperature. To identify the umklapp scattering parameter involved in the process, we fit the phonon relaxation time correspond to the umklapp scattering, obtained from RTA, with the analytical expression given by Glen A. Slack et al. Slack and Galginaitis (1964)
| (31) |
with and 1/3, where is average atomic mass of the alloy and is the Gruneisen parameter. Being an empirical equation, it is necessary to find the parameter from the fitting procedure. Figure 13 shows the phonon relaxation times as a function of phonon frequency along with the fitted curve for all the four temperatures. We observe that at higher frequencies the trend of phonon relaxation time indeed shows dependence for all temperatures. The values of , thus retrieved from the fitting, are found to be independent of temperature with an average value of 1.1 10-4 ps K-1.
This quantification, via the parameter , serves as an important generic identification as this parameter can uniquely distinguish and compare the umklapp scattering processes for different crystalline materials ranging from to an arbitrary high temperatures, within the operational regime of umklapp scattering process.
V Summary and Conclusions
We have carried out a systematic experimental and theoretical study on the thermal conductivity variation of GeTe at high temperatures. The study involves fast and reversible phase change between amorphous and crystalline phases of GeTe. Modulated photothermal radiometry (MPTR) as well as the Lavenberg-Marquardt (LM) technique are employed to determine thermal conductivities of GeTe in both amorphous and crystalline phases as a function of temperature. Thermal boundary resistances, coming from both Pt-GeTe and GeTe-SiO2 interfaces, have been accurately taken into account for measuring experimentally. Van der Pauw technique as well as Boltzmann transport equations are solved for electrons to estimate electronic thermal conductivity within the constant relaxation time approximation (CRTA) framework.
To compute lattice thermal conductivity (), first-principles density functional theory (DFT) is used and the solution to the linearized Boltzmann transport equation (LBTE) has been realized via both direct method and relaxation time approach (RTA). Normal, umklapp and isotope effects are included in computing the phonon relaxation time in these approaches. While the direct method is found to capture the trend of quite well, the values are a bit overestimated compared to the experimental data. The hole concentration of 6.241019 cm-3, obtained using first principles calculations and BTE for electrons, necessitates the incorporation of phonon-vacancy scattering to estimate . Following a recent work Campi et al. (2017) on crystalline GeTe with almost same hole concentration, vacancy contribution is incorporated to estimate more realistic values of . Indeed, the estimate of using direct method and adding the temperature independent phonon-vacancy scattering contribution, an excellent agreement is obtained between experimental and theoretical values of .
computed from RTA, is also found to retrieve the trend of experimental quite well, especially at higher temperatures. However, the over-resistive nature of RTA due to the treatment of umklapp and normal scattering in equal footing, causes an underestimation of compared to the experimental values. Nevertheless, the trend agrees well at higher temperatures. Cumulative lattice thermal conductivity is presented as a function of phonon frequencies for different temperatures. The density of heat carrying phonons or rather the phonon density of states plays a crucial role in determining . Acoustic phonons emerge as the dominant ( 77) contributor to the lattice thermal conductivity while transverse acoustic modes contribute almost 75 to the acoustic phonon transport. The anisotropy of lattice thermal conductivities of crystalline GeTe between in-plane and out of plane components are understood using the variation of cumulative outer product of phonon group velocities. Further, the anisotropy present in phonon mean free path along a-axis and c-axis are found to control the anisotropy in the heat transfer along these two axes. Phonon group velocities and mode heat capacities are observed to remain almost independent of temperature. Therefore, the temperature variation of is attributed to the variation of phonon mean free path and consequently the variation of phonon lifetime with temperature.
Phenomenological models are also found to be quite effective in describing and identifying the underlying physical mechanism of thermal transport. The experimental values of in amorphous phase of GeTe are described using the minimal thermal conductivity model, proposed by Cahill et al. Cahill et al. (1992). For crystalline phase data, Slack model Morelli and Slack (2006) is also employed and it has been found to be strikingly similar with RTA based solutions. Both RTA based solutions as well as expression from phenomenological Slack model for GeTe indicate that the umklapp phonon phonon scattering is significant for the temperature regime studied in this work. Umklapp phonon relaxation time is found to obey dependence at higher frequencies and therefore umklapp scattering parameter has been obtained, which remains almost constant for the whole temperature range studied. This complete experimental and theoretical exercise to elucidate the thermal conductivity of GeTe at high temperatures can further assist in improving the thermal management for other Te based phase change materials by understanding heat dissipation, localization and transport with more clarity.
Acknowledgements.
This project has received funding from the European Union’s Horizon 2020 research and innovation program under Grant Agreement No. 824957 (“BeforeHand:” Boosting Performance of Phase Change Devices by Hetero- and Nanostructure Material Design).References
- Kolobov et al. (2015) A. Kolobov, P. Fons, and J. Tominaga, Sci. Rep. 5, 13698 (2015).
- Wuttig and Yamada (2007) M. Wuttig and N. Yamada, Nature Mater 6, 824 (2007).
- Wang et al. (2008) W. J. Wang, L. P. Shi, R. Zhao, K. G. Lim, H. K. Lee, T. C. Chong, and Y. H. Wu, Appl. Phys. Lett. 93, 043121 (2008).
- Lu et al. (2013) Y. Lu, Z. Zhang, S. Song, X. Shen, G. Wang, L. Cheng, S. Dai, and Z. Song, Appl. Phys. Lett. 102, 241907 (2013).
- Campi et al. (2015) D. Campi, D. Donadio, G. C. Sosso, J. Behler, and M. Bernasconi, J. Appl. Phys. 117, 015304 (2015).
- Campi et al. (2017) D. Campi, L. Paulatto, G. Fugallo, F. Mauri, and M. Bernasconi, Phys. Rev. B 95, 024311 (2017).
- Kusiak et al. (2016) A. Kusiak, J.-L. Battaglia, P. Noé, V. Sousa, and F. Fillot, J. Phys.: Conf. Ser. 745, 032104 (2016).
- Wdowik et al. (2014) U. D. Wdowik, K. Parlinski, S. Rols, and T. Chatterji, Phys. Rev. B 89, 224306 (2014).
- Mantovan et al. (2017) R. Mantovan, R. Fallica, A. M. Gerami, T. E. Mølholt, C. Wiemer, M. Longo, H. P. Gunnlaugsson, K. Johnston, H. Masenda, D. Naidoo, M. Ncube, K. Bharuth-Ram, M. Fanciulli, H. P. Gislason, G. Langouche, S. Ólafsson, and G. Weyer, Sci. Rep. 7, 8234 (2017).
- Fallica et al. (2013) R. Fallica, E. Varesi, L. Fumagalli, S. Spadoni, M. Longo, and C. Wiemer, Phys. Status Solidi RRL 7, 1107 (2013).
- Boschker et al. (2018) J. E. Boschker, X. Lü, V. Bragaglia, R. Wang, H. T. Grahn, and R. Calarco, Sci. Rep. 8, 5889 (2018).
- Simpson et al. (2011) R. E. Simpson, P. Fons, A. V. Kolobov, T. Fukaya, M. Krbal, T. Yagi, and J. Tominaga, Nat. Nanotechnol. 6, 50 (2011).
- Kagdada et al. (2018) H. L. Kagdada, P. K. Jha, P. Spiewak, and K. J. Kurzydlowski, Phys. Rev. B 97, 134105 (2018).
- Levin et al. (2013) E. M. Levin, M. F. Besser, and R. Hanus, J. Appl. Phys. 114, 083713 (2013).
- Nath and Chopra (1974) P. Nath and K. L. Chopra, Phys. Rev. B 10, 3412 (1974).
- Warzoha et al. (2019) R. J. Warzoha, B. F. Donovan, N. T. Vu, J. G. Champlain, S. Mack, and L. B. Ruppalt, Appl. Phys. Lett. 115, 023104 (2019).
- Bosoni et al. (2017) E. Bosoni, G. C. Sosso, and M. Bernasconi, J Comput Electron 16, 997 (2017).
- Morelli and Slack (2006) D. T. Morelli and G. A. Slack, High lattice thermal conductivity solids, in High Thermal Conductivity Materials, edited by S. L. Shindé and J. S. Goela (Springer New York, New York, NY, 2006) pp. 37–68.
- Slack and Galginaitis (1964) G. A. Slack and S. Galginaitis, Phys. Rev. 133, A253 (1964).
- Cahill et al. (1992) D. G. Cahill, S. K. Watson, and R. O. Pohl, Phys. Rev. B 46, 6131 (1992).
- Maillet et al. (2000) D. Maillet, S. André, J. C. Batsale, A. Degiovanni, and C. Moyne, Thermal Quadrupoles: Solving the Heat Equation through Integral Transforms (Wiley, New York, 2000).
- Aster et al. (2019) R. Aster, B. Borchers, and C. Thurber, Preface to the third edition, in Parameter Estimation and Inverse Problems (Third Edition), edited by R. C. Aster, B. Borchers, and C. H. Thurber (Elsevier, Amsterdam, Netherlands, 2019) third edition ed., pp. ix – xi.
- Reifenberg et al. (2010) J. P. Reifenberg, K.-W. Chang, M. A. Panzer, S. Kim, J. A. Rowlette, M. Asheghi, H.-S. P. Wong, and K. E. Goodson, IEEE Electron Device Letters 31, 56 (2010).
- Kittel (1986) C. Kittel, Introduction to Solid State Physics, 6th edition (Wiley, New York, 1986).
- Baroni et al. (2001) S. Baroni, S. de Gironcoli, A. D. Corso, and P. Giannozzi, Rev. Mod. Phys. 73, 515 (2001).
- Giannozzi et al. (2009) P. Giannozzi, S. Baroni, N. Bonini, M. Calandra, R. Car, C. Cavazzoni, D. Ceresoli, G. L. Chiarotti, M. Cococcioni, and I. D. et al., J. Phys.: Condens.Matter 21, 395502 (2009).
- Perdew et al. (1996) J. P. Perdew, K. Burke, and M. Ernzerhof, Phys. Rev. Lett. 77, 3865 (1996).
- Shaltaf et al. (2009) R. Shaltaf, X. Gonze, M. Cardona, R. K. Kremer, and G. Siegle, Phys. Rev. B 79, 075204 (2009).
- Blochl (1994) P. E. Blochl, Phys. Rev. B 50, 17953 (1994).
- Monkhorst and Pack (1976) H. J. Monkhorst and J. D. Pack, Phys. Rev. B 13, 5188 (1976).
- Momma and Izumi (2011) K. Momma and F. Izumi, J. Appl. Cryst. 44, 1272 (2011).
- Madsen and Singh (2006) G. K. H. Madsen and D. J. Singh, Comput. Phys. Commun. 175, 67 (2006).
- Chaput (2013) L. Chaput, Phys. Rev. Lett. 110, 265506 (2013).
- Togo et al. (2015) A. Togo, L. Chaput, and I. Tanaka, Phys. Rev. B 91, 094306 (2015).
- Jain et al. (2013) A. Jain, S. P. Ong, G. Hautier, W. Chen, W. D. Richards, S. Dacek, S. Cholia, D. Gunter, D. Skinner, G. Ceder, and K. a. Persson, The Materials Project: A materials genome approach to accelerating materials innovation, APL Materials 1, 011002 (2013).
- Jeong et al. (2017) K. Jeong, S. Park, D. Park, M. Ahn, J. Han, W. Yang, H.-S. Jeong, and M.-H. Cho, Sci. Rep. 7, 955 (2017).
- Bahl and Chopra (1970) S. K. Bahl and K. L. Chopra, J. Appl. Phys. 41, 2196 (1970).
- Goldsmid (2010) H. J. Goldsmid, Introduction to Thermoelectricity (Springer-Verlag Berlin Heidelberg, 2010).
- Gelbstein et al. (2010) Y. Gelbstein, B. Dado, O. Ben-Yehuda, Y. Sadia, Z. Dashevsky, and M. P. Dariel, Journal of Electronic Materials 39, 2049 (2010).
- Pereira et al. (2013) P. B. Pereira, I. Sergueev, S. Gorsse, J. Dadda, E. Müller, and R. P. Hermann, Phys. Status Solidi B 250, 1300 (2013).
- Kaviany (2014) M. Kaviany, Heat Transfer Physics, 2nd ed. (Cambridge University Press, New York, NY, 2014).
- Fugallo et al. (2013) G. Fugallo, M. Lazzeri, L. Paulatto, and F. Mauri, Phys. Rev. B 88, 045430 (2013).
- ichiro Tamura (1983) S. ichiro Tamura, Phys. Rev. B 27, 858 (1983).
- Laeter et al. (2003) J. R. D. Laeter, J. K. Böhlke, P. D. Bièvre, H. Hidaka, H. S. Peiser, K. J. R. Rosman, and P. D. P. Taylor, Pure Appl. Chem. 75, 683 (2003).
- Mizokami et al. (2018) K. Mizokami, A. Togo, and I. Tanaka, Phys. Rev. B 97, 224306 (2018).
- Ratsifaritana and Klemens (1987) C. A. Ratsifaritana and P. G. Klemens, Int J Thermophys 8, 737 (1987).
- Fugallo and Colombo (2018) G. Fugallo and L. Colombo, Phys. Scr. 93, 043002 (2018).
- Linnera and Karttunen (2017) J. Linnera and A. J. Karttunen, Phys. Rev. B 96, 014304 (2017).