High prevalence regimes in the pair quenched mean-field theory for the susceptible-infected-susceptible model on networks
Abstract
Reckoning of pairwise dynamical correlations significantly improves the accuracy of mean-field theories and plays an important role in the investigation of dynamical processes on complex networks. In this work, we perform a nonperturbative numerical analysis of the quenched mean-field theory (QMF) and the inclusion of dynamical correlations by means of the pair quenched mean-field (PQMF) theory for the susceptible-infected-susceptible (SIS) model on synthetic and real networks. We show that the PQMF considerably outperforms the standard QMF on synthetic networks of distinct levels of heterogeneity and degree correlations, providing extremely accurate predictions when the system is not too close to the epidemic threshold while the QMF theory deviates substantially from simulations for networks with a degree exponent . The scenario for real networks is more complicated, still with PQMF significantly outperforming the QMF theory. However, despite of high accuracy for most investigated networks, in a few cases PQMF deviations from simulations are not negligible. We found correlations between accuracy and average shortest path while other basic networks metrics seem to be uncorrelated with the theory accuracy. Our results show the viability of the PQMF theory to investigate the high prevalence regimes of recurrent-state epidemic processes on networks, a regime of high applicability.
I Introduction
Pairwise approximation constitutes a valuable tool recurrently used for understanding dynamical processes on graphs (networks or lattices) and, particularly, epidemic spreading on the top of complex networks Kiss et al. (2017); Wang et al. (2017); de Arruda et al. (2018). This approach outperforms ordinary mean-field approximations extending dynamical equations from one-site to a pair level Marro and Dickman (2005). Extensions to higher orders methods using -cluster approximations Ben-Avraham and Köhler (1992) can lead to more accurate theories at the cost of increasing the theoretical complexity. While being of limited application for low dimensional systems near to critical phase transitions Marro and Dickman (2005), pair approximations can be remarkable improvements with respect to the one-site theory if either we are not too close to the transition Joo and Lebowitz (2004) or if the system dimension is large such as the case of random graphs Gleeson (2011, 2013).
For dynamical processes on the top of complex networks, heterogeneities play a central role Barrat et al. (2008); Pastor-Satorras et al. (2015) that has to be taken into account to reproduce the most fundamental results Pastor-Satorras and Vespignani (2001); Yang Wang et al. (2003). Particularly, the interplay between structural heterogeneity and dynamical correlations has been investigated using heterogeneous pair-approximations Eames and Keeling (2002); Keeling (1999); Gleeson (2011, 2013); Mata et al. (2014). We consider the susceptible-infected-susceptible (SIS) model Barrat et al. (2008) whose dependence on heterogeneities serves as reference for many other dynamical processes Barrat et al. (2008); Rodrigues et al. (2016). In the SIS model individuals are represented by vertices of a network and can be in either susceptible or infected states. Infected vertices heals spontaneously with rate and infect their susceptible neighbors with rate per contact. A central aspect of spreading phenomena is the epidemic threshold above which an extensive fraction of the population is infected or, in other words, the epidemic prevalence is finite.
Heterogeneities of networks can change drastically the behavior of the threshold. If the network possesses a heavy-tailed degree distribution in the form of a power-law the epidemic threshold of SIS model is zero in the thermodynamical limit when the network size goes to infinity Chatterjee and Durrett (2009); Mountford et al. (2016); Castellano and Pastor-Satorras (2010). This involves a very special type of transition from an active and fluctuating to an absorbing state Castellano and Pastor-Satorras (2012); Boguñá et al. (2013) which can be knocked out with small modifications of the SIS dynamics Ferreira et al. (2016); Cota et al. (2018). The SIS transition on uncorrelated power-law networks can be of two types Castellano and Pastor-Satorras (2012); Boguñá et al. (2013); Ferreira et al. (2016): if the degree exponent is small () the activation is triggered by a densely connected core identified by the maximal index of a -core decomposition Castellano and Pastor-Satorras (2012). If the degree exponent is large () then the activation is ruled by the hubs. The latter involves long-term epidemic activity on star subgraphs, composed of a single hub (the center) and its nearest-neighbors (the leaves), through a feedback mechanism where the hub infects the leaves which in turn reinfect the hub. This activity must last for sufficiently long times to permit the mutual activation of hubs which are not directly connected (long-range) Chatterjee and Durrett (2009); Mountford et al. (2016); Boguñá et al. (2013).
Heterogeneities can be included in mean-field approximations in different forms Pastor-Satorras et al. (2015). Two widely used approximations are the heterogeneous mean-field (HMF) Pastor-Satorras and Vespignani (2001) and quenched mean-field (QMF) Yang Wang et al. (2003); Chakrabarti et al. (2008) theories. The former consists of a cross-graining where only the degree of the nodes and the statistical degree correlations are included in the dynamical equations for the probability that a node is infected Pastor-Satorras and Vespignani (2001); Boguñá and Pastor-Satorras (2002), and neglects the dynamical correlations. The latter includes the full connectivity structure of the networks but still neglects dynamical correlations assuming that the states of nearest-neighbors are independent. Due to the aforementioned nature of the SIS activation mechanisms, the explicit inclusion of the network connectivity structure, as in the QMF approach, is imperative to construct mean-field theories of the SIS model since heterogeneous mixing, which corresponds to an annealed network Castellano and Pastor-Satorras (2012), will destroy localization effects as for example the self-sustained activity in a star subgraph.
Despite of the detailed microscopic description of the QMF theory, neglecting dynamical correlations in SIS model can lead to modest accuracy with significant deviations from simulations Ferreira et al. (2012); Mata and Ferreira (2013); Silva et al. (2019) if epidemic involves, for example, activation localized in the hubs that spreads to the rest of network Chatterjee and Durrett (2009); Castellano and Pastor-Satorras (2012). Indeed, the threshold predicted by the QMF theory for the SIS model, given by the inverse of the largest eigenvalue of the adjacency matrix Yang Wang et al. (2003); Castellano and Pastor-Satorras (2010) (see Sec. II for details), involves a localized phase on random power-law networks with degree exponent Goltsev et al. (2012). Dynamical correlations reckoned by individual pairwise interactions greatly improve the predictions of the epidemic thresholds of the QMF approach in the so-called pair QMF (PQMF) theory Mata and Ferreira (2013); see Sec. II for details. Indeed, PQMF theory de Arruda et al. (2018); Wang et al. (2017); Silva et al. (2019); St-Onge et al. (2018) and modified versions of it Matamalas et al. (2018); Wu and Hadzibeganovic (2018); Wu et al. (2019); Wu and Hadzibeganovic (2020) have been intensively investigated recently. The asymptotic scaling exponent of the threshold as function of the network size is unchanged when the pair-approximation is included in the QMF theory Mata and Ferreira (2013); Silva et al. (2019).
Since PQMF theory has been mainly analyzed perturbatively in the limit of very low prevalence to investigate the position of the epidemic thresholds, Matamalas et al. Matamalas et al. (2018) claimed that it has limitations to compute high epidemic incidence regimes and proposed that a microscopic Markov chain approach (MMCA) Gómez et al. (2010), which is a discrete time version of the QMF theory, could be used instead. However, a nonperturbative approach is possible though numerical integration of both QMF and PQMF dynamical equations. Since large discrepancies between discrete and continuous time approaches can be present in the SIS dynamics Fennell et al. (2016), a nonperturbative analysis of QMF and PQMF theories is necessary. We develop nonperturbative analyses of both QMF and PQMF theories for SIS on networks using numerical integration of the corresponding dynamical equations. We consider both large synthetic networks generated with the Weber-Porto model Weber and Porto (2007) and real networks with different levels of degree correlation. We address regimes not asymptotically close to the epidemic threshold since the mean-field theories fail in predicting very low densities of infected vertices Silva et al. (2019); Mountford et al. (2013). However, numerical analyses supports that this asymptotic scaling is confined into a small interval near to such that the mean-field theories are still applicable beyond this region; see Fig. 1. We report that the PQMF theory predicts very accurately the epidemic prevalence in synthetic networks for all ranges of degree exponent ( and ) and correlations (assortative, disassortative, or uncorrelated) investigated while QMF theory presents significant deviations for . For real networks, in general, PQMF theory considerably outperforms QMF but also presents non-negligible deviations from simulations in some cases.
The remaining of the paper is organized as follows. The mean-field theories used in this work are discussed in Sec. II. The comparison of numerical integration and stochastic simulations are performed in Sec. III while our concluding remarks are presented in Sec. IV. Appendices A, B, and C present technical details of our numerical analyses.
II Mean-field theories
We investigate the SIS model on a connected, undirected, and unweighted network with vertices whose structure is encoded in the adjacency matrix defined by if and are connected and otherwise. The healing rate is fixed to without loss of generality.
The probability that a vertex is infected, represented by , evolves as Mata and Ferreira (2013)
| (1) |
where is the probability that a vertex is susceptible and its nearest-neighbor is infected. Equation (1) is exact but not closed. A closed system is obtained taking the one-site approximation that correspond to the QMF theory Chakrabarti et al. (2008); Goltsev et al. (2012)
| (2) |
The QMF epidemic threshold is given by where is the largest eigenvalue (LEV) of the adjacency matrix .
The PQMF theory includes dynamical correlations considering the evolution of which, in its complete but not closed form, depends on the triplets; see Ref. Mata and Ferreira (2013). The PQMF theory consists of approximating the triplets in which and are both connected to by
| (3) |
Here , , and are the states of the vertices that, in the SIS case, can be either infected or susceptible. The approximation given by Eq. (3) considers that does not form a triangle, i.e., and are connected to but not to each other. Actually, the effects of clustering have been recently investigated Wu and Hadzibeganovic (2020) and it was shown that even in networks with high cluster coefficient, plenty of triangles, the approximation given by Eq. (3) performs very well for the steady state. The final PQMF equation for becomes
| (4) | |||||
in which . Equations (1) and (4) form a closed system of equations where is the number of edges of the network. More details of the derivation are given in Ref. Mata and Ferreira (2013).
The epidemic threshold within the PQMF framework is given by the transcendent equation Silva et al. (2019) where is the largest eigenvalue of the weighted adjacency matrix given by
| (5) |
Very close to the threshold, the epidemic prevalence , defined as , approaches zero following a power-law in the form where is a critical exponent Marro and Dickman (2005) and is prefactor that may depend on the network size. Either in QMF Goltsev et al. (2012); Van Mieghem (2011) and PQMF Silva et al. (2019) theories it can be shown that while or can be expressed in terms of the principal eigenvector (PEV) of either or , respectively, as Silva et al. (2019); Goltsev et al. (2012)
| (6) |
These results are straightforwardly derived when the network presents a spectral gap , where is the second LEV of the adjacency matrix; see e.g. Goltsev et al. (2012); Silva et al. (2019). However, it was shown that is always true Van Mieghem (2012) and the same is expected for the PQMF theory since pair approximations should not change the universality class predicted by the one-vertex theory Ben-Avraham and Köhler (1992).
The mean-field exponent does not match the rigorous results obtained by Mountford et al. Mountford et al. (2013) in thermodynamical limit where
| (7) |
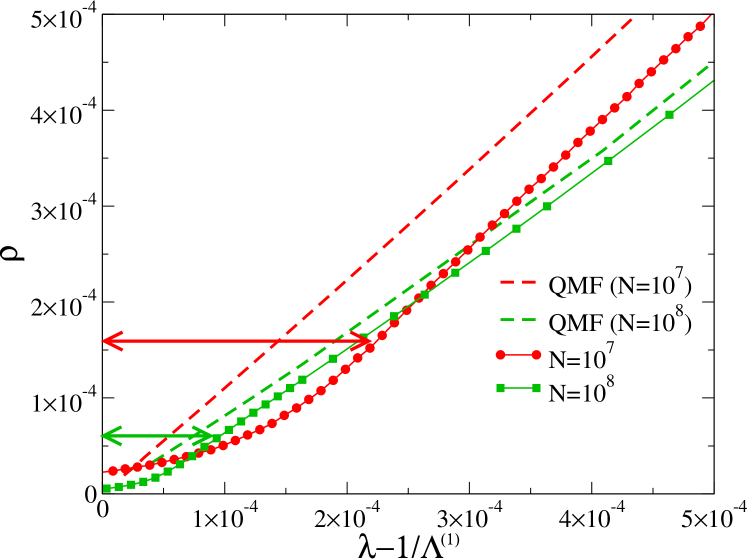
according to which for any . For large networks with , where the epidemic threshold is very accurately reproduced by the QMF theory, the numerical integration performed in Ref. Silva et al. (2019) confirms the deviation from the exact result for approaching while stochastic simulations are in agreement with the rigorous results. However, the simulations show a pre-asymptotic behavior fully consistent with . In a linear scale111Obviously, this region will not shrunk in a logarithm scale and the asymptotic scaling is the theoretical one given by Eq. (7)., the region that departs from linearity is squeezed around as the network size increases, as indicated by the horizontal arrows in Fig. 1, in which simulations and QMF theory are compared. The slope of the linear region decreases with size since also does: we found for and for . Finally, we see that QMF is not able to capture quantitatively the amplitude of the linear region observed in simulations reinforcing the need of nonperturbative analyses of the PQMF theory.
A closed solution for Eqs (1) and (4) can be derived for the particular case of homogeneous networks where for which and . The expression for stationary epidemic prevalence is222The solution is same derived for the contact process in, e.g., Ref. Ferreira and Ferreira (2013) replacing the infection rate , where is the infection rate for the contact process and for SIS.
| (8) |
III Results
We numerically integrated QMF and PQMF equations using a fourth-order Runge-Kutta method with time step to . Initial conditions consistent with the exact closure equations relating pairwise and single vertex probabilities such as must be chosen and the steady state is insensitive to a particular choice. We performed stochastic simulations of the SIS dynamics on networks using an optimized Gillespie algorithm Cota and Ferreira (2017); see Appendix C. The absorbing states, which are rigorously the unique real stationary state in finite size networks, were circumvented using quasistationary (QS) simulations Sander et al. (2016); see Appendix B.
III.1 Synthetic networks
A simple metrics to quantify the correlations is the average degree of the nearest-neighbors of vertices with a given degree Pastor-Satorras et al. (2001); Barrat et al. (2008), represented by . The functional form of reveals correlation patterns of the network. If is an increasing function of , the network presents assortative correlations where vertices of similar degree tend to be connected. Conversely, if decreases with the network has disassortative correlations where vertices of high degree tend to be connected with vertices of low degree. Finally, if does not depend of the degree, the networks is said uncorrelated or neutral and assumes de value Barrat et al. (2008).
We investigated networks with distributions and where . For we used that permits to build networks without degree correlation with the uncorrelated configuration model (UCM) Catanzaro et al. (2005). The factor 2 helps to accelerate the convergence to the asymptotic limit where both and Silva et al. (2019). For , a rigid cutoff given by Dorogovtsev et al. (2008) was used to suppress multiple (localized) transitions Mata and Ferreira (2015) and facilitating threshold determination. Degree correlations were included using the benchmark model proposed by Weber and Porto Weber and Porto (2007), hereafter called Weber-Porto configuration model (WPCM); see Appendix A. The dependence was investigated where , and correspond to disassortative, neutral, and assortative correlations respectively.
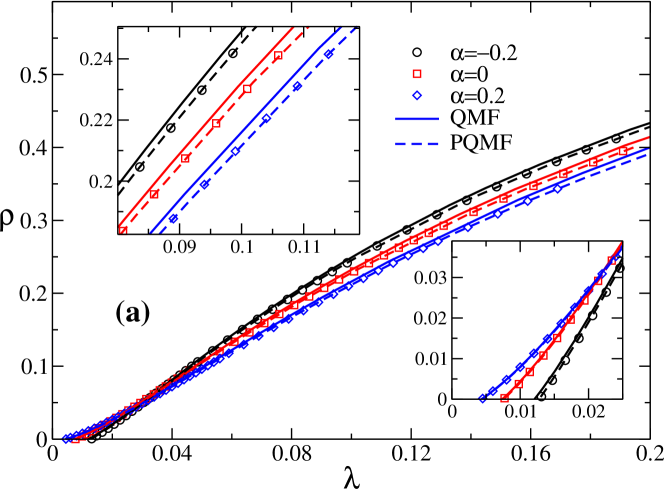
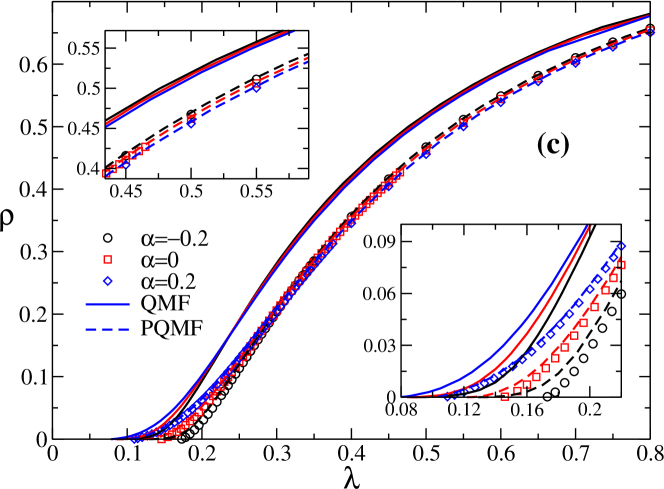
Epidemic prevalence obtained from theories and stochastic simulations are compared in Fig. 2. While QMF theory deviates from simulation for regimes of high densities of infected vertices, PQMF cannot be distinguished from simulations in the presented scales. At low densities regimes, QMF and PQMF agree very well and are indistinguishable from simulations for , Fig. 2(a), while larger deviations of QMF can be seen for larger values of , Figs 2(b) and (c). The accuracy of the theories at low prevalence is better for assortative and worse for disassortative networks when compared with the neutral case. Another interesting dependence on the assortativity can be observed in these curves. For low prevalence, assortative and disassortative networks possess, respectively, higher and lower densities if compared with the uncorrelated networks. At high prevalences, the converse is observed where disassortative networks present higher densities than the assortative and neutral networks. The same behavior is observed for all values of , indicating that it is related to the degree correlations. The behavior at low densities can be explained in terms of reduced capacity to transmit infection when hubs are surrounded by low degree vertices in the disassortative case rather than being directly connected more likely in the assortative case. We cannot provide simple arguments for inverted dependence on the assortativity degree at high densities, but it is very precisely reproduced by the PQMF theory. We also simulated the SIS on larger networks with vertices and the level of accuracy of the mean-field theories is similar.
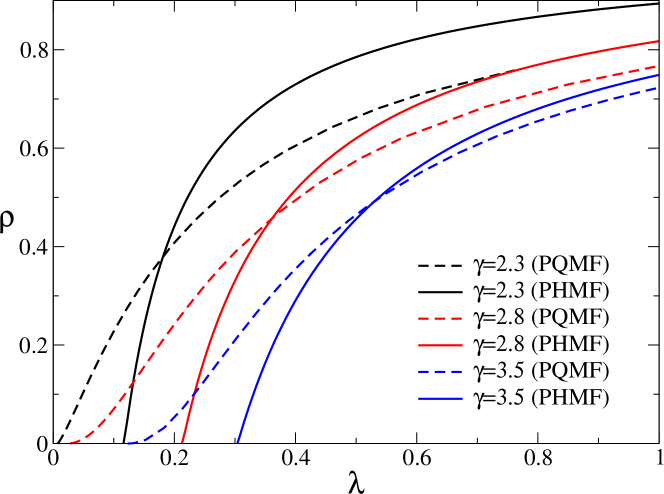
We also investigate the role of the heterogeneity comparing the PQMF theory with a pair homogeneous mean-field theory (PHMF) using Eq. (8) with replaced by the average degree of the network Juhász et al. (2012); de Oliveira et al. (2019). The density of infected vertices obtained in both pairwise approaches are shown in Fig. 3. Beyond the expected discrepancy for describing the low prevalence regimes, since one theory predicts a finite while the other a vanishing threshold, the regime of high epidemic prevalence is affected by inclusion of heterogeneity. As one could expect, the more heterogeneous networks present the larger discrepancies between homogeneous and heterogeneous theories.
III.2 Real networks
Real networks usually present some degree of correlation and, in many case, the patterns can be quite complex exhibiting both assortative and disassortative correlations for distinct ranges of degree Barrat et al. (2008); Barabási and Pósfai (2016). Therefore the comparison between mean-field theories and simulations are necessary in order to determine in which extent the accuracy observed in synthetic networks holds in the real-world counterparts. We selected some networks with different levels of heterogeneity, sizes, and correlations recently used in the investigation of epidemic processes Silva et al. (2019); Castellano and Pastor-Satorras (2017); Pastor-Satorras and Castellano (2018). For detailed information about the original references for all the networks see Refs. Radicchi (2015); Radicchi and Castellano (2015).
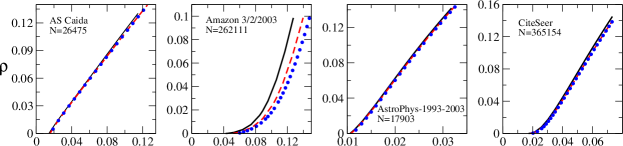
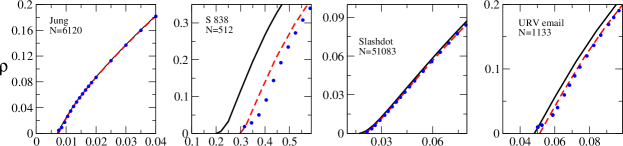
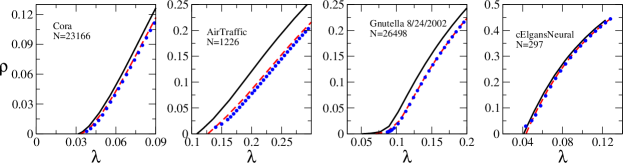
Figure 4 presents the prevalence as a function of the infection rate for 12 real networks. We remark that data asymptotically close to the epidemic threshold are known to mismatch simulations Silva et al. (2019) and are beyond the scope of the present work. In some cases, QMF and PQMF are indistinguishable from each other and agree almost perfectly with simulations in the scale presented in these figures. In other cases, QMF theory deviates considerably from simulations while PQMF remains accurate. In order to quantify the differences we define the relative deviation of densities obtained in simulations () and the QMF theory () as
| (9) |
where and are the initial and final infection rates in the simulations presented in Fig. 4, and an equivalent definition of for the PQMF theory. The relative deviations are given in Table 1. The positivity of shows that the mean-field theories overestimate the density obtained in simulations as expected since dynamical correlations, pruned in mean-field theories, reduce the spreading capacity of the epidemic process. As can be seen, we have such that PQMF is always more precise than QMF. Three networks present significant deviations of the PQMF theory from the simulations, namely, for Amazon customer, electronic circuit S838, and air traffic networks with 24%, 7% and 6.6% of deviation, respectively.
III.3 Accuracy versus structural properties
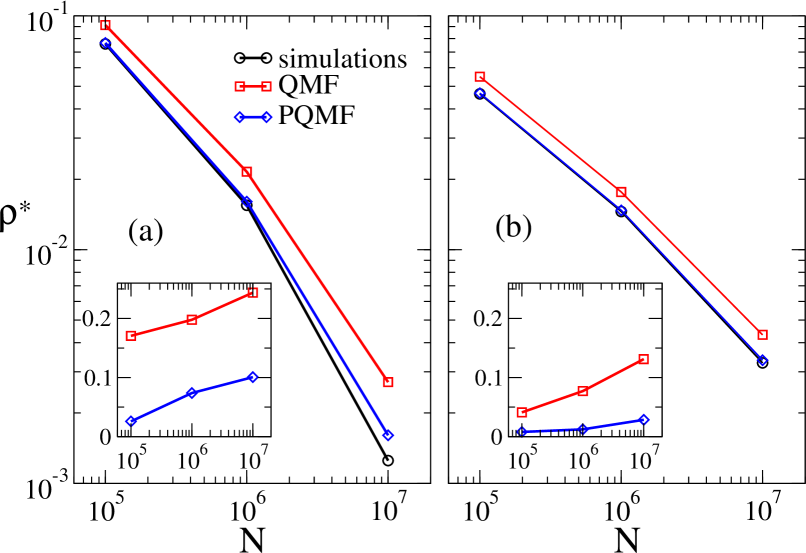
The gain of PQMF theory with respect to QMF in real networks is expressive but it still deviates from simulations in some cases, as shown in Table 1. One central question is to determine when either QMF or PQMF performance is satisfactory enough. Near to the transition point, when the prevalence is very small, a relation between accuracy and localization of the PEV of the weighted adjacency matrices obtained in the linearization has been proposed Silva et al. (2019). This is justified by the fact that a leading contribution for the probability that a vertex is infected in the mean-field theories is proportional to the corresponding PEV of or for QMF and PQMF theories, respectively. For sake of completeness of Ref. Silva et al. (2019), in which the accuracy on epidemic threshold was discussed thoroughly, Fig. 5 shows the steady state density calculated slightly above the epidemic threshold of the PQMF theory against the network size. The PQMF theory is much more accurate than QMF but also start to deviate from simulations as the networks size increases. In both cases the accuracy is larger for networks with less localized PEV as quantified by the inverse participation ratio (IPR) Goltsev et al. (2012) defined as
| (10) |
where is the normalized PEV defined in Sec. II . As larger as the IPR, more localized is the PEV. Insets of Fig. 5 shows the IPR for both QMF and PQMF theories where we see that the latter is much less localized than the former, but still increases towards a finite value as the network size increases indicating localization asymptotically.
| Network | ||||
|---|---|---|---|---|
| AS Caida | 0.032 | 0.0022 | 0.0240 | 0.0139 |
| Amazon 3/2/03 | 0.75 | 0.24 | 0.106 | 0.0114 |
| AstroPhys 93-03 | 0.035 | 0.013 | 0.0045 | 0.0043 |
| CiteSeer | 0.067 | 0.010 | 0.0177 | 0.0109 |
| Jung | 0.0079 | 0.0021 | 0.0478 | 0.0335 |
| S 838 | 0.28 | 0.070 | 0.179 | 0.0340 |
| Slashdot | 0.032 | 0.0011 | 0.144 | 0.0347 |
| URV email | 0.022 | 0.0028 | 0.0096 | 0.0087 |
| Cora | 0.152 | 0.037 | 0.0100 | 0.0090 |
| Air Traffic | 0.38 | 0.066 | 0.0191 | 0.0154 |
| Gnutella 8/24/02 | 0.17 | 0.0066 | 0.214 | 0.0800 |
| cElegans Neural | 0.057 | 0.0078 | 0.0189 | 0.0175 |
However, the nonperturbative theory accounts for the contributions of the complete basis of eigenvectors, whether it is of or , and this comparison is not justifiable anymore. Indeed, as shown in Table 1, the accuracy of the QMF theory can be high even when the PEV is localized as, for example, in the case of the Slashdot network. In other cases, as Air Traffic and Cora networks, the PEV localization corresponding to QMF and PQMF theories are similar but the performance of the latter is much better. We performed a statistical analysis of the correlations between and and found no statistically significant -values of and . It is worth to note that the statistical analyses considering the linear data present even smaller statistical significance.
We also checked (logarithm) statistical correlations of with other basic network metrics, namely, the heterogeneity coefficient , the modularity coefficient Newman (2010), the average clustering coefficient , and average shortest distances . We found statistical significance with only with and . Actually, and are correlated since more heterogeneous networks tend to have shortest average distances due to the shortcuts introduced by hubs Barabási and Pósfai (2016). The correlation between and actually is not very surprising since one intuitively expects that the shorter are distances more the mean-field hypothesis of neglecting long-range correlations becomes accurate. One interesting feature is that the approximation given by Eq. (3) in the PQMF theory discards the possibility of triangles Mata and Ferreira (2013), in which the neighbors and of are also connected. So, one could expect a worse performance in networks with high clustering coefficient but no statistical correlation with this metrics was found (). In summary, we could not infer which structural properties rule the accuracy of the mean-field approaches in the regimes of high prevalences.
IV Conclusions
Theoretical understanding of dynamical processes on networks constitutes a powerful tool for protection against threats such as disease dissemination, misinformation propagations, transportation infrastructure overload, among many other examples. Reliable theoretical approximations are usually required to consider the heterogeneous structure of the contact networks and the dynamical correlations, in which the states of neighboring individuals are statistically correlated. These features are explicitly included in the PQMF theory Mata and Ferreira (2013). However, this theory has been applied mainly to analyze the behavior of epidemic processes in the neighborhood of the transition from an endemic to a disease-free state trough perturbative analyses where the epidemic prevalence is very small. In this work, we contribute to fill this gap performing a detailed nonperturbative numerical analysis of the SIS model on synthetic and real networks within a wide range of heterogeneities and assortativities.
For synthetic networks generated with the Weber-Porto Weber and Porto (2007) configuration model, we report that the PQMF theory predicts with great accuracy the regime of high prevalence observed in stochastic simulations in networks with power-law degree distributions for all values of degree exponents investigated (, 2.8, and 3.5) and degree correlations (disassortative, neutral and assortative). In the case of large , where hubs tend to be separated apart as the network size increases, we observed that the PQMF theory significantly outperforms the simpler QMF theory where heterogeneity is fully considered but dynamical correlations are neglected, being the discrepancy between theories larger for large . The high accuracy of the PQMF theory at high prevalences contrasts with its bad performance for asymptotically low densities where the theory is known to deviate from exactly known critical behavior Mountford et al. (2013) where with while mean-field exponent is Silva et al. (2019). We argue, however, that this mismatch is constrained to a region very close to such that the regime of not too low density can still be accurately described by the PQMF theory.
In a set of real networks, where much more complex structures and correlations can be present, we observed that PQMF always outperforms (sometimes very significantly) the QMF theory, but may still presents non negligible deviations from simulations in some cases; see Table 1. Differently from the low prevalence regime where the accuracy of mean-field theories is correlated with spectral properties of Jacobian matrices, only trivial statistical correlations with simple network metrics could be identified and the problem of predicting when the nonperturbative analysis is sufficiently accurate given certain network properties remains open.
Finally, we expect that our work will stimulate the application of nonperturbative approaches through the numerical integration of continuous-time equations to address other fundamental problems of dynamical processes on networks.
Appendix A Weber-Porto configuration model
The WPCM networks are generated as follows. The degree of each vertex is drawn according to the degree distribution such that each node has unconnected half-edges. Two half-edges are chosen and connected with probability
| (11) |
where and are the respective degrees of the chosen vertices and is the maximum value of
| (12) |
where where is the probability that an edge ends on a vertex of degree . Self and multiple connections are forbidden. In the absence of degree correlations, we have , implying and . See Ref. Weber and Porto (2007) for more details.
Appendix B Quasi-stationary method
We applied the standard QS method Sander et al. (2016); de Oliveira and Dickman (2005); Cota and Ferreira (2017) where the dynamics returns to a previously visited active configuration with at least one infected vertex every time the system falls into the absorbing state where all vertices are simultaneously susceptible. The method is implemented by building and constantly updating a list with active configurations. Every time the systems falls into the absorbing state one of the configurations is chosen with equal chance to replace the absorbing state. The list is updated with probability by unit of time and the update consists of replacing a randomly selected configuration of the list by the present state of the dynamics. The QS averages are computed during an averaging time varying from to after a relaxation time , the longer times for the lower densities where fluctuations are more relevant.
Appendix C Stochastic simulation of the SIS model
Simulations of SIS model were performed using the optimized Gillespie algorithm described in Cota and Ferreira (2017). The number of infected vertices and the total number of edges emanating from them are computed and kept updated along the simulations. In each time step, with probability
| (13) |
one infected vertex is chosen with equal chance and healed. With the complementary probability
| (14) |
one infected vertex is chosen with probability proportional to its degree. One of nearest-neighbors of , represented by , is chosen with equal chance. If is susceptible, it becomes infected and, otherwise, no change of state is implemented. The time is incremented by
| (15) |
where is a pseudo random number uniformly distributed in the interval .
Acknowledgements.
This work was partially supported by the Brazilian agencies CNPq and FAPEMIG. This study was financed in part by the Coordenação de Aperfeiçoamento de Pessoal de Nível Superior - Brasil (CAPES) - Finance Code 001.References
- Kiss et al. (2017) I. Kiss, J. Miller, and P. Simon, Mathematics of Epidemics on Networks: From Exact to Approximate Models (Springer International Publishing, Cham, Switzerland, 2017).
- Wang et al. (2017) W. Wang, M. Tang, H. Eugene Stanley, and L. A. Braunstein, “Unification of theoretical approaches for epidemic spreading on complex networks,” Reports Prog. Phys. 80, 036603 (2017).
- de Arruda et al. (2018) G. F. de Arruda, F. A. Rodrigues, and Y. Moreno, “Fundamentals of spreading processes in single and multilayer complex networks,” Phys. Rep. 756, 1 (2018).
- Marro and Dickman (2005) J. Marro and R. Dickman, Nonequilibrium Phase Transitions in Lattice Models, Aléa-Saclay (Cambridge University Press, 2005).
- Ben-Avraham and Köhler (1992) D. Ben-Avraham and J. Köhler, “Mean-field ( n , m )-cluster approximation for lattice models,” Phys. Rev. A 45, 8358 (1992).
- Joo and Lebowitz (2004) J. Joo and J. L. Lebowitz, “Pair approximation of the stochastic susceptible-infected-recovered-susceptible epidemic model on the hypercubic lattice,” Phys. Rev. E 70, 036114 (2004).
- Gleeson (2011) J. P. Gleeson, “High-accuracy approximation of binary-state dynamics on networks,” Phys. Rev. Lett. 107, 068701 (2011).
- Gleeson (2013) J. P. Gleeson, “Binary-state dynamics on complex networks: Pair approximation and beyond,” Phys. Rev. X 3, 021004 (2013).
- Barrat et al. (2008) A. Barrat, M. Barthlemy, and A. Vespignani, Dynamical Processes on Complex Networks (Cambridge University Press, New York, NY, USA, 2008).
- Pastor-Satorras et al. (2015) R. Pastor-Satorras, C. Castellano, P. Van Mieghem, and A. Vespignani, “Epidemic processes in complex networks,” Rev. Mod. Phys. 87, 925 (2015).
- Pastor-Satorras and Vespignani (2001) R. Pastor-Satorras and A. Vespignani, “Epidemic Spreading in Scale-Free Networks,” Phys. Rev. Lett. 86, 3200 (2001).
- Yang Wang et al. (2003) Yang Wang, D. Chakrabarti, Chenxi Wang, and C. Faloutsos, “Epidemic spreading in real networks: an eigenvalue viewpoint,” in 22nd Int. Symp. Reliab. Distrib. Syst. 2003. Proceedings. (IEEE Comput. Soc, 2003) pp. 25–34.
- Eames and Keeling (2002) K. T. D. Eames and M. J. Keeling, “Modeling dynamic and network heterogeneities in the spread of sexually transmitted diseases,” Proc. Natl. Acad. Sci. 99, 13330 (2002).
- Keeling (1999) M. J. Keeling, “The effects of local spatial structure on epidemiological invasions,” Proc. R. Soc. London. Ser. B Biol. Sci. 266, 859 (1999).
- Mata et al. (2014) A. S. Mata, R. S. Ferreira, and S. C. Ferreira, “Heterogeneous pair-approximation for the contact process on complex networks,” New J. Phys. 16, 053006 (2014).
- Rodrigues et al. (2016) F. A. Rodrigues, T. K. D. Peron, P. Ji, and J. Kurths, “The Kuramoto model in complex networks,” Phys. Rep. 610, 1 (2016).
- Chatterjee and Durrett (2009) S. Chatterjee and R. Durrett, “Contact processes on random graphs with power law degree distributions have critical value 0,” Ann. Probab. 37, 2332 (2009).
- Mountford et al. (2016) T. Mountford, J.-C. Mourrat, D. Valesin, and Q. Yao, “Exponential extinction time of the contact process on finite graphs,” Stoch. Process. their Appl. 126, 1974 (2016).
- Castellano and Pastor-Satorras (2010) C. Castellano and R. Pastor-Satorras, “Thresholds for Epidemic Spreading in Networks,” Phys. Rev. Lett. 105, 218701 (2010).
- Castellano and Pastor-Satorras (2012) C. Castellano and R. Pastor-Satorras, “Competing activation mechanisms in epidemics on networks,” Sci. Rep. 2, 24 (2012).
- Boguñá et al. (2013) M. Boguñá, C. Castellano, and R. Pastor-Satorras, “Nature of the epidemic threshold for the susceptible-infected-susceptible dynamics in networks,” Phys. Rev. Lett. 111, 068701 (2013).
- Ferreira et al. (2016) S. C. Ferreira, R. S. Sander, and R. Pastor-Satorras, “Collective versus hub activation of epidemic phases on networks,” Phys. Rev. E 93, 032314 (2016).
- Cota et al. (2018) W. Cota, A. S. Mata, and S. C. Ferreira, “Robustness and fragility of the susceptible-infected-susceptible epidemic models on complex networks,” Phys. Rev. E 98, 012310 (2018).
- Chakrabarti et al. (2008) D. Chakrabarti, Y. Wang, C. Wang, J. Leskovec, and C. Faloutsos, “Epidemic thresholds in real networks,” ACM Trans. Inf. Syst. Secur. 10, 1 (2008).
- Boguñá and Pastor-Satorras (2002) M. Boguñá and R. Pastor-Satorras, “Epidemic spreading in correlated complex networks,” Phys. Rev. E 66, 047104 (2002).
- Ferreira et al. (2012) S. C. Ferreira, C. Castellano, and R. Pastor-Satorras, “Epidemic thresholds of the susceptible-infected-susceptible model on networks: A comparison of numerical and theoretical results,” Phys. Rev. E 86, 041125 (2012).
- Mata and Ferreira (2013) A. S. Mata and S. C. Ferreira, “Pair quenched mean-field theory for the susceptible-infected-susceptible model on complex networks,” EPL (Europhysics Lett. 103, 48003 (2013).
- Silva et al. (2019) D. H. Silva, S. C. Ferreira, W. Cota, R. Pastor-Satorras, and C. Castellano, “Spectral properties and the accuracy of mean-field approaches for epidemics on correlated power-law networks,” Phys. Rev. Res. 1, 033024 (2019).
- Goltsev et al. (2012) A. V. Goltsev, S. N. Dorogovtsev, J. G. Oliveira, and J. F. F. Mendes, “Localization and Spreading of Diseases in Complex Networks,” Phys. Rev. Lett. 109, 128702 (2012).
- St-Onge et al. (2018) G. St-Onge, J.-G. Young, E. Laurence, C. Murphy, and L. J. Dubé, “Phase transition of the susceptible-infected-susceptible dynamics on time-varying configuration model networks,” Phys. Rev. E 97, 022305 (2018).
- Matamalas et al. (2018) J. T. Matamalas, A. Arenas, and S. Gómez, “Effective approach to epidemic containment using link equations in complex networks,” Sci. Adv. 4, eaau4212 (2018).
- Wu and Hadzibeganovic (2018) Q. Wu and T. Hadzibeganovic, “Pair quenched mean-field approach to epidemic spreading in multiplex networks,” Appl. Math. Model. 60, 244 (2018).
- Wu et al. (2019) Q. Wu, R. Zhou, and T. Hadzibeganovic, “Conditional quenched mean-field approach for recurrent-state epidemic dynamics in complex networks,” Phys. A Stat. Mech. its Appl. 518, 71 (2019).
- Wu and Hadzibeganovic (2020) Q. Wu and T. Hadzibeganovic, “An individual-based modeling framework for infectious disease spreading in clustered complex networks,” Appl. Math. Model. 83, 1 (2020).
- Gómez et al. (2010) S. Gómez, A. Arenas, J. Borge-Holthoefer, S. Meloni, and Y. Moreno, “Discrete-time markov chain approach to contact-based disease spreading in complex networks,” EPL 89, 38009 (2010).
- Fennell et al. (2016) P. G. Fennell, S. Melnik, and J. P. Gleeson, “Limitations of discrete-time approaches to continuous-time contagion dynamics,” Phys. Rev. E 94, 052125 (2016).
- Weber and Porto (2007) S. Weber and M. Porto, “Generation of arbitrarily two-point-correlated random networks,” Phys. Rev. E 76, 046111 (2007).
- Mountford et al. (2013) T. Mountford, D. Valesin, and Q. Yao, “Metastable densities for the contact process on power law random graphs,” Electron. J. Probab. 18 (2013), 10.1214/EJP.v18-2512.
- Van Mieghem (2011) P. Van Mieghem, “The N-intertwined SIS epidemic network model,” Computing 93, 147 (2011).
- Van Mieghem (2012) P. Van Mieghem, “The viral conductance of a network,” Comput. Commun. 35, 1494 (2012).
- Ferreira and Ferreira (2013) R. S. Ferreira and S. C. Ferreira, “Critical behavior of the contact process on small-world networks,” Eur. Phys. J. B 86, 462 (2013).
- Cota and Ferreira (2017) W. Cota and S. C. Ferreira, “Optimized Gillespie algorithms for the simulation of Markovian epidemic processes on large and heterogeneous networks,” Comput. Phys. Commun. 219, 303 (2017).
- Sander et al. (2016) R. S. Sander, G. S. Costa, and S. C. Ferreira, “Sampling methods for the quasistationary regime of epidemic processes on regular and complex networks,” Phys. Rev. E 94, 042308 (2016).
- Pastor-Satorras et al. (2001) R. Pastor-Satorras, A. Vázquez, and A. Vespignani, “Dynamical and Correlation Properties of the Internet,” Phys. Rev. Lett. 87, 258701 (2001).
- Catanzaro et al. (2005) M. Catanzaro, M. Boguñá, and R. Pastor-Satorras, “Generation of uncorrelated random scale-free networks,” Phys. Rev. E 71, 027103 (2005).
- Dorogovtsev et al. (2008) S. N. Dorogovtsev, a. V. Goltsev, and J. F. F. Mendes, “Critical phenomena in complex networks,” Rev. Mod. Phys. 80, 1275 (2008).
- Mata and Ferreira (2015) A. S. Mata and S. C. Ferreira, “Multiple transitions of the susceptible-infected-susceptible epidemic model on complex networks,” Phys. Rev. E 91, 012816 (2015).
- Juhász et al. (2012) R. Juhász, G. Ódor, C. Castellano, and M. A. Muñoz, “Rare-region effects in the contact process on networks,” Phys. Rev. E 85, 066125 (2012).
- de Oliveira et al. (2019) M. M. de Oliveira, S. G. Alves, and S. C. Ferreira, “Dynamical correlations and pairwise theory for the symbiotic contact process on networks,” Phys. Rev. E 100, 052302 (2019).
- Barabási and Pósfai (2016) A.-L. Barabási and M. Pósfai, Network science (Cambridge University Press, Cambridge, 2016).
- Castellano and Pastor-Satorras (2017) C. Castellano and R. Pastor-Satorras, “Relating Topological Determinants of Complex Networks to Their Spectral Properties: Structural and Dynamical Effects,” Phys. Rev. X 7, 041024 (2017).
- Pastor-Satorras and Castellano (2018) R. Pastor-Satorras and C. Castellano, “Eigenvector Localization in Real Networks and Its Implications for Epidemic Spreading,” J. Stat. Phys. 173, 1110 (2018).
- Radicchi (2015) F. Radicchi, “Predicting percolation thresholds in networks,” Phys. Rev. E 91, 010801 (2015).
- Radicchi and Castellano (2015) F. Radicchi and C. Castellano, “Breaking of the site-bond percolation universality in networks,” Nat. Commun. 6, 10196 (2015).
- Newman (2010) M. Newman, Networks: An Introduction (Oxford University Press, Oxford New York, 2010).
- de Oliveira and Dickman (2005) M. M. de Oliveira and R. Dickman, “How to simulate the quasistationary state,” Phys. Rev. E 71, 016129 (2005).