Constraining X-ray emission in HBL blazars using multiwavelength observations
Abstract
The X-ray spectrum of extreme HBL type blazars is located in the synchrotron branch of the broadband spectral energy distribution (SED), at energies below the peak. A joint fit of the extrapolated X-ray spectra together with a host galaxy template allows characterizing the synchrotron branch in the SED. The X-ray spectrum is usually characterized either with a pure or a curved power-law model. In the latter case, however, it is hard to distinguish an intrinsic curvature from excess absorption. In this paper, we focus on five well-observed blazars: 1ES 0229+200, PKS 0548-322, RX J1136+6737, 1ES 1741+196, 1ES 2344+514. We constrain the infrared-to-X-ray emission of these five blazars using a model that is characterized by the host galaxy, spectral curvature, absorption, and ultraviolet excess to separate these spectral features. In the case of four sources: 1ES 0229+200, PKS 0548-322, 1ES 1741+196, 1ES 2344+514 the spectral fit with the atomic neutral hydrogen from the Leiden Argentina Bonn Survey result in a significant UV excess present in the broadband spectral energy distribution. Such excess can be interpreted as an additional component, for example, a blue bump. However, in order to describe spectra of these blazars without such excess, additional absorption to the atomic neutral hydrogen from the Leiden Argentina Bonn Survey is needed.
keywords:
Radiation mechanisms: nonthermal Galaxies: active BL Lacertae objects: general Galaxies: jets1 Introduction
The class of blazars is characterized by a polarized and highly variable non-thermal continuum emission and composed of BL Lacertae (BL Lac) type sources and flat spectrum radio quasars (FSRQs). The distinction has historically been defined based on the equivalent width of the optical emission lines. According to the unified model (e.g. Urry & Padovani, 1995), blazars are observed at small angles of the observer’s line of sight to the relativistic jet axis (e.g. Begelman et al., 1984). The electromagnetic radiation that is emitted by blazars is observed in the full energy range, starting from radio frequencies up to very high energy rays (e.g. Wagner, 2009; H.E.S.S. Collaboration, 2014). Temporal variability, observed in all energy regimes on different time scales from minutes up to years is a characteristic feature of these sources (e.g. Aharonian et al., 2007; Wierzcholska, 2015; Liao & Bai, 2015; Wierzcholska & Siejkowski, 2016). Furthermore, temporal flux changes in blazars are often associated with spectral variability (e.g. Xue et al., 2006; Böttcher et al., 2010; Wierzcholska & Wagner, 2016; Siejkowski & Wierzcholska, 2017).
A typical spectral energy distribution (SED) of blazars is described by two broad emission components. The low-energy peak in the SED is usually explained by synchrotron radiation of relativistic electrons from the jet, while the high-energy component can be explained in leptonic or hadronic scenarios (see, e.g. Dermer et al., 1992; Sikora et al., 1994; Mücke et al., 2003; Böttcher et al., 2013). In the case of leptonic models, the high-energy peak can be either caused by inverse Compton scattering of relativistic electrons from the jet (synchrotron-self-Compton models, SSC) or by photon fields external to the jets (external Compton models, EC). The external field of photons can be caused by emission observed from a dusty torus or broad line region.
The position of two peaks allows us to distinguish three subgroups of BL Lac type blazars, namely: high-, intermediate- and low-energy peaked BL Lac objects: HBL, IBL, LBL, respectively (see, e.g. Padovani & Giommi, 1995; Fossati et al., 1998; Abdo et al., 2010). In the case of HBL type blazars the synchrotron peak is located in the X-ray domain ( Hz) (Abdo et al., 2010).
Two functions are commonly used to describe the synchrotron spectrum of blazars. These are a single power-law model and a curved power-law (also known as logparabola). The first one is characterized by a photon index , which is related to the index of input particles as (Rybicki & Lightman, 1979). Similarly, a curved spectrum can be produced by logparabolic particle distribution (Paggi et al., 2009) and is an indication for statistical acceleration process (e.g. Massaro et al., 2004, 2006, 2008; Tramacere et al., 2007).
The emission observed in the soft X-ray range is affected by absorption of the interstellar medium, along line of sight, in our Galaxy. The effect of the absorption extends up to about 10 keV with the most substantial influence up to 2 keV and it is calculated using a neutral hydrogen column density. The hydrogen column density observations have been reported in different surveys. The Leiden Argentine Bonn Survey (LAB, Kalberla et al., 2005) includes only NHI measure.
Willingale et al. (2013) have proposed a measure of NH,tot, which includes both the atomic gas column density NHI and molecular hydrogen column density N. The NHI value is taken from the LAB survey, while N is estimated based on maps of infrared dust emission and dust-gas ratio as provided by Schlegel et al. (1998) and Dame et al. (2001), respectively. As an alternative, spectra of blazars can be fitted with a free value of column density, which allows the derivation of the total X-ray absorption (e.g. Furniss et al., 2013; Wierzcholska & Wagner, 2016; Gaur et al., 2018).
The X-ray spectra alone cover too small range in energy to decompile the effect of absorption from the range of different effects that can cause spectral curvature. Thus a more in-depth look into multifrequency observations of a source is needed.
In this paper, we investigate X-ray observations of HBL type blazars together with multiwavelength data of synchrotron part of the spectrum and a host galaxy template to study properties of the X-ray spectra and host galaxy emission observed in blazars selected. The paper is organized as follows: Sect. 2 introduces the sample of targets studied, Sect. 3 presents detail on data presented in the paper and data analysis detail, Sect. 4 shows the results. The work is summarized in Sect. 5.
2 The sample
52 HBL type blazars have been detected in the TeV energy range (TeVCat111http://tevcat.uchicago.edu/). Most of them were observed with Swift/XRT with PC or WT mode of the instrument (see for detail Wierzcholska & Wagner, 2016). In this work, we aim to characterize emission observed from infrared to X-ray range for extreme HBL type blazars. We note here that extreme blazars are described by extremely energetic synchrotron emission, and the inverse Compton bump extends to the very high energy -ray regime. For such sources, the X-ray spectrum is located at energies below the peak of the low energy bump in SED. For further studies, we select sources, TeV -ray emitting blazars, which fulfil the following criteria:
-
•
the source belongs to HBL type blazars with the X-ray spectrum located at the growing part of the synchrotron bump in the SED,
-
•
multiwavelength data covering low energy bump in the SED are available;
-
•
archival observations of the global SED (e.g., taken from ASDC222http://www.asdc.asi.it/) revealed prominent emission visible in the infrared-to-ultraviolet range indicating that host galaxy emission is significantly stronger than emission originating from all other components.
As a result the selected sample consists of 5 sources: 1ES 0229+200, PKS 0548-322, RX J1136+6737, 1ES 1741+196, 1ES 2344+514 as targets for further studies.333We note here also that during the review process of the paper, the MAGIC Collaboration reported the discovery of a new sample of hard-TeV extreme blazars (MAGIC Collaboration et al., 2019). These AGNs are also possible targets: TXS 0210+515, RBS 0723, 1ES 1426+428, 1ES 2037+521, and RGB J2042+244, for similar studies as presented in the paper.
Two potential sources: Mrk 421, and Mrk 501 are not included in these studies due to significant X-ray variability seen in the X-ray observations and the fact that most Swift/XRT data taken for these blazars are in WT mode. We limit our analysis to PC mode data only since data taken in the WT mode are affected by charge redistribution problems inherently related to how the CCD of the instrument is read (also noted by, e.g. Massaro et al., 2008; Wierzcholska & Wagner, 2016). This causes that in the case of the longterm integrated X-ray spectra, wavy features can be present.
3 Data and analysis methods
In order to ensure good data coverage of the low energy bump in the SEDs of sources studied: 1ES 0229+200, PKS 0548-322, RX J1136+6737, 1ES 1741+196, 1ES 2344+514 multiwavelength data are used. In the case of all blazars, WISE, 2MASS, ATOM, Swift/UVOT, Swift/XRT data are used. In the case of 1ES 0229+200 also NuSTAR observations are studied.
3.1 Data analysis
NuSTAR data
The Nuclear Spectroscopic Telescope Array (NuSTAR) is a satellite instrument dedicated to observations in the hard X-ray regime of 3-79 keV (Harrison et al., 2013).
Out of the five targets selected for these studies, only 1ES 0229+200 was observed with NuSTAR. Details on three pointings performed are summarized in Table 4.
All observations were performed in the SCIENCE mode.
The raw data were processed with NuSTAR Data Analysis Software package
(NuSTARDAS,
released as part of
HEASOFT 6.25)
using standard
nupipeline
task.
Instrumental response matrices and effective area files were produced with
nuproducts
procedure.
The spectral analysis was performed for the channels corresponding to the energy band of 3-79 keV.
We mention here that NuSTAR observations of 1ES 0229+200 have been previously reported by Bhatta et al. (2018) and Pandey et al. (2017).
However, Bhatta et al. (2018) have discussed only one NuSTAR observation of 1ES 0229+200, while Pandey et al. (2017) focused on temporal variability.
Swift-XRT data
The X-ray data used in this work are the ones collected with Swift (Gehrels et al., 2004), which are exactly the same sets as studied by Wierzcholska & Wagner (2016), reanalyzed with a more recent version of the HEASoft software (6.25) with the recent CALDB. All events were cleaned and calibrated using xrtpipeline task, and the PC mode data in the energy range of 0.3-10 keV with grades 0-12 were analyzed.
The reanalyzed spectra are entirely consistent with the previous ones.
Swift-UVOT data
The UVOT instrument onboard Swift measures the ultraviolet and optical emission simultaneously with the X-ray telescope.
The observations are taken in the UV and optical bands with
the central wavelengths of UVW2 (188 nm), UVM2 (217 nm), UVW1 (251 nm), U (345 nm), B
(439 nm), and V (544 nm).
The instrumental magnitudes were calculated using uvotsource including all photons from a circular region with radius 5”.
The background was determined from a circular region with a radius of 10” near the source region, not contaminated with the signal from nearby sources.
The flux conversion factors as provided by Poole et al. (2008) were used.
All data were corrected for the dust absorption using the reddening as provided by Schlafly & Finkbeiner (2011) and summarized in Table 1.
The ratios of the extinction to reddening, , for each filter were provided by Giommi et al. (2006).
The reddening ) and atomic hydrogen column density (NH) are related with the following formula NH= 8.3 (Liszt, 2014).
ATOM data
ATOM (Automatic Telescope for Optical Monitoring) is a 75 cm optical telescope located in Namibia near the H.E.S.S. site (Hauser et al., 2004). The instrument measures optical magnitudes in four optical filters: B (440 nm), V (550 nm), R (640 nm), and I (790 nm).
For all sources, the data collected in the period starting from 2007 to 2015 have been analyzed using an aperture of 4” radius and differential photometry. The observations have been corrected for dust absorption.
ATOM observations are available for the following sources from the sample, namely: 1ES 0229+200, PKS 0548-322, and 1ES 1741+196. In the case of each of the sources, there is no significant variability detected in the ATOM bands.
2MASS data
The 2MASS data are taken from the 2MASS All-Sky Point Source Catalog (PSC) (Cutri et al., 2003). The data were corrected for the dust absorption using the same factors as for the optical data mentioned previously.
WISE data
Wide-field Infrared Survey Explorer (WISE) is a space telescope which performs observations in the infrared energy band at four wavelengths: 3.4 m (W1), 4.6 m (W2), 12 m (W3) and 22 m (W4). The spectral data were taken from the AllWISE Source Catalog and the light curve from the AllWISE Multiepoch Photometry Table444http://wise2.ipac.caltech.edu/docs/release/allwise/. The magnitudes were converted to flux by applying the standard procedure (Wright et al., 2010). For W1 and W2, we applied the colour correction of a power-law with index zero, as suggested for Galactic emission. Since W3 and W4 are widely dominated by the non-thermal radiation and show similar flux densities, we used the colour correction for a power-law of index -2. For none of the blazars studied, the infrared light curves does not show any variability within uncertainties of the measurements.
3.2 Simultaneity of the data
Blazars are known for their variability observed in all energy regimes. Thus, simultaneous multiwavelength observations are essential to study broadband emission observed from blazars. Unfortunately, single Swift/XRT observations usually do not allow to constrain spectral parameters with small uncertainties. In order to find a sustainable solution for this, here, we study integrated X-ray spectra of five blazars. However, only PC mode data is used, since high state observations are usually performed with the WT mode of Swift/XRT. In order to check if the effect of variability is significant, we quantified it by fitting a constant function to the light curve data points. For all cases, such a fit yields of 0.8-1.4, showing no indication for variability in the X-ray regime for any of the targets.
Furthermore, thanks to simultaneous observations with Swift/UVOT, optical, and ultraviolet data collected with this instrument are averaged over the same period as X-ray data. Optical observations collected with ATOM are averaged over a similar period as X-ray monitoring data. We note here, that in the case of X-ray spectra obtained with NuSTAR, exactly simultaneous Swift/XRT and Swift/UVOT data are used.
3.3 Spectral analysis and fitting procedure
In order to characterize X-ray spectra of five sources from the sample two different models, the absorbed power-law (wabs powerlaw in XSPEC) and absorbed logparabola (wabs logparabola in XSPEC) were tested.
A single power-law is defined as:
| (1) |
with the normalization , and the photon index ; while a logparabola model is defined as:
| (2) |
with the normalization , the spectral parameter and the curvature parameter . Galactic absorption is a function of exponent: , where N is the hydrogen column density value taken for a given survey, N is the additional, intrinsic column density and (E) is the non-Thomson energy dependent photoelectric cross section (Morrison & McCammon, 1983). For the case when there is an assumption of lack of an additional absorption, only N is taken into account, and N is fixed to zero.
We note here that except for absorbing model described with wabs, we also tested phabs and tbabs (Wilms et al., 2000). This resulted in similar spectral parameters, as presented in the paper and can be found in the online material to the paper.
3.4 Fitting of different energy bands
The fitting of the X-ray spectrum for Swift/XRT observations is performed in two different energy bands: 0.3-10 keV and 2.0-10 keV. The energy band of 0.3-10 keV includes complete spectral information from Swift/XRT observations. In this case, different corrections for the Galactic absorption are tested. The 2.0-10 keV band has limited coverage and is slightly less affected by absorption. This is simply because the Galactic absorption plays a substantial role from low energies up to about 2 keV (e.g. Campana et al., 2014) and thus by limiting the fitting range the influence of the Galactic absorption is marginal.
3.5 Fitting of host galaxy
The fitting procedure of a host galaxy profile to the observational data is the following:
-
1.
The preferred X-ray spectral model, according to X-ray data analysis as presented by Wierzcholska & Wagner (2016), is chosen for a given object, as a starting point.
-
2.
The X-ray spectrum is then extrapolated to the lower energies, up to the IR regime, and added to the synthetic host galaxy profile.
-
3.
The total profile is then fitted to the observational data points.
The synthetic host galaxy profiles are generated with GRASIL (for more details see Silva et al., 1998; Silva, 1999; Silva & Granato, 2012), a code to compute spectral evolution of stellar systems. For this work, the simulations of the standard model of an elliptical galaxy based on the model described in the manual pages555http://adlibitum.oats.inaf.it/silva/grasil/modelling/modlib.html is used. We generated synthetic spectra for a set of 11 different infall masses, : , , … , , and 26 different galaxy ages, : , , …, Gyr.
The fitting method is as follows:
-
1.
The age of the galaxy is set to a given value.
-
2.
The scipy.interpolate.interp2d function (Jones et al., 2001) is used to interpolate generated spectra (points) in two dimensions of infall mass and frequency in order to have a well-covered grid. This returns a function which computes the spectral points for a given frequency and infall mass.
-
3.
the (with added extrapolated X-ray spectrum) is fitted to the observational data using scipy.optimize.curve_fit function.
-
4.
The procedure is repeated for each galaxy age.
-
5.
The best fit is selected according to the value.
| Source | Swift obsIDs | |
|---|---|---|
| (1) | (2) | (3) |
| 1ES 0229+200 | 00031249001-00031249050 | 0.1172 |
| PKS 0548-322 | 00044002001-00044002065 | 0.0304 |
| RXJ 1136+6737 | 00037135001-00040562010 | 0.0074 |
| 1ES 1741+196 | 00030950001-00040639018 | 0.0759 |
| 1ES 2344+514 | 00035031001-00035031121 | 0.1819 |
4 Results
1ES 0229+200
The studies of 1ES 0229+200 performed by Kaufmann et al. (2011) revealed unusual spectral characteristics of the X-ray emission detected up to about 100 keV without any significant cut-off in the energy range studied. The model preferred by the authors has been a single power-law, however, with an indication of excess absorption above the Galactic value. Kaufmann et al. (2011) has also shown that a cut-off characterizes the SED of 1ES 0229+200 in the low energy part of the synchrotron emission, located in the UV regime. In more recent studies, Wierzcholska & Wagner (2016) have demonstrated that the longterm integrated X-ray spectrum in the energy range of 0.3-10 keV of 1ES 0229+200 could be described both with a single power-law or a log-parabola model. The authors have also shown that according to values of the fits, the preferred NH amount is the one from the LAB survey. Within the uncertainties, this result is consistent with the work by Kaufmann et al. (2011).
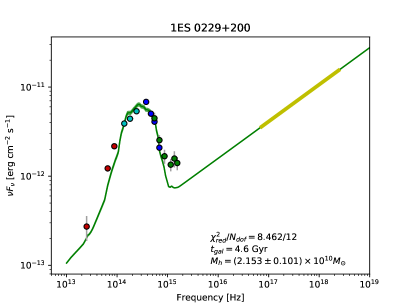
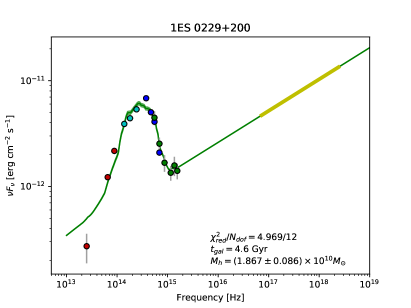
In the first step, all X-ray observations (as analysed by Wierzcholska & Wagner (2016)) collected with Swift/XRT during the period of monitoring in the energy range of 0.3-10k̇eV were fitted with a single power-law and a log-parabola model, in both cases with the Galactic absorption (NH 1020cm-2, Kalberla et al. 2005). Fits parameters of both models are given in Table 2. The figures illustrating fits with the data points are included in the online material. Both spectra are then used together with the host galaxy templates, as described in Sect. 3.3, to fit infrared-to-ultraviolet observations of 1ES 0229+200. The results of the fits are presented in Fig. 2. In the case of the power-law spectral model used, a fit to infrared-to-ultraviolet data is characterized with a significant excess observed in the UV regime. We note here, that, the UV excess is defined as a difference between model and fluxes observed in the UV range.
In order to check how the excess observed depends on the Galactic absorption, the longterm integrated X-ray spectrum has been fitted again with the power-law model in two different ways.
-
•
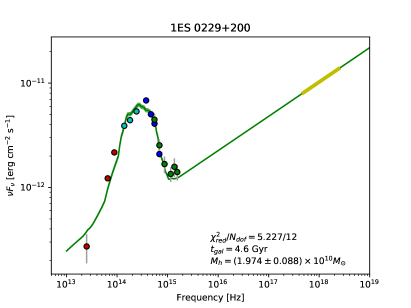
In the first approach, the NH value by Kalberla et al. (2005) is used, but the energy range is limited to 2.0-10 keV. The fitting procedure used in this case is the same as described before, and the same multiwavelength data set is used. The resulting fit parameters are collected in the Table 2, and the plot is presented in Fig. 3.
-
•
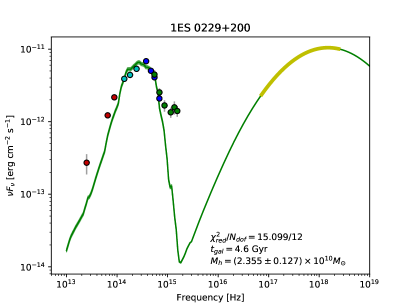
In the second approach, the X-ray energy range used for the fitting is the entire Swift/XRT energy range, but the fixed NH value is higher than the one mentioned above. Willingale et al. (2013) have suggested that in order to determine appropriately the influence of the Galactic absorption NH,tot value, which is a sum of the atomic gas column density NHI and the molecular hydrogen column density N should be used. Here, NHI is taken form the LAB survey (Kalberla et al., 2005), while N is estimated using maps of dust infrared emission by Schlegel et al. (1998) and the dust-gas ratio by Dame et al. (2001). For the case of 1ES 0229+200, NH,tot is equal to 11.80 1020 cm-2. The fit to the data with the power-law model plus the Galactic hydrogen absorption as provided by Willingale et al. (2013) is presented in Fig. 3 and fit parameters are collected in Table 2.
In the case of the spectrum fitted to the limited energy range, the host galaxy is well described, and a UV excess is not required. The fit with the Galactic column density value as provided by Willingale et al. (2013) also does not require a UV excess and more significant discrepancy in the observed and modelled infrared emission in the low energy part of the WISE range.
Previous works dedicated to X-ray studies of 1ES 0229+200 also revealed additional absorption observed in the case of 1ES 0229+200. Kaufmann et al. (2011) have found that X-ray spectra of 1ES 0229+200 are well described with a single power-law model with the additional absorption that can be either intrinsic to the blazar or in the line of sight to the observer or in the Milky Way.
We note here also, that the evidence for UV excess in the X-ray spectrum of 1ES 0229+200 has been reported by Costamante et al. (2018). The authors suggested that it can be either due to an additional emitting component or could be explained by thermal emission from the AGN. While no explanation could be identified, the shape of the X-ray spectrum required an excess emission in the UV range or excess absorption.
NuSTAR observations of 1ES 0229+200
In the case of one target from the sample, 1ES 0229+200, hard X-ray data collected with NuSTAR are available. This allows testing stability of the results obtained with Swift/XRT, and check if additional X-ray observations ranging to 79 keV improve the fit.
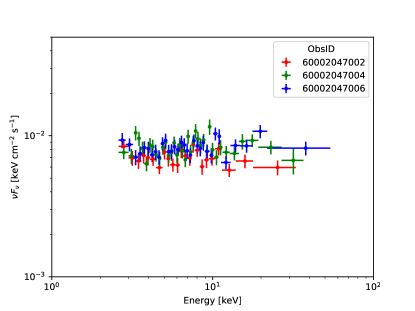
In total, three NuSTAR observations of 1ES 0229+200 were performed, all in October 2013. During the NuSTAR campaign, the source was also observed with Swift/XRT and Swift/UVOT, providing almost a strictly simultaneous overlap of the broadband spectral energy distribution. Table 4 presents details on data that have been gathered with NuSTAR and Swift/XRT during NuSTAR observation period.
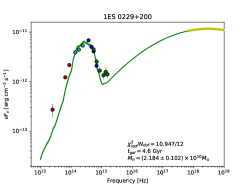
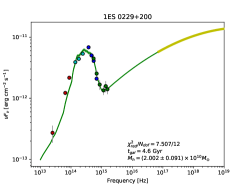
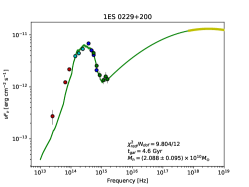
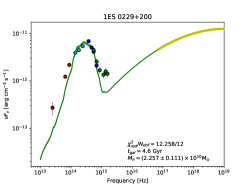
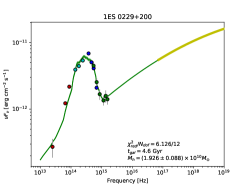
In order to test whether the NuSTAR X-ray spectra of 1ES 0229+200 are better constrained with a single power-law model or a log-parabola, all three NuSTAR observations were fitted with both models. Table 5 summarizes parametres of spectral fits and Figure 1 shows three NuSTAR spectra. We note here that in the case of the NuSTAR observations of 1ES 0229+200 X-ray spectrum is here constrained in the energy range of 3-50 keV. Similar values for both power-law and log-parabola fits indicate that the hard X-ray spectrum suggests that the spectra can be described with the same precision while using one of these models. However, using spectral parameters for the power-law model of the NuSTAR spectra, together with the host galaxy template, we are not able to reproduce the infrared-to-ultraviolet SED of 1ES 0229+200. The extrapolated fit was above the datapoints. Thus, we conclude that the proper description of the X-ray spectrum of 1ES 0229+200 in the energy range above 3 keV can be done only with a curved model. As the power-law model was ruled out, we used the logparbolic description of the X-ray spectra together with the host galaxy templates. The resulting SEDs are presented in the first column in Figure 5. For all ObsID, none of the marginal UV excesses is visible.
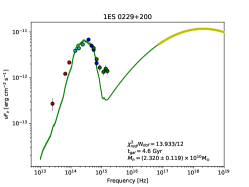
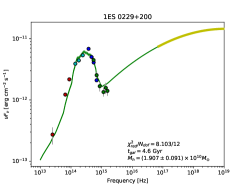
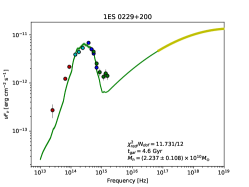
Simultaneous Swift/XRT-NuSTAR observations of 1ES 0229+200 allow for joint spectral fitting in the energy range of 0.3-50 keV. Figure 5 (the second and third column) presents broadband SEDs of 1ES 0229+200 being the result of log-parabola spectral model extrapolated together with the host galaxy template. Two different values of NH are tested: the one provided by Kalberla et al. (2005) and by Willingale et al. (2013). The UV excess is present in the SEDs obtained while using NH by Kalberla et al. (2005), and it is now visible in the case of SEDs obtained with NH by e.g. Willingale et al. (2013).
The analysis of NuSTAR and Swift/XRT-NuSTAR data allows us concluding that while using X-ray data above 10 keV, we received as good information about synchrotron emission of 1ES 0229+200 as in the case of Swift/XRT data only.
PKS 0548-322
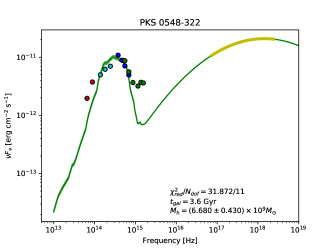
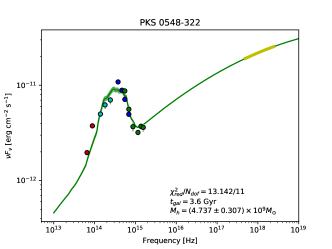
Wierzcholska & Wagner (2016) have shown that the longterm integrated X-ray spectrum of PKS 0548-322 in the energy range of 0.3-10 keV has been well described with logparabola model with Galactic column density value found by Kalberla et al. (2005). The X-ray spectrum fit parameters provided by Wierzcholska & Wagner (2016) together with the galaxy template reproduce the optical and IR observations well, but significant excess in the UV band is observed. In order to check the influence of the Galactic absorption on X-ray spectral parameters, the X-ray spectrum has been again fitted in the energy range of 2.0-10 keV. The spectrum has been extrapolated together with the template of the host galaxy up to the infrared-to-ultraviolet range. The resulting fit parameters are only slightly different from the 0.3-10 keV fit, but they allow to reproduce broadband emission of PKS 0548-322 without significant UV excess visible. From this fit, the host galaxy of the blazar is described with a mass of . Fit parameters of the X-ray spectrum for both cases are collected in Table 2 and plots are demonstrated in Figure 4. The studies performed have shown that additional absorption is needed to reproduce the SED of the blazar without significant UV excess.
PKS 0548-322 was a frequent target of X-ray observations. The analysis reported by Costamante et al. (2001) indicates the evidence of the intrinsic curvature of the X-ray spectrum of the blazar, even in the presence of an additional absorption. Perri et al. (2007) also have reported a logparabola as a preferred model describing the X-ray spectrum of the blazar as seen with Swift/XRT and Beppo-SAX. Aharonian et al. (2010) have described the X-ray spectrum of PKS 0548-322 in the energy range using a single power-law and broken power-law model without significant improvement while using the later model. However, the authors have mentioned a possible presence of an absorption feature near 0.7 keV.
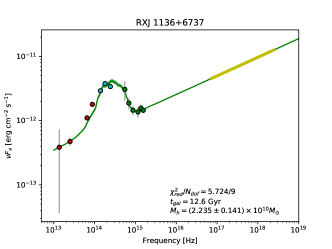
RX J1136+6737
Wierzcholska & Wagner (2016) have found the power-law model as a good description of the X-ray spectrum in the energy range of 0.3-10 keV. The authors have not found any need for an additional absorption component in the spectral description. The preferred value of the Galactic column density has been the one provided by Willingale et al. (2013). Using extrapolated power-law fit together with a template of the host galaxy fits well the multiwavelength data without any excess in the UV range. A mass of host galaxy is estimated to have . Fit parameters of the X-ray spectrum is presented in Table 2 and SED is shown in Figure 4.
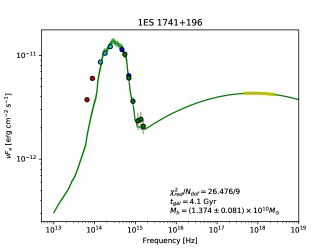
1ES 1741+196
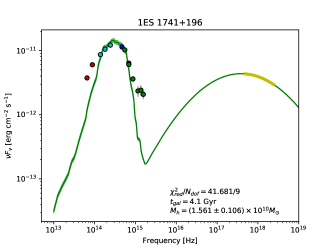
Wierzcholska & Wagner (2016) have shown that the X-ray spectrum of 1ES 1741+196 is well described using a logparabola model with Galactic column density value provided by Willingale et al. (2013). These spectral parameters together with the host galaxy template were used and fitted to multiwavelength data collected for 1ES 1741+196 to reproduce the low energy bump of the SED since significant UV excess is evident. The second fit to the data using the X-ray spectrum in the energy of 2.0-10 keV reproduced data well without any excess visible in the UV range. According to this fit, the estimated value of the host galaxy mass is . The fit parameters of the X-ray spectrum is presented in Table 2 and SED is shown in Figure 4. The studies performed have shown that additional absorption is needed to reproduce the SED of the blazar without significant UV excess.
Ahnen et al. (2017) have found that the X-ray spectrum of 1ES 1741+196 is well described with a single power-law without any indication of absorption excess. Contrary to these studies, Abeysekara et al. (2016) have concluded analysis of Swift/XRT spectra of 1ES 1741+196 that curvature in the spectrum is needed in order to explain the spectral shape in this range.
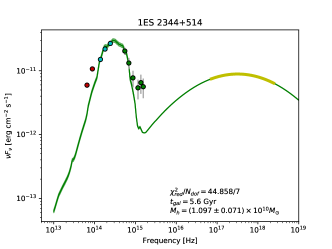
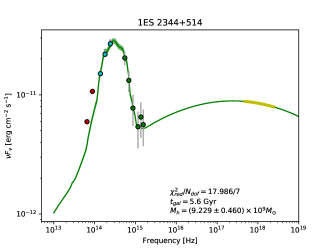
1ES 2344+514
In the studies of longterm X-ray spectra of blazars Wierzcholska & Wagner (2016) have shown that the spectrum of 1ES 2344+514 is well described with the logparabola model with Galactic column density taken from the survey by Kalberla et al. (2005). This X-ray spectral fit extrapolated to the infrared-to-ultraviolet range, together with a host galaxy template, results in large UV excess. Fit to the same X-ray data, but in the energy range of 2.0-10 keV, together with the host galaxy, gives appropriate fit without UV excess. For the second fit estimated value of host galaxy mass is . Results of fits for both cases can be found in Fig. 4, and parameters of all fits are presented in Table 2. The studies performed have shown that additional absorption is needed to reproduce the SED of the blazar without significant UV excess.
No need for a curved model describing spectrum or additional absorbing component has been reported by Aleksić et al. (2013). Kapanadze et al. (2017) also have prefered power-law model to describe the X-ray spectra of this blazar.
We note here also, that for the case of 1ES 2344+514 due to the low Galactic latitude of the blazar the NH values taken from different catalogues are affected by large uncertainties.
4.1 NH calculation
The spectral parameters of the fit in the energy range of 2-10 keV were used as frozen for the fit to data in the energy range of 0.3-10 keV. The only free fit parameter here was NH, and thus, we were able to calculate NH values for all targets studied.
-
•
For 1ES 0229+200 the calculated value of N is (13.000.37)1020cm-2. This value is larger than the one from the LAB survey (8.061020cm-2) and consistent with the one provided by Willingale et al. (2013) (10.801020cm-2). The value is also higher than free NH= (10.6-10.8)1020cm-2 calculeted by Kaufmann et al. (2011).
-
•
For PKS 0548-322 the calculated value of N is (3.100.10)1020cm-2. This value is larger than the one from the LAB survey (2.581020cm-2) and consistent with the one provided by Willingale et al. (2013) (2.871020cm-2). However, Sambruna & Mushotzky (1998) have found significatly higher value of NH of 1.031021cm-2 that is needed to explain X-ray properties of PKS 0548-322.
-
•
For 1ES 1741+196 the calculated value of N is (10.470.41)1020cm-2. This value is larger than the one from the LAB survey (7.321020cm-2) and consistent with the one provided by Willingale et al. (2013) (9.581020cm-2).
-
•
For 1ES 2344+514 calculated value of N is (17.340.15)1020cm-2. This value is larger than the one from the LAB survey (15.101020cm-2), however it is smaller than the one provided by Willingale et al. (2013) (24.601020cm-2).
We note here that the reddening and the atomic hydrogen column density (NH) are related. According to recent work, Liszt (2014) has described this dependence by the following formula NH= 10. The formula gives NH values of 9.7 1020, 2.5 1020, 0.6 1020, 6.3 1020, and 15 1020 for 1ES 0229+200, PKS 0548-322, RX J1136+6737, 1ES 1741+196, 1ES 2344+514, respectively. The quoted values are consistent with the ones from the LAB survey and do not indicate a need for an additional absorption. All values of NH values, including the catalogue ones, are collected in Table 3.
| Source | Model | Energy range | N | or | NH | (nd.o.f) | M | ID | |
| (1) | (2) | (3) | (4) | (5) | (6) | (7) | (8) | (9) | (10) |
| 1ES 0229+200 | power-law | 0.3-10 | 3.700.05 | 1.590.02 | - | 8.06 | 1.38(266) | 2.150.10 | A |
| 1ES 0229+200 | logparabola | 0.3-10 | 3.810.06 | 1.410.03 | 0.370.05 | 8.06 | 1.16(265) | 2.360.13 | B |
| 1ES 0229+200 | power-law | 2.0-10 | 4.010.06 | 1.670.02 | - | 8.06 | 0.98(114) | 1.970.09 | C |
| 1ES 0229+200 | power-law | 0.3-10 | 4.210.06 | 1.700.02 | - | 11.8 | 1.20(266) | 1.870.09 | D |
| PKS 0548-322 | logparabola | 0.3-10 | 10.280.06 | 1.730.01 | 0.170.02 | 2.58 | 1.09(750) | 0.670.04 | E |
| PKS 0548-322 | logparabola | 2.0-10 | 10.290.06 | 1.780.01 | 0.040.01 | 2.58 | 1.10(584) | 0.470.03 | F |
| RXJ 1136+6737 | power-law | 0.3-10 | 4.020.04 | 1.730.01 | - | 1.06 | 1.11(468) | 2.080.13 | G |
| 1ES 1741+196 | logparabola | 0.3-10 | 2.550.05 | 1.890.03 | 0.260.01 | 9.58 | 1.05(350) | 1.560.10 | H |
| 1ES 1741+196 | logparabola | 2.0-10 | 2.620.05 | 1.950.02 | 0.050.03 | 9.58 | 0.98(186) | 1.390.08 | I |
| 1ES 2344+514 | logparabola | 0.3-10 | 5.510.03 | 1.960.01 | 0.180.02 | 15.1 | 1.03(707) | 1.100.07 | J |
| 1ES 2344+514 | logparabola | 2.0-10 | 5.550.04 | 2.000.01 | 0.050.03 | 15.1 | 1.00(539) | 0.920.05 | K |
| Source | LAB | DL | Will | NE(B-V) | this work |
| (1) | (2) | (3) | (4) | (5) | (6) |
| 1ES 0229+200 | 8.06 | 9.20 | 11.80 | 9.7 | 13.000.37 |
| PKS 0548-322 | 2.58 | 2.18 | 2.87 | 2.5 | 3.010.10 |
| RXJ 1136+6737 | 1.03 | 1.33 | 1.06 | 0.6 | – |
| 1ES 1741+196 | 7.32 | 6.82 | 9.58 | 6.3 | 10.470.41 |
| 1ES 2344+514 | 15.10 | 16.80 | 24.60 | 15 | 17.340.15 |

| NuSTAR obsId | Time | NuSTAR exposure [s] | Swift/XRT obsIds | Time | Exposure [s] |
|---|---|---|---|---|---|
| 60002047002 | 2013-10-02 00:06:07 | 16258 | 00080245001 | 2013-10-01 23:36:59 | 612 |
| 00080245003 | 2013-10-02 00:45:59 | 3209 | |||
| 60002047004 | 2013-10-05 23:31:07 | 20291 | 00080245004 | 2013-10-06 00:51:59 | 5277 |
| 60002047006 | 2013-10-10 23:11:07 | 18023 | 00080245005 | 2013-10-10 23:47:58 | 581 |
| 00080245006 | 2013-10-11 01:29:59 | 5417 |
| Model | Energy range | N | or | NH | (nd.o.f) | NuSTAR obsId | |
| (1) | (2) | (3) | (4) | (5) | (6) | (7) | (8) |
| power-law | 3-79 | 6.670.20 | 1.960.04 | - | 8.06 | 1.019(86) | nu60002047002 |
| power-law | 3-79 | 7.460.50 | 1.970.04 | - | 8.06 | 1.269(77) | nu60002047004 |
| power-law | 3-79 | 7.600.50 | 1.970.04 | - | 8.06 | 1.040(72) | nu60002047006 |
| logparabola | 3-79 | 5.530.13 | 1.780.07 | 0.100.02 | 8.06 | 1.012(85) | nu60002047002 |
| logparabola | 3-79 | 6.350.15 | 1.800.20 | 0.100.03 | 8.06 | 1.280(76) | nu60002047004 |
| logparabola | 3-79 | 6.350.20 | 1.800.15 | 0.100.02 | 8.06 | 1.058(71) | nu60002047006 |
| logparabola | 0.3-79 | 5.300.10 | 1.700.10 | 0.160.02 | 8.06 | 1.015(130) | nu60002047002 |
| logparabola | 0.3-79 | 4.410.09 | 1.700.11 | 0.090.03 | 8.06 | 1.224(154) | nu60002047004 |
| logparabola | 0.3-79 | 4.360.08 | 1.700.11 | 0.080.01 | 8.06 | 1.331(175) | nu60002047006 |
| logparabola | 0.3-79 | 6.150.03 | 1.800.07 | 0.100.01 | 11.8 | 1.028(130) | nu60002047002 |
| logparabola | 0.3-79 | 4.880.10 | 1.770.11 | 0.060.01 | 11.8 | 1.260(154) | nu60002047004 |
| logparabola | 0.3-79 | 4.700.09 | 1.750.11 | 0.040.01 | 11.8 | 1.044(175) | nu60002047006 |
4.2 Constrains on the model parameters
The model used to describe the infrared to X-ray emission of the blazars is characterized by: host galaxy, curvature seen in the X-ray spectrum, total absorption (which includes both Galactic component and possibly additional ones), and ultraviolet excess. The host galaxy, understood as the entire component described with the template by Silva (1999), is well constrained with the model used. Still, the remaining three parameters cannot be disentangled using only information from the X-ray spectral fitting. The limitations on three entangled parameters are the following:
-
•
: For all of the blazars studied, the convex curvature of the X-ray spectrum is assumed. This implies that negative values of are not accepted. Furthermore, Wierzcholska & Wagner (2016) have demonstrated that in the case of a fixed value of absorption (e.g., from the LAB survey), X-ray spectra can be characterized with from 0.1 up to 0.9. Albeit, in the case of the free value of NH, the value of ranges from 0.04 up to 0.4. In our studies, spectral curvatures of extreme HBL blazars range between 0.05 and 0.37, which is consistent with the work by Wierzcholska & Wagner (2016) and also with other studies focusing on spectral curvatures seen in the X-ray range (Massaro et al., 2004; Tramacere et al., 2007).
-
•
NH: According to the LAB survey, values of the Galactic absorption range between 1020-1022. For the blazars in the sample, NH values do not exceed 1021, and additional value required to explain UV excess is of about 60 higher than the survey ones, which is still in the range of reasonable value.
-
•
UV excess: The value of UV excess cannot be negative.
To check the impact of a UV excess on other parameters, for each source, we performed a study on parameters variability in the following steps:
-
•
Range of possible NH values is selected. The starting value is the lowest one from the surveys.
-
•
Spectral fitting of the X-ray spectrum in the energy range of 0.3-10 keV with the frozen value of NH is performed.
-
•
Fitting to the host galaxy template as described in 3.3.
-
•
Calculation of the UV excess as a distance of the model to UVW2 datapoint.
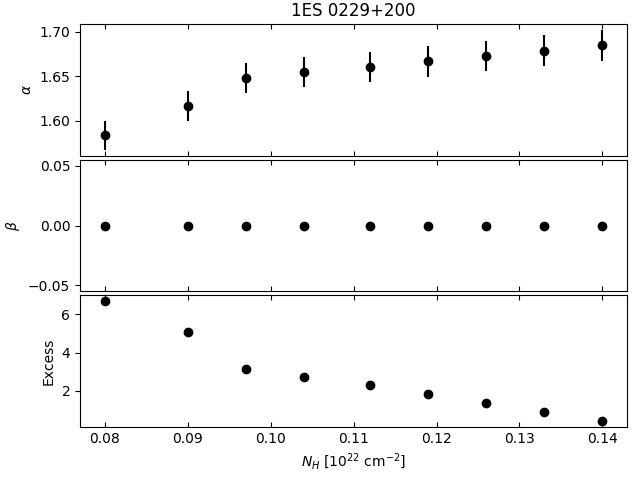
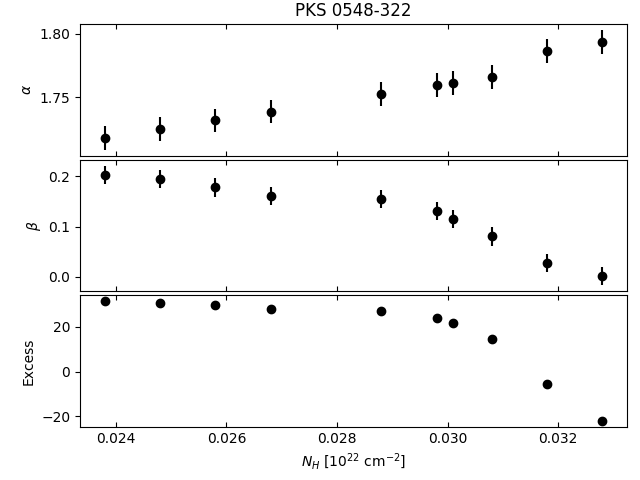
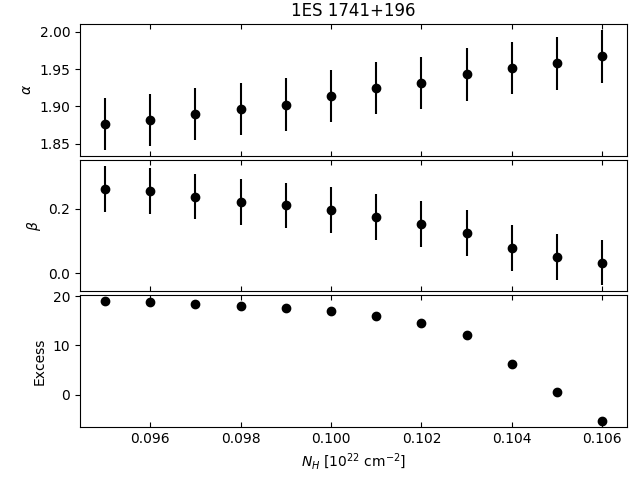
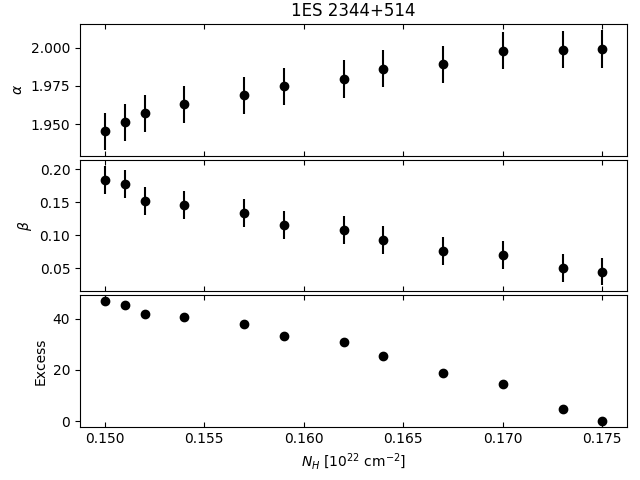
Figure 6 presents comparison of , , and UV excess as a function of NH for 1ES 0229+200, PKS 0548-322, 1ES 1741+196, and 1ES 2344+514. The figures illustrate the strong dependence of , , and UV excess parameters for all blazars. The and parameters of the model change significantly within changes of the NH value, and this also generates different UV excesses.
Accoring to the limitations of the values of and UV excess, we can conclude that the values of NH must be limited to: 13.31020 cm-2, 3.11020 cm-2, 10.51020 cm-2, and 17.41020 cm-2 for 1ES 0229+200, PKS 0548-322, 1ES 1741+196, and 1ES 2344+514, respectively.
5 Summary
The X-ray spectra of blazars in the energy range of 0.3-10 keV are commonly well explained using a power-law or curved power-law model. Both these forms can well describe the particle distribution responsible for the emission observed in a given energy range (e.g. Tramacere et al., 2007; Massaro et al., 2008). The curvature parameter reported for X-ray spectra of blazar, ranging between 0.1-0.9, illustrates a variety of spectral properties of blazars’ X-ray spectra (see, e.g. Massaro et al., 2004; Tramacere et al., 2007; Wierzcholska & Wagner, 2016). The curved power-law model is successfully used for all subclasses of blazars, including FSRQs, LBLs, IBLs, and HBLs (e.g., Wierzcholska & Wagner, 2016).
However, a concave curvature seen in the soft X-ray range can be either an intrinsic feature of the blazar or can be caused by the absorption that is not included in the spectral model. Usually, using only X-ray observations of the blazars, it is not possible to judge either intrinsic curvature or a need for an additional absorbing component is a more plausible scenario that can explain the spectral shape. One way to verify the origin of spectral curvature is dedicated observations that confirm the existence of gas that could be intrinsic to the blazar or located somewhere between the source and an observer. Absorption features in the X-ray regime, around 0.5-0.6keV have been detected in the case of few blazars including: PKS 2155-304 (Canizares & Kruper, 1984; Madejski et al., 1991), H 1426-428 (Sambruna et al., 1997), 3C 273 (Grandi et al., 1997), PKS 1034-293 (Sambruna, 1997), PKS 0548-322 Sambruna & Mushotzky (1998). Also, absorption features have been reported in regime of 0.15-0.20 keV for PKS 2155-304 (Koenigl et al., 1995) and Mrk 421Kartje et al. (1997).
Alternatively, simultaneous multiwavelength data covering a significant part of the broadband spectral energy distribution can be used to get more constraints on the X-ray spectrum and absorption in the soft X-ray range.
We use the models characterized with host galaxy, curvature of the X-ray spectrum, absorption and UV excess in order to describe broadband emission observed from infrared frequencies up to the X-ray band of five extreme HBLs: 1ES 0229+200, PKS 0548-322, RX J1136+6737, 1ES 1741+196, 1ES 2344+514.
We investigate whether curvature that is seen in the X-ray spectra in the energy range of 0.3-10 keV is an intrinsic feature or caused by the absorption.
Our findings are summarized as follows:
-
•
In the case of four blazars: 1ES 0229+200, PKS 0548-322, 1ES 1741+196, 1ES 2344+514 prefered spectral characteristic in the X-ray range is a log-parabola model, while for RX J1136+6737 a power-law model is favourable. For all four blazars described with a log-parabola model, spectral fits with the LAB NH value are characterized with a UV excess. If such excess is a real feature of the broadband spectral energy distribution, it can be interpreted either as an additional component such as a blue bump or by unaccounted thermal emission from the AGN. The latter case, however, seen to be less plausible since it then should be at the order of one or even two magnitudes above the host galaxy template.
-
•
In several works focusing on X-ray spectra authors have discussed also problem of proper NH correction (e.g. Acciari et al., 2009; Wierzcholska & Wagner, 2016). By using multiwavelength data, we could constrain the X-ray spectrum with all its aspects, including proper correction for hydrogen column absorption. We then conclude that in the case of four sources mentioned, additional absorption, than the values quoted in by Kalberla et al. (2005), is needed to explain the spectral properties of these targets in the energy range of 0.3-10 keV. In the case of 1ES 0229+200, PKS 0548-322, 1ES 1741+196 NH values proposed in this work are higher than previously reported. This column density absorption can be either intrinsic to the source or caused by Galactic absorption in addition to the atomic neutral hydrogen from Kalberla et al. (2005). In the case of PKS 0548-322, Sambruna & Mushotzky (1998) have reported the possibility of a presence of circumnuclear ionized gas that could explain the need for an additional absorption. The upper limit of the intergalactic gas luminosity is about 15 of the BL Lac luminosity.
-
•
The log-parabola model is commonly used to describe the X-ray spectra of blazars in the energy regime of 0.3-10 keV. By using extrapolated X-ray data together with host galaxy template and multiwavelength observations of blazars, these preferred spectral shapes were confirmed. Albeit, curvature seen in the spectra of 1ES 1741+196, 1ES 2344+514 is negligible within the uncertainties. We then conclude that only in the case of the blazar PKS 0548-322 the intrinsic spectral curvature is confirmed. This suggests that for PKS 0548-322 particle population responsible for the synchrotron emission observed should be assumed to be curved as well.
-
•
For four blazars with the UV excess in the broadband SED while using the LAB value of NH. The excess is no longer present in the spectrum, in the case when a higher amount of the absorption is used.
-
•
In the case of 1ES 0229+200 existence of the cut-off in the UV regime is not confirmed. Such a feature has been previously reported by Kaufmann et al. (2011). However, the authors constrained the synchrotron peak in the SED of 1ES 0229+200 with poorer multiwavelength coverage, as presented in this work.
Acknowledgements
A.W. is supported by Polish National Agency for Academic Exchange (NAWA). The plots presented in this paper are rendered using Matplotlib (Hunter, 2007). This research has been supported by BMBF through Verbundforschung Astroteilchenphysik, grant number 05A17VH5.
References
- Abdo et al. (2010) Abdo A. A. et al., 2010, ApJ, 716, 30
- Abeysekara et al. (2016) Abeysekara A. U. et al., 2016, MNRAS, 459, 2550
- Acciari et al. (2009) Acciari V. A. et al., 2009, ApJ, 707, 612
- Aharonian et al. (2010) Aharonian F. et al., 2010, A&A, 521, A69
- Aharonian et al. (2007) Aharonian F. et al., 2007, ApJ, 664, L71
- Ahnen et al. (2017) Ahnen M. L. et al., 2017, MNRAS, 468, 1534
- Aleksić et al. (2013) Aleksić J. et al., 2013, A&A, 556, A67
- Begelman et al. (1984) Begelman M. C., Blandford R. D., Rees M. J., 1984, Reviews of Modern Physics, 56, 255
- Bhatta et al. (2018) Bhatta G., Mohorian M., Bilinsky I., 2018, A&A, 619, A93
- Böttcher et al. (2010) Böttcher M. et al., 2010, ApJ, 725, 2344
- Böttcher et al. (2013) Böttcher M., Reimer A., Sweeney K., Prakash A., 2013, ApJ, 768, 54
- Campana et al. (2014) Campana S. et al., 2014, MNRAS, 441, 3634
- Canizares & Kruper (1984) Canizares C. R., Kruper J., 1984, ApJ, 278, L99
- Costamante et al. (2018) Costamante L., Bonnoli G., Tavecchio F., Ghisellini G., Tagliaferri G., Khangulyan D., 2018, MNRAS, 477, 4257
- Costamante et al. (2001) Costamante L. et al., 2001, A&A, 371, 512
- Cutri et al. (2003) Cutri R. M. et al., 2003, VizieR Online Data Catalog, 2246
- Dame et al. (2001) Dame T. M., Hartmann D., Thaddeus P., 2001, ApJ, 547, 792
- Dermer et al. (1992) Dermer C. D., Schlickeiser R., Mastichiadis A., 1992, A&A, 256, L27
- Dickey & Lockman (1990) Dickey J. M., Lockman F. J., 1990, ARA&A, 28, 215
- Fossati et al. (1998) Fossati G., Maraschi L., Celotti A., Comastri A., Ghisellini G., 1998, MNRAS, 299, 433
- Furniss et al. (2013) Furniss A., Fumagalli M., Falcone A., Williams D. A., 2013, ApJ, 770, 109
- Gaur et al. (2018) Gaur H., Mohan P., Wierzcholska A., Gu M., 2018, MNRAS, 473, 3638
- Gehrels et al. (2004) Gehrels N. et al., 2004, ApJ, 611, 1005
- Giommi et al. (2006) Giommi P. et al., 2006, A&A, 456, 911
- Grandi et al. (1997) Grandi P. et al., 1997, A&A, 325, L17
- Harrison et al. (2013) Harrison F. A. et al., 2013, ApJ, 770, 103
- Hauser et al. (2004) Hauser M., Möllenhoff C., Pühlhofer G., Wagner S. J., Hagen H.-J., Knoll M., 2004, Astronomische Nachrichten, 325, 659
- H.E.S.S. Collaboration (2014) H.E.S.S. Collaboration, 2014, A&A, 571, A39
- Hunter (2007) Hunter J. D., 2007, Computing In Science & Engineering, 9, 90
- Jones et al. (2001) Jones E., Oliphant T., Peterson P., et al., 2001, SciPy: Open source scientific tools for Python
- Kalberla et al. (2005) Kalberla P. M. W., Burton W. B., Hartmann D., Arnal E. M., Bajaja E., Morras R., Pöppel W. G. L., 2005, A&A, 440, 775
- Kapanadze et al. (2017) Kapanadze S., Kapanadze B., Romano P., Vercellone S., Tabagari L., 2017, Ap&SS, 362, 196
- Kartje et al. (1997) Kartje J. F., Königl A., Hwang C.-Y., Bowyer S., 1997, ApJ, 474, 630
- Kaufmann et al. (2011) Kaufmann S., Wagner S. J., Tibolla O., Hauser M., 2011, A&A, 534, A130
- Koenigl et al. (1995) Koenigl A., Kartje J. F., Bowyer S., Kahn S. M., Hwang C.-Y., 1995, ApJ, 446, 598
- Liao & Bai (2015) Liao N. H., Bai J. M., 2015, New A, 34, 134
- Liszt (2014) Liszt H., 2014, ApJ, 780, 10
- Madejski et al. (1991) Madejski G. M., Mushotzky R. F., Weaver K. A., Arnaud K. A., Urry C. M., 1991, ApJ, 370, 198
- MAGIC Collaboration et al. (2019) MAGIC Collaboration et al., 2019, arXiv e-prints, arXiv:1911.06680
- Massaro et al. (2004) Massaro E., Perri M., Giommi P., Nesci R., 2004, A&A, 413, 489
- Massaro et al. (2006) Massaro E., Tramacere A., Perri M., Giommi P., Tosti G., 2006, A&A, 448, 861
- Massaro et al. (2008) Massaro F., Tramacere A., Cavaliere A., Perri M., Giommi P., 2008, A&A, 478, 395
- Morrison & McCammon (1983) Morrison R., McCammon D., 1983, ApJ, 270, 119
- Mücke et al. (2003) Mücke A., Protheroe R. J., Engel R., Rachen J. P., Stanev T., 2003, Astroparticle Physics, 18, 593
- Padovani & Giommi (1995) Padovani P., Giommi P., 1995, ApJ, 444, 567
- Paggi et al. (2009) Paggi A., Massaro F., Vittorini V., Cavaliere A., D’Ammando F., Vagnetti F., Tavani M., 2009, A&A, 504, 821
- Pandey et al. (2017) Pandey A., Gupta A. C., Wiita P. J., 2017, ApJ, 841, 123
- Perri et al. (2007) Perri M. et al., 2007, A&A, 462, 889
- Poole et al. (2008) Poole T. S. et al., 2008, MNRAS, 383, 627
- Rybicki & Lightman (1979) Rybicki G. B., Lightman A. P., 1979, Radiative processes in astrophysics
- Sambruna (1997) Sambruna R. M., 1997, ApJ, 487, 536
- Sambruna et al. (1997) Sambruna R. M., George I. M., Madejski G., Urry C. M., Turner T. J., Weaver K. A., Maraschi L., Treves A., 1997, ApJ, 483, 774
- Sambruna & Mushotzky (1998) Sambruna R. M., Mushotzky R. F., 1998, ApJ, 502, 630
- Schlafly & Finkbeiner (2011) Schlafly E. F., Finkbeiner D. P., 2011, ApJ, 737, 103
- Schlegel et al. (1998) Schlegel D. J., Finkbeiner D. P., Davis M., 1998, ApJ, 500, 525
- Siejkowski & Wierzcholska (2017) Siejkowski H., Wierzcholska A., 2017, MNRAS, 468, 426
- Sikora et al. (1994) Sikora M., Begelman M. C., Rees M. J., 1994, ApJ, 421, 153
- Silva (1999) Silva L., 1999, PhD thesis, SISSA - Trieste, Italy
- Silva & Granato (2012) Silva L., Granato G. L., 2012, GRASIL: Spectral evolution of stellar systems with dust. Astrophysics Source Code Library
- Silva et al. (1998) Silva L., Granato G. L., Bressan A., Danese L., 1998, ApJ, 509, 103
- Tramacere et al. (2007) Tramacere A. et al., 2007, A&A, 467, 501
- Urry & Padovani (1995) Urry C. M., Padovani P., 1995, PASP, 107, 803
- Wagner (2009) Wagner S., 2009, in Astrophysics with All-Sky X-Ray Observations, Kawai N., Mihara T., Kohama M., Suzuki M., eds., p. 186
- Wierzcholska (2015) Wierzcholska A., 2015, A&A, 580, A104
- Wierzcholska & Siejkowski (2016) Wierzcholska A., Siejkowski H., 2016, MNRAS, 458, 2350
- Wierzcholska & Wagner (2016) Wierzcholska A., Wagner S. J., 2016, MNRAS, 458, 56
- Willingale et al. (2013) Willingale R., Starling R. L. C., Beardmore A. P., Tanvir N. R., O’Brien P. T., 2013, MNRAS, 431, 394
- Wilms et al. (2000) Wilms J., Allen A., McCray R., 2000, ApJ, 542, 914
- Wright et al. (2010) Wright E. L. et al., 2010, AJ, 140, 1868
- Xue et al. (2006) Xue Y., Yuan F., Cui W., 2006, ApJ, 647, 194