Grain-Resolved Temperature-Dependent Anisotropy in Hexagonal Ti-7Al Revealed by Synchrotron X-Ray Diffraction
Abstract
Hexagonal metals have anisotropic coefficients of thermal expansion causing grain-level internal stresses during heating. High energy x-ray diffraction microscopy, a non-destructive, in situ, micromechanical and microstructural characterization technique, has been used to determine the anisotropic coefficients of thermal expansion (CTEs) for Ti-7Al. Two samples of polycrystalline -phase Ti-7Al were continuously heated from room temperature to 850 C while far-field HEDM scans were collected. The results showed a change in the ratio of the CTEs in the ‘a’ and ‘c’ directions which explains discrepancies found in the literature. The CTE additionally appears to be affected by the dissolution of precipitates. Analysis of the grain-resolved micromechanical data also shows reconfiguration of the grain scale stresses likely due to anisotropic expansion driving crystallographic slip.
keywords:
X-ray diffraction, titanium alloys , thermal expansion , HEDM1 Introduction
The effects of thermal anisotropy were noted in 1944 by Boas and Honeycombe [1] who stated that “It appears, therefore, that metals which possess a high degree of anisotropy of thermal expansion cannot be obtained in a stress-free condition at room temperature by casting or annealing.” Thus, in hexagonal metals, anisotropic coefficients of thermal expansion (CTEs) are believed to generate the majority of type II residual stresses, i.e., microscale stresses which remain even after the removal of all external loads [2], during cooling from high-temperature processing conditions [3, 4]. These type II residual stresses affect the local variations in stress, and therefore can play a critical role in either accelerating or suppressing the development of damage that leads to premature failure. Thus, the prediction of failure initiation hinges on residual stress instantiation that in turn relies on accurate CTE values (and their ratios). However, there is little agreement in the literature on the CTEs for these metals [5], and notably the reported CTEs for titanium (Table 1) vary from 9.26 10-6/C to 13.17 10-6/C, lacking agreement even on the ratio between the CTEs in the ‘a’ and ‘c’ directions ( and ), all of which motivated a more detailed examination of this phenomenon.
| Year | Paper | Temp. Range (C) | |||
|---|---|---|---|---|---|
| 1942 | Erfling [6] | 8.24 | 20-40 | ||
| 1949 | Greiner & Ellis [7] | 9 | 30-200 | ||
| 1953 | McHargue & Hammond [8] | 11 | 8.8 | 10.3 | 25-225 |
| 1953 | Berry & Raynor [9] | 11.03 | 13.37 | 11.81 | r.t.-700 |
| 1959 | Spreadborough & Christian [10] | 9.55 | 10.65 | 9.92 | 0-600 |
| 1962 | Roberts [11] | 10 | 9.95 | ||
| 1962 | Willens [12] | 9.41 | 11.18 | 0-400 | |
| 1968 | Pawar & Deshpande [5] | 9.5 | 5.6 | 8.2 | 28-155 |
| 1975 | Touloukian [13] | 9.23 | 9.57 | ||
| 2019 | Zheng et al.* [4] | ** | *** | r.t.-850 |
* Extracted from a simulation
**
***
Historically, thermal expansion of polycrystals has been studied using dilatometry [11, 14] where a rod-shaped specimen is placed in a furnace, and the change in length is measured as a function of temperature. However, this technique is not capable of probing the expansion along specific crystal directions, and only the effective macroscale thermal properties of the aggregate can be extracted. In order to study the anisotropic linear thermal expansion of a material, the characterization technique used must be capable of measuring expansion along different crystallographic directions. Powder diffraction [10, 5] is commonly employed to obtain the variation in lattice parameter(s), which is then used to calculate the CTEs. The diffraction measurements provide information on lattice plane spacings, from which lattice strains, due to both thermal and mechanical strains, can be calculated.
Anisotropic lattice expansion at the microscale becomes coupled to mechanical response as the material attempts to maintain local compatibility and stress equilibrium. Thermal expansion is equivalent to eigenstrain, i.e., stress-free strain, and for titanium and other hexagonal metals, the difference between the a-axis and c-axis expansion coupled with the variations in local crystallographic orientation results in the generation of elastic strains (and stresses) [15]. These mechanical strains are particularly difficult to decouple from thermal strains using powder diffraction methods. Thus, we use far-field high energy x-ray diffraction microscopy (ff-HEDM) measurements with in situ heating to extract the strain tensor for individual crystals within a polycrystalline aggregate as a function of temperature.
The ff-HEDM technique measures total lattice strain and cannot distinguish between the thermal and mechanical contributions, although the ability to measure full lattice strain tensors allows some decoupling of thermal and mechanical strains to be performed. We assume that non-zero shear strains and dispersion observed in normal strain components between grains is most directly the result of the development of mechanical strains, while the average strain across the ensemble of grains is the thermal strain. It should be noted that these variations in strains between individual grains due to neighborhood constraints cannot be isolated with powder diffraction but is a direct result from ff-HEDM. This in turn allows for better understanding of the micromechanical interactions and subsequent interpretation of CTE measurements in a polycrystal.
The Ti-7Al studied in this work is a hexagonal close packed -Ti alloy, and is similar to the -phase in Ti-6Al-4V, which is a commonly used alloy in the aerospace and biomedical industries. Ti-7Al is thermally anisotropic, making it interesting for thermal expansion and residual stress studies [10, 5, 16], and a significant amount of previous work has been done on characterizing the deformation of Ti-7Al using HEDM [17, 18, 19, 20, 21, 22, 23, 24]. Plastic deformation in -Ti mainly occurs through the slip on the basal systems a, 110{0001}, and on the prismatic systems a, 110{100}. Additionally, slip can also be observed on the pyramidal a, 110{101} slip systems but with lower frequency [25, 17, 21, 26, 27]. These families of slip systems have been shown to vary significantly in strength [25, 21]. Lastly, slip on the pyramidal c+a system occurs through the glide of dislocations on the {101} and {112} plane families [28]. Although these systems are higher strength, pyramidal c+a slip will occur in some grains as it is a necessary deformation mode to close the yield surface. As plastic deformation occurs, dislocation interactions cause hardening on these planes [21]. As a consequence of the competing hardening and softening behaviors, Ti-7Al exhibits little to no hardening on a macroscopic level [21].
In addition, much of the strength of Ti-7Al can be attributed to aging of the material which leads to short-range ordering (SRO) and the subsequent development of coherent 2 Ti3Al nanoprecipitates, which affects the mechanical behavior of titanium alloys with greater than 5% aluminum [29, 30, 31]. The 2 precipitates suppress twinning and increase slip on the basal planes [32, 33] and strengthen the material until the precipitates are sheared through dislocation slip [21].
In this work, far-field high energy x-ray diffraction microscopy (ff-HEDM) measurements is employed with in situ heating to track the evolution of the micromechanical state of individual crystals within a polycrystalline aggregate as a function of temperature in order to study the the effects of anisotropy in the thermal expansion of Ti-7Al.
2 Methods
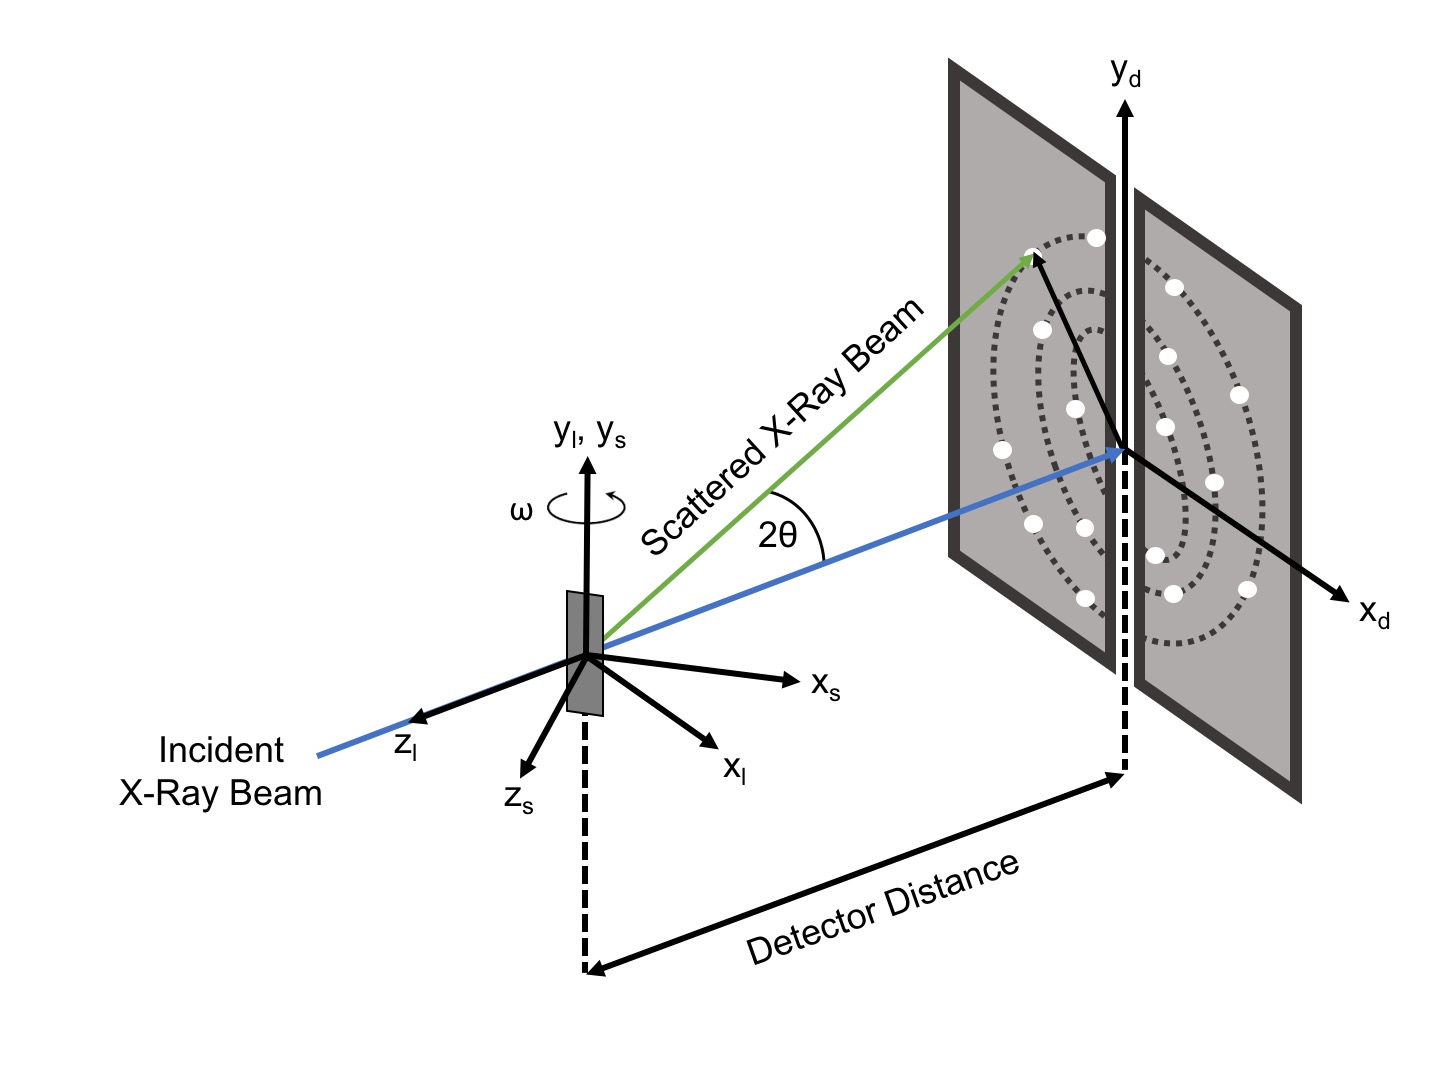
Far-field high energy x-ray diffraction microscopy is a non-destructive, in situ, materials characterization technique, which can be used to track three-dimensional micromechanical evolution as a response to external stimuli. During the use of this technique, a sample is rotated about a single axis by an angle as the volume of interest is illuminated by the x-ray beam. When a family of planes {hkl} in a grain satisfies the diffraction condition, it will diffract, producing a peak in intensity on the detector. Diffractograms are acquired at regular intervals integrated over no greater than . Data collection over a full 360 rotation range allows for observation of 50 to 100 diffraction peaks for each grain. In ff-HEDM measurements, the detector is placed 1 m away from the sample. In this setup, the diffraction peaks line up along Debye-Scherrer rings, with the small deviations of peak locations from idealized positions enabling ff-HEDM to determine the grain-averaged orientation, center of mass (COM), and lattice strain tensor of the grains in the illuminated region of the sample [34, 35, 36].
In addition to the anisotropy of the CTEs for titanium, it has been shown that there is a possible temperature dependence [13, 16, 4], and this dependence of lattice parameter on temperature can be represented by . For a material, the CTE, , for a given lattice parameter can be defined as
| (1) |
thus, the temperature dependent CTE is
| (2) |
In order to study the micromechanical evolution of the sample and the effects of thermal expansion, the total lattice strain measured by ff-HEDM must be decomposed into its elastic and thermal contributions.
| (3) |
where is the total lattice strain, is the thermal strain and is the elastic strain. Since ff-HEDM measures strain in the sample frame, it must first be transformed into the crystal reference frame using
| (4) |
where g is defined as the coordinate transformation which takes a vector from the crystal frame to the sample frame, is the total lattice strain in the crystal frame, and is the total lattice strain in the sample frame. The thermal strain can be assumed to be the average of the total lattice strains in the crystal frame
| (5) |
By combining equations 3 and 5, we get that
| (6) |
Then, we transform the elastic strain back into the sample frame with
| (7) |
3 Experiment
3.1 Material
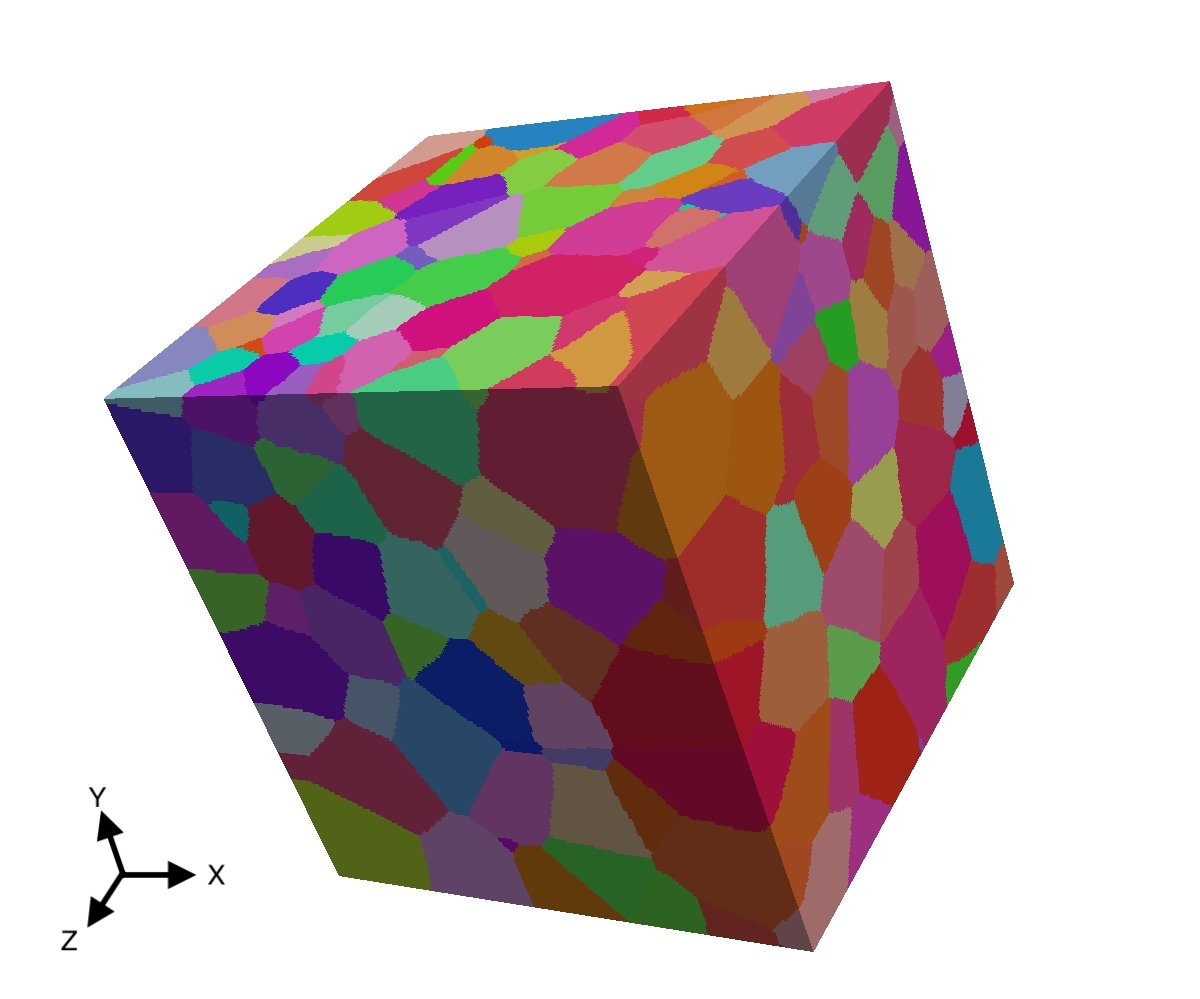
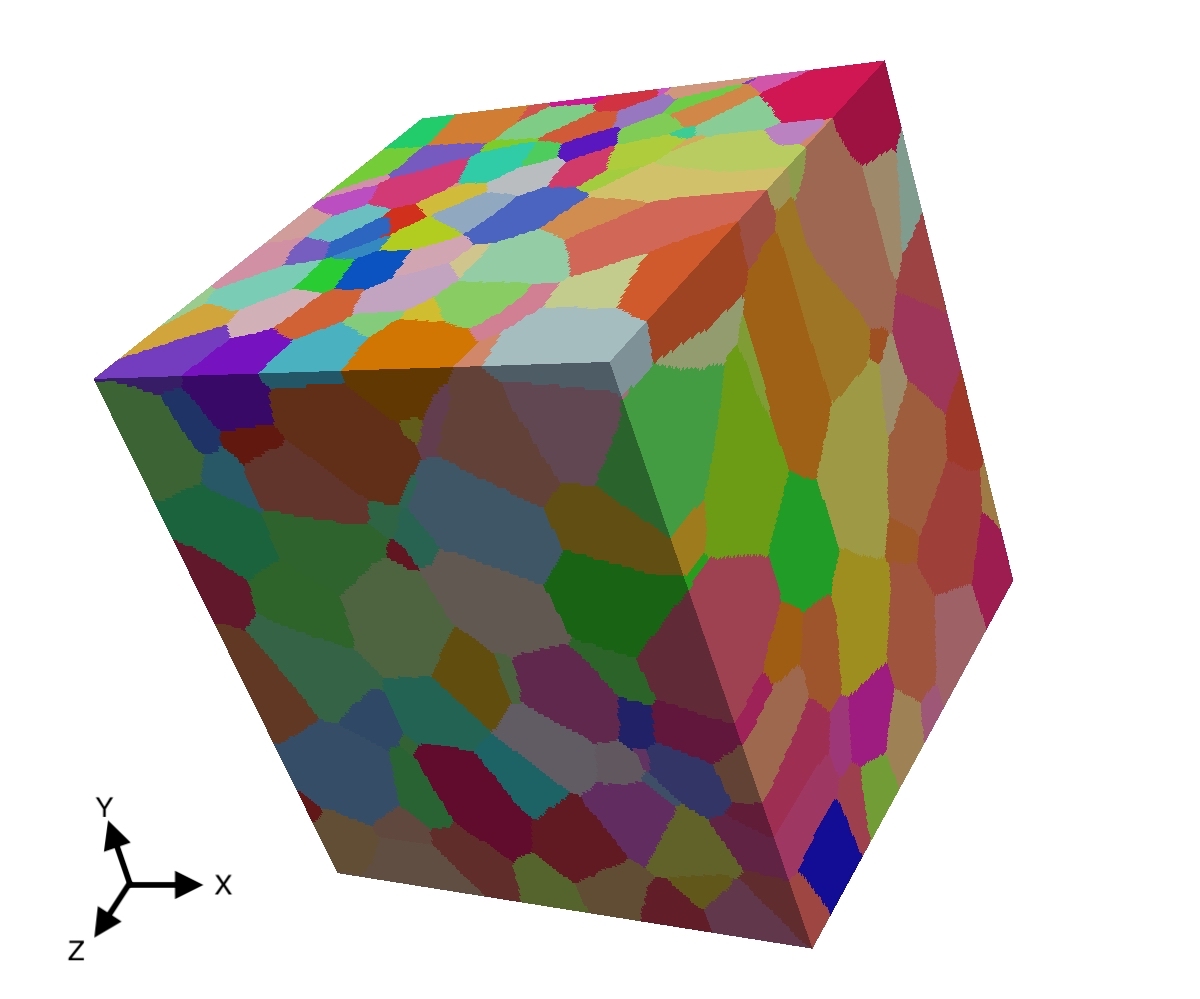
The Ti-7Al material (nominal composition Ti-7.02Al-0.11O-0.015Fe wt.%) used for this work was cast as an ingot and hot isostatic pressed (HIP) to reduce porosity. It was extruded and then annealed at 962 C for 24 hours before air cooling [37]. The samples were cut using electrical discharge machining to minimize the introduction of additional residual stresses. Figures 1a and 1b show microstructural representations of the measured volumes from the two samples based on a Voronoi tessellation from the grain centers (as given by the ff-HEDM). The microstructures are equiaxed and have an approximate grain size of 50-100 m where the textures of the samples were similar but not exactly the same.
3.2 Experiment description
Two thermal expansion experiments were performed on samples of Ti-7Al using the RAMS2 load frame [38] at the F2 beamline at the Cornell High Energy Synchrotron Source (CHESS). Fig. 2 shows a schematic of the experimental geometry. Each sample had a gauge length of 8 mm and a 1 mm x 1 mm cross-sectional area. The sample was heated to 850 C at a rate of 8.5 C/min using an x-ray transparent halogen bulb furnace with an elliptical mirror to focus the light onto the sample. The furnace was mounted onto the RAMS2 load frame as shown in Fig. 1 of Pagan et al. [22]. Far-field HEDM scans were acquired at regular intervals during heating, each with a full rotation of 360 and an interval of 0.25, using a 61.3 keV x-ray beam. A 1.1 mm tall volume (with 50 m on the top and bottom to allow for slit scattering) of ff-HEDM data was collected using two Dexela 2923 detectors (3888 x 3072 pixels, 74.8 m pixel size) mounted side-by-side (Fig. 2).
3.3 Data processing
The diffraction data was reduced using the HEXRD software package (https://github.com/joelvbernier/hexrd) [34]. The initial detector parameters were calibrated using powder patterns from a CeO2 sample, and the grains in the Ti-7Al sample were indexed and fit using lattice parameters of Å and Å. Then, the detector calibration was refined using a high completeness grain close to the vertical center of the scanned volume. The reduced grain data was filtered (completeness 90% and normalized sum of square residuals [39]) so that only high fidelity grains remained.
4 Results
4.1 Ti-7Al coefficients of thermal expansion
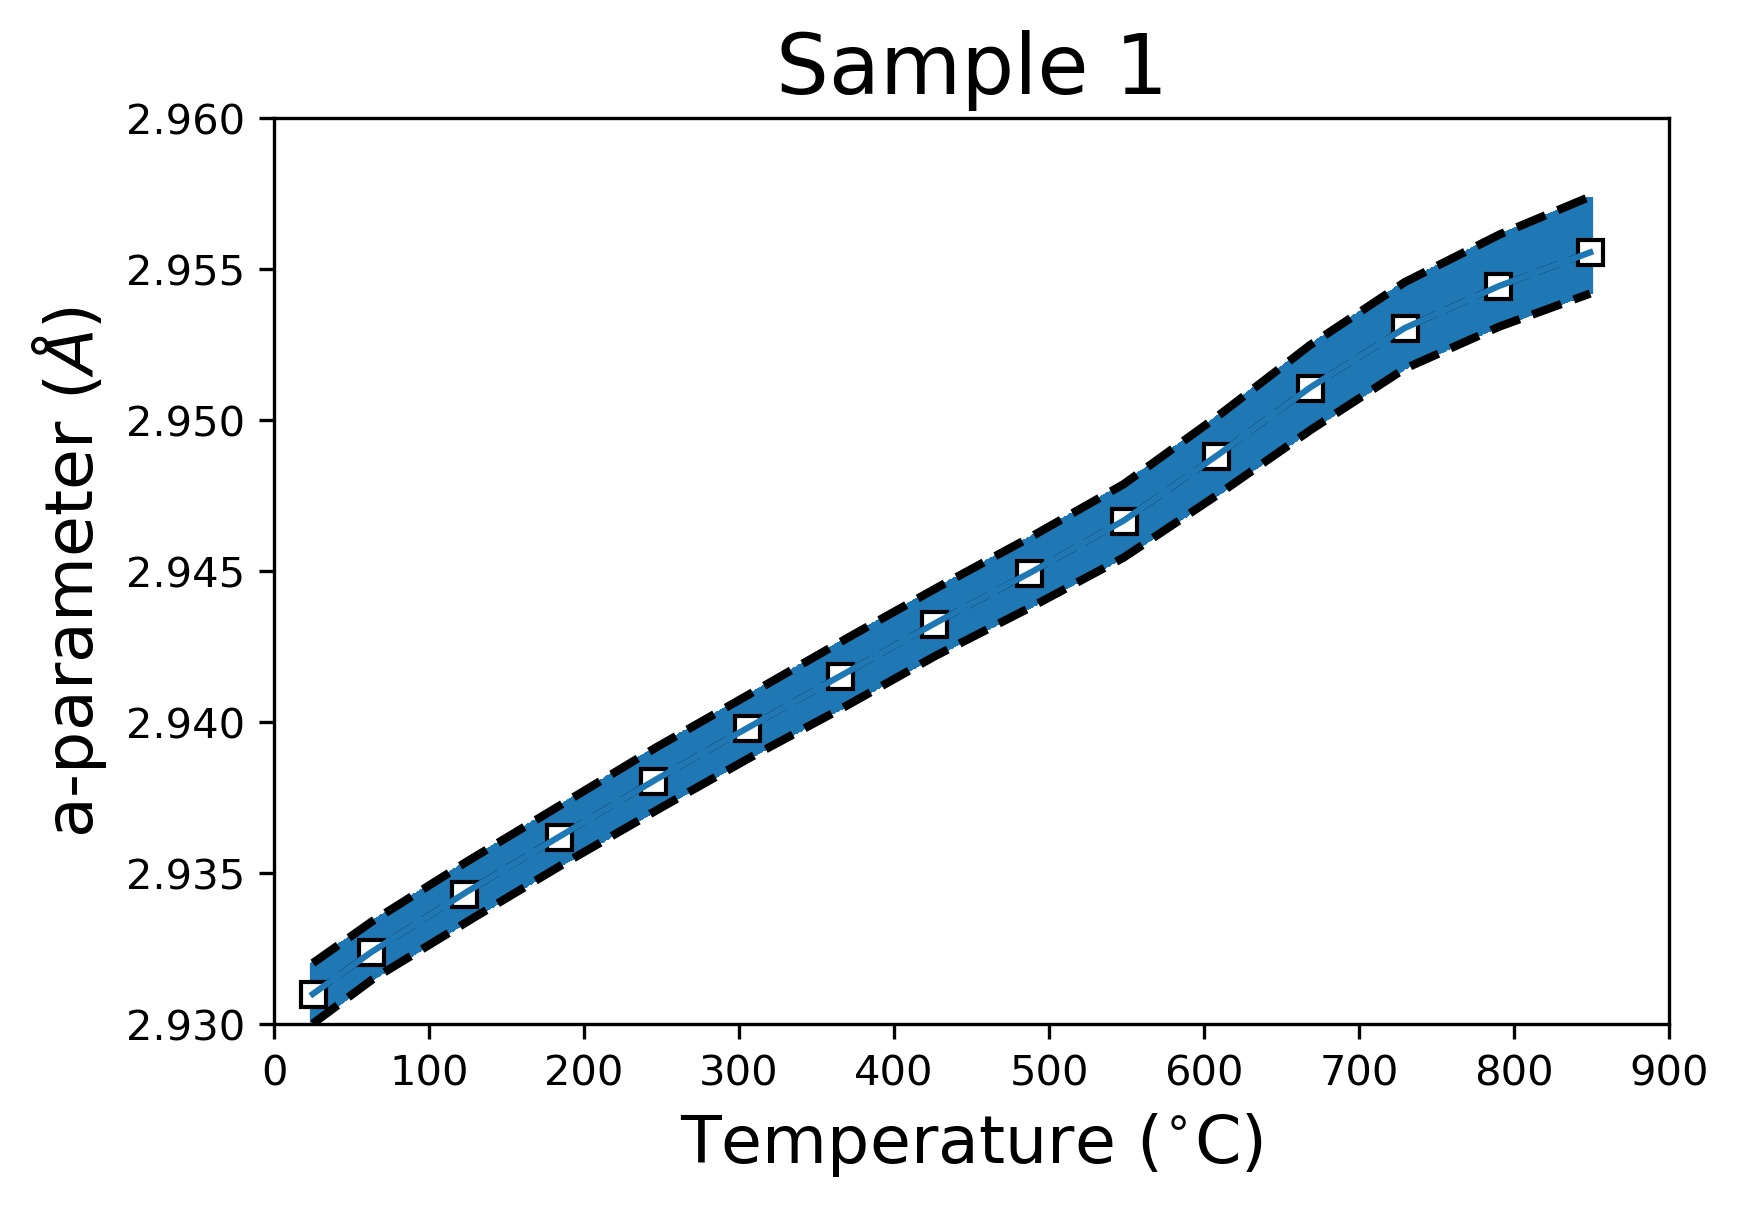
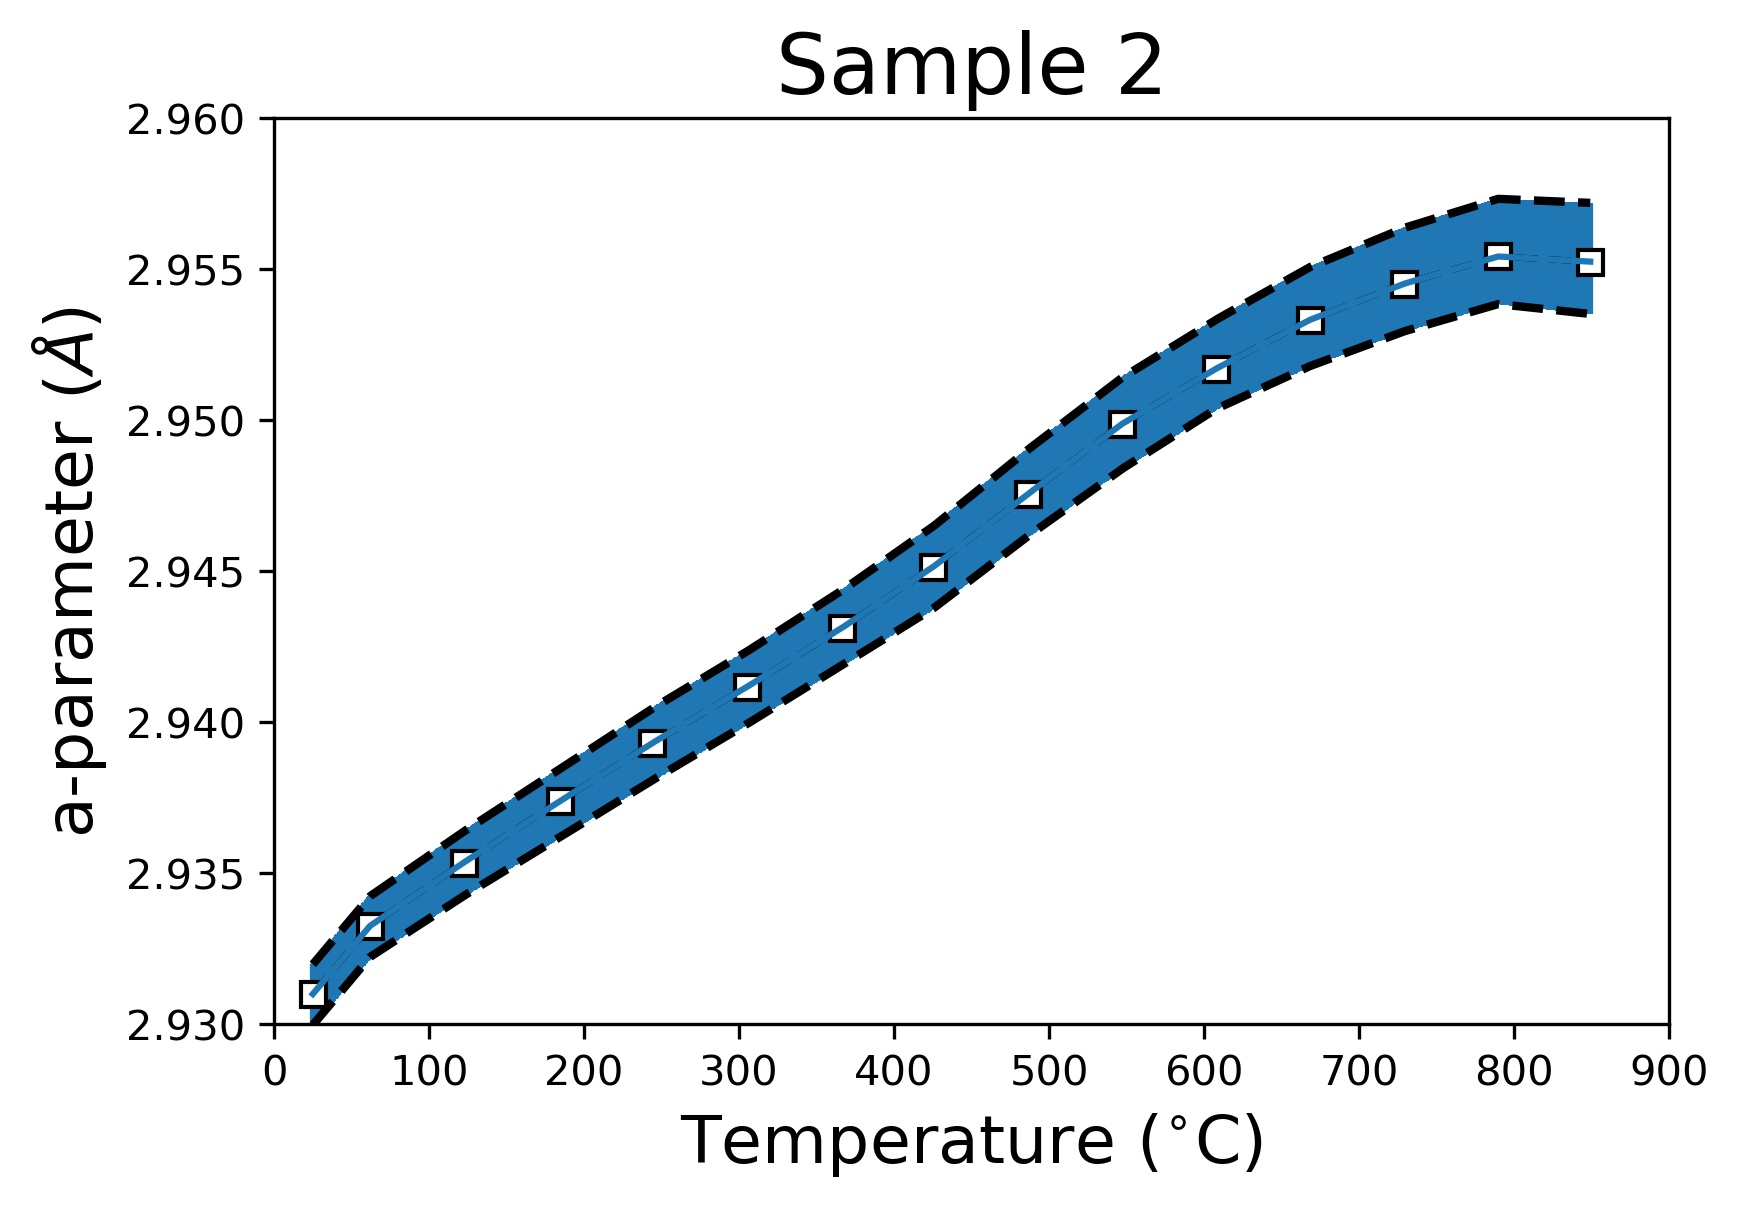
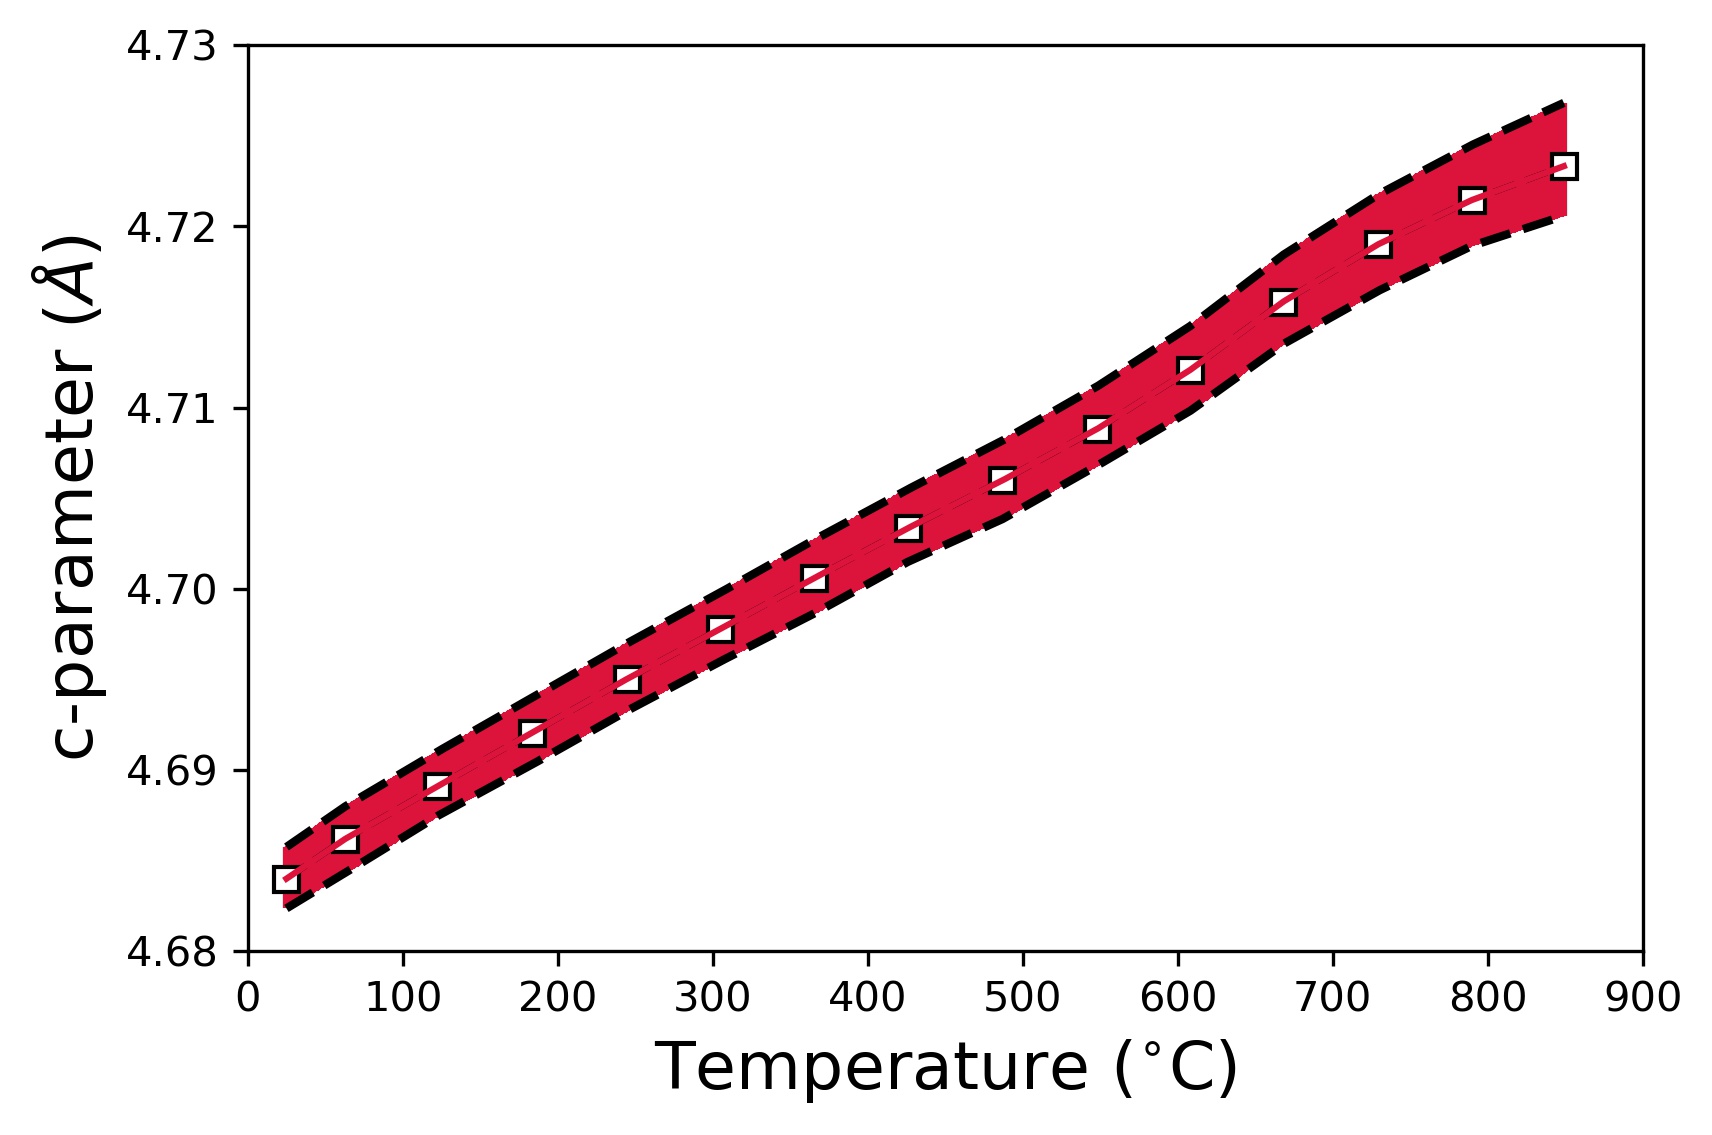
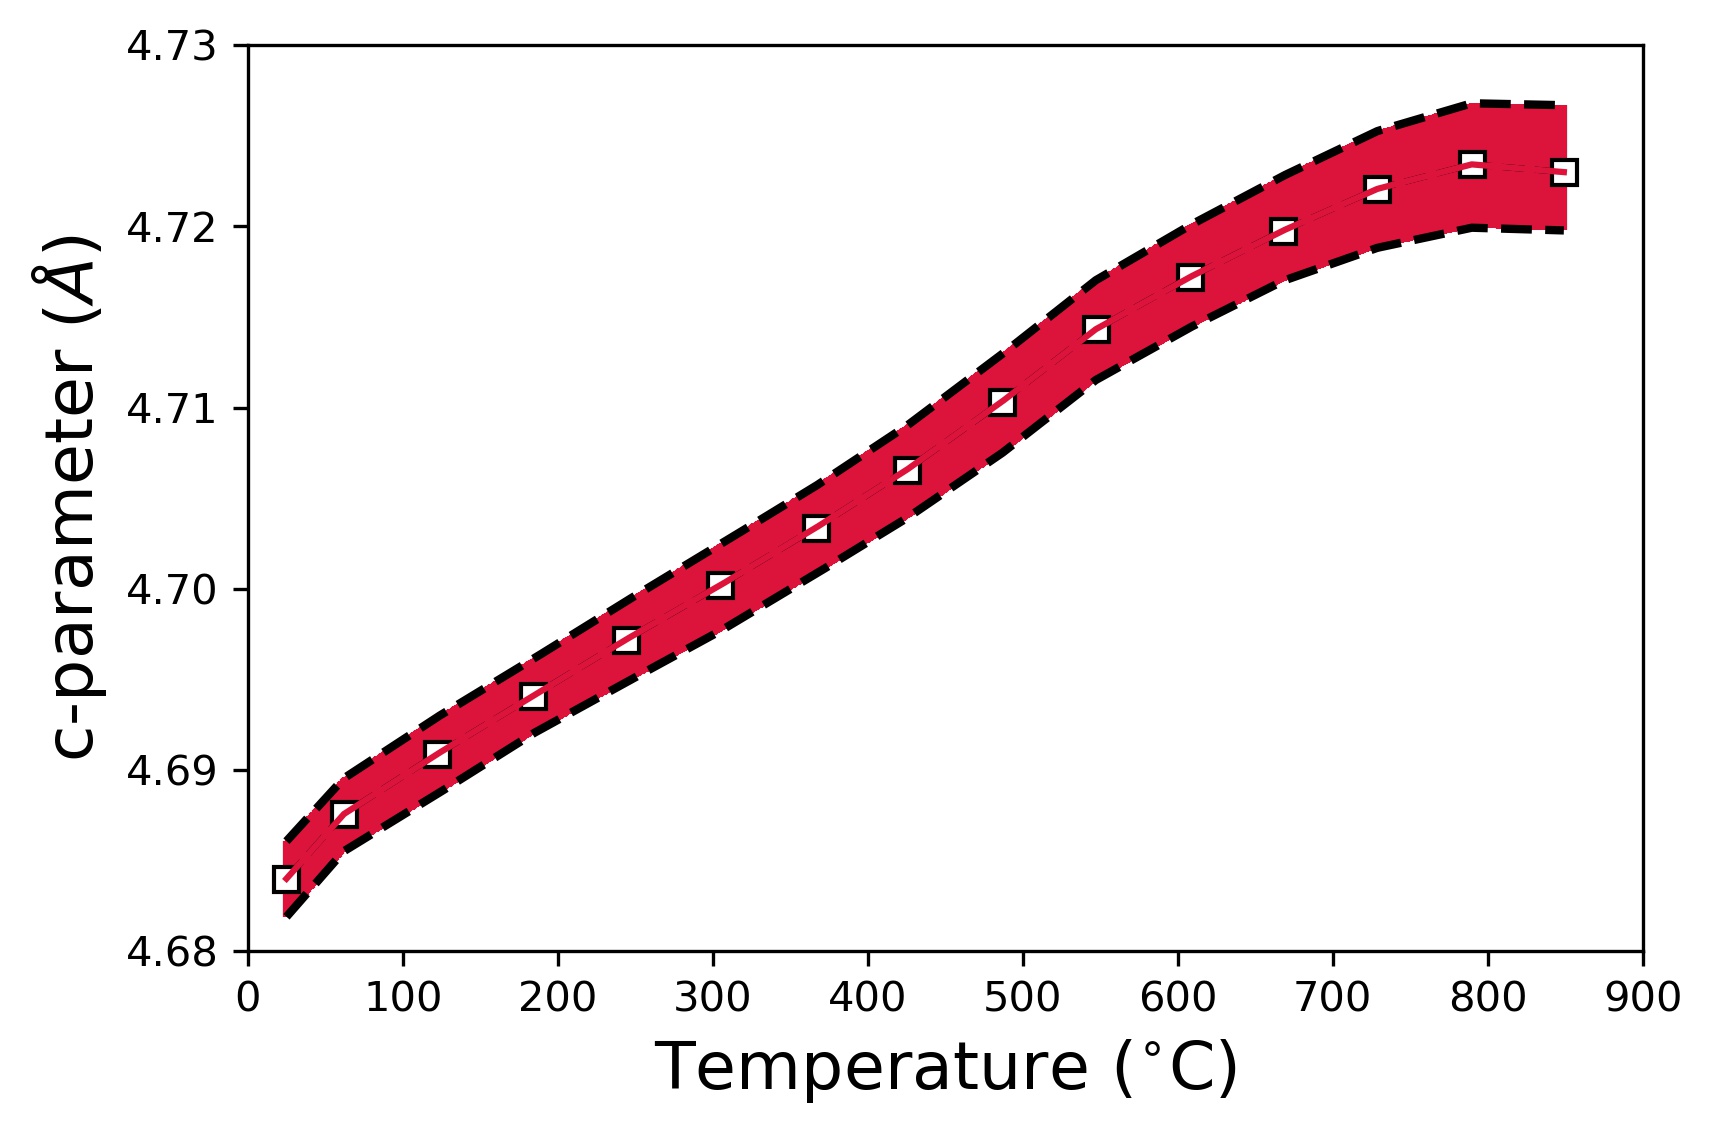
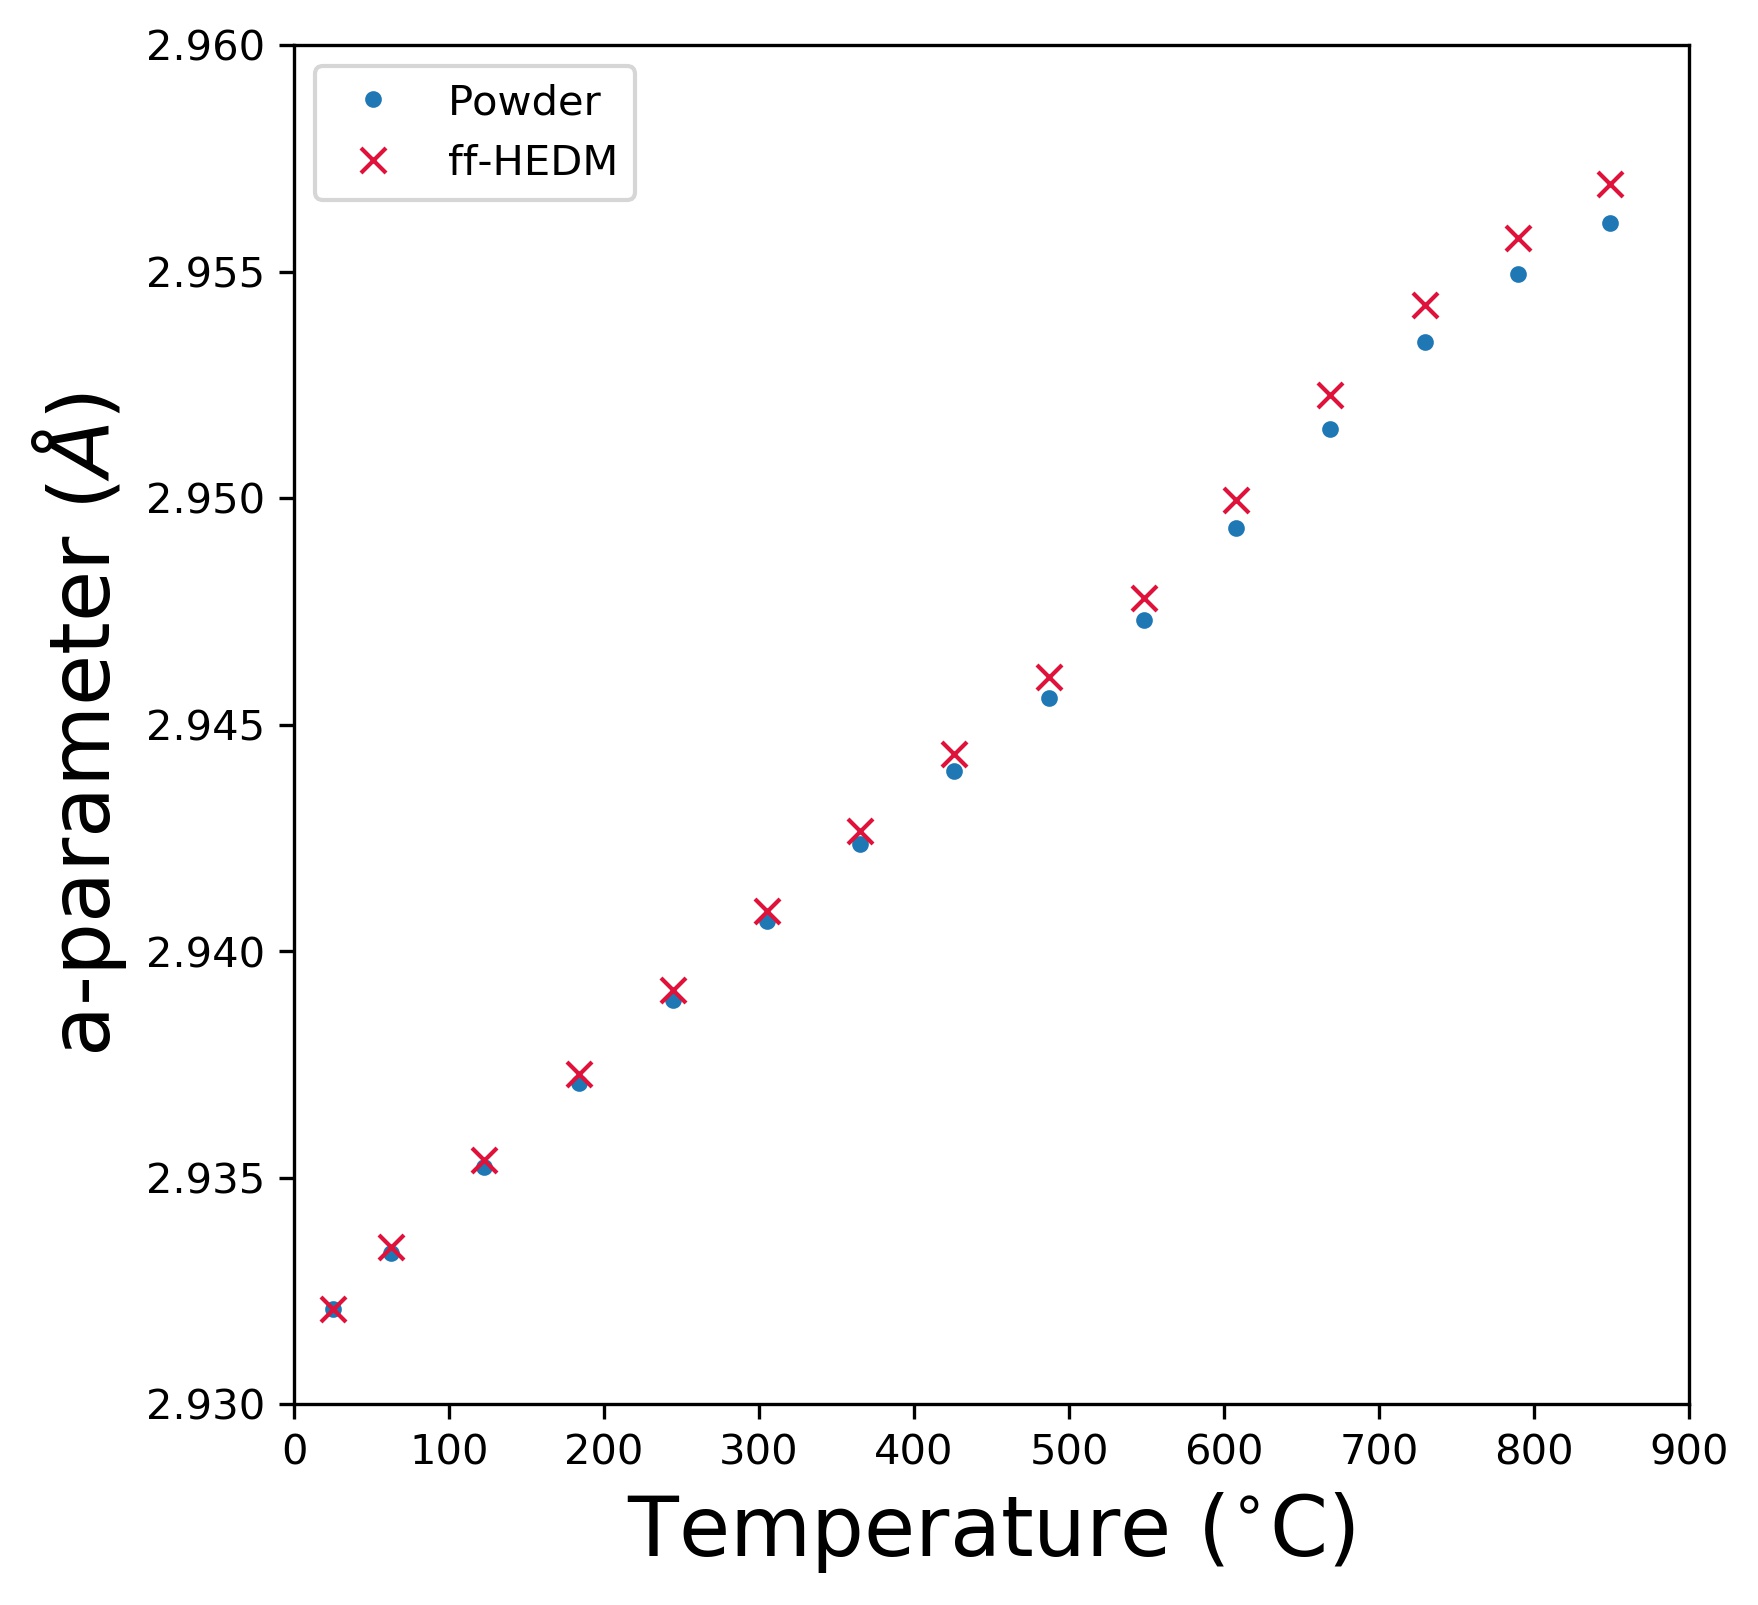
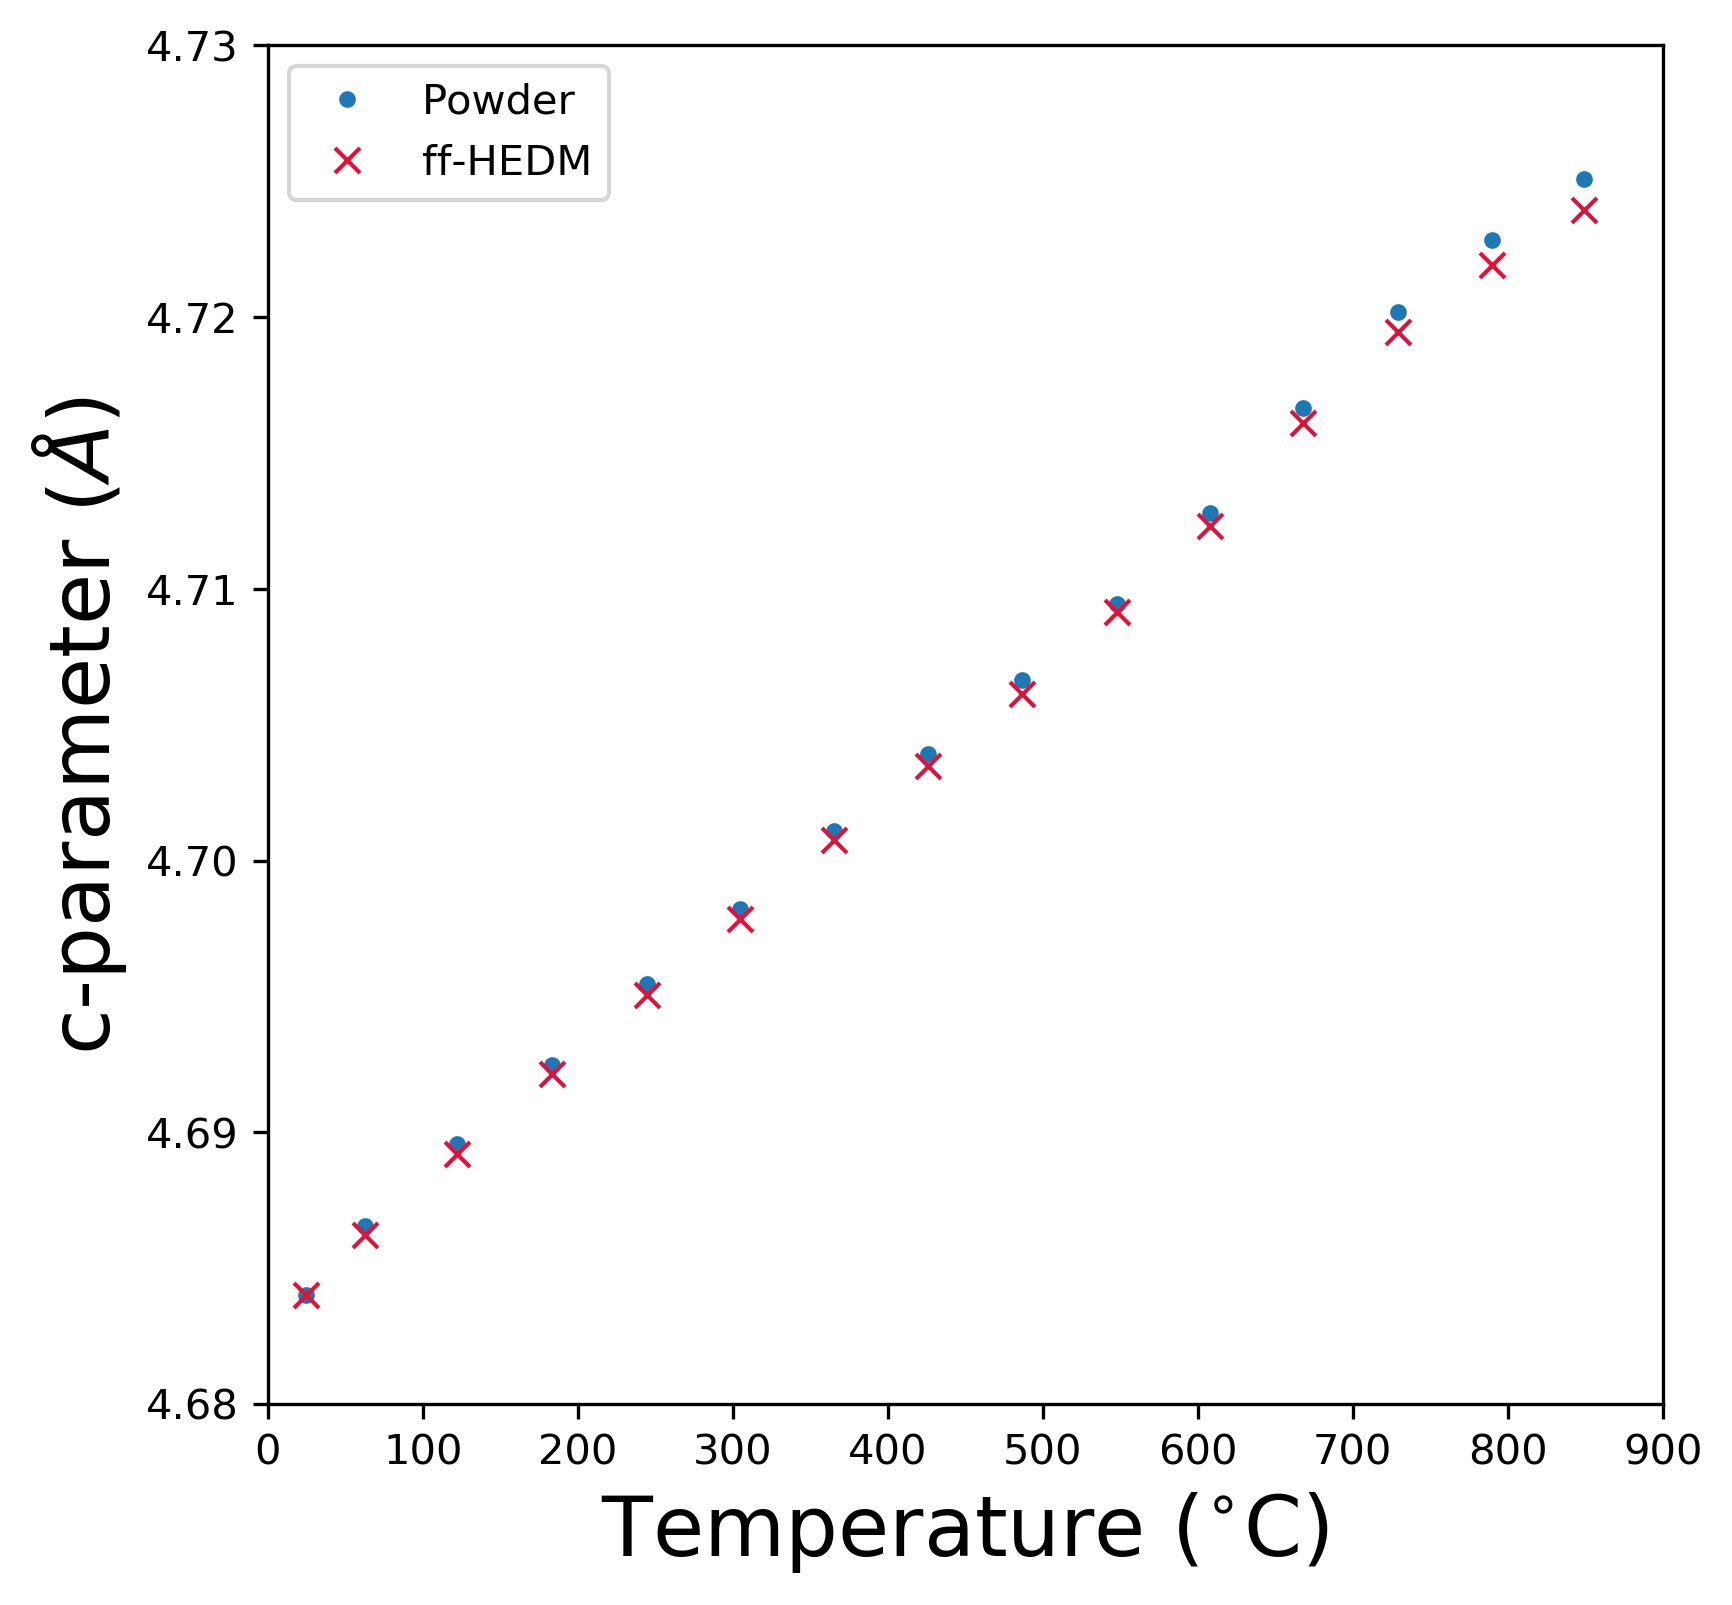
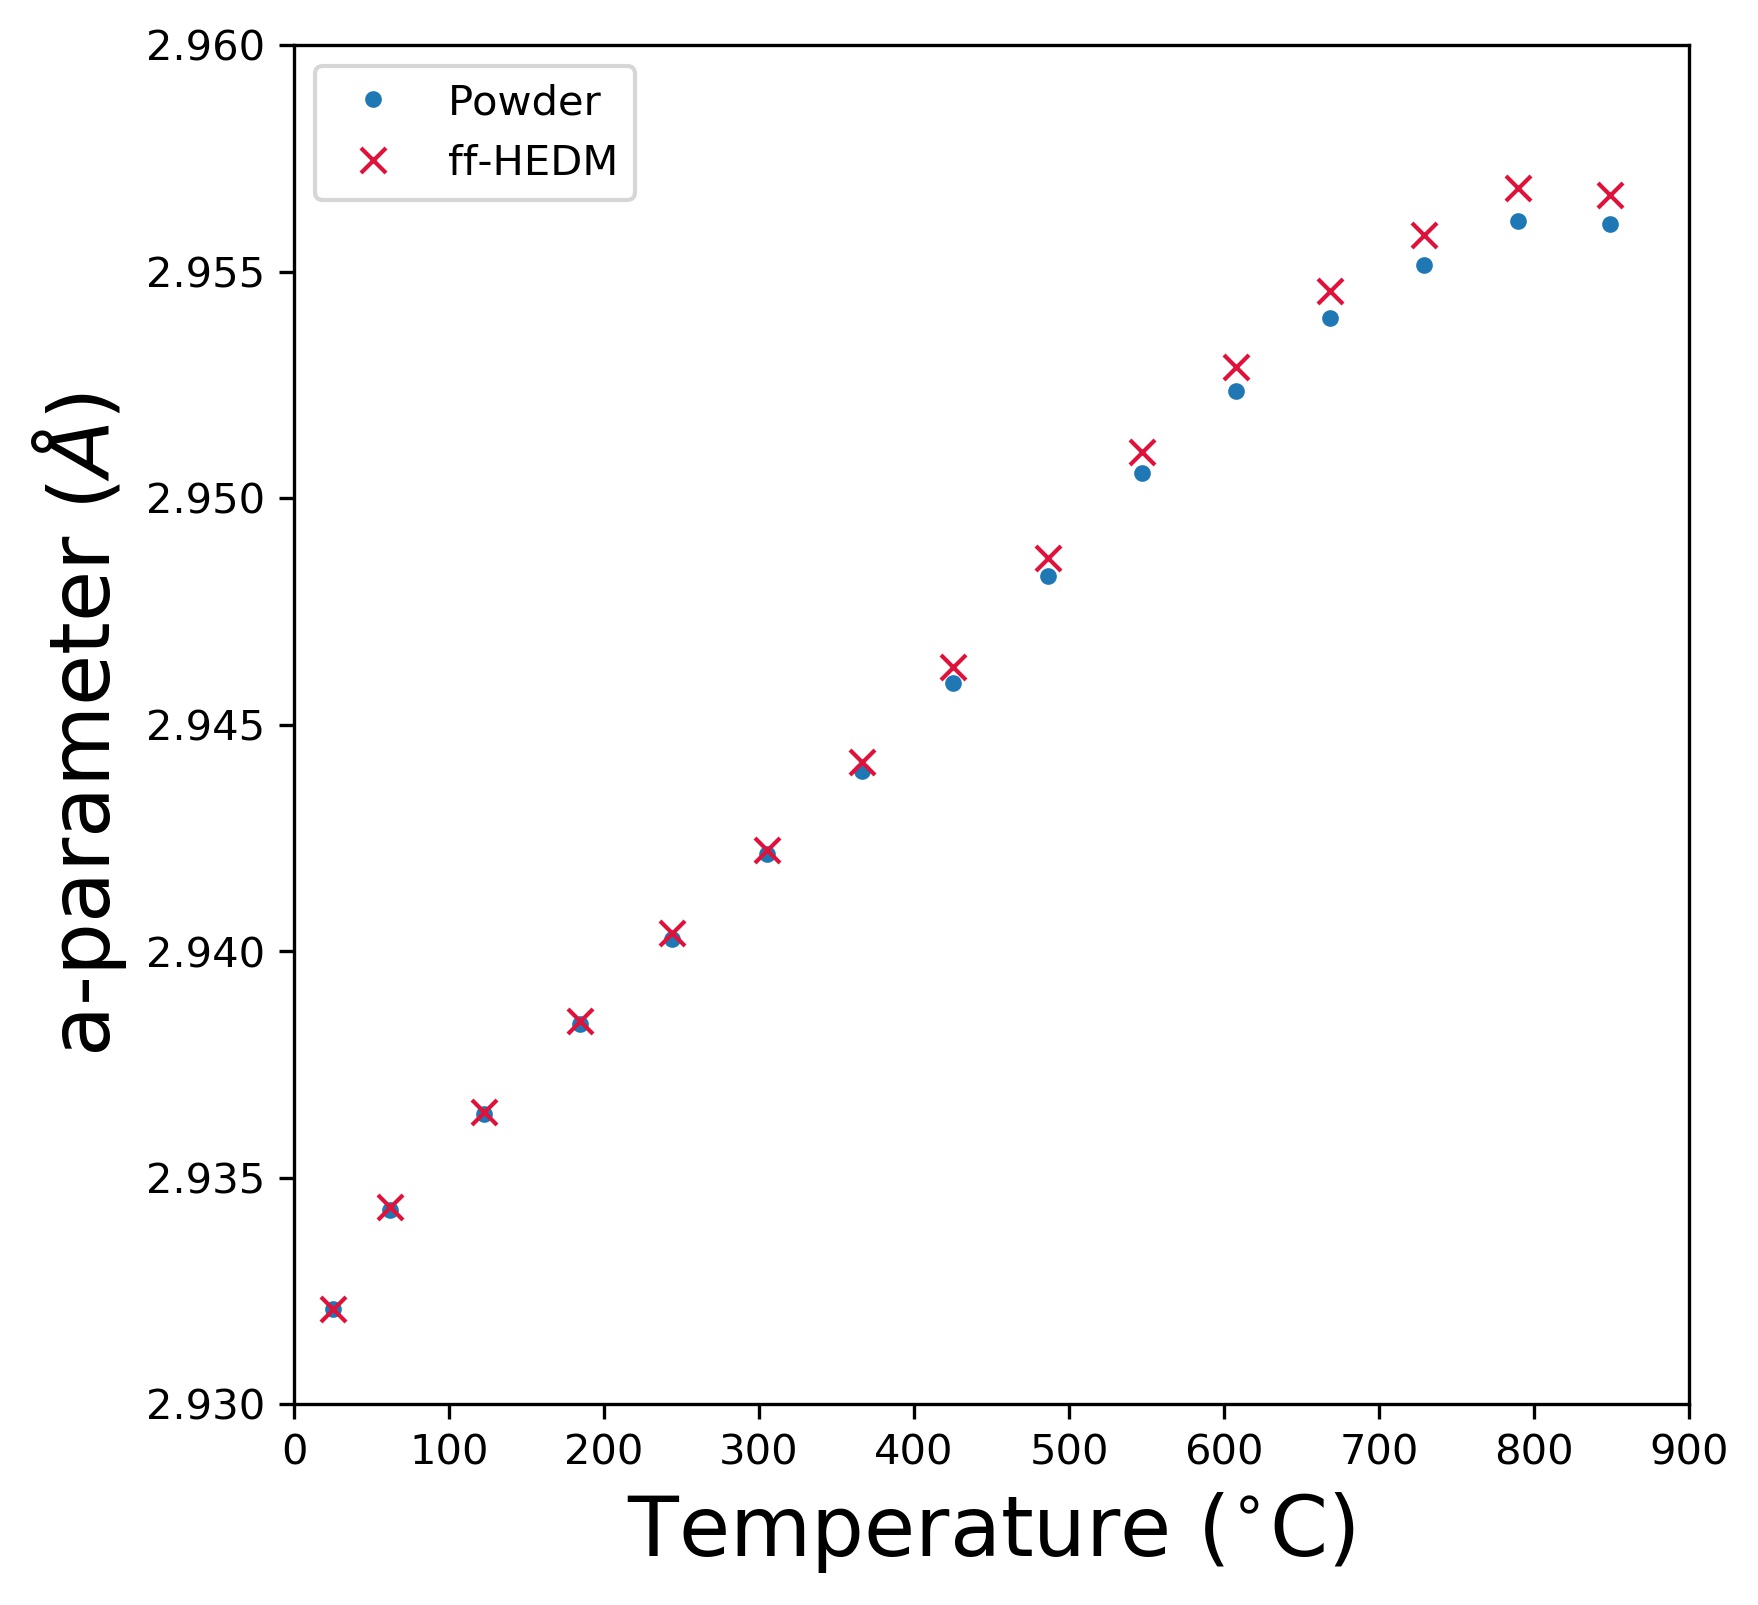
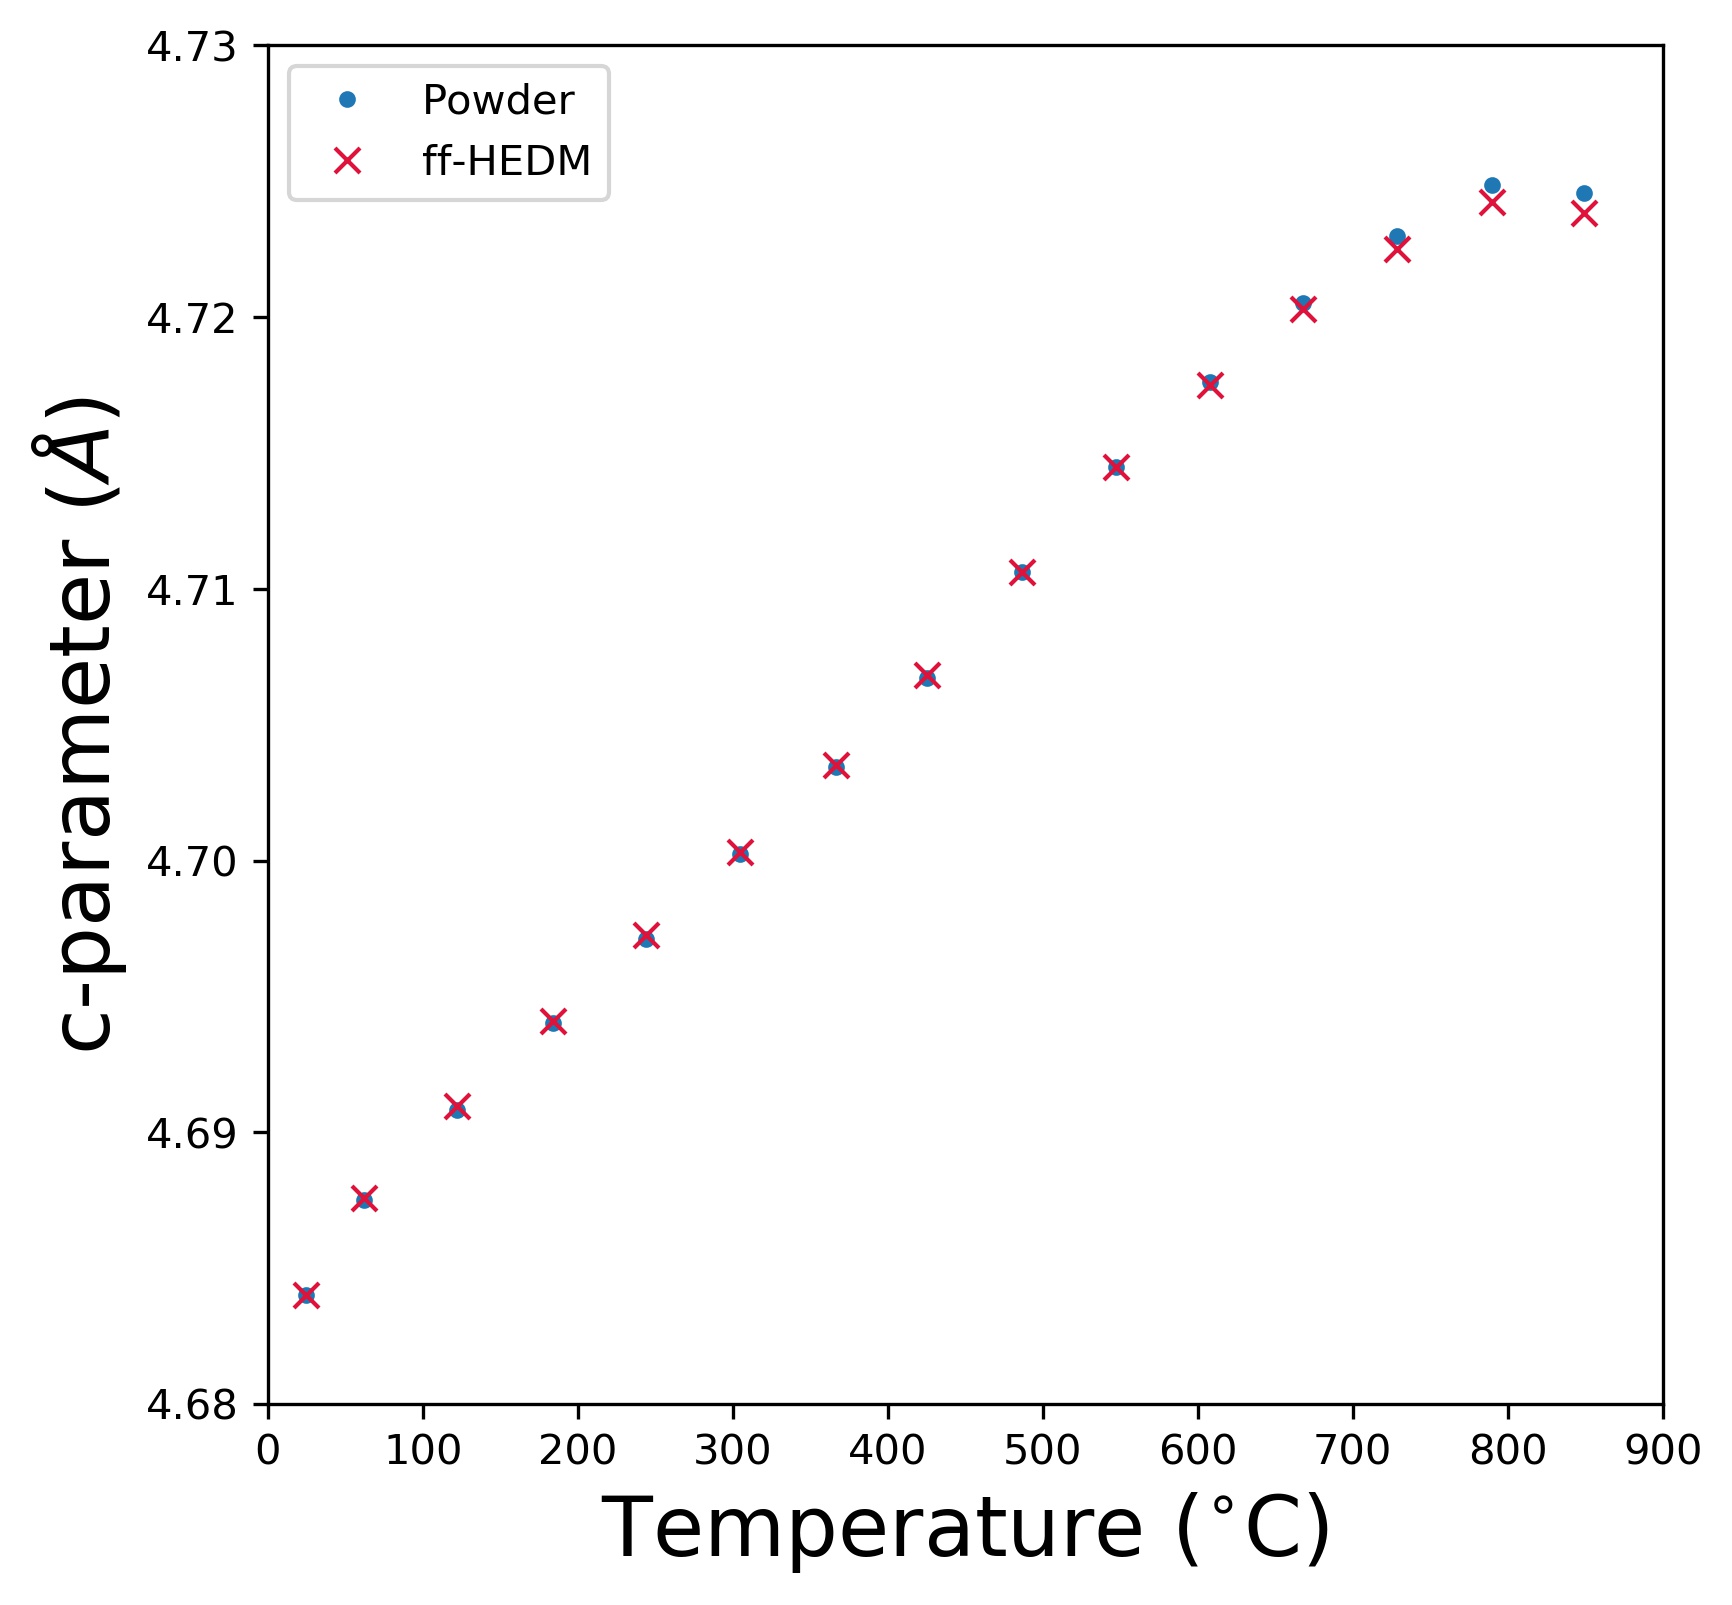
Figure 3 shows the lattice parameters as a function of temperature. The white squares represent the average value for the ensemble of grains at a given temperature while the colored bands span the 10th through 90th percentile of the spread. The lattice parameters for each grain were calculated at each temperature by taking the magnitude of the deformed lattice vectors. Then, the average lattice parameters for the entire ensemble of grains is used as the lattice parameters of the material at that temperature. As expected, the a-parameter and c-parameter expand monotonically with increasing temperature. To confirm that reasonable results were being obtained, the ff-HEDM data was reduced to 1D profiles in 2 by summing over images in then over to create a representative powder pattern, and the lattice parameters were extracted. The lattice parameters calculated using this method, and those from the aforementioned ff-HEDM method were in good agreement (see A).
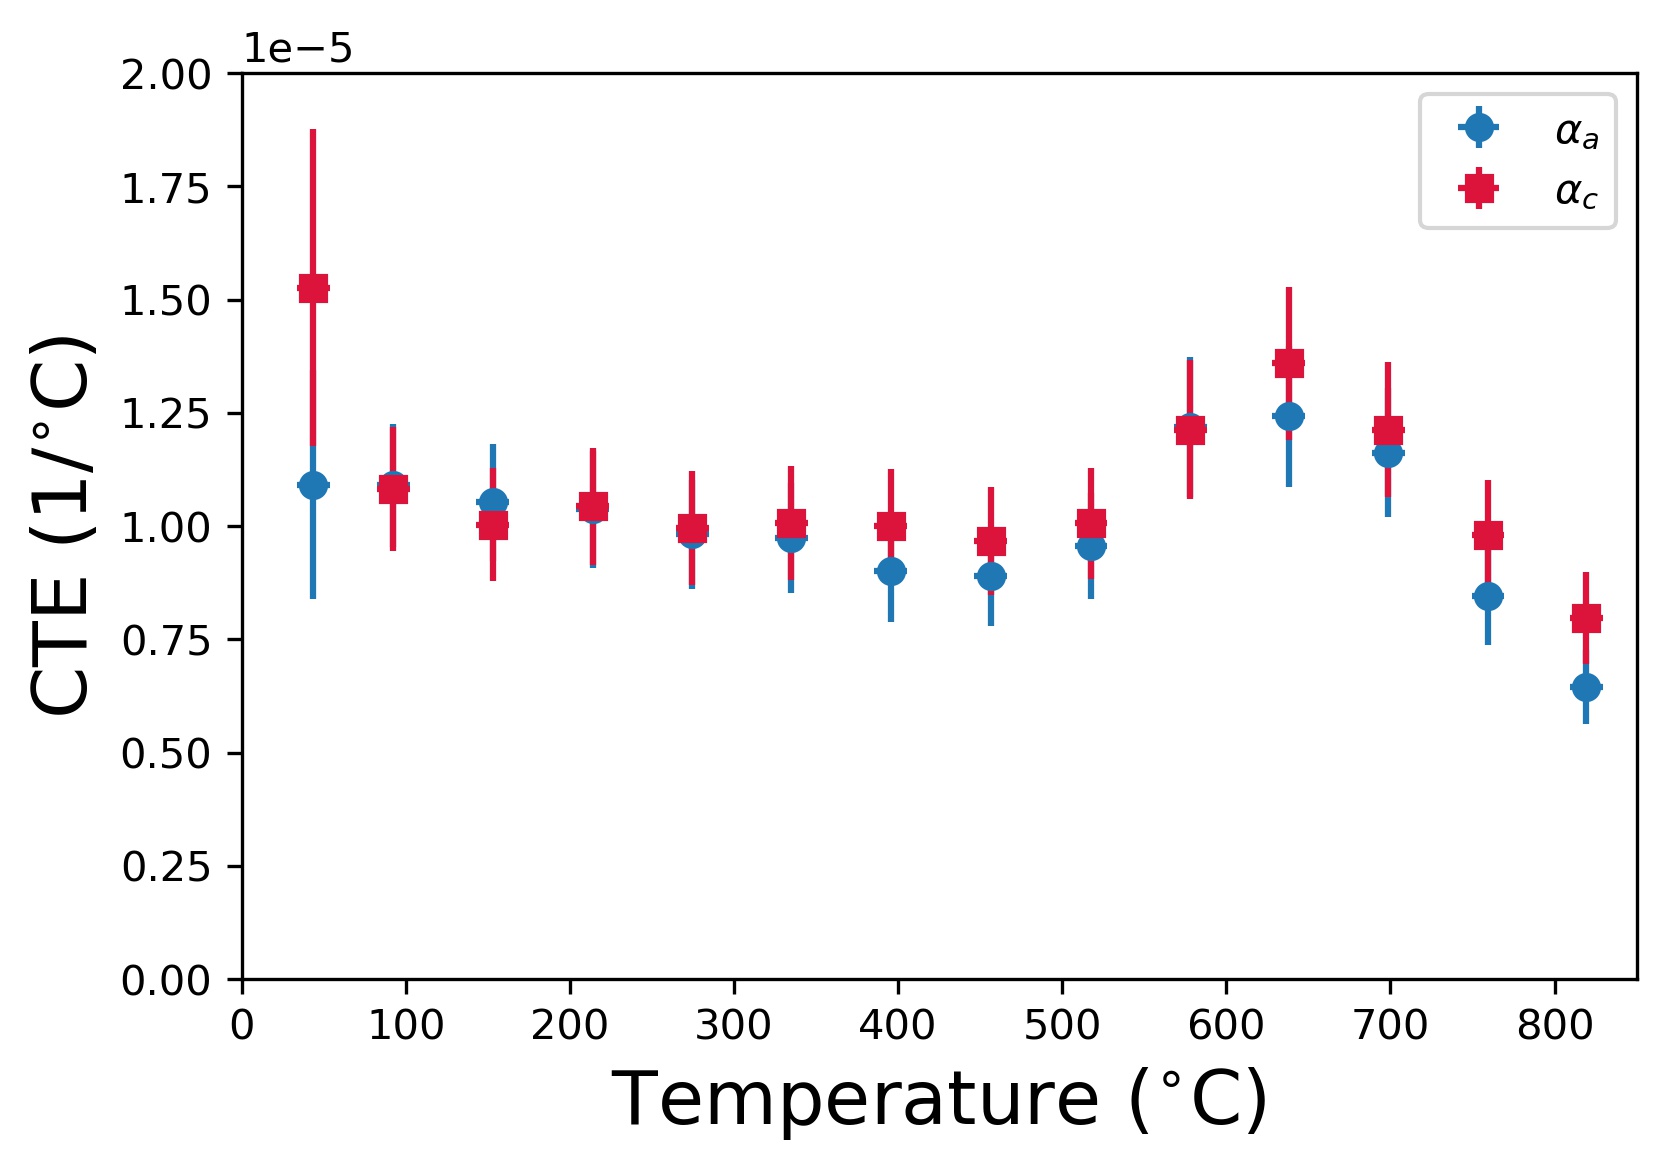
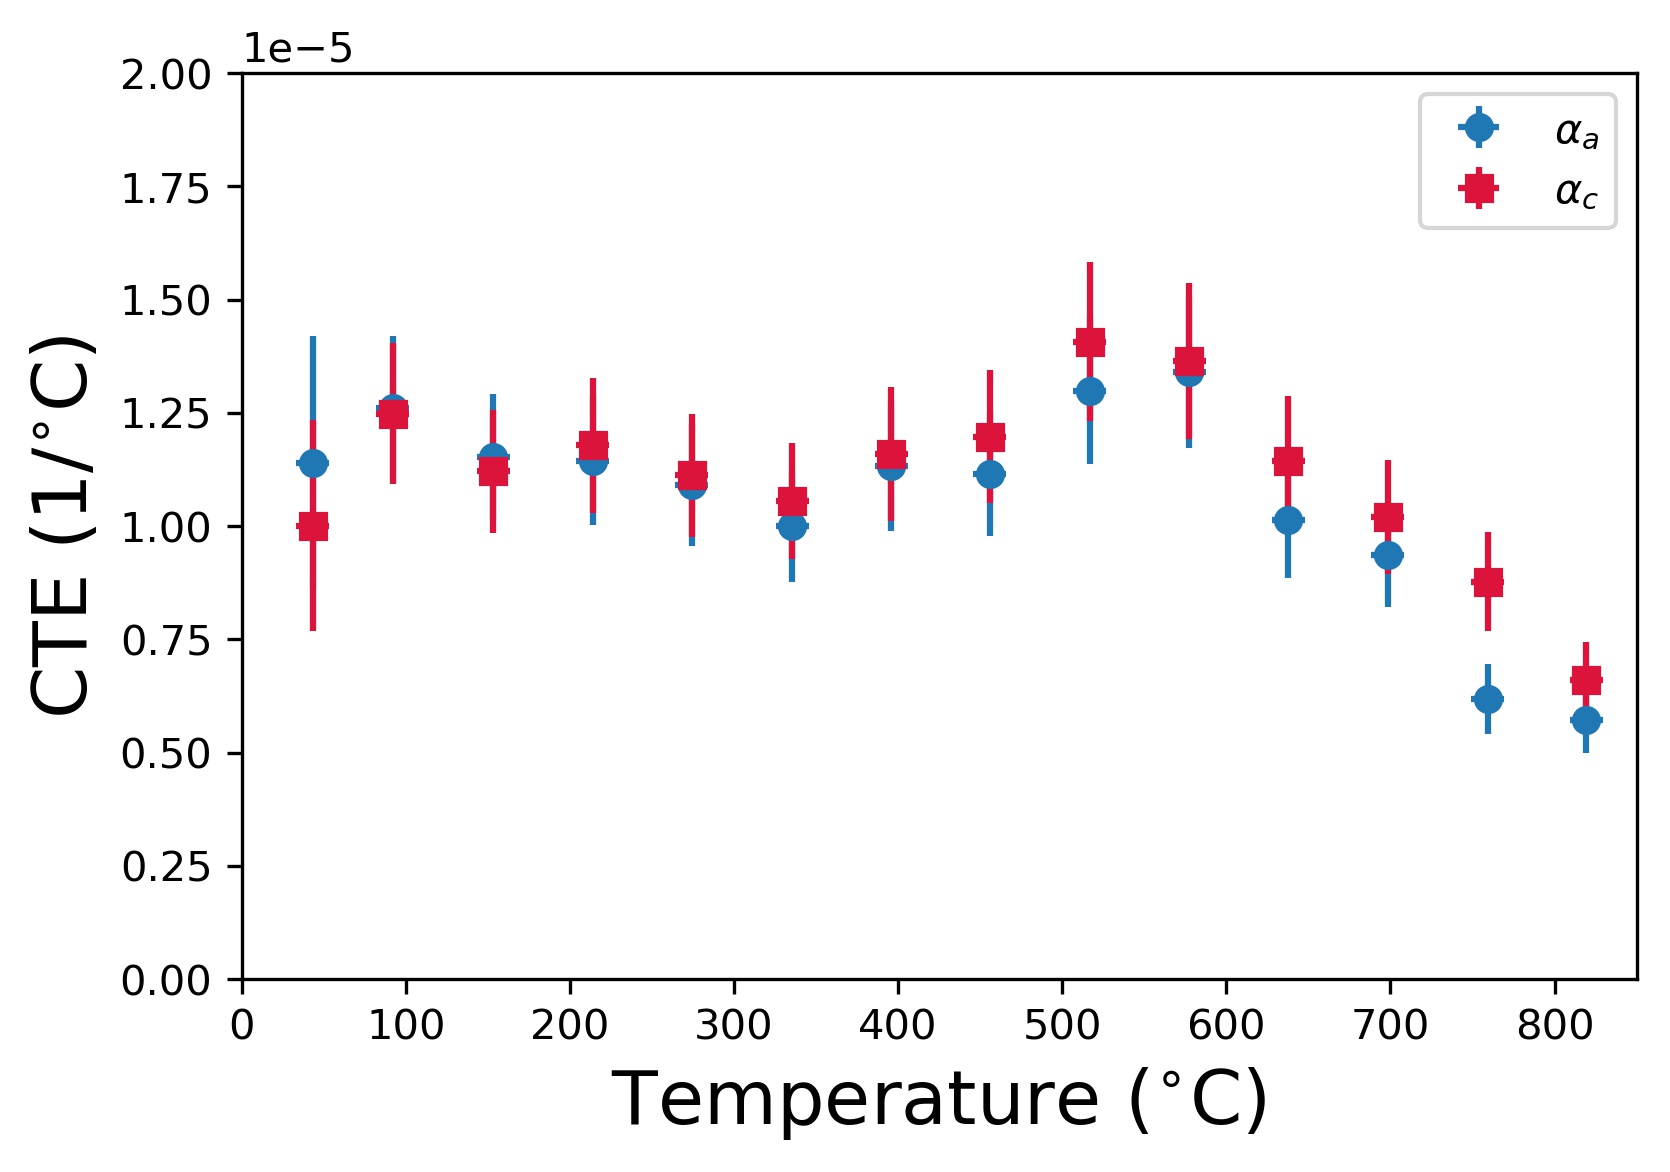
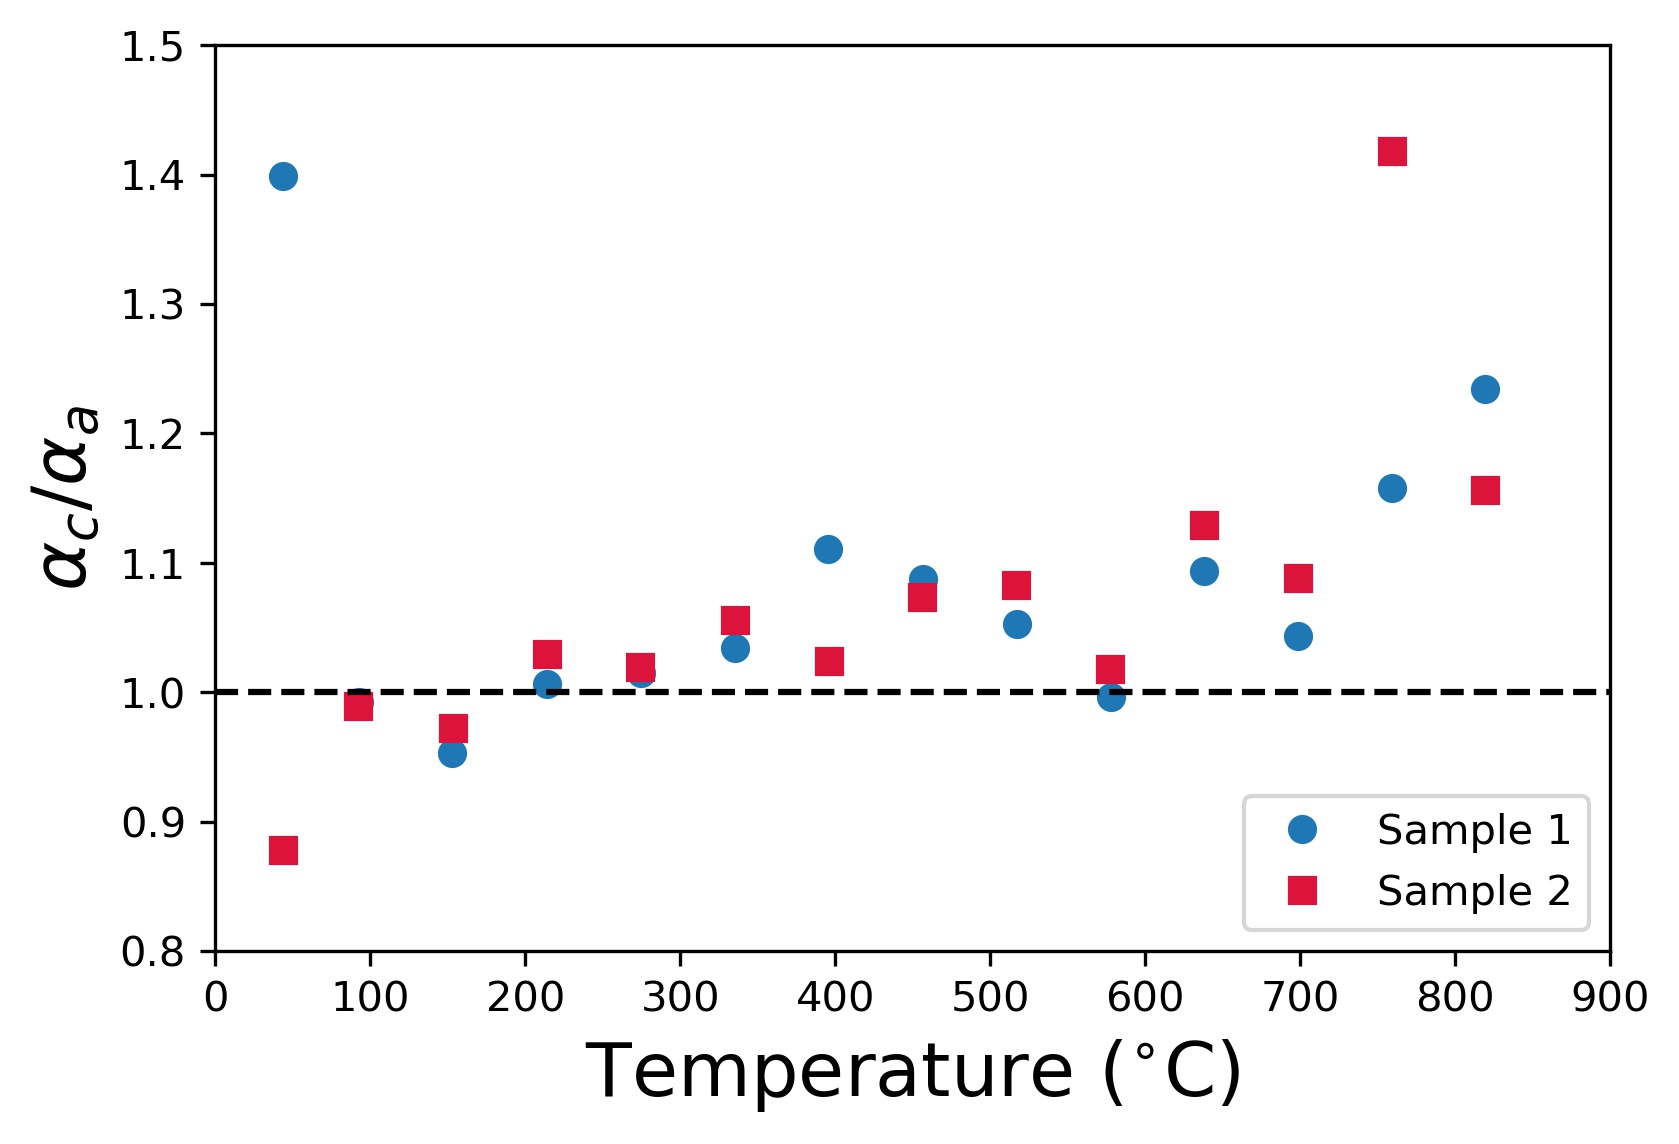
The temperature dependent directional CTEs are shown for both samples in Figures. 4a and 4b respectively, where the bars represent the error bounds calculated from a Monte Carlo calculation, while Figure 4c shows the the relative CTE ratio, over . This value increases with respect to temperature. The CTEs were calculated according to Eq. 2, and the ratios of and were then calculated from this data. Although the directional CTEs exhibited minor variations, in general, both follow similar trends with a peak near 600 C. The ratio of to increased monotonically with heating, with a crossover in ratio from less than one to greater than one occurring at 170 C as shown in Figure 4c. Additionally, the spread in lattice parameters broadens slightly with increasing temperature.
4.2 Ti-7Al grain strain and stress evolution
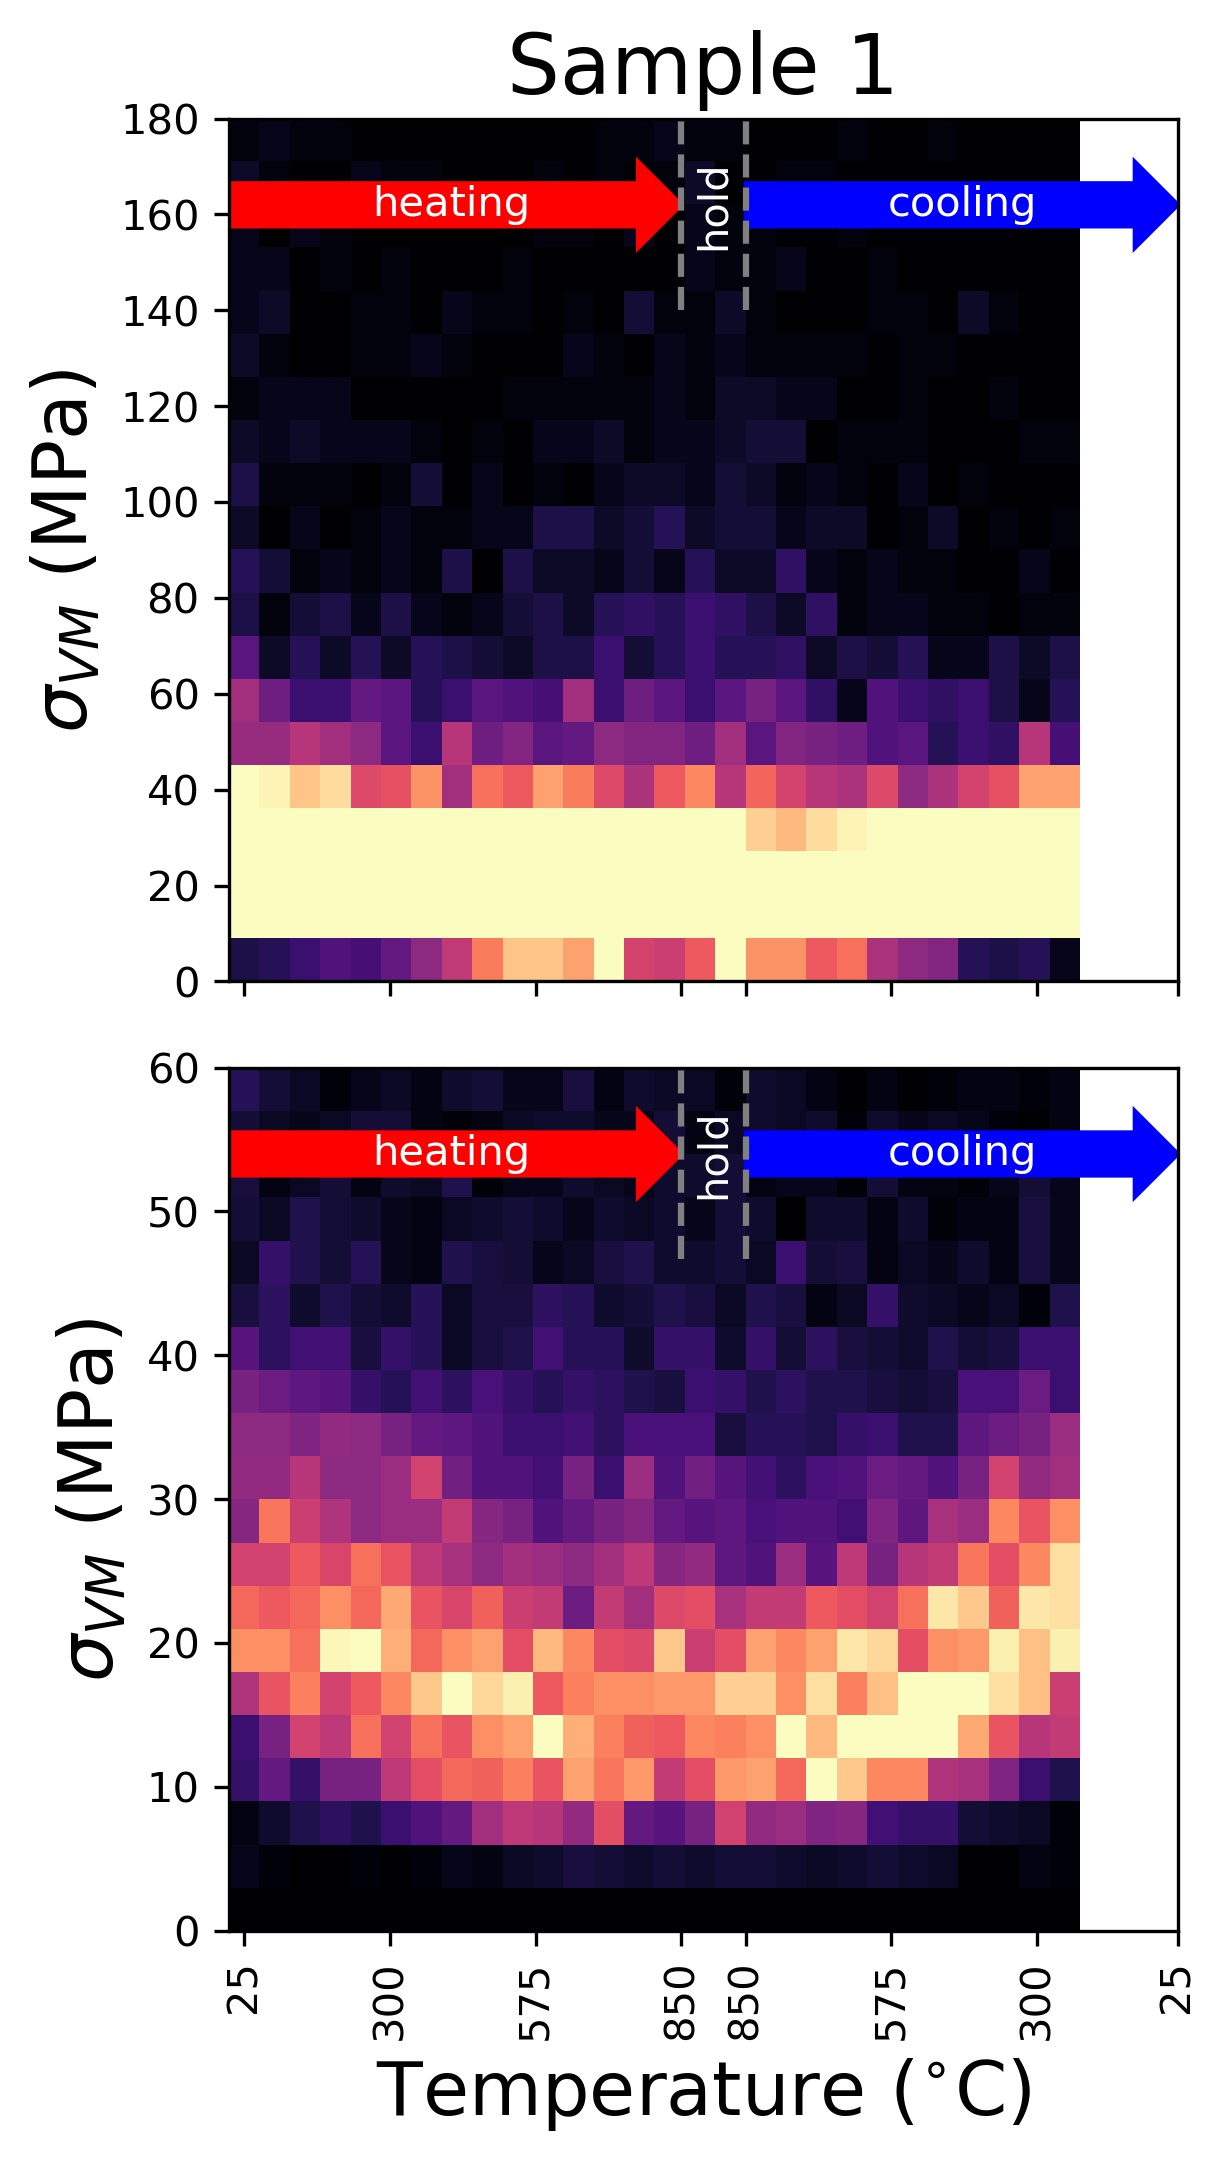
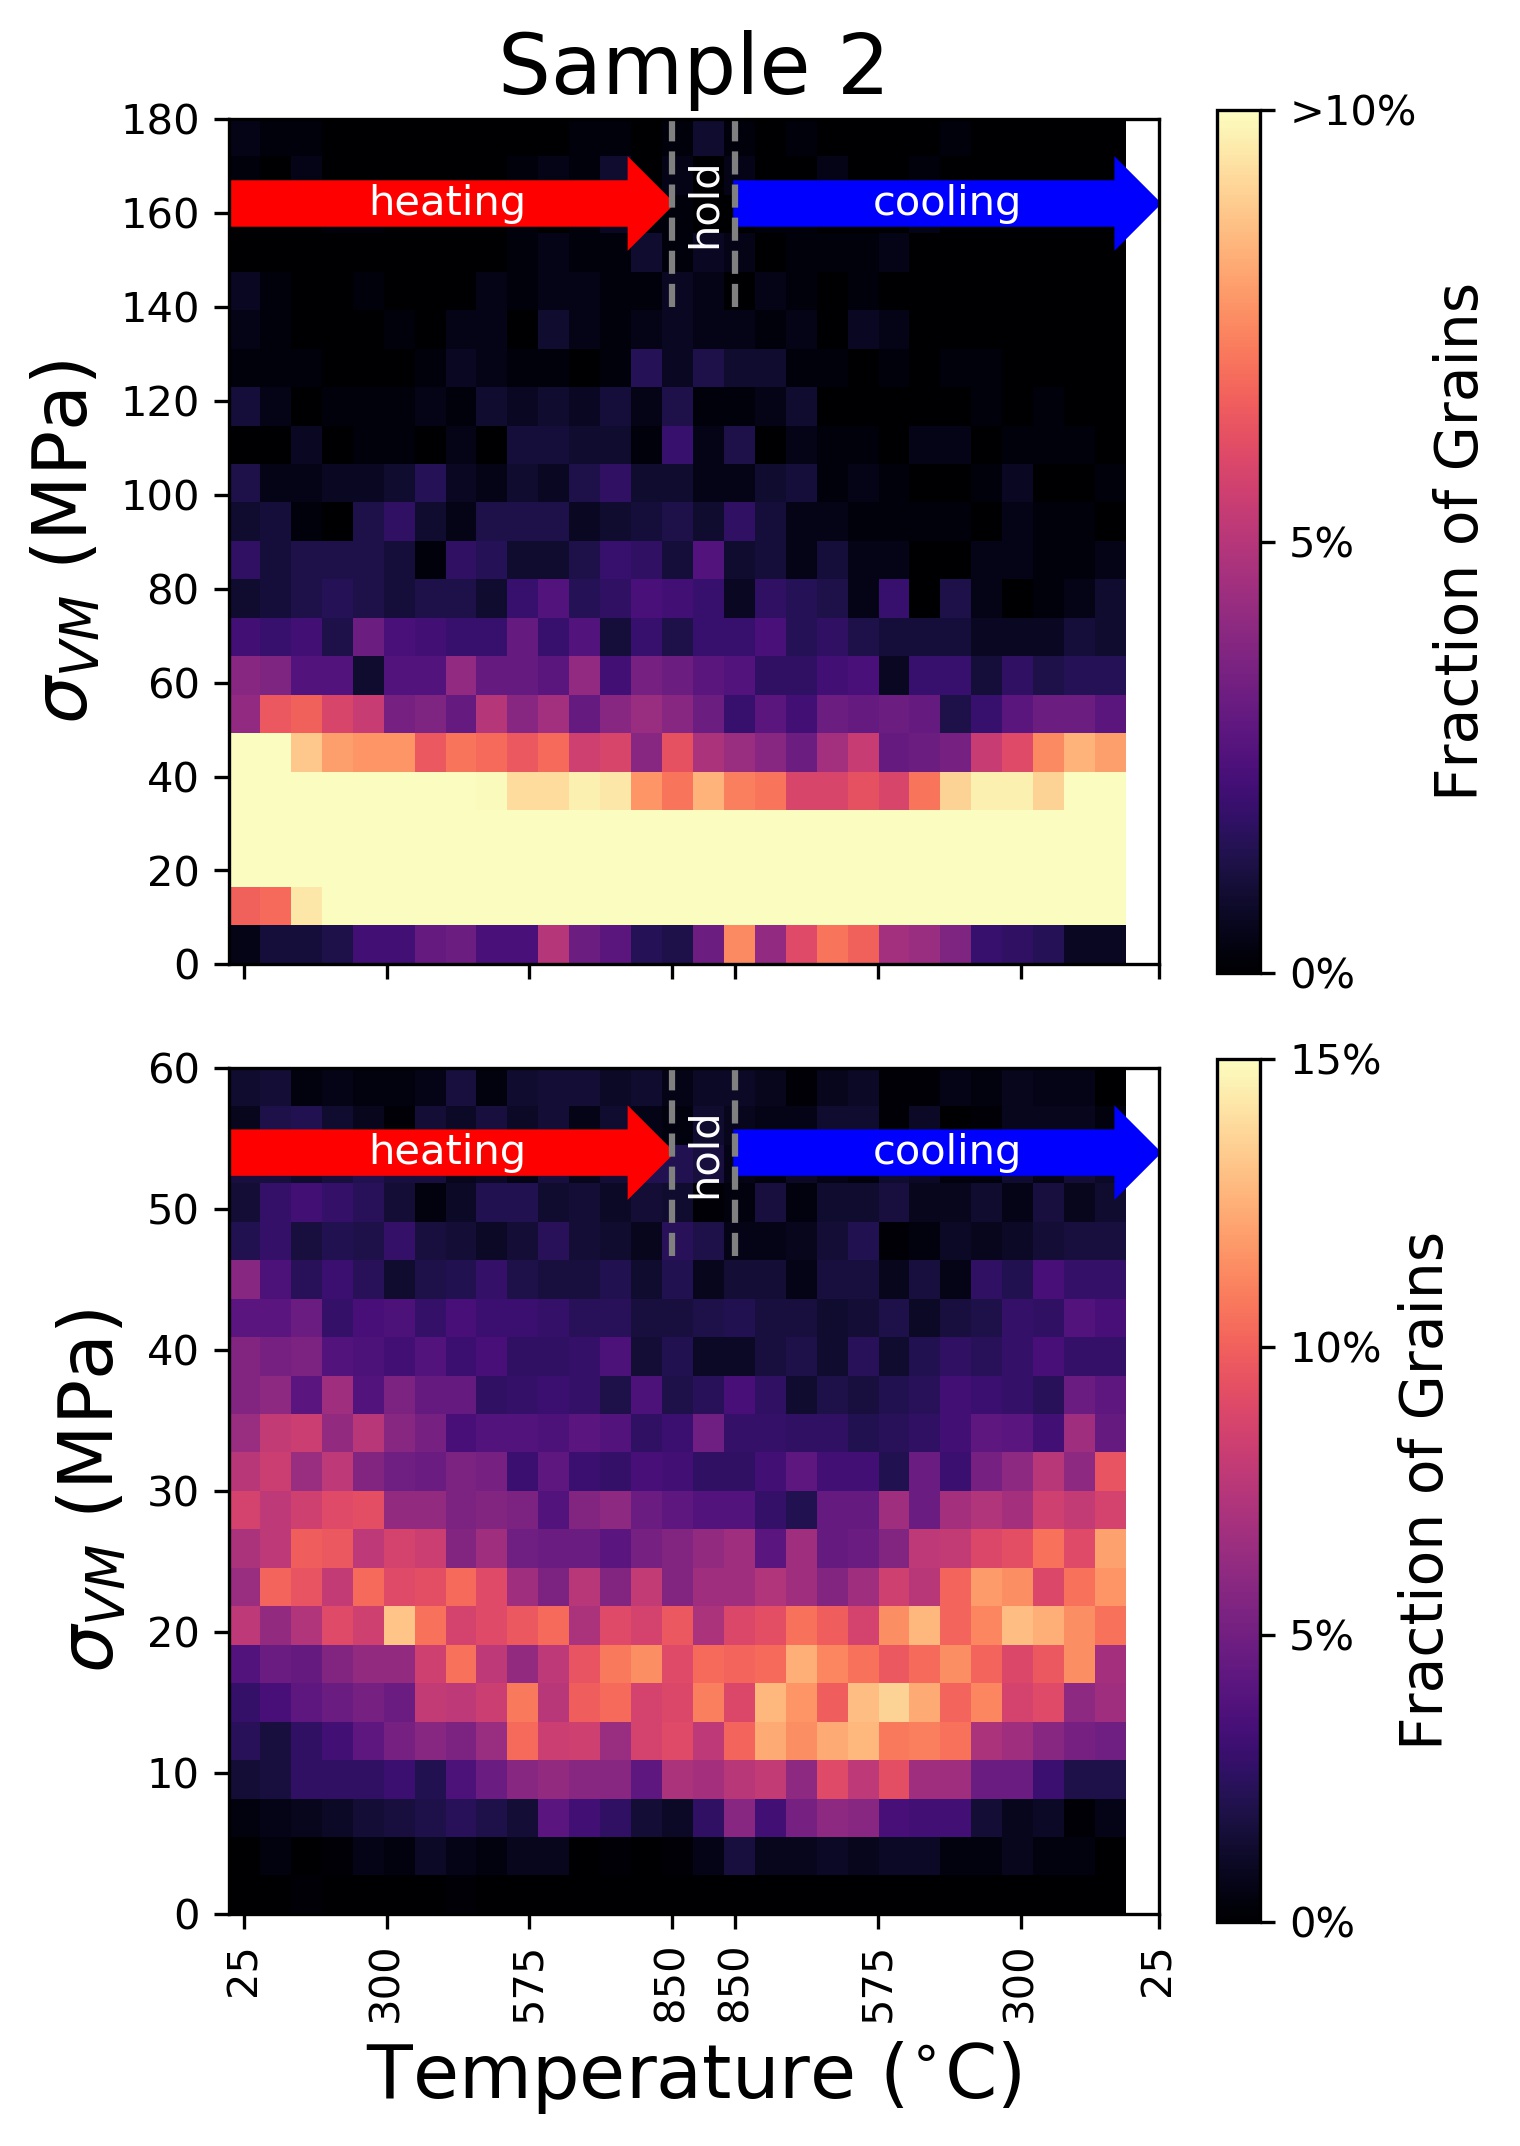
Von Mises stress is a commonly used measure of deviatoric stress for predicting plastic deformation in a material, and in the most basic sense, the higher the von Mises stress (), the more likely a material is to yield. In order to examine the likelihood of possible micro-plastic events, the distribution of was plotted in Figure 5 for each temperature in the thermal cycle. The decreases until 700 C when the spread of the distributions start to increase. As the samples cool, the mean and spread of the distribution of decreases until the sample reaches 700 C when they start to increase again until room temperature where both the final mean and spread of the distributions are less than the initial values.
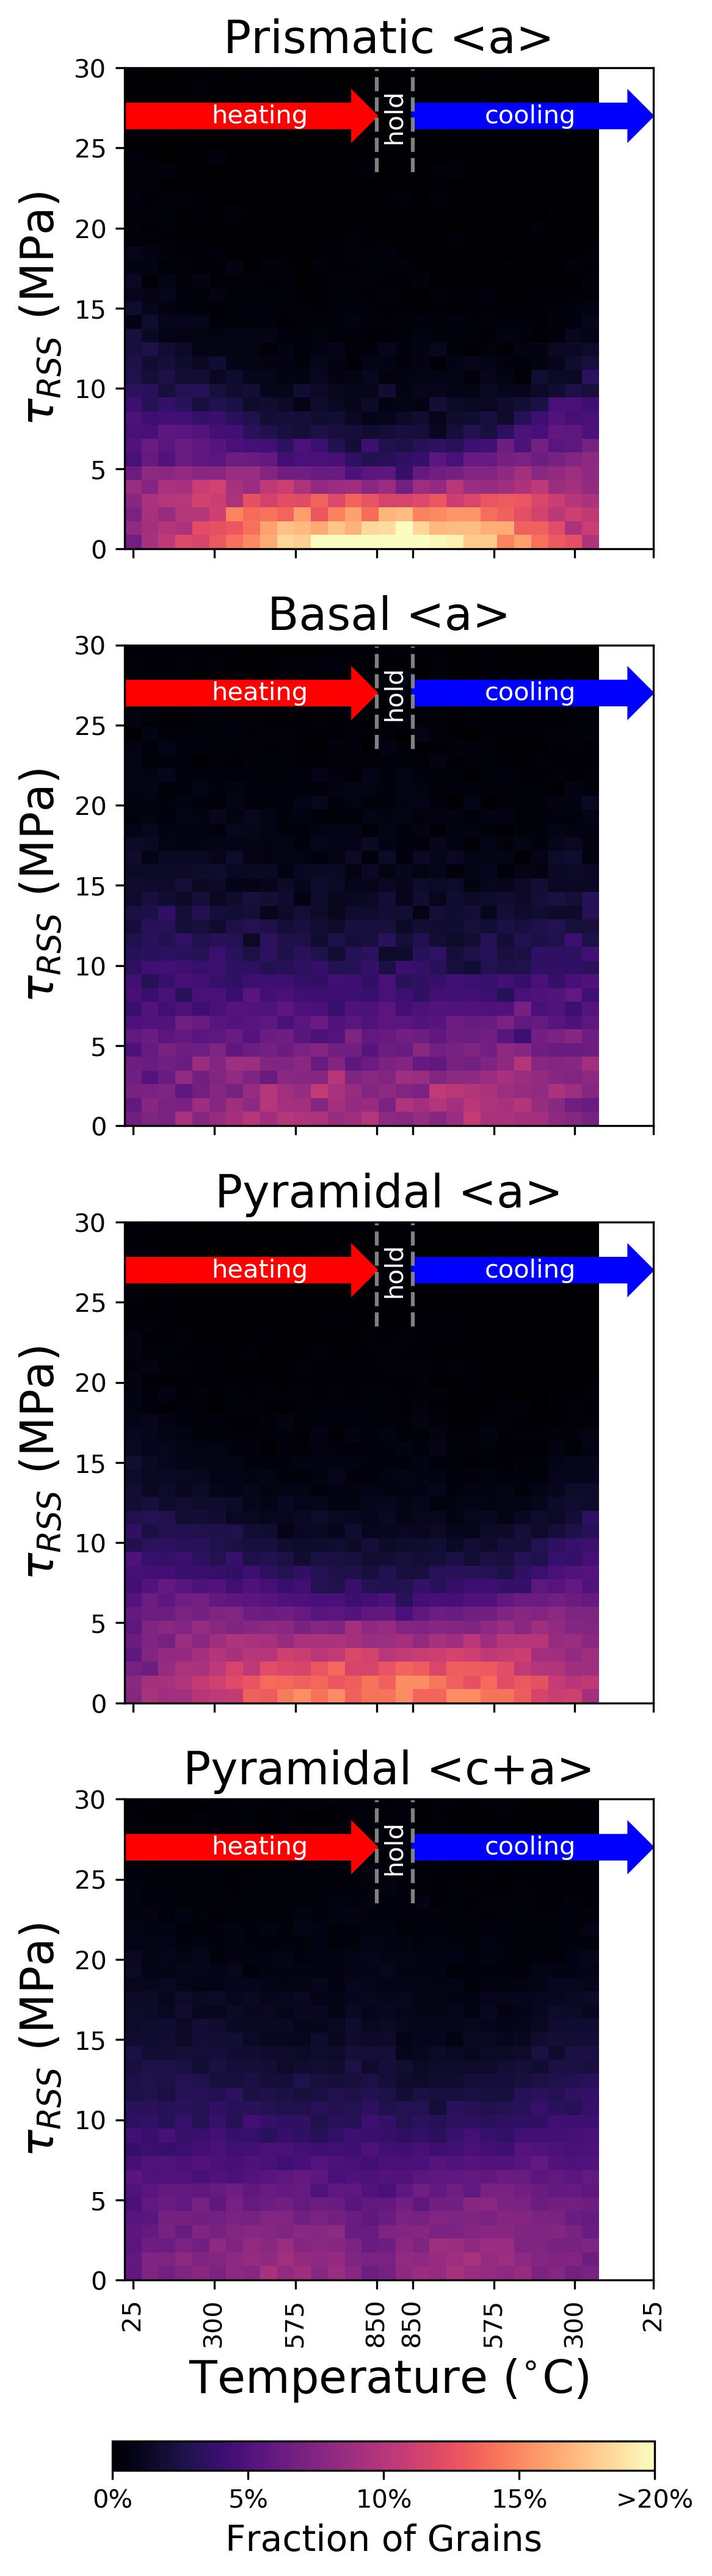
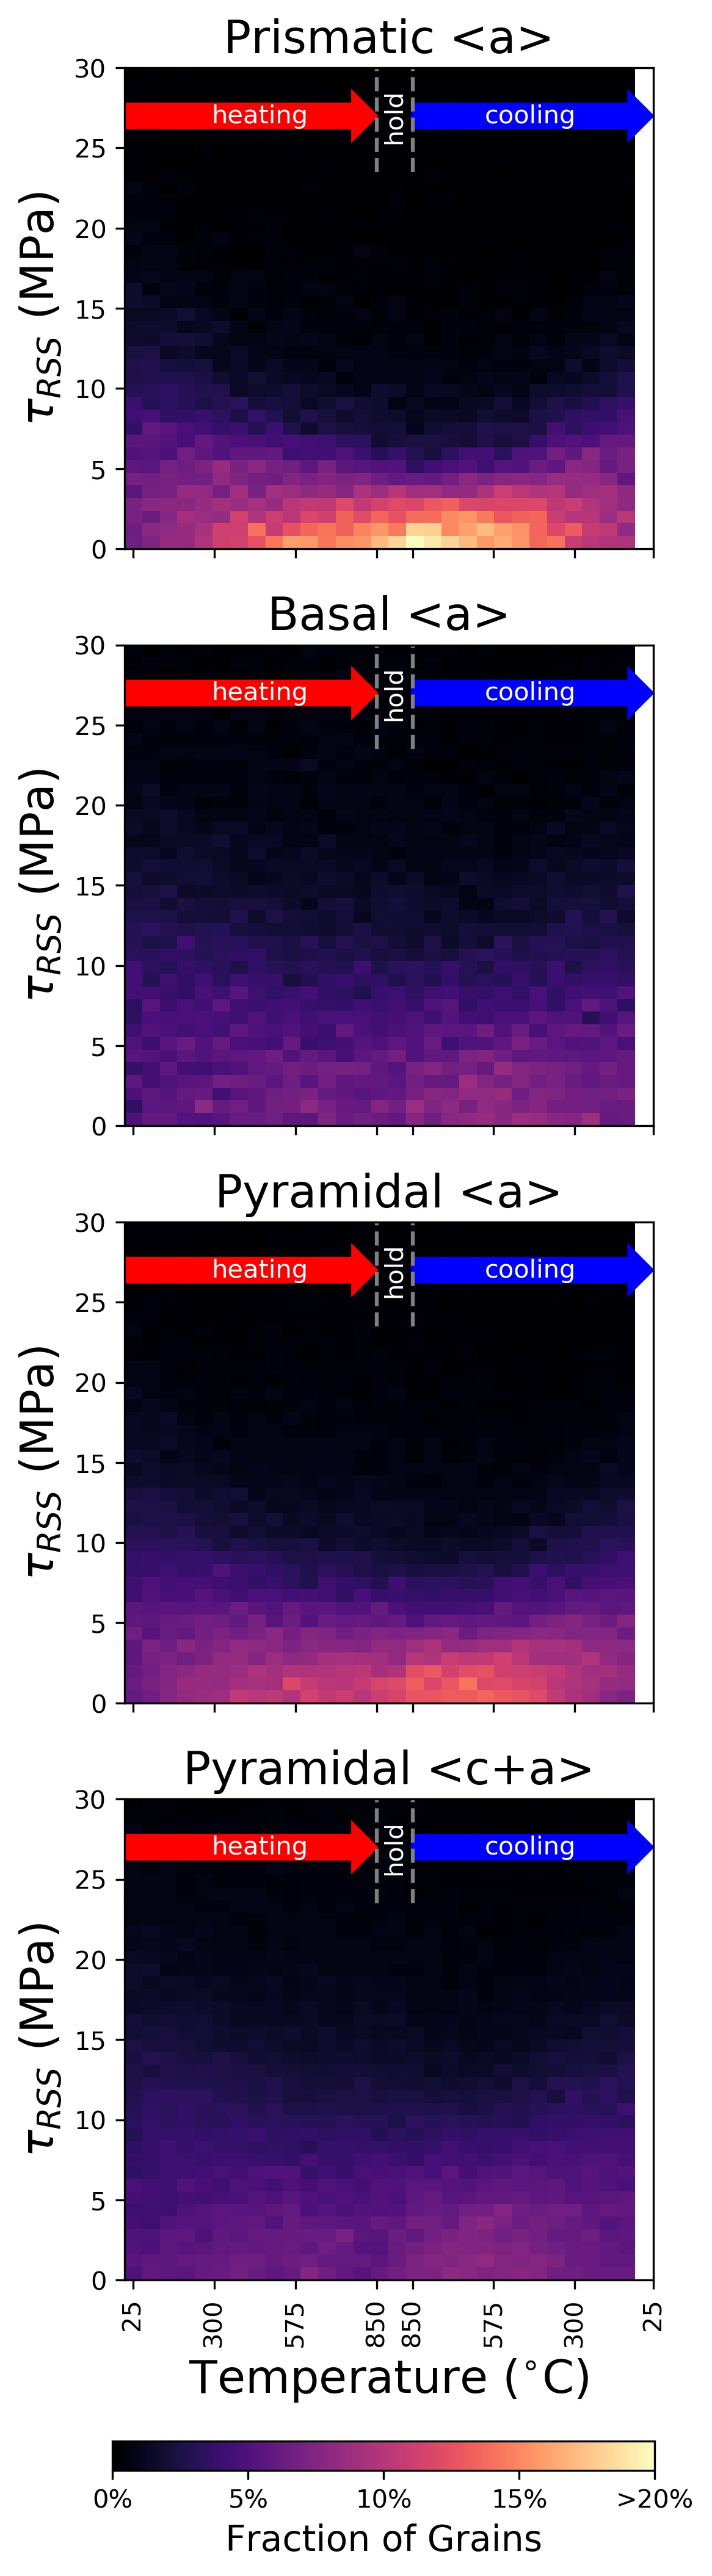
Motivated by the possibility that certain grains may have experienced micro-plastic flow, the measured strains were used to calculate the elastic strain (Eq. 3) and subsequently the stress in each grain via temperature-dependent moduli from Fisher et al. [40] (see B). The RSS values for all four slip systems were calculated by projecting the stress onto each individual system. Figure 6 shows that the RSS on all of the slip systems tends to decrease as a function of temperature. However, the mean values for the pyramidal c+a systems decrease until 700 C when they start to increase slightly, similar to the distributions. Additionally, the distributions for the prismatic a and the pyramidal a systems are tighter than the distributions for the basal a and the pyramidal c+a systems.
5 Discussion
Thus far, we have shown that ff-HEDM data can be used to measure not only the anisotropic thermal expansion in Ti-7Al, but also the effects of the grain-interactions caused by the constraints of a polycrystalline aggregate. This section further discusses these results and their significance.
5.1 Comparison of CTEs with literature
As mentioned, the CTEs for titanium reported in literature (Table 1) vary from a low of 5.6 10-6/C to a high of 13.6 10-6/C and show little agreement even for the ratio of to . Based on the results of this study (Fig. 4), the temperature dependence of the CTEs may explain the observed spread of values and ratios. Most reported values in the literature do not take temperature dependence into account, whereas we find that the CTE ratio is less than one at low temperatures and greater than one at high temperatures, therefore the temperature range in which the CTEs are measured is critical.
For example, Pawar and Deshpande [5] and McHargue and Hammond [8] measured the CTEs up to 155 C and 225 C respectively, and report values where . This is within the temperature range where the present work shows that the to ratio is less than one. In contrast, Berry and Raynor [9] and Spreadborough and Christian [10] measured the CTE up to 700 C and 600 C, and report values where . In this temperature range, the present work confirms that the ratio of to is greater than one. This also agrees with the results from Zheng et al. [4], who showed a crossover point around 690 C. However, these measurements were made in commercial purity titanium and were extracted from a simulation, and the experimental CTEs were not shown. The crossover point found here at 170 C for the Ti-7Al alloy is lower than what was found in commercial purity Ti [4] but follows the same trend.
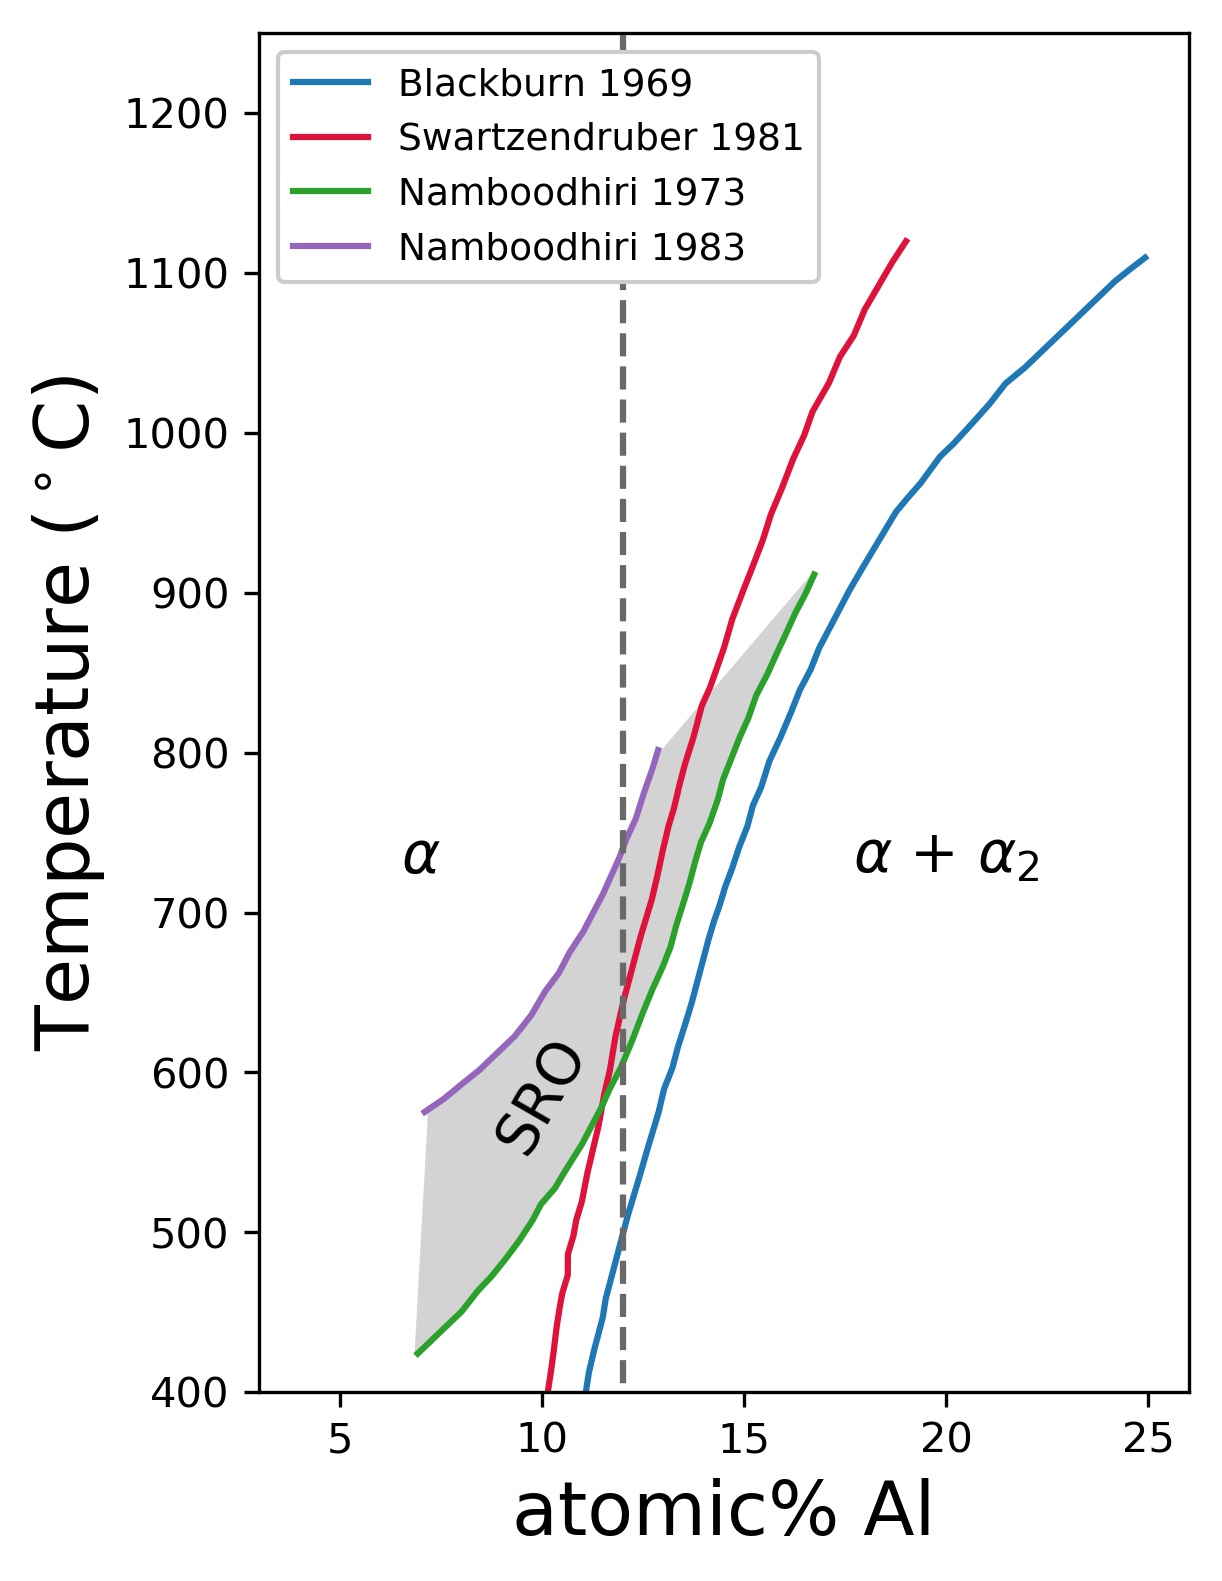
In addition, it is important to note that with 7 wt% Al (12 at%) , the Ti-7Al material falls within the two-phase region of the Ti-Al phase diagram (Figure 7). This can explain why the CTE values for the two axes vary systematically with temperature, with three distinct sections in the curve (Fig. 4a-b). The first section is the decreasing CTE of the Ti-7Al material with both the and phases present, the second region is the increasing CTE where the nanoprecipitates are dissolving into the material, and the third region is the Ti-7Al material with only the phase. However, the boundary between the and regions is not well defined as can be seen in Figure 7. For this composition, the Ti3Al and SRO regions dissolve somewhere between 500 C and 700 C, but the exact temperature is unknown. The large temperature range can explain the discrepancy between samples 1 and 2. It is expected that if the material was to be heated with a more gradual ramp rate, the increase in CTE would be sharper and more distinct as the should dissolve at a single temperature.
5.2 Micromechanical Response
At 700 C, the RSS values for the basal, prismatic, and pyramidal a slip system families continue to decrease whereas the pyramidal c+a slip systems increase markedly. The pyramidal c+a slip system is harder than the other three [27, 22], so by 700 C, the other three are soft enough that they experience slip, causing new grain interactions and a stress build up on the pyramidal c+a systems which still have some strength. This build up of stress on the pyramidal c+a slip systems is enough that it causes an increase in the upper tail of the distribution at high temperature. As the material is cooled back down to room temperature, the grains contract, and the internal stresses follow the reverse path of the heating.
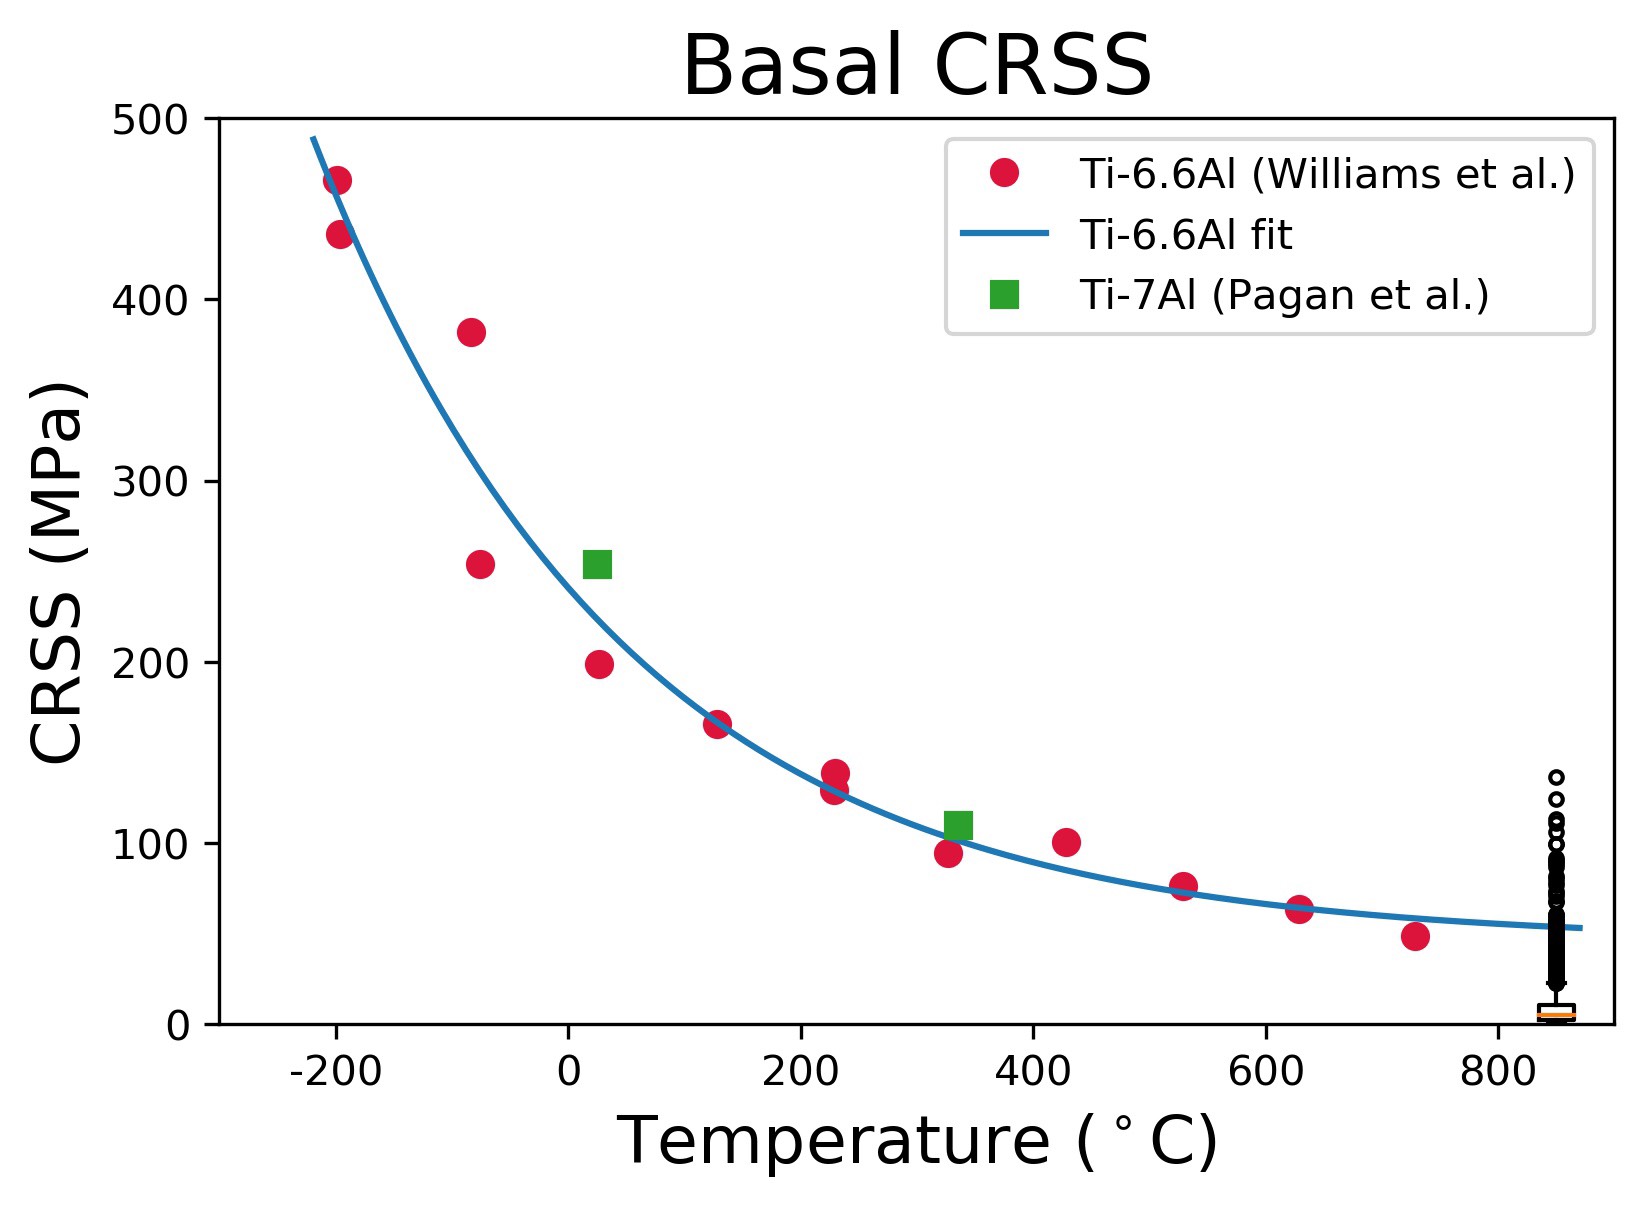
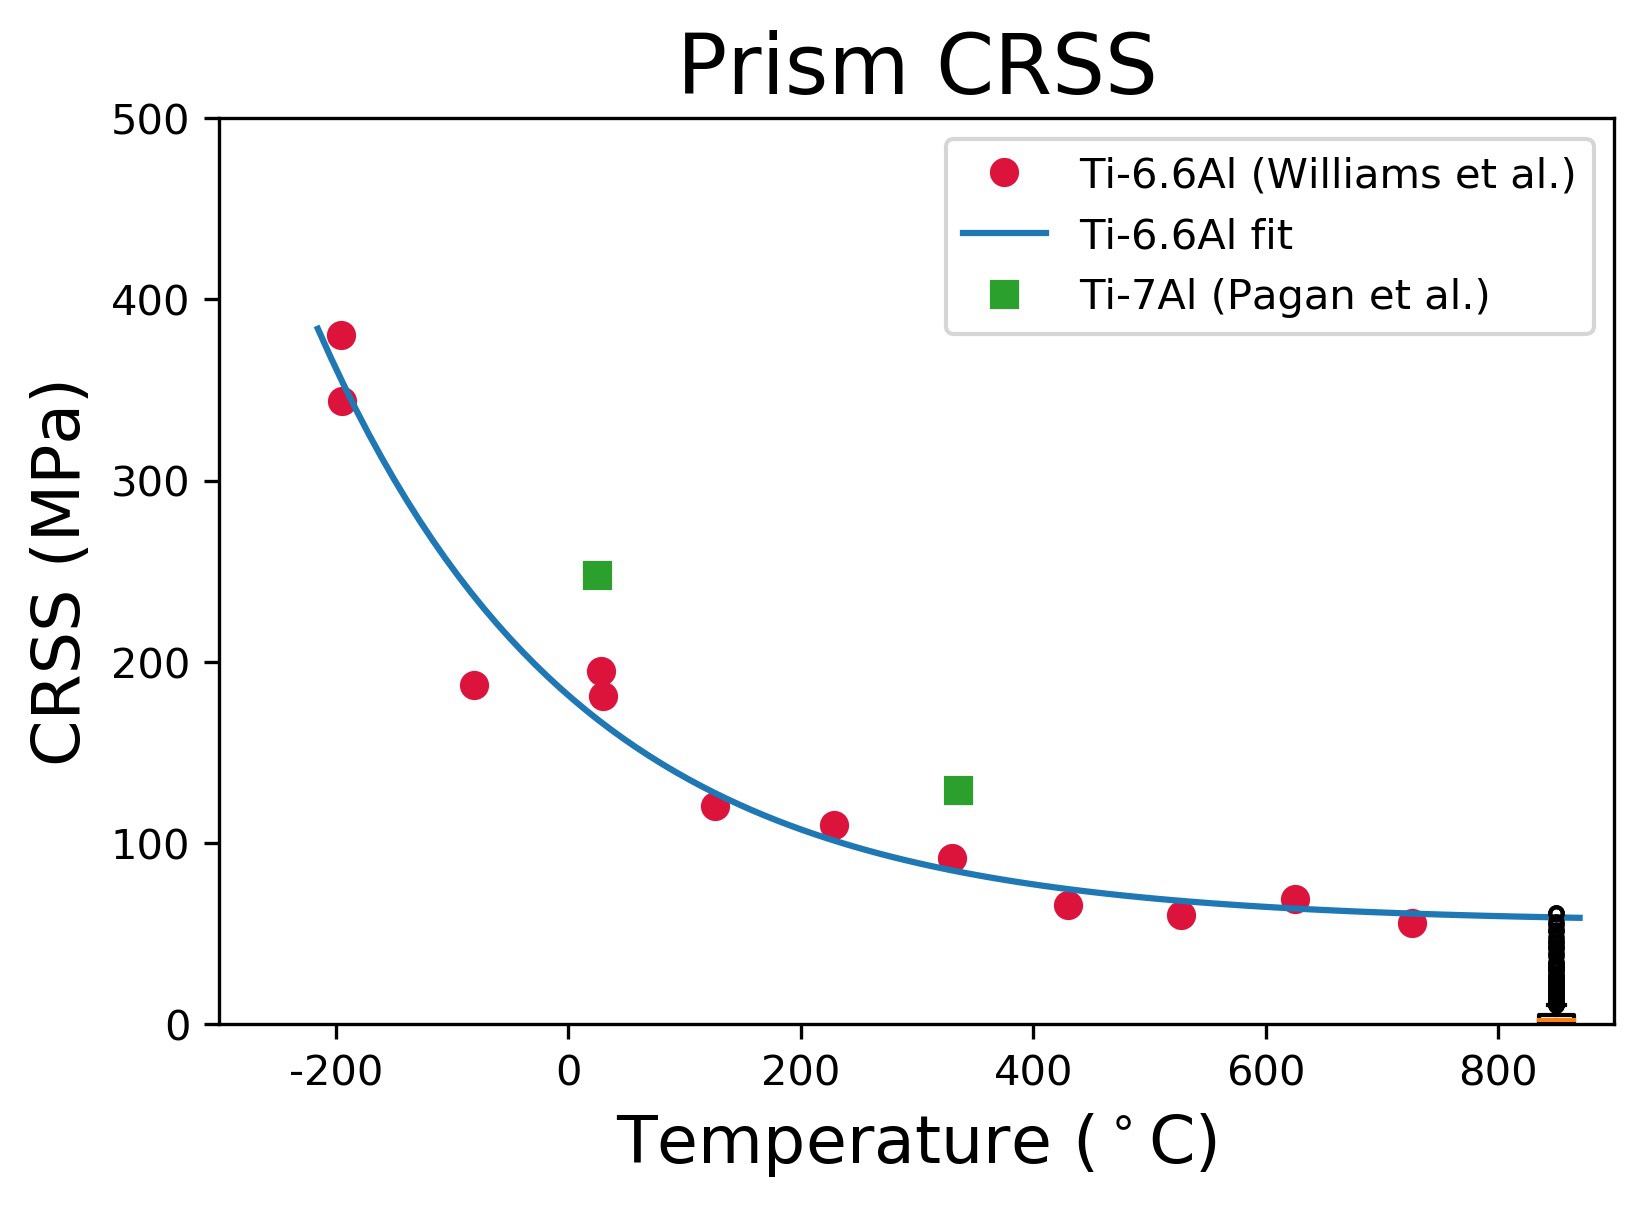
However, what is relevant here is whether the RSS values exceed their associated CRSS. Williams et al. [27] measured CRSS values for Ti-6.6Al prismatic and basal slip systems in compression. The values for Ti-7Al determined by Pagan et al. [22] at room temperature and at 355 C follow the trend line fit to the Ti-6.6Al data that shows an exponential decay in the slip system strength as a function of temperature. Figure 8b shows the measured CRSS values along with the exponential fit as well as a boxplot for RSS values at the highest temperature. In the case of the prismatic slip system, the RSS values do not significantly exceed the CRSS, but for the basal system, there are many grains in the upper tail whose basal RSS exceeds the CRSS indicating the possibility for slip to occur.
.
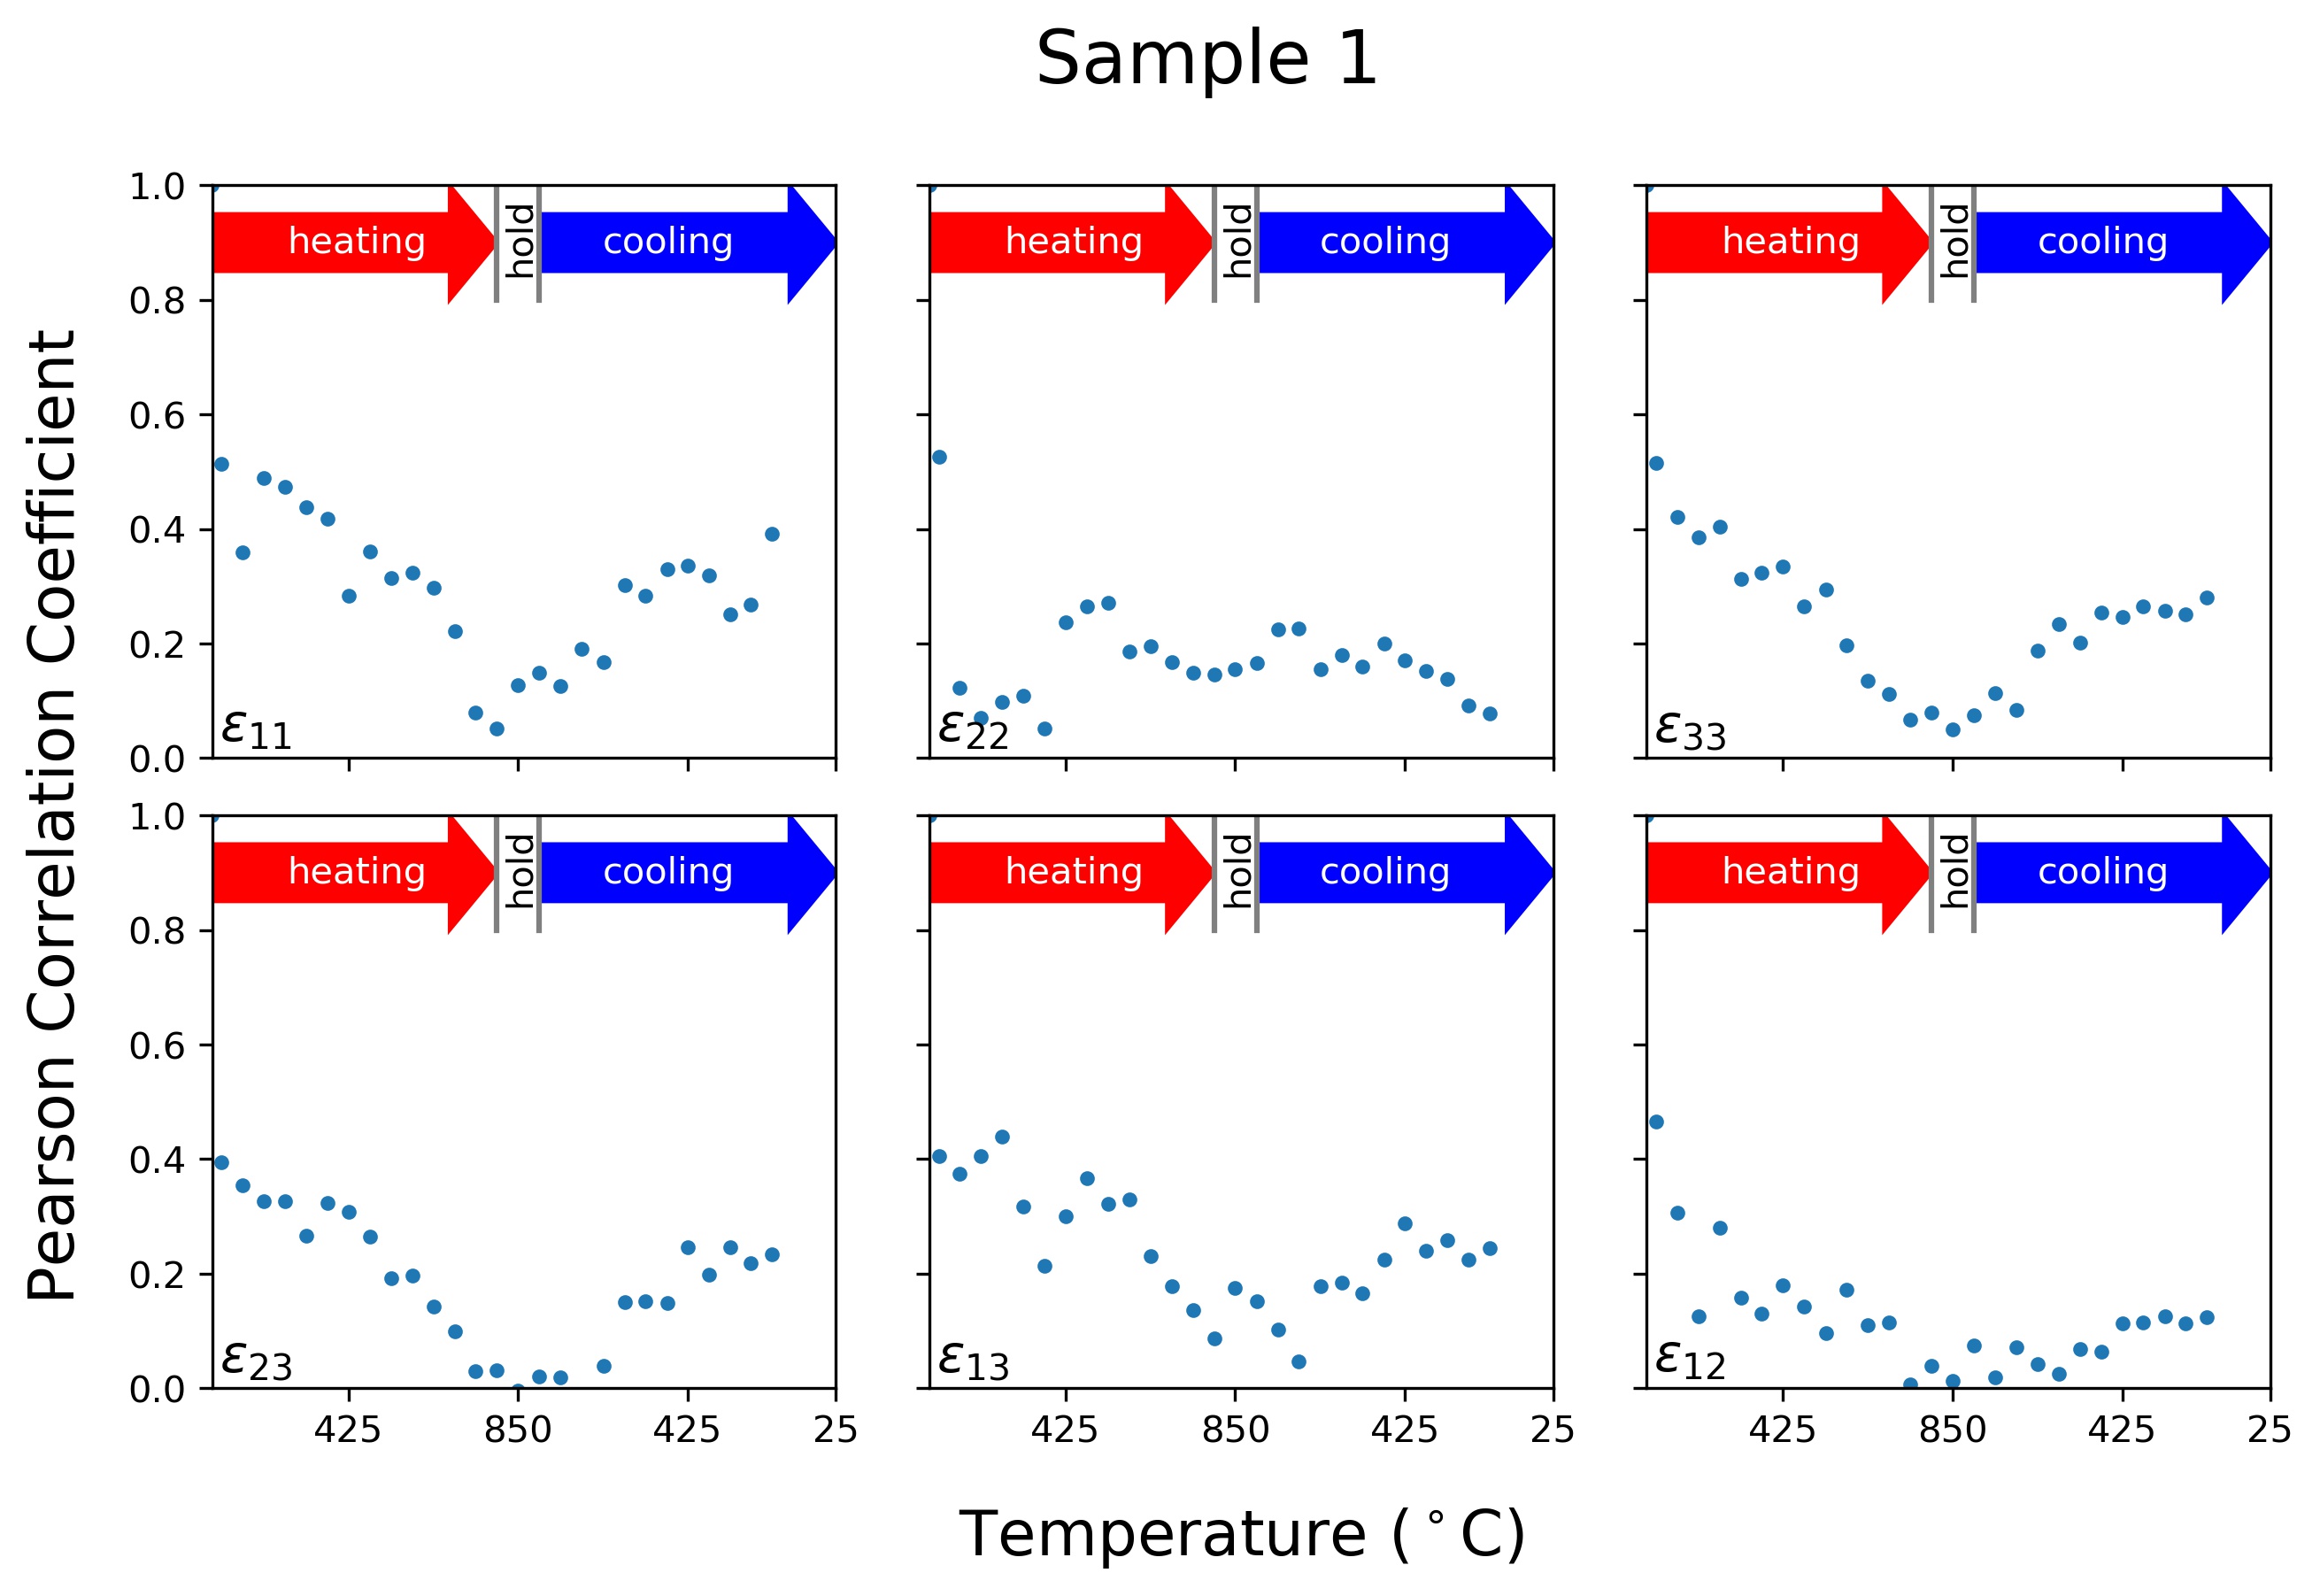
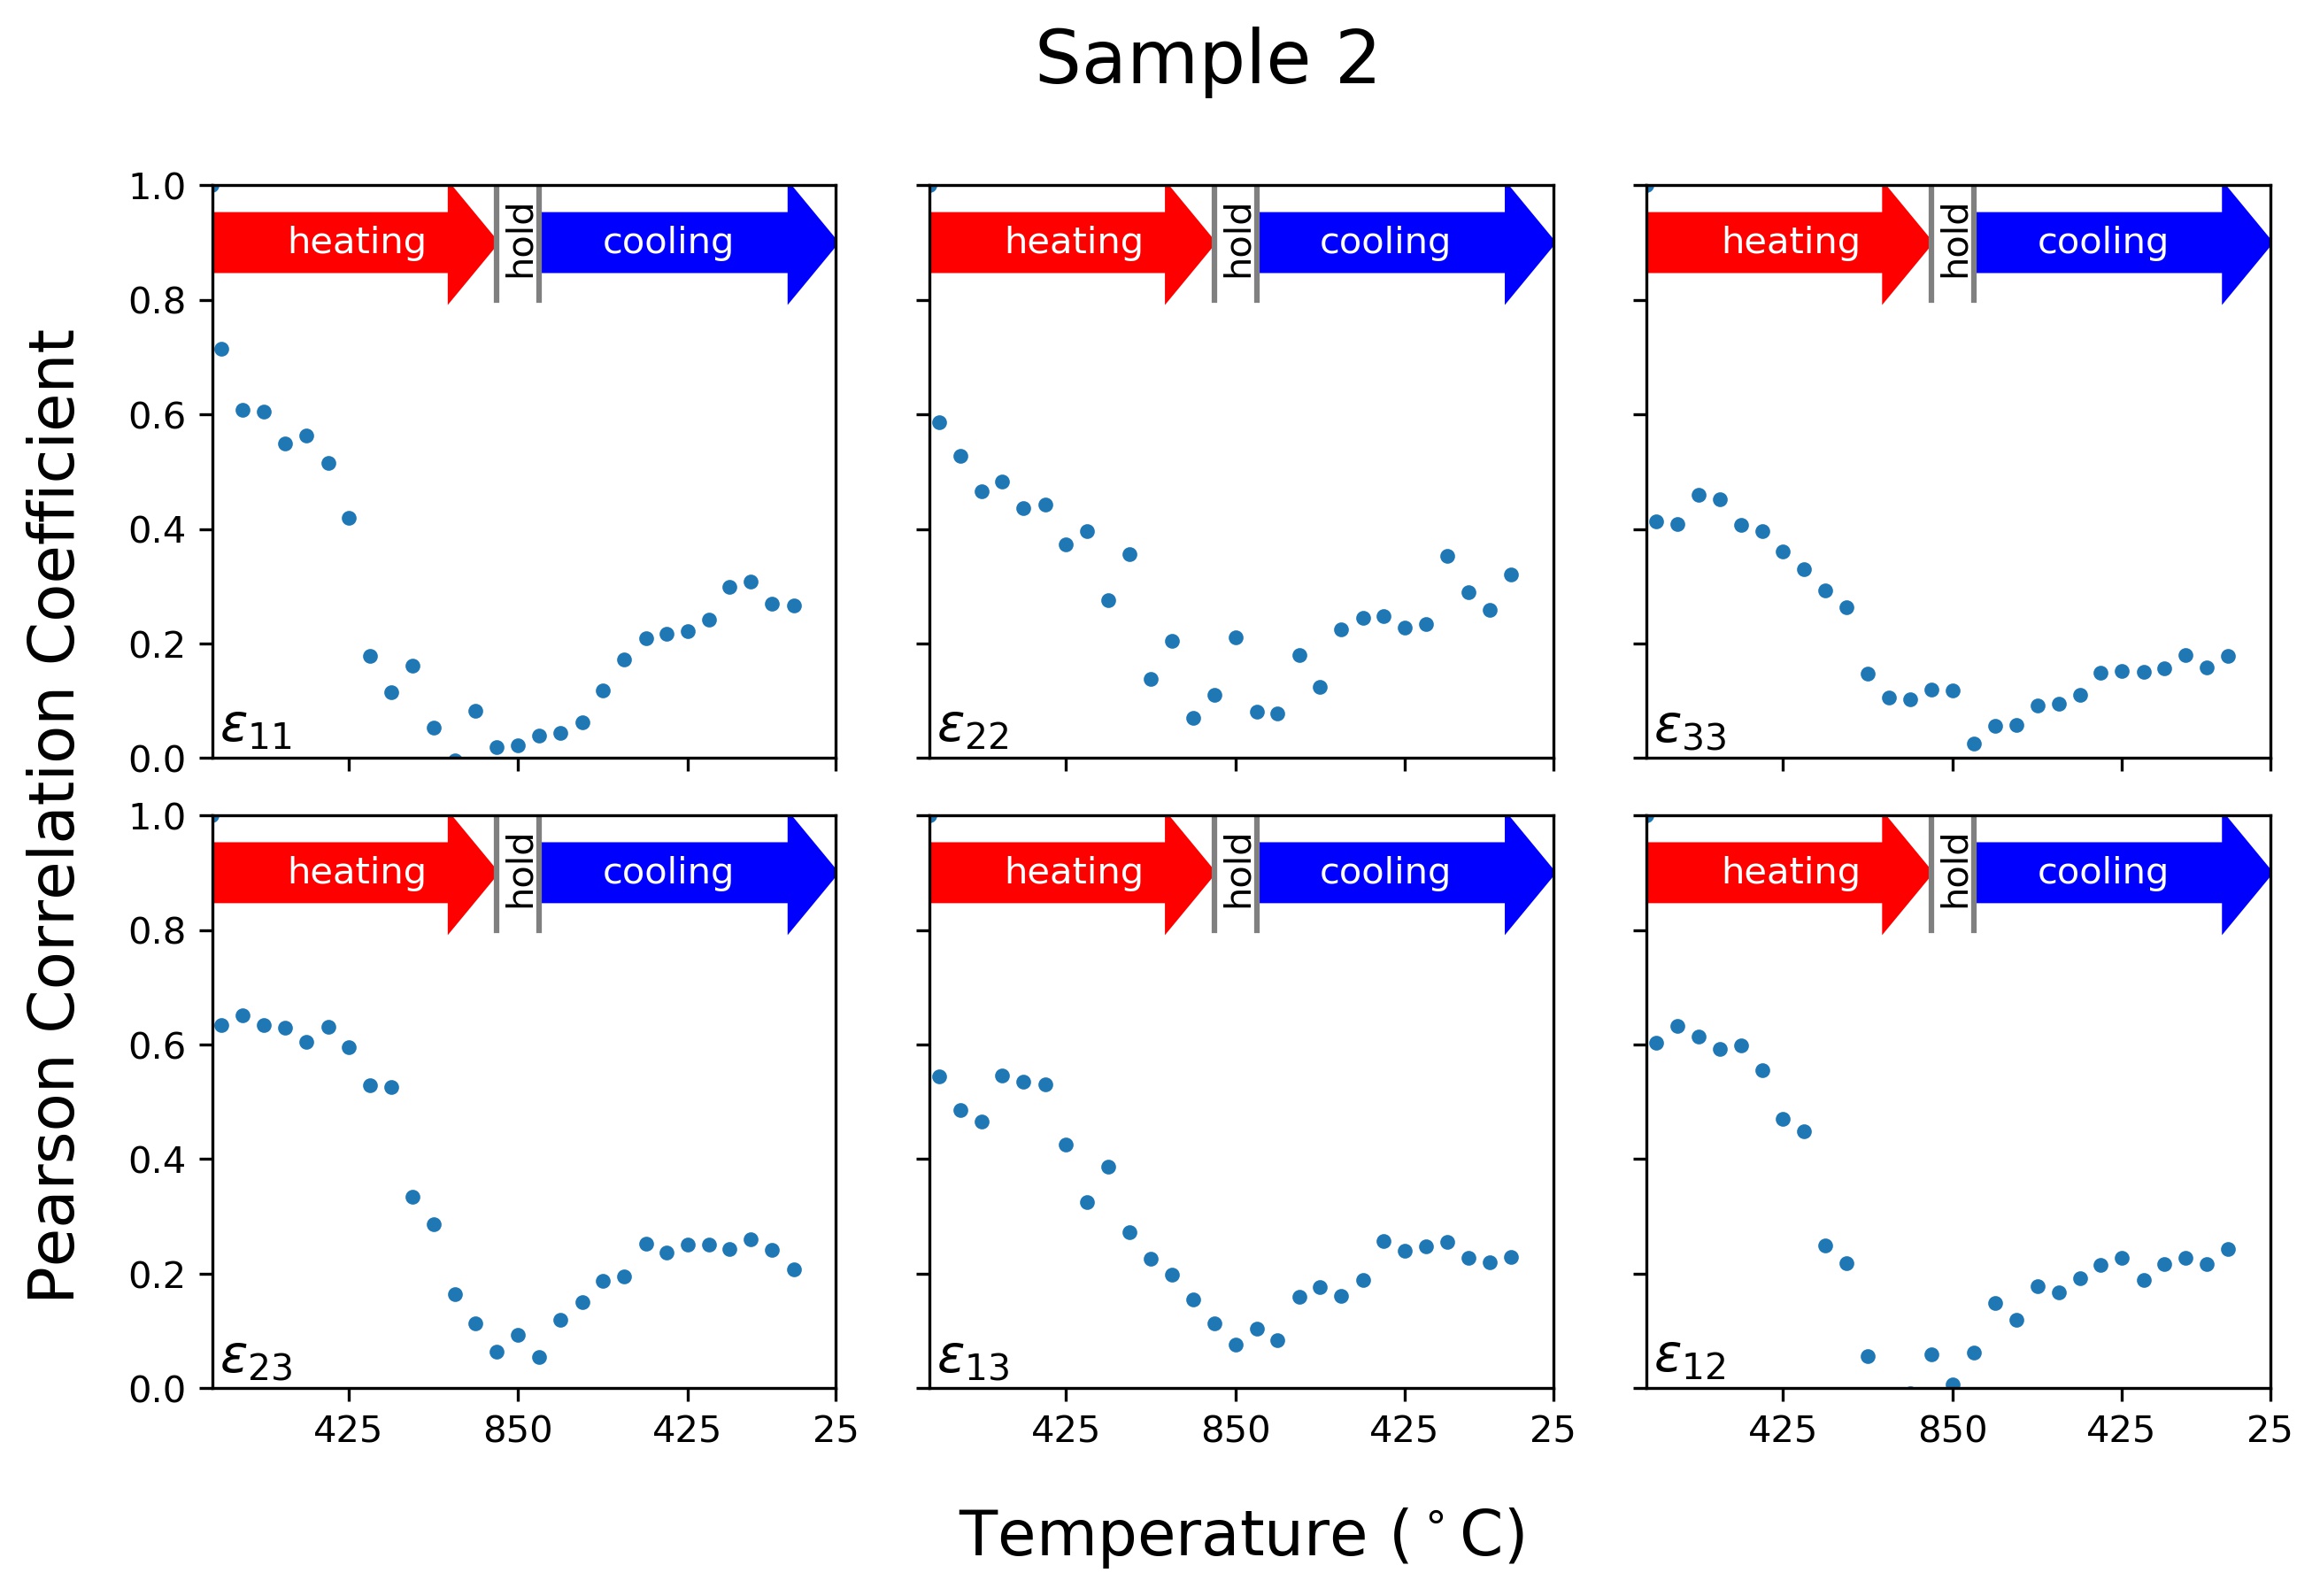
This is further supported by the change in the elastic strain state of each of the grains compared with their initial state shown in Figure 9. A correlation can be seen between the initial elastic strain and the elastic strain at the first thermal step at 62 C. By the time the temperature reaches 849 C, there is no obvious correlation. In order to quantify this loss of correlation with respect to temperature, a Pearson correlation coefficient was calculated at each temperature:
| (8) |
where is the standard deviation of and respectively, and is the covariance given by
| (9) |
where is the expected value of x. A Pearson correlation coeeficient value of one indicates complete correlation and a value of zero indicates no correlation
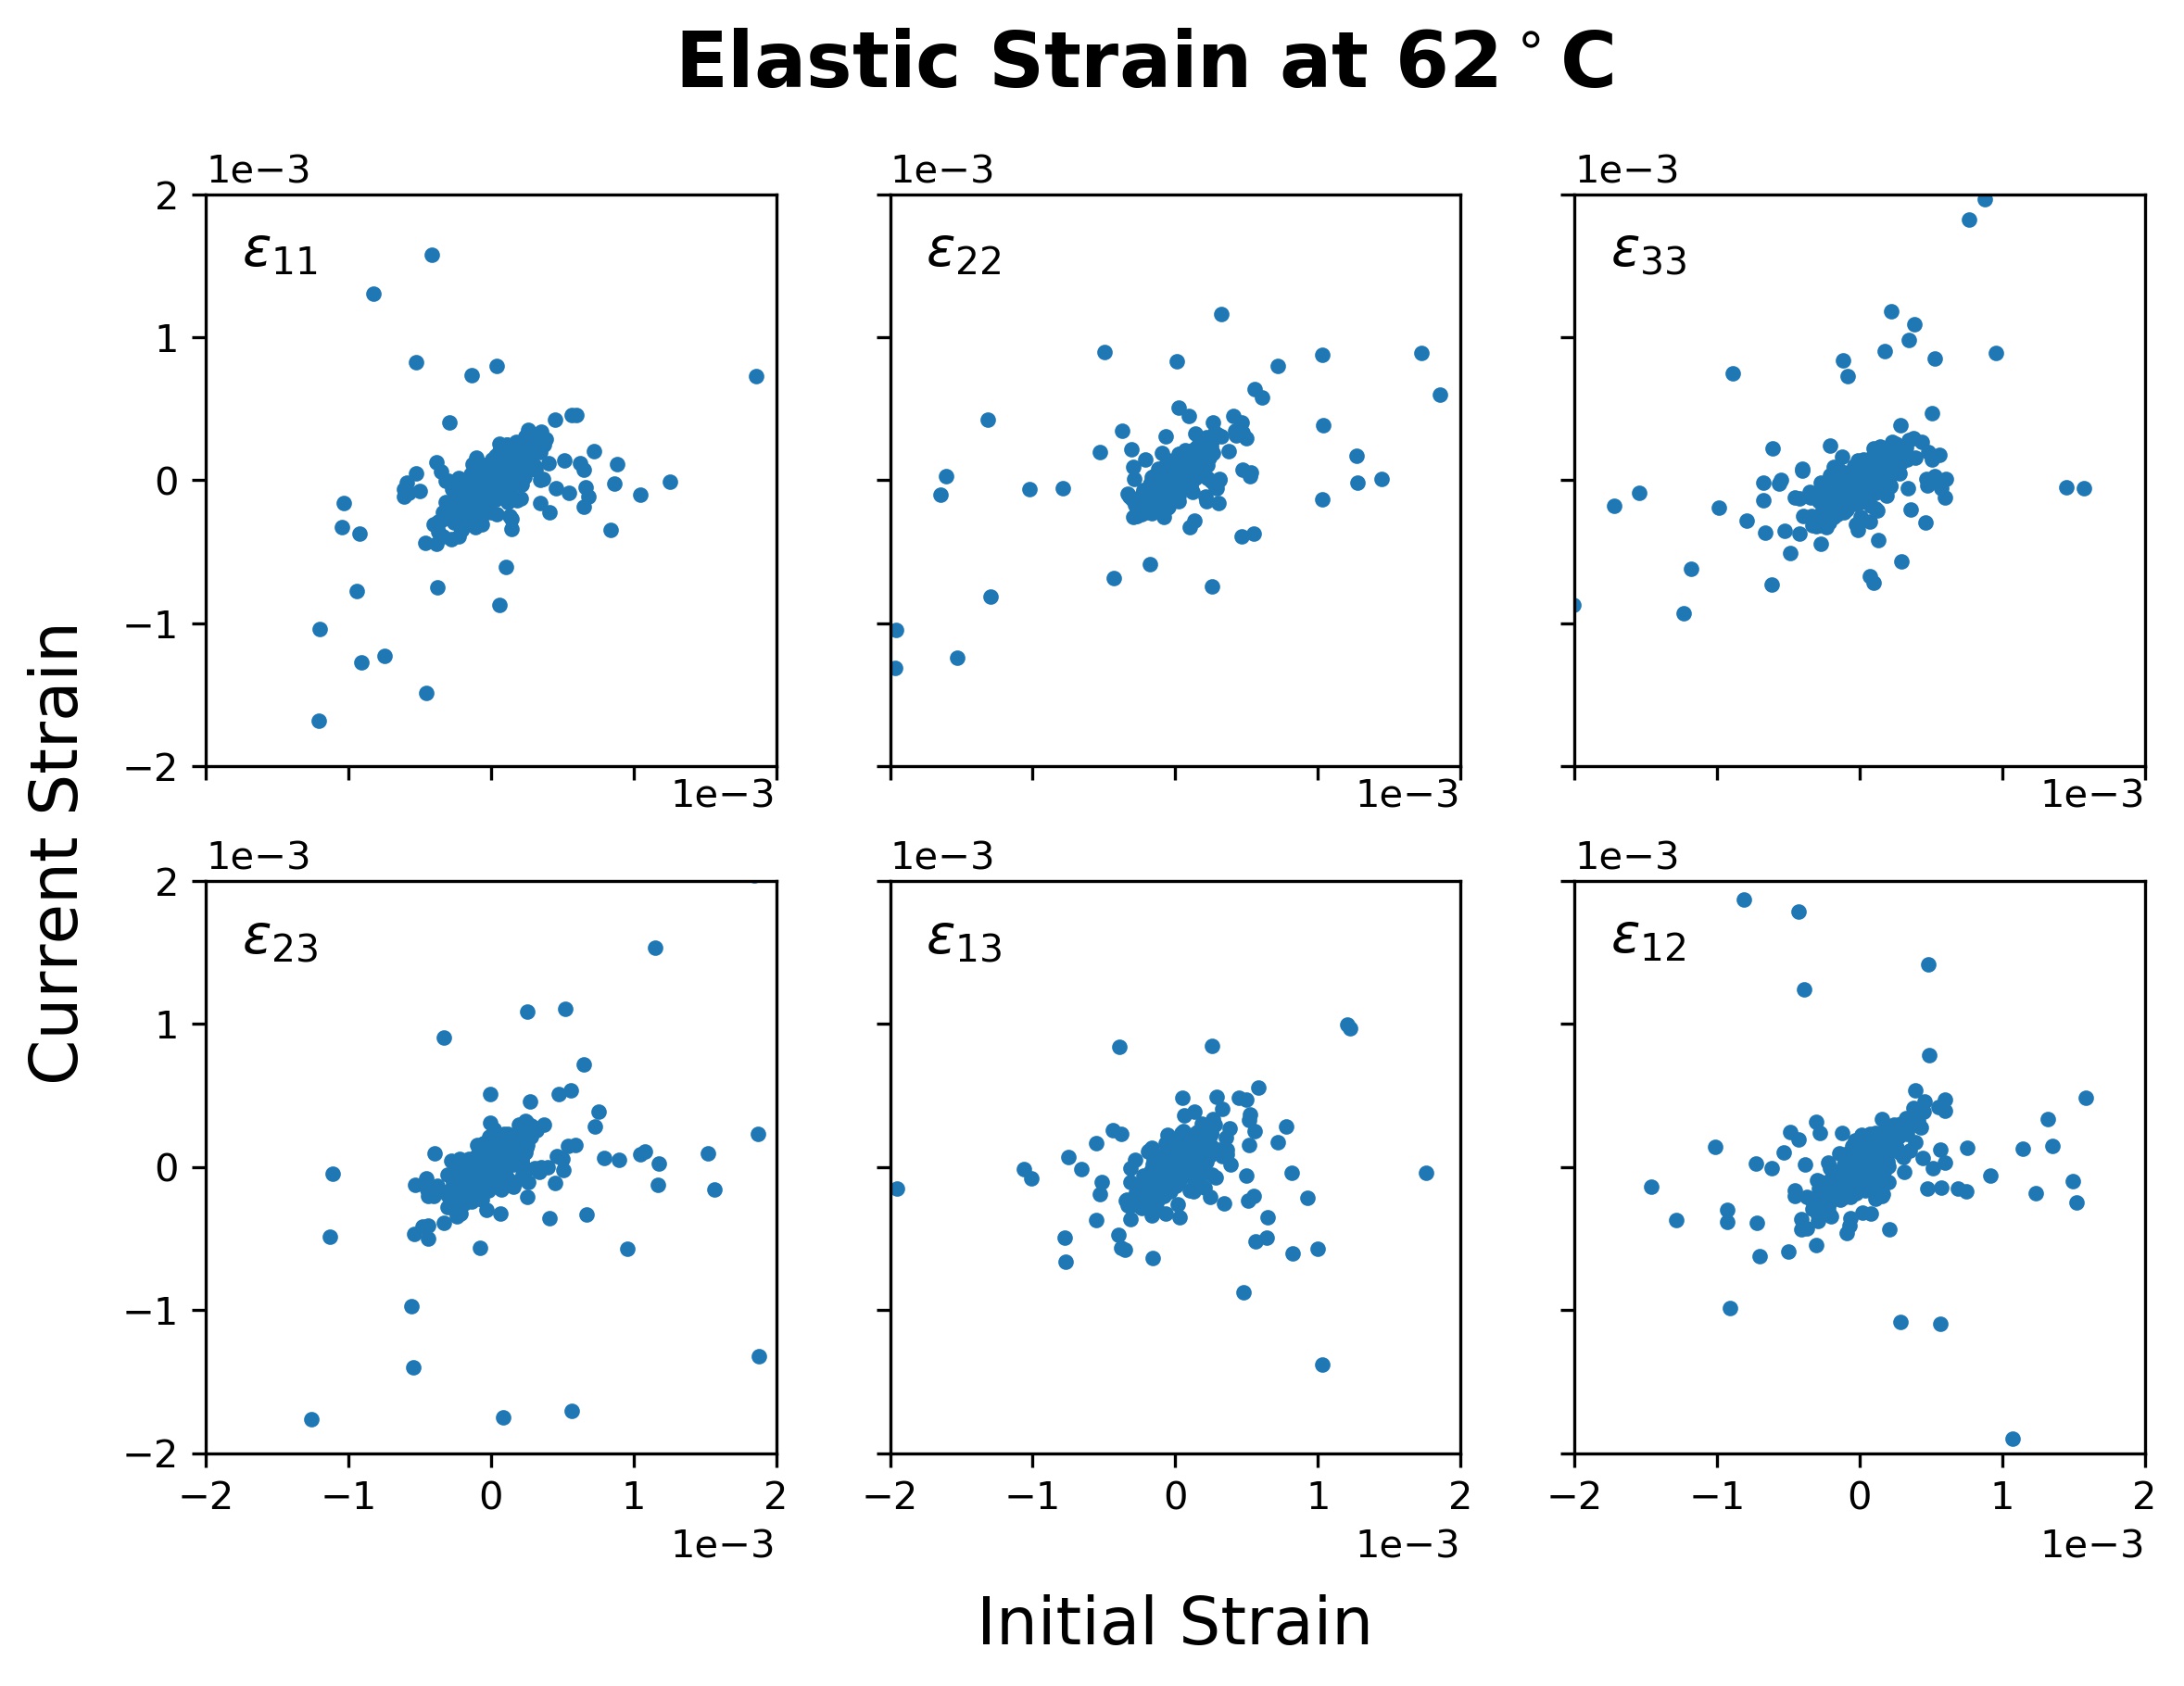
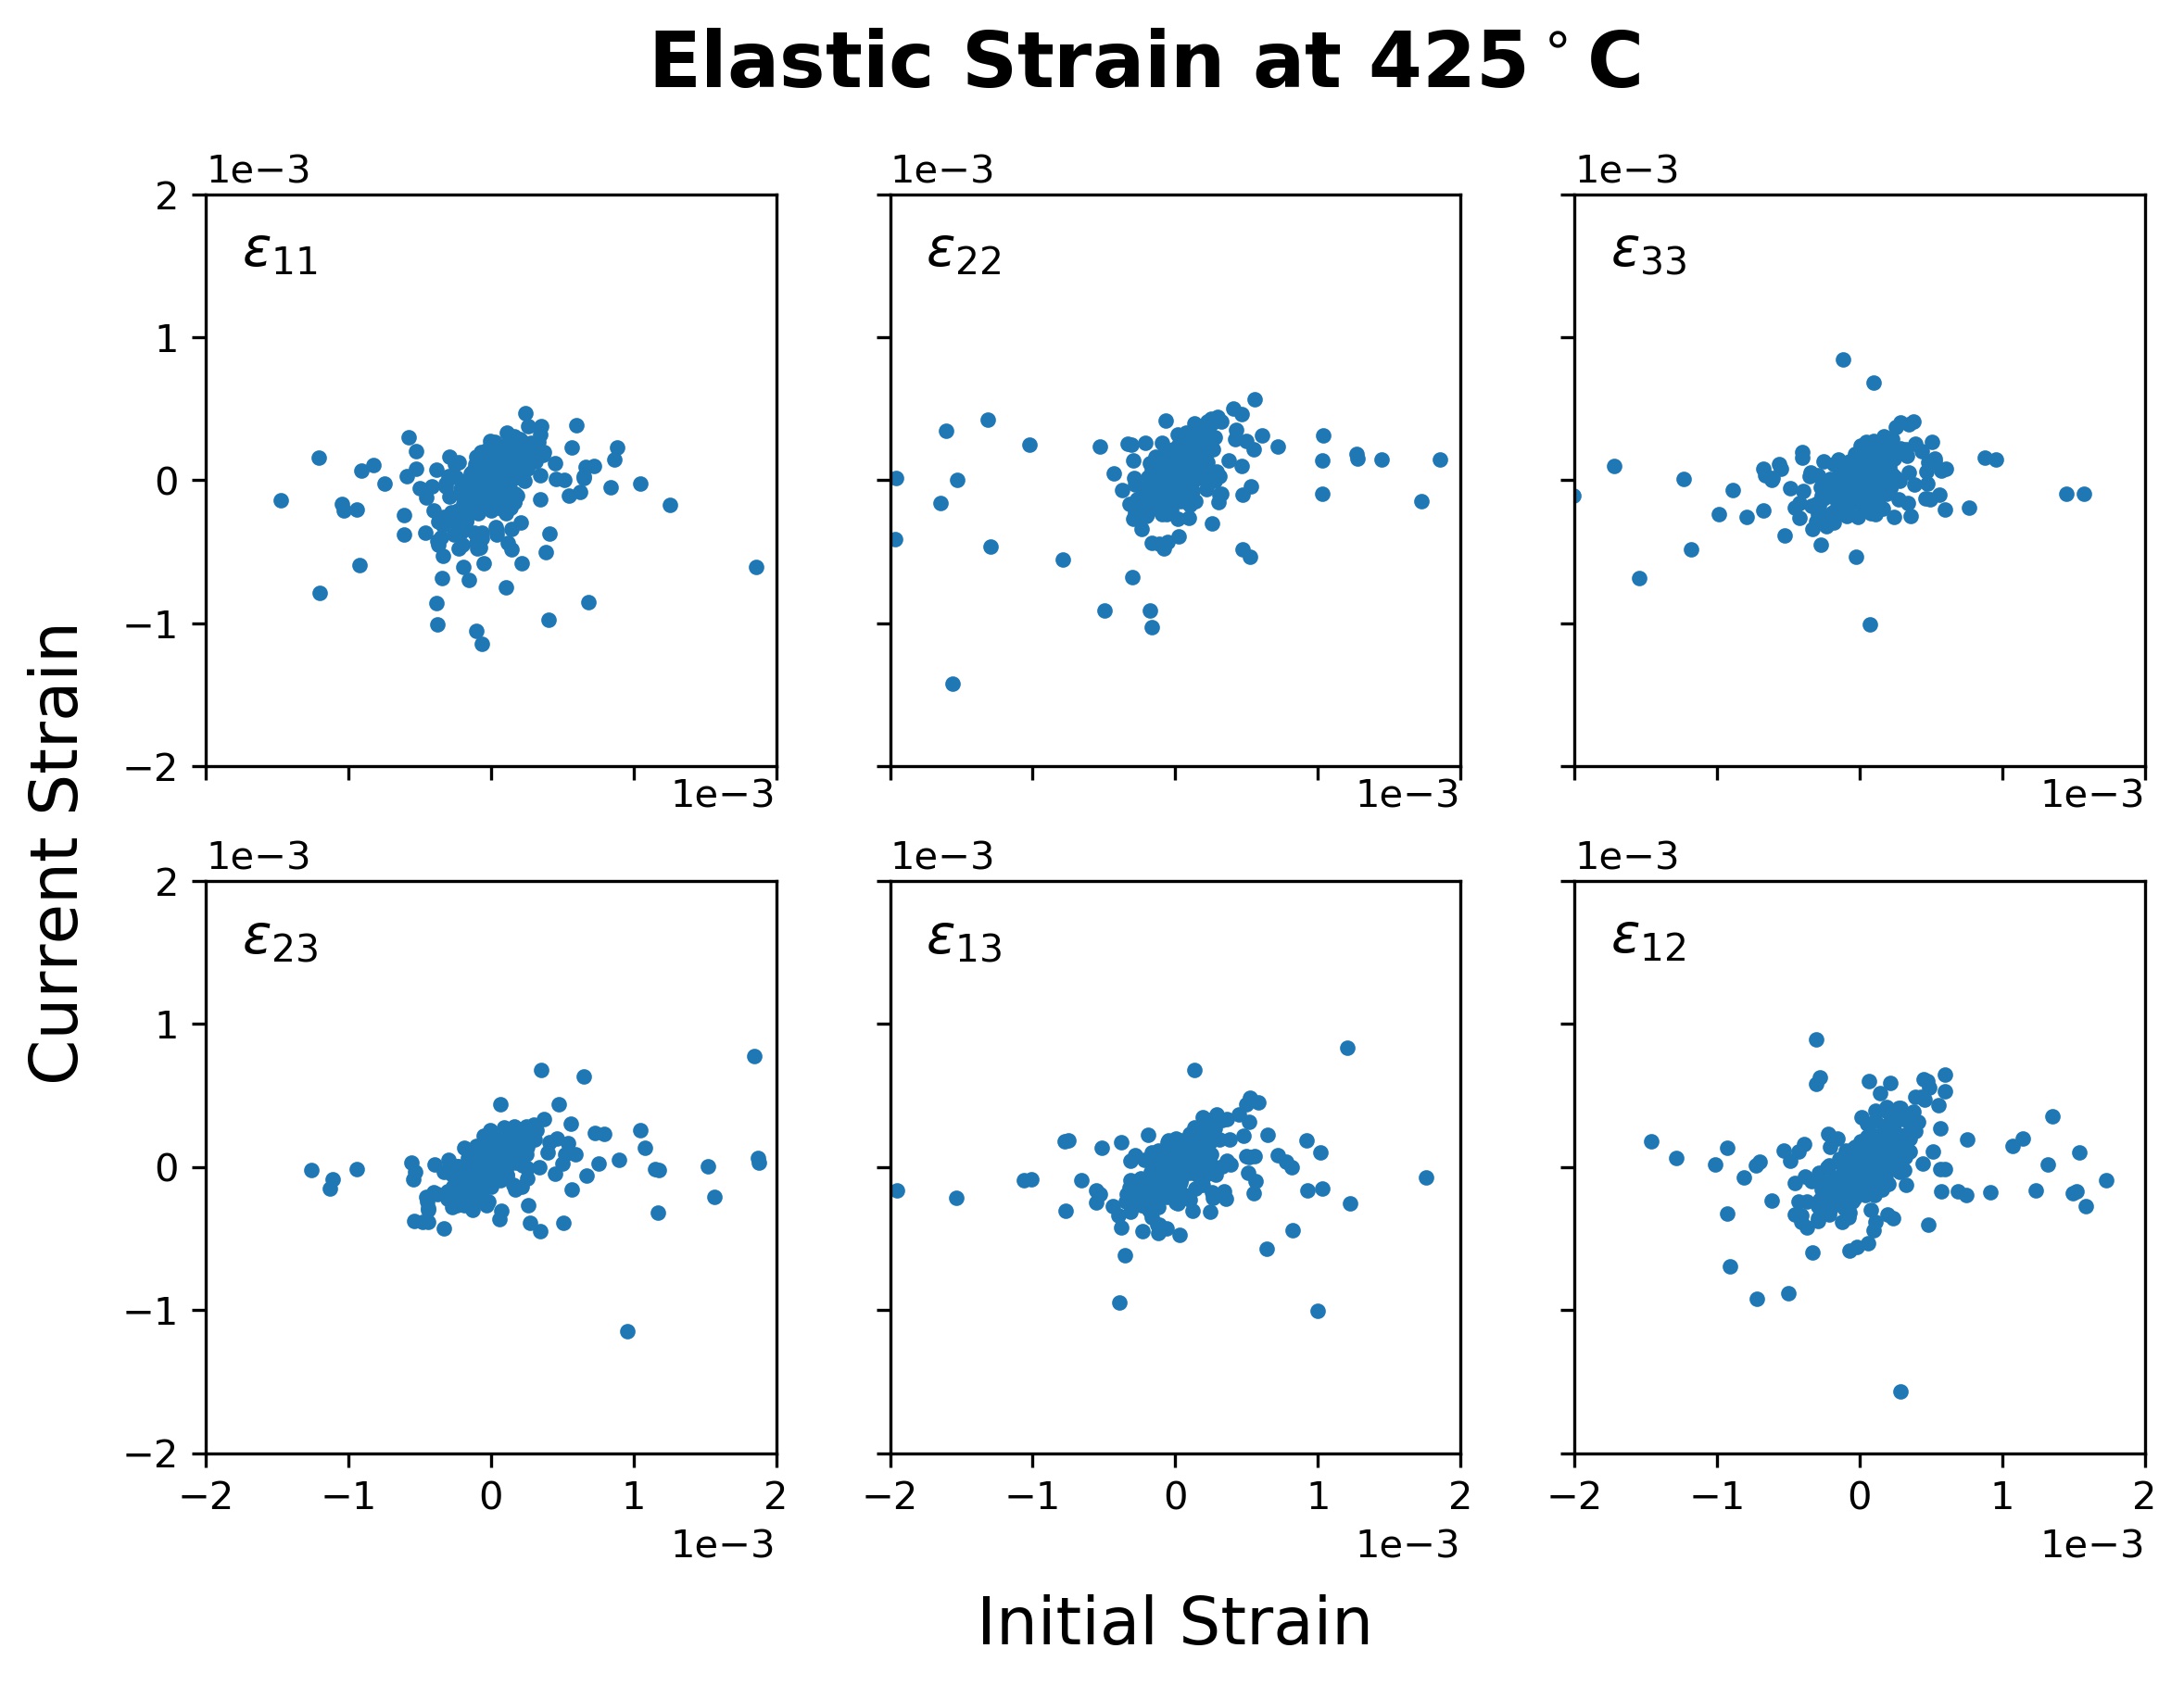
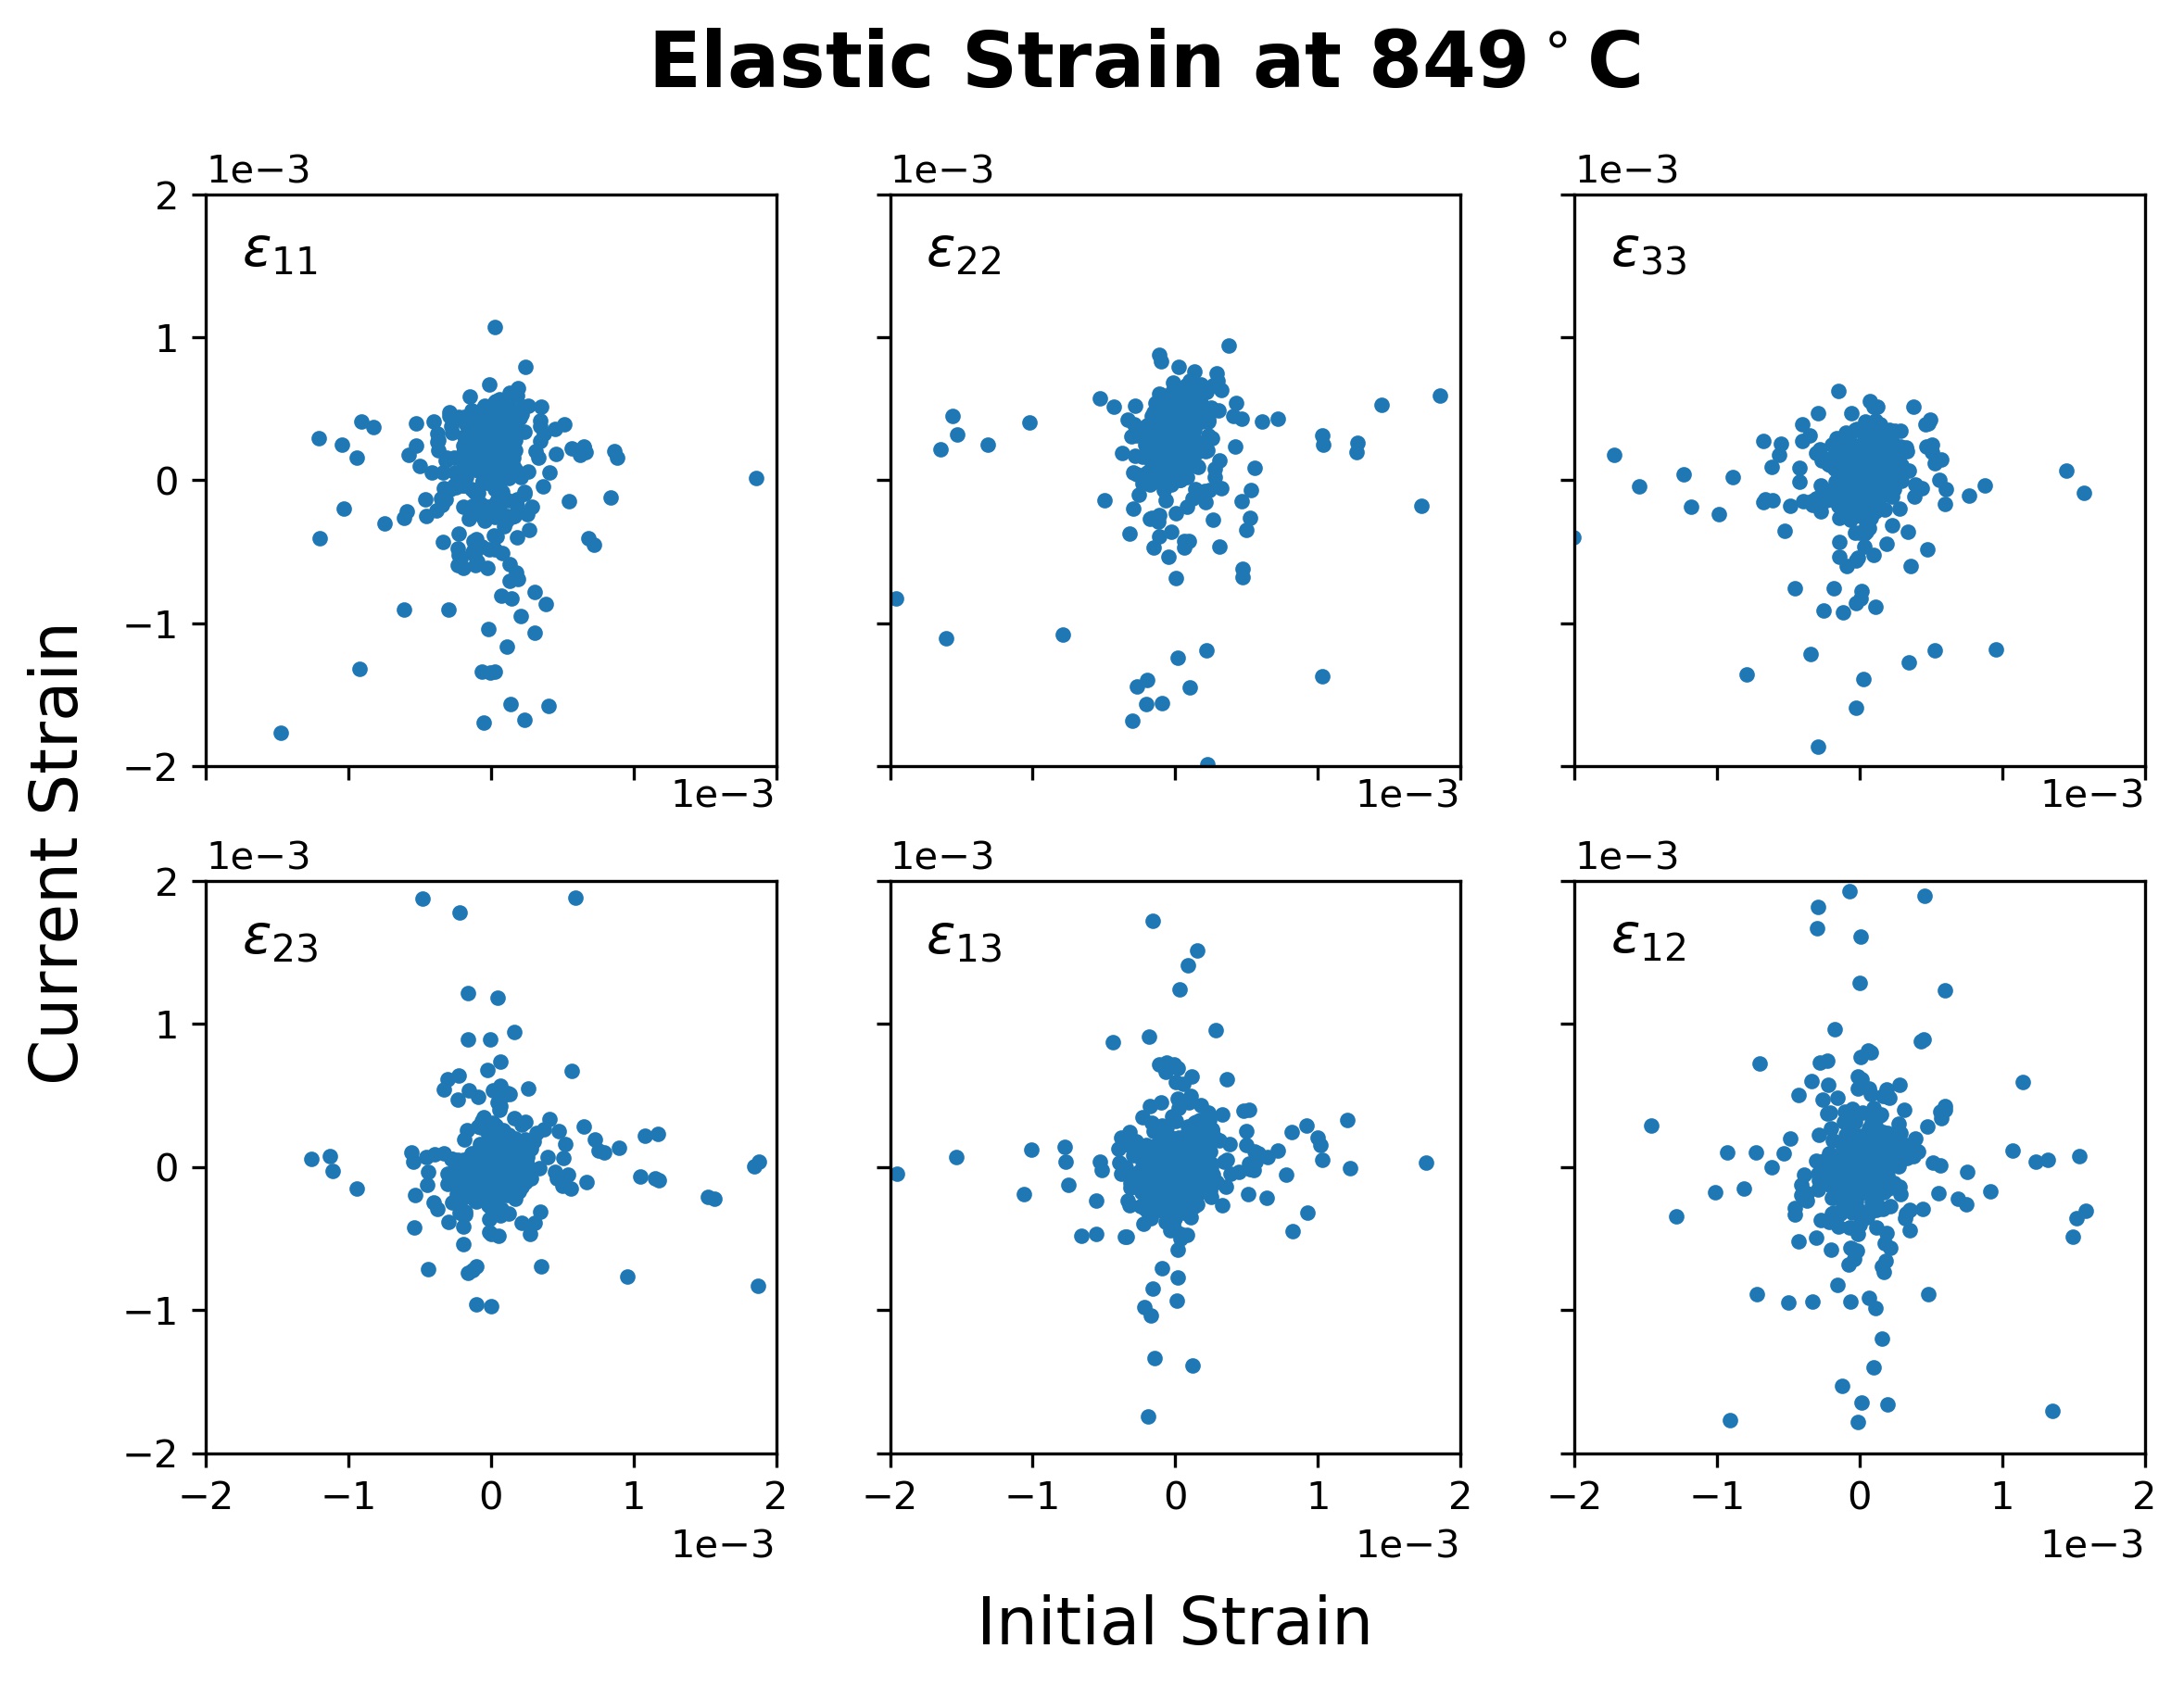
Figure 10 shows that the correlation according to the calculated Pearson correlation coefficient goes down as the temperature increases, reaching a minimum of about zero at the highest temperature, then the correlation increases again as the temperature drops. The strain values at the maximum temperature are effectively uncorrelated with the initial values, and yet a correlation is partially recovered upon cool-down, which indicates that the polycrystal retained some “memory” of its initial state, albeit with local changes. This indicates that the thermal cycle was not purely thermoelastic, signifying the occurrence of annealing during the thermal cycle. Additionally, the lack of correlation at high temperature is presumably caused by the anisotropic thermal expansion overpowering the initial elastic strain state.
6 Summary
In this work, ff-HEDM has been used to calculate the temperature dependent CTEs for hexagonal Ti-7Al with the result that the ratio of to changes from less than one to greater than one, resolving the discrepancies found for Ti thermal expansion data found in the literature. A sample dependent maximum was found to be between 500 and 650 C which can be attributed to the dissolution of the Ti3Al. Additionally, the ff-HEDM measurements allow us to calculated confidence bounds for the CTEs.
It was also found that the RSS values for the three a slip system families decrease as a function of temperature while the RSS values for the pyramidal c+a slip systems decreases until around 700 C when they start to increase. It is our understanding that the a slip system families are soft enough to allow slip to occur, but the pyramidal c+a is harder, so stress builds up on this slip system. Lastly, annealing was observed on the grain-scale during the thermal cycle as was indicated by the change in the grain-resolved elastic strain states.
Future work on this data will focus on modeling this experiment with both FE and FFT-based crystal plasticity methods. This will allow us to gain a better understanding of what is occurring on the grain-scale and further tune the CTEs from those calculated in this work. This data has shown that there is more happening on the mesoscale than originally expected, and understanding the anisotropy of thermal expansion is important for the accuracy of micromechanical modeling work.
Acknowledgements
The authors would like to thank Adam Pilchak for providing the Ti-7Al material. REL would like to thank Yu-Feng Shen, Ziheng (Dino) Wu, and Linghan Zhang for their help in data collection and Benjamin Hulbert, David Dye, and Jerard Gordon for helpful discussions. This work is based upon research conducted at the Cornell High Energy Synchrotron Source (CHESS) which is supported by the National Science Foundation and the National Institutes of Health/National Institute of General Medical Sciences under NSF award DMR-1332208. The work is funded by the Air Force Office of Scientific Research under grant FA9550-16-1-0105.
Appendix A Powder Diffraction
The ff-HEDM images were summed over the range to create a representative powder pattern. This was treated as a typical powder diffraction pattern, and the lattice parameters were extracted. The lattice parameters calculated using this method, and those from the aforementioned ff-HEDM method were in good agreement.
Appendix B Calculating Resolved Shear Stresses
When metals are placed under small loads, they deform non-permanently, or elastically, in such a way that the stress and strain are linearly proportional. In an anisotropic single crystal, this relationship can be calculated through the tensorial relationship
| (10) |
where is the 3-D stress tensor, is the 3-D strain tensor, and is the material specific elastic stiffness tensor which is a function of temperature (Table 2). When the load is released, the material returns to its original state.
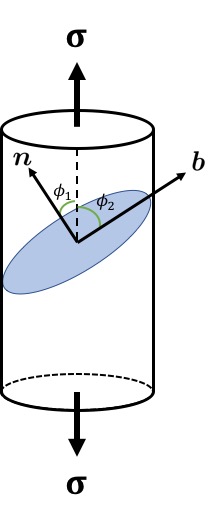
The stress tensor can be projected onto each slip system to calculate the resolved shear stress (RSS) using , where is the unit vector for the slip direction and is the unit vectors for the slip plane (Fig. 12). Deformation occurs when the RSS reaches the critical resolved shear stress (CRSS), and the material yields.
| Temp. (C) | |||||
|---|---|---|---|---|---|
| 25 | 162.4 | 180.7 | 46.7 | 69.0 | 92.0 |
| 50 | 160.9 | 179.5 | 46.2 | 69.1 | 92.5 |
| 100 | 157.9 | 177.4 | 45.3 | 69.4 | 93.4 |
| 150 | 155.1 | 175.3 | 44.4 | 69.5 | 94.3 |
| 200 | 152.2 | 173.4 | 43.4 | 69.5 | 95.2 |
| 250 | 149.5 | 171.5 | 42.4 | 69.2 | 96.1 |
| 300 | 146.8 | 169.6 | 41.4 | 69.2 | 96.7 |
| 350 | 144.2 | 167.8 | 40.3 | 69.1 | 97.3 |
| 400 | 141.6 | 166.1 | 39.2 | 69.0 | 97.8 |
| 450 | 139.2 | 164.4 | 38.1 | 69.2 | 98.3 |
| 500 | 136.8 | 162.7 | 37.0 | 68.8 | 98.5 |
| 550 | 134.5 | 161.0 | 35.9 | 68.8 | 98.8 |
| 600 | 132.2 | 159.3 | 34.8 | 68.8 | 99.1 |
| 650 | 129.9 | 157.6 | 33.7 | 68.8 | 99.2 |
| 700 | 127.6 | 156.0 | 32.6 | 99.3 | |
| 750 | 125.3 | 154.5 | 31.6 | 99.4 | |
| 800 | 123.1 | 152.9 | 30.7 | 99.6 |
References
- [1] W. Boas, Honeycombe R.W.K, Thermal Fatigue of Metals, Nature 153 (3886) (1944) 494–495.
- [2] P. Kesavan Nair, R. Vasudevan, Residual stresses of types II and III and their estimation, Sadhana 20 (1) (1995) 39–52.
- [3] J. L. Warwick, J. Coakley, S. L. Raghunathan, R. J. Talling, D. Dye, Effect of texture on load partitioning in Ti-6Al-4V, Acta Materialia 60 (10) (2012) 4117–4127.
- [4] Z. Zheng, P. Eisenlohr, T. R. Bieler, D. C. Pagan, F. P. E. Dunne, Heterogeneous Internal Strain Evolution in Commercial Purity Titanium Due to Anisotropic Coefficients of Thermal Expansion, JOM.
- [5] R. R. Pawar, V. T. Deshpande, The anisotropy of the thermal expansion of a-titanium, Acta Crystallographica 24 (1968) 316–317.
- [6] H.-D. Erfling, Studien zur thermischen ausdehnung fester stoffe in tiefer temperatur. iii (Ca, Nb, Th, V, Si, Ti, Zr), Annalen der Physik 433 (6) (1942) 467–475.
- [7] E. S. Greiner, W. C. Ellis, Thermal and Electrical Properties of Ductile Titanium, Transactions of the American Institute of Mining and Metallurgical Engineers 185 (5) (1949) 335–336.
- [8] C. J. McHargue, J. P. Hammond, Deformation Mechanisms in Titanium at Elevated Temperatures, Acta Metallurgica 1 (6) (1953) 700–701, 703–705.
- [9] R. Berry, G. Raynor, A note on the lattice spacings of titanium at elevated temperatures, Research 6 (1953) 21s–23s.
- [10] J. Spreadborough, J. W. Christian, The measurement of the lattice expansions and Debye temperatures of titanium and silver by x-ray methods, Proc. Phys. Soc 74 (1959) 609–615.
- [11] W. T. Roberts, Preferred orientation and anisotropy in titanium, Journal of The Less-Common Metals 4 (1962) 345–361.
- [12] R. H. Willens, Vacuum x-ray diffractometer for high temperature studies of metals sensitive to contamination by oxygen and nitrogen, Review of Scientific Instruments 33 (1962) 1069–1076.
- [13] Y. Touloukian, R. Kirby, R. Taylor, P. Desai, Thermophysical properties of matter–the tprc data series. volume 12. thermal expansion metallic elements and alloys, Tech. rep., Thermophysical and Electronic Properties Information Analysis Center … (1975).
- [14] ASM International, Thermal Properties of Metals, ASM Ready Reference (2002) 5–7.
- [15] J. Boab, R. W. K. Honeycombe, Thermal Fatigue of Metals, Nature 153 (3886) (1944) 494.
- [16] A. M. Russell, B. A. Cook, Coefficient of thermal expansion anisotropy and texture effects in ultra-thin titanium sheet, Scripta Materialia 37 (1997) 1461–1467.
- [17] U. Lienert, M. C. Brandes, J. V. Bernier, J. Weiss, S. D. Shastri, M. J. Mills, M. P. Miller, In situ single-grain peak profile measurements on Ti – 7Al during tensile deformation, Materials Science and Engineering A 524 (2009) 46–54.
- [18] J. C. Schuren, P. A. Shade, J. V. Bernier, S. F. Li, B. Blank, J. Lind, P. Kenesei, U. Lienert, R. M. Suter, T. J. Turner, D. M. Dimiduk, J. Almer, New opportunities for quantitative tracking of polycrystal responses in three dimensions, Current Opinion in Solid State and Materials Science 19 (2015) 235–244.
- [19] K. Chatterjee, A. Venkataraman, T. Garbaciak, J. Rotella, M. D. Sangid, A. J. Beaudoin, P. Kenesei, J. S. Park, A. L. Pilchak, Study of grain-level deformation and residual stresses in Ti-7Al under combined bending and tension using high energy diffraction microscopy (HEDM), International Journal of Solids and Structures 94-95 (2015) 35–49.
- [20] T. J. Turner, P. A. Shade, J. V. Bernier, S. F. Li, J. C. Schuren, P. Kenesei, R. M. Suter, J. Almer, Crystal plasticity model validation using combined high-energy diffraction microscopy data for a Ti-7Al specimen, Metallurgical and Materials Transactions A 48 (2017) 627–647.
- [21] D. C. Pagan, P. A. Shade, N. R. Barton, J. S. Park, P. Kenesei, D. B. Menasche, J. V. Bernier, Modeling slip system strength evolution in Ti-7Al informed by in-situ grain stress measurements, Acta Materialia 128 (2017) 406–417.
- [22] D. C. Pagan, J. V. Bernier, D. Dale, J. P. Ko, T. J. Turner, B. Blank, P. A. Shade, Measuring Ti-7Al slip system strengths at elevated temperature using high-energy X-ray diffraction, Scripta Materialia 142 (2018) 96–100.
- [23] K. E. Nygren, D. C. Pagan, M. P. Miller, Sub-grain orientation resolution during continuous loading using only far-field HEDM, IOP Conference Series: Materials Science and Engineering 580 (1).
- [24] K. E. Nygren, D. C. Pagan, J. V. Bernier, M. P. Miller, An algorithm for resolving intragranular orientation fields using coupled far-field and near-field high energy x-ray diffraction microscopy, Materials Characterization (2020) 110366.
- [25] G. Lutjering, J. C. Williams, Titanium, 2nd Edition, Springer-Verlag, 2007.
- [26] X. Tan, H. Gu, C. Laird, N. D. H. Munroe, Cyclic deformation behavior of high-purity titanium single crystals: Part I. Orientation dependence of stress-strain response, Metallurgical and Materials Transactions A 29 (1998) 507–512.
- [27] J. C. Williams, R. G. Baggerly, N. E. Paton, Deformation behavior of hcp Ti-Al alloy single crystals, Metallurgical and Materials Transactions A 33 (2002) 837–850.
- [28] J. C. Williams, M. J. Blackburn, The identification of a non-basal slip vector in titanium and titanium-aluminum alloys, Physica Status Solidi 25 (1968) K1–K3.
- [29] A. Van de Walle, M. Asta, First-principles investigation of perfect and diffuse antiphase boundaries in HCP based Ti-Al alloys, Metallurgical and Materials Transactions A 33 (2002) 735–741.
- [30] A. Venkataraman, P. A. Shade, R. Adebisi, S. Sathish, A. L. Pilchak, G. B. Viswanathan, M. C. Brandes, M. J. Mills, M. D. Sangid, Study of structure and deformation pathways in Ti-7Al using atomistic simulations, experiments, and characterization, Metallurgical and Materials Transactions A 48 (2017) 2222–2236.
- [31] H. M. Gardner, A. Radecka, D. Rugg, D. E. J. Armstrong, M. P. Moody, P. A. J. Bagot, A study of the interaction of oxygen with the 2 phase in the model alloy Ti – 7wt % Al, Scripta Materialia 185 (2020) 111–116.
- [32] A. Fitzner, J. Quinta da Fonseca, J. Kelleher, M. Pascal, D. G. L. Prakash, M. Thomas, S.-Y. Zhang, M. Preuss, The effect of aluminium on twin activity in binary -Ti, Acta Materialia 103 (2016) 341–351.
- [33] T. Neeraj, M. J. Mills, Short-range order (SRO) and its effect on the primary creep behavior of a Ti - 6wt.% Al alloy, Materials Science & Engineering A 321 (2001) 415–419.
- [34] J. V. Bernier, N. R. Barton, U. Lienert, M. P. Miller, Far-field high-energy diffraction microscopy: a tool for intergranular orientation and strain analysis, The Journal of Strain Analysis for Engineering Design 46 (2011) 527–547.
- [35] J. Oddershede, S. Schmidt, H. F. Poulsen, H. O. Sørensen, J. Wright, W. Reimers, Determining grain resolved stresses in polycrystalline materials using three-dimensional X-ray diffraction, Journal of Applied Crystallography 43 (2010) 539–549.
- [36] J. Bernier, R. Suter, A. D. Rollett, J. Almer, High energy diffraction microscopy in materials science, Annual Reviews in Materials Research.
- [37] A. L. Pilchak, Fatigue crack growth rates in alpha titanium: faceted vs. striation growth, Scripta Materialia 68 (2013) 277–280.
- [38] P. A. Shade, B. Blank, J. C. Schuren, T. J. Turner, P. Kenesei, K. Goetze, R. M. Suter, J. V. Bernier, S. F. Li, J. Lind, U. Lienert, J. Almer, A rotational and axial motion system load frame insert for in situ high energy x-ray studies, Review of Scientific Instruments 86 (2015) 093902.
- [39] V. Tari, R. A. Lebensohn, R. Pokharel, T. J. Turner, P. A. Shade, J. V. Bernier, A. D. Rollett, Validation of micro-mechanical FFT-based simulations using High Energy Diffraction Microscopy on Ti-7Al, Acta Materialia 154 (2018) 273–283.
- [40] E. S. Fisher, C. J. Renken, Single-crystal elastic moduli and the hcp to bcc transformation in Ti, Zr, and Hf, Physical Review 135 (2A).
- [41] M. J. Blackburn, J. C. Williams, Strength, deformation modes and fracture in titanium-aluminum alloys, ASM Transactions Quarterly 62 (1969) 398–409.
- [42] L. J. Swartzendruber, L. H. Bennett, L. K. Ives, R. D. Shull, The TiAl phase diagram: the -2 phase boundary, Materials Science and Engineering 51 (1). doi:10.1016/0025-5416(81)90115-4.
- [43] T. K. G. Namboodhiri, C. J. Mcmahon, H. Herman, Decomposition of the a-Phase in Titanium-Rich Ti-AI Alloys, Metallurgical Transactions 4 (1973) 1323–1331.
- [44] T. K. Namboodhiri, On the TiAl phase diagram, Materials Science and Engineering 57 (1) (1983) 21–22.